

Abstract
Background:
The epidemiology of pediatric surgery in the United States and whether disparities in access to surgical care exist on a national level remain inadequately described.
Aims:
We determined rates of surgical intervention and associations with sociodemographic factors among children 0–17 years of age in the United States.
Methods:
Analysis of the 2005–2018 National Health Interview Survey samples included 155,064 children. Parents reported on whether their child had a surgery or surgical procedure either as an inpatient or outpatient over the past 12 months. Multivariate logistic regression models, adjusted for age, sex, race and ethnicity, income, language, parent education, region, having a usual source of care, and comorbid conditions, examined odds ratios for sociodemographic factors associated with surgery, analyzing the most recent data (2016–2018; 25 544 children).
Results:
In the most recent data, 4.7% of children had surgical intervention each year, with an average of 3.9 million surgeries performed annually. Rates of surgery were stable between 2005 and 2018. Minority children had lower adjusted odds (aOR) of surgical intervention as compared to white, non-Hispanic children (aOR = 0.6, 95%CI = 0.5–0.8 for black children, and aOR = 0.7, 95%CI = 0.5–0.9 for Hispanic children). Other sociodemographic factors associated with a lower adjusted odd of surgical intervention included uninsured status (aOR = 0.5; 95%CI = 0.3–0.9), and primary language other than English (aOR = 0.5; 95%CI 0.3–0.9). Income was not associated with surgical intervention.
Conclusions:
On average, 3.9 million surgeries are performed on children 0–17 years of age in the United States each year. Significant disparities exist in surgical care for children, with black and Hispanic children having lower rates of surgery over and above contribution of other disparity domains. These findings in a nationally representative sample highlight the need for national policies to eliminate disparity of care received by minority children.
Keywords: disparity, NHIS, prevalence, rate, minority
1 |. INTRODUCTION
Healthcare disparities refer to gaps in health care between groups based on sociodemographic factors and represent a major public health concern in the United States. Racial disparities have been documented across numerous health outcomes. Sociodemographic differences in access to optimal care are found in many pediatric surgical conditions, such as appendicitis,1–3 pediatric kidney transplant,4 congenital heart surgery,5 and craniosynostosis repair,6 with minority children often demonstrating poorer outcomes.7 However, whether disparities in access to surgical care exist on a national level has not been described in a large nationally representative sample over time.
Furthermore, the number of children receiving surgical intervention in the United States each year is not well defined. Data from the Kids’ Inpatient Database (KID) estimated that 450,000 annual hospital admissions for inpatient surgical intervention occurred in children 0–17 years in the years 2003, 2006, and 2009.8 Data from the National Survey of Ambulatory Surgery estimated that 2.3 million surgical outpatient procedures were performed on children below 15 years of age in ambulatory surgery centers in the United States in 2006.9 However, no study has reported on the total number of children who undergo surgery from a single dataset; nor have nationally representative or recent data been queried.
These gaps in knowledge related to the number of children receiving surgical intervention each year and sociodemographic factors associated with surgical intervention are important and should be addressed. Indeed, a better understanding of pediatric surgery epidemiology could lead to policies aimed at ensuring equitable surgical care for all populations. To address these gaps, we used data from the National Health Interview Survey (NHIS) of the National Center for Health Statistics. NHIS is the principal source of information on the health and healthcare utilization of children in the United States.10 Unlike hospital discharge databases, NHIS is nationally representative and designed to accurately collect sociodemographic data to provide context for survey data and to explain trends in healthcare data. One prior study used NHIS to examine rates of surgery in children under 3 years of age, but did not examine sociodemographic differences in receipt of surgery.11
Therefore, the primary aim of this study was to use data from NHIS to estimate the total number of surgical interventions performed on children 0–17 years of age each year, the total number and rate of children receiving these surgeries, and to assess trends in surgical intervention rates over time. A second, equally important aim, was to determine whether sociodemographic factors (race/ethnicity, income, parental education, insurance status, and primary language) are associated with receipt of surgical intervention. Historically, minority and low socioeconomic persons have experienced greater healthcare disparities in the United States.12 The United States has a much larger minority population as compared to other industrialized countries: in the US, 63% self-identify as White, while in Germany, France, the United Kingdom, and Australia >88% of the population self-identify as White. Furthermore, the United States, in contrast to all other industrialized countries, does not offer universal health care. We therefore hypothesized finding lower rates of surgical intervention among minority children (as compared to white, non-Hispanic children) and among children with lower family income, lower parent education level, and uninsured children.
2 |. MATERIALS AND METHODS
2.1 |. Participants
This study analyzed data from the 2005–2018NHIS.10 NHIS is an annually conducted cross-sectional survey of households in the United States. The primary purpose of NHIS is to provide national estimates of the health status and healthcare utilization of the US civilian population. Participating households are selected via a multistage process to represent the entire civilian, noninstitutionalized population of the United States. Surveys are conducted in person by Census Bureau interviewers. The response rate is approximately 70% each year, and NHIS interviewers obtain consent from all participants. For each participating household, one child (aged 17 or younger) and one adult (18 or older) are randomly selected for additional, more extensive questionnaires collecting information on the presence or absence of health conditions and healthcare utilization. Surveys about the child are conducted with the parent or guardian. To determine current rate of surgery intervention, and to examine sociodemographic variables associated with surgical intervention, we pooled data from the 3 most recent available years of NHIS, 2016, 2017, and 2018. We chose to include 3 years of recent data to achieve sufficient sample size and to account for fluctuations between years. The total sample for years 2016–2018 included 25,544 children for analysis. To examine prevalence rates of surgical intervention over time, we examined 2005–2018 NHIS samples. The total sample size for 2005–2018 was 155,064 children. NHIS data are de-identified, available for public analysis, and permission to access data is not required; therefore, the Institutional Review Board at our institution has deemed all NHIS analysis exempt from review.
2.2 |. Measures
2.2.1 |. Surgical intervention
Our main outcome of interest was surgical intervention. Children who underwent surgical interventions over the past 12 months were identified, by the following question to parents: “During the past 12 months, has your child had surgery or surgical procedures either as an inpatient or an outpatient?” Parents were also asked about the number of surgical procedures their child had over the past 12 months. We excluded children whose parents reported “don’t know” or “refused to answer” (n = 161, 0.6%).
2.2.2 |. Sociodemographic variables
Sociodemographic information captured included age group (preschool, 0–5 years; preadolescence, 6–11 years; and adolescence, 12–17 years), sex (male/female), race and ethnicity (white non-Hispanic, black non-Hispanic, Hispanic, and Other, which included American Indian/Native Alaskan, Asian, and multiracial groups),insurance status (uninsured, some private, public only), family income (<$34 999, $35 000-$74 999, $75 000-$99 999, $100 000 and over), primary language spoken at home (English versus other language), parent educational status (bachelor’s or higher, some college, high school or less), United States census region (Northeast, Midwest, South, West), and whether children had a usual source of health care (yes versus no).
2.2.3 |. Comorbid conditions
NHIS gathers data on several priority chronic child health conditions including asthma, attention deficit and hyperactivity disorder (ADHD), allergies, arthritis, cerebral palsy, congenital heart disease, cystic fibrosis, Down syndrome, diabetes mellitus, colitis, other heart conditions, and seizures. We decided a priori to control for comorbid conditions by assigning participants to one of three categories representing number of comorbidities (0, 1, and ≥2 comorbid conditions).
2.3 |. Statistical analyses
Analyses were conducted with Stata version 14.2 (StataCorp), and α level was set at 0.05. We adjusted for the complex survey design of NHIS using sampling weights, stratification, and clustering to provide nationally representative estimates. Descriptive statistics were used to describe characteristics of the sample, with data presented as prevalence with corresponding 95% confidence intervals.
To address our primary aim, we first limited analysis to pooled data of the 3 most recent years of NHIS data: 2016, 2017, and 2018 in order to describe the estimated prevalence rate of surgery in the entire childhood population. We then used the entire sample (2005–2018 NHIS) to estimate trends in surgery rates between 2005 and 2018.
To address our second aim, we again limited our analysis to the 2016, 2017, and 2018 pooled dataset in order to provide contemporary data. We first determined rates of surgical intervention according to each sociodemographic characteristic of participants in our sample. We then used multivariate logistic regression models to present adjusted odds ratios (aOR) along with 95% confidence intervals of the association of each characteristic with surgical intervention. In our multivariate analysis, we adjusted for all available variables, including age, sex, race/ethnicity, insurance status, income, primary language, parent education, region, usual source of care, and comorbid conditions.
3 |. RESULTS
3.1 |. Rate of surgical intervention
Table 1 present sociodemographic characteristics of the 25,544 children 0–17 years of age (Mage = 8.5 years, 49.1% female, 52% white) participating in the 2016–2018 NHIS. In this sample, 4.7% (95% confidence interval (CI): 4.4%–5.1%) of children had a surgical intervention over the past 12 months. Extrapolated to the national level, 3.1 million (95% CI: 2.9–3.4 million) children (out of 73 million) underwent a surgical intervention in the United States each year. However, 10.5% (95% CI: 8.6%–12.9%) of children underwent more than 1 surgical intervention over the past 12 months. Therefore, in total, 3.9 million (95% CI: 3.3–4.6) surgical interventions were performed on children 0–17 years of age in the United States each year. The rate of surgical intervention was relatively stable between 2005 and 2018, ranging from 5% (2005) to 4.6% (2018).
TABLE 1.
Sociodemographics of children 0–17 years of age in the United States
| Characteristic | Number of participants n = 25,544 | Weighted % (95% CI) | |
|---|---|---|---|
| Surgical intervention | |||
| Yes | 1309 | 4.7 | (4.4–5.1) |
| No | 24 235 | 95.3 | (94.9–95.6) |
| Age category | |||
| 0–5 y | 8285 | 32.7 | (31.9–33.4) |
| 6–11 y | 8047 | 34 | (33.2–34.8) |
| 12–17 y | 9212 | 33.3 | (32.6–34.1) |
| Sex | |||
| Male | 13 274 | 50.9 | (50.2–51.7) |
| Female | 12 270 | 49.1 | (48.3–49.8) |
| Race/Ethnicity | |||
| White | 14 197 | 52 | (50.3–53.7) |
| Black | 2884 | 13.1 | (12.1–14.1) |
| Hispanic | 5560 | 24.9 | (23.2–26.6) |
| Other | 2903 | 10.1 | (9.4–10.9) |
| Insurance status | |||
| Private | 14 603 | 55.1 | (53.8–56.5) |
| Public | 9725 | 40 | (38.7–41.3) |
| Uninsured | 1216 | 4.8 | (4.4–5.3) |
| Income | |||
| $0–$34 999 | 6424 | 25.8 | (24.8–26.9) |
| $35 000–$74 999 | 7145 | 28 | (27.1–28.9) |
| $75 000 – $99 999 | 3233 | 11.9 | (11.4–12.5) |
| $100 000 and over | 8742 | 34.2 | (32.8–35.6) |
| Primary language | |||
| Other | 23 779 | 91.5 | (90.4–92.4) |
| English | 1765 | 8.5 | (7.6–9.6) |
| Parental education | |||
| Bachelor’s or higher | 11 444 | 44.4 | (42.9–45.8) |
| Some college | 8196 | 31.1 | (30.1–32.1) |
| High School or less | 5904 | 24.5 | (23.5–25.6) |
| Region | |||
| Northeast | 4011 | 16.7 | (15.2–18.4) |
| Midwest | 5526 | 21.6 | (20.1–23.0) |
| South | 9422 | 37.5 | (35.2–39.8) |
| West | 6585 | 24.3 | (22.2–26.5) |
| Has a usual place for health care | |||
| No | 1014 | 4 | (3.7–4.4) |
| Yes | 24 530 | 96 | (95.6–96.3) |
| Number of comorbid health conditions | |||
| 0 | 16 978 | 68.1 | (67.3–68.9) |
| 1 | 6465 | 24.1 | (23.4–24.8) |
| 2+ | 2101 | 7.8 | (7.4–8.2) |
Source: 2016–2018 National Health Interview Surveys.
3.2 |. Sociodemographic characteristics associated with surgical intervention
Estimated prevalence rates of surgical intervention during 2016–2018 according to sociodemographic status are presented in Table 2. We found that minority children had lower rates of surgery (black children: 3.8%, Hispanic children: 3.3%, and other children: 4.3%) as compared to white, non-Hispanic children (5.8%). Adjusted multivariate logistic regression models similarly showed that minority children had lower odds of surgical intervention as compared to white, non-Hispanic children (aOR for black children compared to white children: 0.6; 95% CI: 0.5–0.8, aOR for Hispanic children compared to white children: 0.7; 95% CI: 0.5–0.9). Differences in rates of surgical intervention according to race and ethnicity over time from 2005 to 2018 are presented in Figure 1. White children had higher rates of surgical intervention as compared to black children and Hispanic children every year between 2005 and 2018 (P < .05 for all years).
TABLE 2.
Multivariate logistic regression analysis examining associations between sociodemographic characteristics and surgical intervention among children 0–17 years of age in the United States
| Characteristic | Number of participants, n = 25,544 | Rate of surgical intervention, % (95% CI) | aORa (95% CI) | P | ||
|---|---|---|---|---|---|---|
| Age Category | ||||||
| 0–5 y | 8285 | 6 | (5.4–6.7) | 1.0 | ||
| 6–11 y | 8047 | 4 | (3.5–4.5) | 0.6 | (0.5–0.7) | <.0001 |
| 12–17 y | 9212 | 4.3 | (3.8–4.9) | 0.6 | (0.5–0.7) | <.0001 |
| Sex | ||||||
| Male | 13 274 | 5.6 | (5.1–6.2) | 1.0 | ||
| Female | 12 270 | 3.8 | (3.4–4.3) | 0.7 | (0.6–0.8) | <.0001 |
| Race/Ethnicity | ||||||
| White | 14 197 | 5.8 | (5.3–6.3) | 1.0 | ||
| Black | 2884 | 3.8 | (3.0–4.8) | 0.6 | (0.5–0.8) | <.0001 |
| Hispanic | 5560 | 3.3 | (2.7–3.9) | 0.7 | (0.5–0.9) | .003 |
| Other | 2903 | 4.3 | (3.5–5.4) | 0.7 | (0.6–0.9) | .003 |
| Insurance status | ||||||
| Private | 14 603 | 5 | (4.5–5.5) | 1.0 | ||
| Public | 9725 | 4.8 | (4.2–5.3) | 1.2 | (1.0–1.4) | .1 |
| Uninsured | 1216 | 1.9 | (1.1–3.0) | 0.5 | (0.3–0.9) | .023 |
| Income | ||||||
| $0 – $34 999 | 6424 | 4.5 | (3.8–5.2) | 1.0 | ||
| $35 000 – $74 999 | 7145 | 4.3 | (3.7–5.0) | 0.9 | (0.7–1.2) | .52 |
| $75 000 – $99 999 | 3233 | 4.4 | (3.6–5.3) | 0.9 | (0.7–1.2) | .36 |
| $100 000 and over | 8742 | 5.4 | (4.8–6.0) | 1.1 | (0.9–1.4) | .4 |
| Primary language | ||||||
| English | 23 779 | 5 | (4.6–5.4) | 1.0 | ||
| Other | 1765 | 1.9 | (1.3–2.7) | 0.5 | (0.3–0.8) | .002 |
| Parental education | ||||||
| Bachelor’s or higher | 11 444 | 5.1 | (4.6–5.7) | 1.0 | ||
| Some college | 8196 | 4.9 | (4.3–5.5) | 1.0 | (0.9–1.3) | .68 |
| High School or less | 5904 | 3.9 | (3.4–4.6) | 1.0 | (0.8–1.3) | .897 |
| Region | ||||||
| Northeast | 4011 | 4.4 | (3.6–5.5) | 1.0 | ||
| Midwest | 5526 | 5.6 | (4.9–6.4) | 1.2 | (0.9–1.6) | .098 |
| South | 9422 | 4.5 | (4.0–5.1) | 1.1 | (0.9–1.5) | .340 |
| West | 6585 | 4.5 | (3.8–5.3) | 1.1 | (0.9–1.5) | .334 |
| Has a usual place for health care | ||||||
| No | 1014 | 2 | (1.2–3.5) | 1.0 | ||
| Yes | 24 530 | 4.9 | (4.5–5.2) | 1.7 | (1.0–3.0) | .047 |
| Number of comorbid health conditions | ||||||
| 0 | 16 978 | 4.0 | (3.6–4.4) | 1.0 | ||
| 1 | 6465 | 5.7 | (5.0–6.4) | 1.4 | (1.2–1.7) | <.0001 |
| 2+ | 2101 | 8.1 | (6.8–9.6) | 2.0 | (1.6–2.4) | <.0001 |
Source: 2016–2018 National Health Interview Surveys.
aOR: adjusted odds ratio, adjusted for age, sex, race/ethnicity, insurance status, income, primary language, parent education, region, usual source of care, and comorbid conditions.
FIGURE 1.
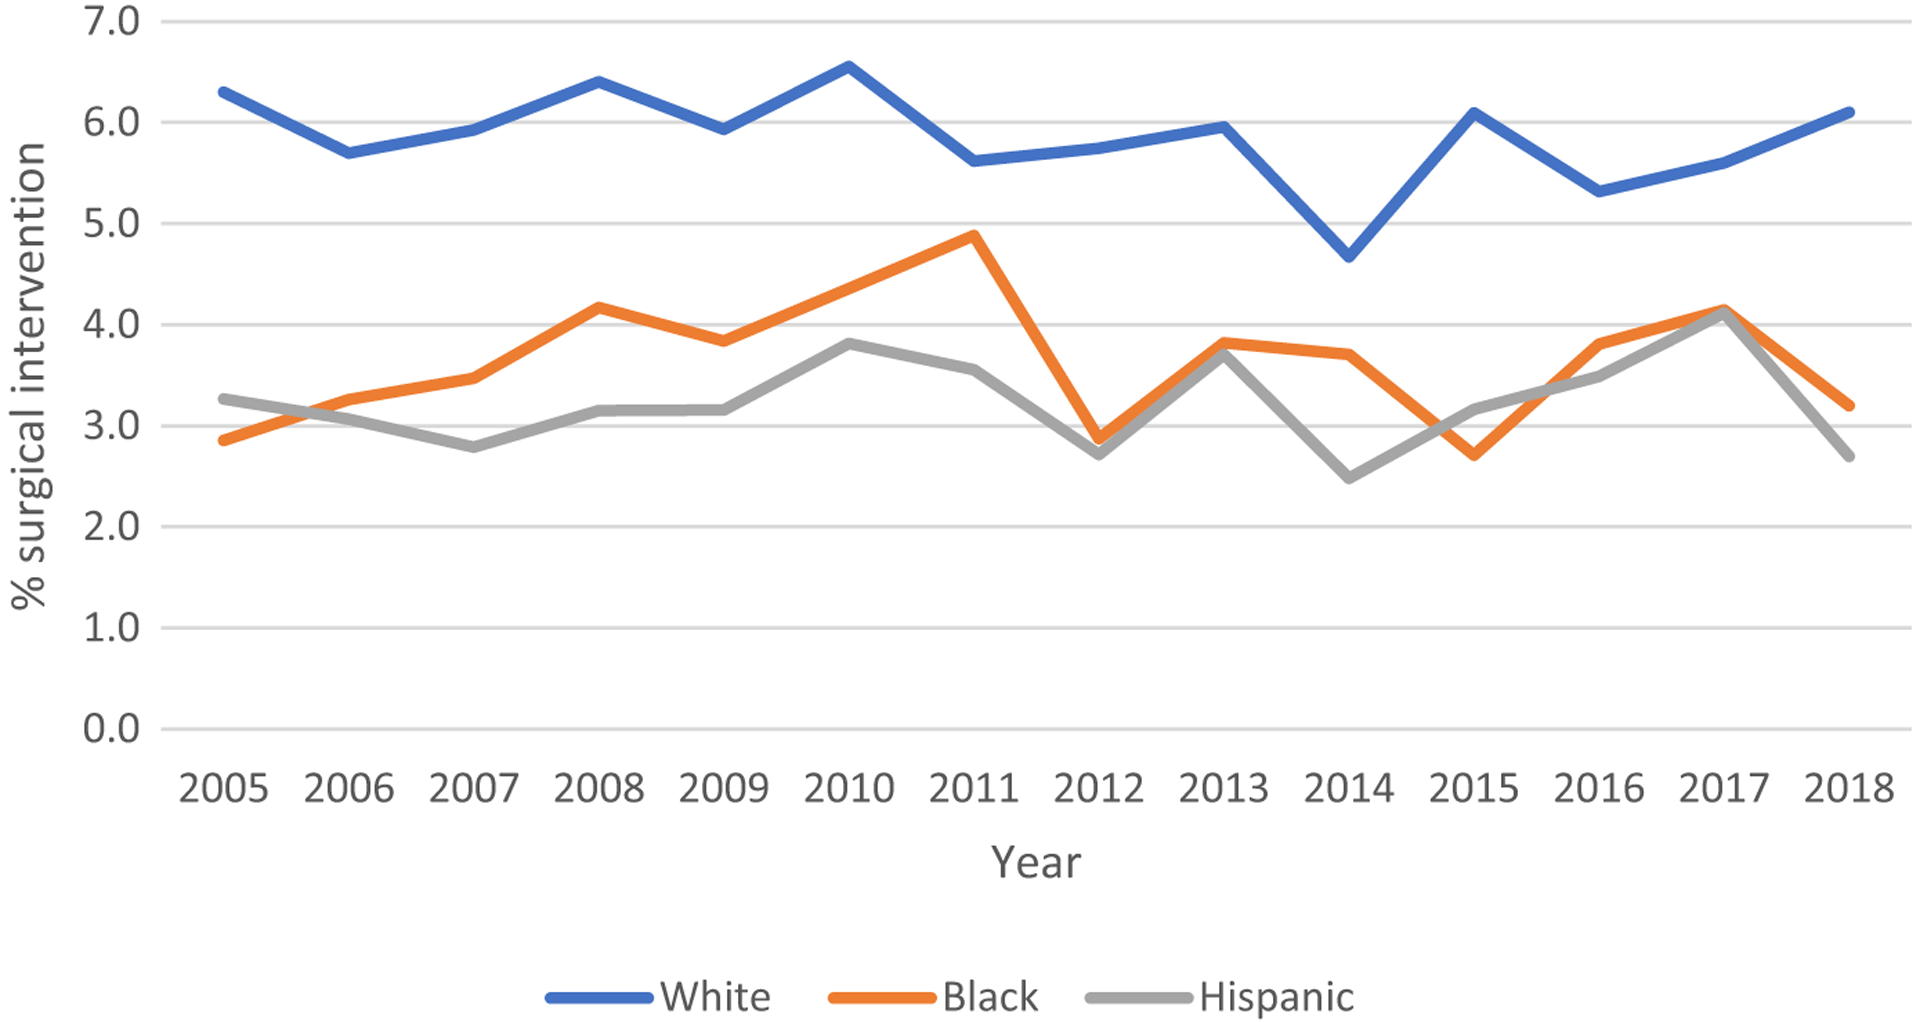
Rate of surgery intervention among children 0–17 years of age in the United States stratified by race and ethnicity. Source of data: 2005–2018 National Health Interview Surveys
Socioeconomic factors, associated with lower surgical intervention in multivariate analysis, included being uninsured (aOR: 0.5, 95% CI: 0.3–0.9 as compared to having private insurance) and speaking a language other than English at home (aOR: 0.5, 95% CI: 0.3–0.8 as compared to English speaking). Parental education level was not associated with surgical intervention (aOR’s = 1.0). In terms of other demographic factors, children 0–5 years of age had greater odds of surgical intervention (aORs: 0.6, 95% CIs: 0.5–0.7 for 6–11 years and 12–17 years as compared to children 0–5 years), while females had lower odds of surgical intervention (aOR:0.7, 95% CI: 0.6–0.8) as compared to males. Children with a usual source of health care (such as a primary care physician; aOR: 1.7, 95% CI 1.0–3.0 compared to none) and increased number of comorbidities (aOR 1.4, 95% CI 1.2–1.7 for 1 comorbidity, and aOR 2.0, 95% CI 1.6–2.4 for 2 or more comorbidities) also had greater odds of surgical intervention.
4 |. DISCUSSION
This study examining nationally representative data to estimate the rate of pediatric surgery in the United States detected a stable rate of surgery over the past 14 years. In the most recent data, 4.7% of children underwent at least one surgical procedure, with an estimated 3.9 million annual surgeries performed in children in the United States. Remarkable differences in rate of surgery were identified by racial and ethnic factors and have persisted over the past decade. Children of minority racial and ethnic backgrounds had 30%–40% lower adjusted odds of receiving a surgical procedure, even after controlling for other socioeconomic indicators, including income, education, and insurance status. The use of a large, nationally representative database with a nonsurgical control group lends strength to the current findings.
Despite the importance of understanding national utilization of surgery services, representative data on surgery rates in larger samples of children are limited, and there is remarkably little known about patterns of utilization over time. In our own prior study, we used the National Survey of Ambulatory Surgery (2006), and estimated 2.3 million ambulatory (outpatient) surgeries were performed annually in children under 15 years in the United States.9 Prior studies examining the rate of inpatient pediatric surgery in the United States from hospital discharge data have yielded widely discrepant estimates. Tzong et al queried the KID database of the Healthcare Cost and Utilization Project, and estimated 450,000 annual inpatient pediatric surgeries through extrapolation of the rate of diagnoses deemed to be surgical, to the US population.8 Using the same database, Somme et al estimated 216,081 pediatric inpatient surgeries in the same year (2009) but only included diagnoses anticipated to be related to procedures for pediatric surgeons in general practice.13 Hospital discharge databases such as the KID database employ random sampling of discharges only within participating hospitals and are not representative of the diverse US population. These databases are not intended to study access to care and therefore do not include nonsurgical controls. Further, many states do not report race to national databases; thus, race-related data are systematically missing.14 Tzong et al reported that race was only collected in 15% of the KID database cohort.8 The National Health Interview Survey is nationally representative and employs robust methodology to oversample underrepresented populations, yielding sample demographics almost identical to United States Census estimates.15 NHIS has been used in one prior study focused on infants and young children, which estimated a surgery rate of 6.9% in children under 3 years of age.11 We utilized the NHIS to address the gap in data regarding national rates and sociodemographic patterns in utilization of pediatric surgery in children of all ages.
This study identified marked disparities in the rate of surgery by racial and ethnic characteristics, with minority children having lower adjusted odds ratio of undergoing surgery as compared to white children. While these data cannot differentiate whether disparities occurred in critical vs. noncritical surgeries or whether these disparities yielded poorer outcomes, prior studies demonstrate disparities in rates as well as outcomes of a range of critical surgery procedures, from emergent procedures such as appendectomy to specialized procedures such as craniosynostosis repair, spinal fusion, and neuro-oncologic surgeries.1–3,6,16,17 De Jager et al developed a conceptual model of disparities in surgical access, highlighting four levels of access barriers: provider access, detection of a surgical indication, progression to surgery, and receipt of optimal care.18 While the majority of research has been conducted in adults, studies detecting disparities in pediatric surgical conditions were identified at each of these levels. For example, disparity in surgical indication detection has been shown in several studies demonstrating later stage of diagnosis of pediatric cancers requiring surgical treatment (eg, sarcoma, thyroid cancer, melanoma, CNS tumor) in youth of minority racial and ethnic backgrounds.18 Racial and ethnic disparities in progression to surgery have been demonstrated by a longer time between presentation with abdominal pain and receipt of an appendectomy as well as a higher appendiceal rupture rate in black as compared to white children.1,2,19 In a study which included both adults and children with idiopathic scoliosis, minority patients had lower rate of surgical treatment and experienced more than double the rate of unfavorable surgical outcomes, indicating disparity at multiple levels including both receipt of surgery and of optimal care.17 Among those who access surgical care, delay in access as well as subsequent receipt of unequal care may contribute to the higher morbidity and mortality experienced by minority children.7
Potential contributing barriers to healthcare access in minority groups include factors at the patient level, such as income, insurance, language, and education, and factors at the healthcare provider and system levels, due to implicit bias toward minority groups within healthcare systems.12,14,18 A review conducted by Haider et al examining the mechanisms underlying racial disparities in surgical care concluded that provider and systems level factors contribute to surgical disparities, while patient level factors need further study.14 Our findings of disparities by racial and ethnic background, while controlling for insurance, income, language, and education factors, as well as individual health status, suggest that disparities at the provider and system levels contribute to this observed gap in the pediatric population. Further, our large observed differences according to racial background likely represent the cumulative effect of disparities at multiple levels of access, including provider access, detection, and progression to surgery. Future research will be important to understand the impact of these differences in intervention rate on patient outcomes. If linked to poorer outcomes, a single solution will not be sufficient, but rather intervention at multiple levels will be critical to narrow and eliminate these disparities.20
Our findings of large disparity in rate of surgery in children of uninsured families are consistent with prior smaller studies examining common pediatric surgical conditions. For example, in the elective surgery setting, children presenting with sleep-disordered breathing without private insurance experienced significant delay in receiving polysomnography, the gold standard for diagnosis, as well as in subsequent progression to surgery as compared to children with private insurance.21 In the context of emergency surgery, children presenting to an emergency room with abdominal pain who lack private insurance had a higher rate of developing perforated appendicitis.2 We also found that children from households with a primary language other than English experience disparity in surgery care. Access barriers related to language, insurance status, and lack of a usual source of health care can add to the disparity faced by minority children22; thus, the adjusted odds ratio for Hispanic children which was higher relative to unadjusted rates may underestimate the true extent of the disparity experienced by this population.18 Although prior studies found differences by income, when adjusting for other salient socioeconomic factors related to healthcare access, such as insurance status and language, income was not an independent predictor of the rate of pediatric surgery.
We acknowledge several limitations. A limitation related to cross-sectional surveys is that findings are based on correlational data and cannot indicate cause and effect. Thus, the causal relationship between race and ethnicity and surgery cannot be established. Due to social desirability bias, parents may under- or over-report rates of surgical intervention; however, this risk should be minimal as parents are told that their answers would be de-identified. Reliance on parent report may also be subject to recall bias. This study was limited to variables available in the National Health Interview Survey data, and therefore, type and setting of surgery could not be identified to stratify findings. Future research is needed to understand whether disparities are prominent only in certain surgical diagnoses/categories or settings (emergency room, inpatient, outpatient).While nationally representative surveys are the best source of data to examine pervasive disparities, further questions may need to be added in these surveys to facilitate a more granular understanding of the trends observed in this investigation.
5 |. CONCLUSION
Approximately 3.9 million surgeries are performed in children in the United States each year, with 4.7% of children undergoing a surgical procedure. Significant disparities exist in access to surgical care, with black and Hispanic children having markedly lower rates of surgery, even when accounting for other disparity domains such as insurance status, language, and usual source of health care. These findings in a nationally representative sample highlight the critical need for further research to understand patterns and impact of racial disparity, and indicate an urgent need for policies on a national level to address inequality in access to surgical care in children from minority racial and ethnic backgrounds in the United States.
What is already known
Healthcare disparities exist in pediatric surgical care for specific surgical indications in the United States. However, the rate of surgery in the US and whether disparities exist on a national level are unknown.
What this article adds
On average, 3.9 million surgical procedures are performed on children in the United States each year, with 4.8% of children undergoing surgery. Minorities (black, Hispanic, other racial groups) have greatly reduced likelihood of surgical intervention as compared to white children.
Funding information
Supported by the Eunice Kennedy Shriver National Institute of Child Health and Human Development (K23HD078239 to JAR), and the National Heart, Lung, and Blood Institute (K23HL138155 to CBG). This information or content and conclusions are those of the author and should not be construed as the official position or policy of, nor should any endorsements be inferred by the NIH.
DISCLOSURES
This study examined de-identified and publically available NHIS data and was thus exempt from IRB review. The authors acknowledge their funding from the Eunice Kennedy Shriver National Institute of Child Health and Human Development(Award No. K23HD078239, PI Rabbitts), and the National Heart, Lung, and Blood Institute(Award No. K23HL138155; PI Groenewald). The authors have no conflicts of interest.
Footnotes
CONFLIC T OF INTEREST
The authors have no conflicts of interest to disclose.
REFERENCES
- 1.Kelley-Quon LI, Tseng CH, Jen HC, Lee SL, Shew SB. Hospital type as a metric for racial disparities in pediatric appendicitis. J Am Coll Surg. 2013;216:74–82. [DOI] [PubMed] [Google Scholar]
- 2.Ladd MR, Pajewski NM, Becher RD, et al. Delays in treatment of pediatric appendicitis: a more accurate variable for measuring pediatric healthcare inequalities? Am Surg. 2013;79:875–881. [PubMed] [Google Scholar]
- 3.Lee SL, Shekherdimian S, Chiu VY, Sydorak RM. Perforated appendicitis in children: equal access to care eliminates racial and socioeconomic disparities. J Pediatr Surg. 2010;45:1203–1207. [DOI] [PubMed] [Google Scholar]
- 4.Patzer RE, Sayed BA, Kutner N, McClellan WM, Amaral S. Racial and ethnic differences in pediatric access to preemptive kidney transplantation in the United States. Am J Transplant. 2013;13:1769–1781. [DOI] [PMC free article] [PubMed] [Google Scholar]
- 5.Oster ME, Strickland MJ, Mahle WT. Racial and ethnic disparities in post-operative mortality following congenital heart surgery. J Pediatr. 2011;159:222–226. [DOI] [PubMed] [Google Scholar]
- 6.Lin YM, Pan IW, Harris DA, Luerssen TG, Lam S. The Impact of Insurance, Race, and Ethnicity on Age at Surgical Intervention among Children with Nonsyndromic Craniosynostosis. J Pediatr. 2015;166:1289–1296. [DOI] [PubMed] [Google Scholar]
- 7.Stone ML, Lapar DJ, Kane BJ, Rasmussen SK, McGahren ED, Rodgers BM. The effect of race and gender on pediatric surgical outcomes within the United States. J Pediatr Surg. 2013;48:1650–1656. [DOI] [PMC free article] [PubMed] [Google Scholar]
- 8.Tzong KY, Han S, Roh A, Ing C. Epidemiology of pediatric surgical admissions in US children: data from the HCUP kids inpatient database. J Neurosurg Anesthesiol. 2012;24:391–395. [DOI] [PubMed] [Google Scholar]
- 9.Rabbitts JA, Groenewald CB, Moriarty JP, Flick R. Epidemiology of ambulatory anesthesia for children in the United States: 2006 and 1996. Anesth Analg. 2010;111:1011–1015. [DOI] [PubMed] [Google Scholar]
- 10.CDC/National Center for Health Statistics. National Health Interview Survey. 2019. [Google Scholar]
- 11.Sanford EL, Sanford NN, Alder A, Szmuk P. Trends in Surgery for Children Younger Than 3 Years From 1998 to 2017. JAMA Pediatr. 2019;173(12):1199. [DOI] [PMC free article] [PubMed] [Google Scholar]
- 12.Unequal Treatment: Confronting Racial and Ethnic Disparities in Health Care. Edited by Smedley BD, Stith AY, Nelson AR. Washington, DC; 2003. [PubMed] [Google Scholar]
- 13.Somme S, Bronsert M, Morrato E, Ziegler M. Frequency and variety of inpatient pediatric surgical procedures in the United States. Pediatrics. 2013;132(6):e1466–e1472. [DOI] [PubMed] [Google Scholar]
- 14.Haider AH, Scott VK, Rehman KA, et al. Racial disparities in surgical care and outcomes in the United States: a comprehensive review of patient, provider, and systemic factors. J Am Coll Surg. 2013;216(3):482–492.e12. [DOI] [PMC free article] [PubMed] [Google Scholar]
- 15.Childstats.gov. Race and Hispanic origin composition: Percentage of U.S. children ages 0–17 by race and Hispanic origin, 1980–2018, and projected 2019–2050. 2020. [Google Scholar]
- 16.Mukherjee D, Kosztowski T, Zaidi HA, et al. Disparities in access to pediatric neurooncological surgery in the United States. Pediatrics. 2009;124(4):e688–e696. [DOI] [PubMed] [Google Scholar]
- 17.Nuno M, Drazin DG, Acosta FL Jr. Differences in treatments and outcomes for idiopathic scoliosis patients treated in the United States from 1998 to 2007: impact of socioeconomic variables and ethnicity. Spine J. 2013;13:116–123. [DOI] [PubMed] [Google Scholar]
- 18.de Jager E, Levine AA, Udyavar NR, et al. Disparities in surgical access: a systematic literature review, conceptual model, and evidence map. J Am Coll Surg. 2019;228:276–298. [DOI] [PMC free article] [PubMed] [Google Scholar]
- 19.Wang L, Haberland C, Thurm C, Bhattacharya J, Park KT. Health Outcomes in US Children with Abdominal Pain at Major Emergency Departments Associated with Race and Socioeconomic Status. PLoS One. 2015;10(8):e0132758. [DOI] [PMC free article] [PubMed] [Google Scholar]
- 20.Centers for Disease Control and Prevention: CDC Health Disparities and Inequalities Report — United States, 2013. Morbidity and Mortality Weekly Report; Supplement / Vol. 62 / No. 3. [PubMed] [Google Scholar]
- 21.Boss EF, Smith DF, Ishman SL. Racial/ethnic and socioeconomic disparities in the diagnosis and treatment of sleep-disordered breathing in children. Int J Pediatr Otorhinolaryngol. 2011;75:299–307. [DOI] [PubMed] [Google Scholar]
- 22.Flores G, Abreu M, Olivar MA, Kastner B. Access barriers to health care for Latino children. Arch Pediatr Adolesc Med. 1998;152:1119–1125. [DOI] [PubMed] [Google Scholar]