Abstract
The specification of cartilage requires Sox9, a transcription factor with broad roles for organogenesis outside the skeletal system. How Sox9 and other factors gain access to cartilage-specific cis-regulatory regions during skeletal development was unknown. By analyzing chromatin accessibility during the differentiation of neural crest cells into chondrocytes of the zebrafish head, we find that cartilage-associated chromatin accessibility is dynamically established. Cartilage-associated regions that become accessible after neural crest migration are co-enriched for Sox9 and Fox transcription factor binding motifs. In zebrafish lacking Foxc1 paralogs, we find a global decrease in chromatin accessibility in chondrocytes, consistent with a later loss of dorsal facial cartilages. Zebrafish transgenesis assays confirm that many of these Foxc1-dependent elements function as enhancers with region- and stage-specific activity in facial cartilages. These results show that Foxc1 promotes chondrogenesis in the face by establishing chromatin accessibility at a number of cartilage-associated gene enhancers.
Research organism: Zebrafish
eLife digest
Animals with backbones (or vertebrates) have body shape determined, in part, by their skeletons. These emerge in the embryo in the form of cartilage structures that will then get replaced by bone during development. The neural crest is a group of embryonic cells that can become different tissues. In the head, it forms the cartilage scaffold for some of the facial bones and the base of the skull.
During this process, a protein called Sox9 is required for neural crest cells to morph into cartilage. This transcription factor binds to regulatory sequences in the genome to turn cartilage genes on. But Sox9 is also required to form non-cartilage tissues in organs such as the liver, lung, and kidneys. How, then, does Sox9 only turn on the genes required for cartilage formation in the embryonic face? This specificity can be controlled by which regulatory sequences Sox9 can physically access in a cell: controlling which regulatory sequences Sox9 can access determines which genes it can activate, and which type of tissue a cell will become.
Xu, Yu et al. wanted to understand exactly how Sox9 switches on the genes that turn neural crest cells into facial cartilage. They studied the genomes of zebrafish embryos, which have a cartilaginous skeleton similar to other vertebrates, and found out which areas were accessible to transcription factors in the neural crest cells that became facial cartilage. Analyzing these regions suggested that sites where Sox9 could bind were often close to binding sites for another protein, called Foxc1. When zebrafish embryos were genetically modified to inactivate Foxc1 proteins, many of the regulatory sequences in cartilage failed to become accessible, and the cartilaginous skeleton did not form properly. These results support a model in which Foxc1 opens up the genomic regions that Sox9 needs to bind for cartilage to form, as opposed to the regions that Sox9 would bind to make different organ cell types.
The findings of Xu, Yu et al. uncover the stepwise process by which cartilage cells are made during development. Further research based on these results could allow scientists to develop new ways of replacing cartilage in degenerative conditions such as arthritis.
Introduction
Cartilage is the first skeletal type to be specified in the vertebrate body, providing important templates for later bone development and providing flexibility at joint surfaces and within the nose, ear, ribs, and larynx. The transcription factor Sox9 is essential for chondrogenic differentiation in all vertebrates examined (Bi et al., 1999; Lefebvre et al., 1997; Mori-Akiyama et al., 2003; Yan et al., 2005), yet it also has widespread roles outside the skeletal system, including the reproductive system, kidney, liver, and skin (Jo et al., 2014). How Sox9 is directed to a chondrogenic program in trunk mesoderm and cranial neural crest-derived cells (CNCCs) has remained unclear. Sox9 is known to directly bind to a number of cis-regulatory elements adjacent to chondrogenic genes, including Col2a1, Col10a1, and Acan (Askary et al., 2015; Dy et al., 2012; Lefebvre et al., 1997; Ohba et al., 2015). It is, however, dispensable for chromatin accessibility at these same elements (Liu et al., 2018), suggesting that other unknown factors may first open chromatin at chondrogenic enhancers for later activation by Sox9.
Forkhead-domain (Fox) family transcription factors are excellent candidates for establishing chromatin accessibility at chondrogenic enhancers. In the endoderm lineage, HNF3/FoxA binds closed chromatin at enhancers and makes these more accessible (Cirillo et al., 2002). Foxd3 has been similarly proposed to establish chromatin accessibility in the early neural crest lineage (Lukoseviciute et al., 2018). In mouse, loss of Foxc1 results in widespread cartilage and bone defects (Kume et al., 1998), including impaired tracheal and rib cartilages (Hong et al., 1999), loss of calvarial bone due to premature ossification (Rice et al., 2003; Sun et al., 2013; Vivatbutsiri et al., 2008), syngnathia (Inman et al., 2013), and disruption of endochondral bone maturation (Yoshida et al., 2015). In zebrafish, loss of both Foxc1 paralogs (foxc1a and foxc1b) results in severe reductions of dorsal cartilages of the upper face, which are preceded by reduced expression of several Sox9 targets, including col2a1a, acana, matn1, and matn4 (Xu et al., 2018). Chromatin immunoprecipitation followed by deep sequencing (ChIP-Seq) using a Sox9 antibody in dissected mouse rib and nose cartilage revealed enrichment of Fox binding motifs within Sox9-bound cis-regulatory sequences near chondrogenic genes (Ohba et al., 2015). Here, we use profiling of chromatin accessibility in wild-type and mutant zebrafish facial cartilages and find that Foxc1 paralogs are required for accessibility and activity of a number of cartilage enhancers. These findings support a model in which Foxc1 promotes chondrogenesis by establishing selective accessibility of cartilage enhancers in CNCC-derived mesenchyme.
Results and discussion
Chromatin accessibility landscape in chondrocytes of the zebrafish face
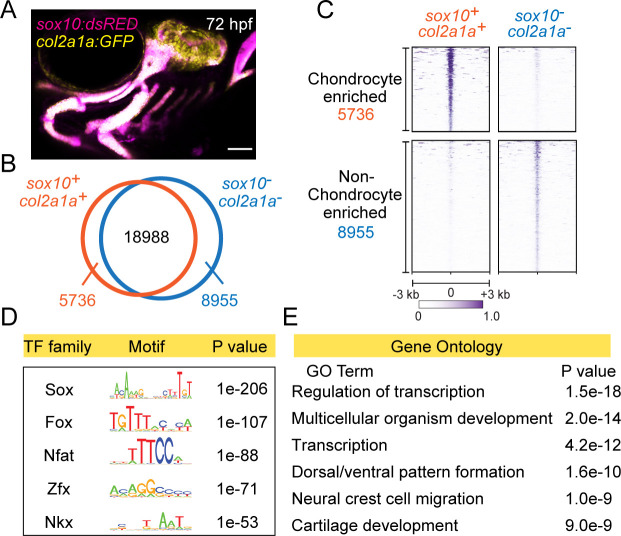
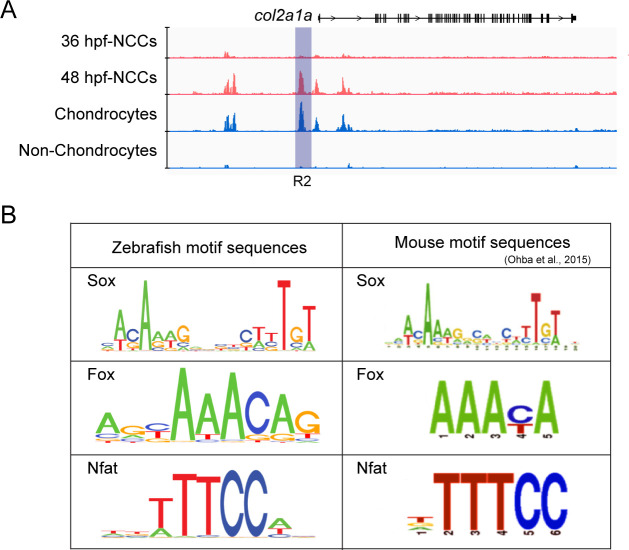
In order to identify potential cis-regulatory elements important for facial cartilage development, we performed a genome-wide analysis of chromatin accessibility in chondrocytes from 72 hr post-fertilization (hpf) zebrafish. We labeled chondrocytes by co-expression of sox10:Dsred and col2a1a:GFP transgenes (Figure 1A) and isolated double-positive and control double-negative cells by fluorescence-activated cell sorting (FACS). We then subjected these cells to a modified ‘micro’ version of the assay for transposase-accessible chromatin followed by next-generation sequencing (µATACseq). In order to focus on potential distal cis-regulatory elements, we excluded accessible regions within 1 kb upstream or 0.5 kb downstream of transcription start sites. This analysis yielded 33,679 distal accessible elements, with 5736 elements over-enriched in chondrocytes and 8955 elements under-enriched in chondrocytes (Figure 1B,C). As confirmation of sequence quality, the cartilage-specific R2 enhancer of the Collagen Type II alpha 1 a gene (col2a1a) is enriched in chondrocyte-specific elements (Figure 1—figure supplement 1A). De novo motif analysis of the top 2000 chondrocyte-enriched regions using HOMER recovered motifs for Sox, Fox, Nfat, Zfx, and Nkx transcription factor families (Figure 1D; Supplementary file 1A). Sox9 ChIP-Seq of mouse chondrocytes had previously revealed Nfat and Fox motifs as the second and third most co-enriched with Sox motifs (Ohba et al., 2015), and the Nkx motif might reflect the role of Nkx3.2 in cartilage differentiation (Provot et al., 2006). Consensus sequences for Sox, Fox, and Nfat motifs were highly similar between zebrafish and mouse (Figure 1—figure supplement 1B), despite our zebrafish analysis focusing on all accessible regions in facial chondrocytes and mouse analysis focusing on only Sox9-bound regions in rib chondrocytes. These striking motif similarities indicate strong conservation of the cartilage gene regulatory network between fish and mammals, and between the face and rib, and strongly suggest that many of the identified chondrocyte-specific accessible regions in zebrafish likely function as chondrocyte enhancers. In addition, Gene Ontology (GO) analysis of the nearest genes to the chondrocyte-enriched elements revealed cartilage development as one of the top six associated terms (Figure 1E). We also recovered terms for neural crest cell migration and dorsal/ventral pattern formation, likely reflecting retention of enhancer accessibility linked to the neural crest origins and later dorsoventral arch patterning of the precursors of facial cartilage.
Figure 1. Chromatin accessibility landscape of facial chondrocytes.
(A) Confocal image of facial cartilages expressing col2a1a:GFP and sox10:Dsred at 72 hpf. Lateral view with anterior to left. Scale bar = 100 μm. (B) Venn diagram indicating distal elements with open chromatin accessibility in col2a1a:GFP+; sox10:Dsred+ versus col2a1a:GFP−; sox10:Dsred− cells. (C) Peak intensity plots (heatmap) of μATACseq show differentially enriched open chromatin regions in double-positive versus double-negative cells. (D) The top five transcription factor (TF) motifs recovered from the top 2000 μATACseq peaks enriched in chondrocytes (after removing redundant motifs). (E) GO analysis of nearest neighbor genes of μATACseq peaks enriched in chondrocytes.
Figure 1—figure supplement 1. col2a1a enhancer and cartilage motif comparison between zebrafish and mouse.
Progressive establishment of cartilage-associated chromatin accessibility
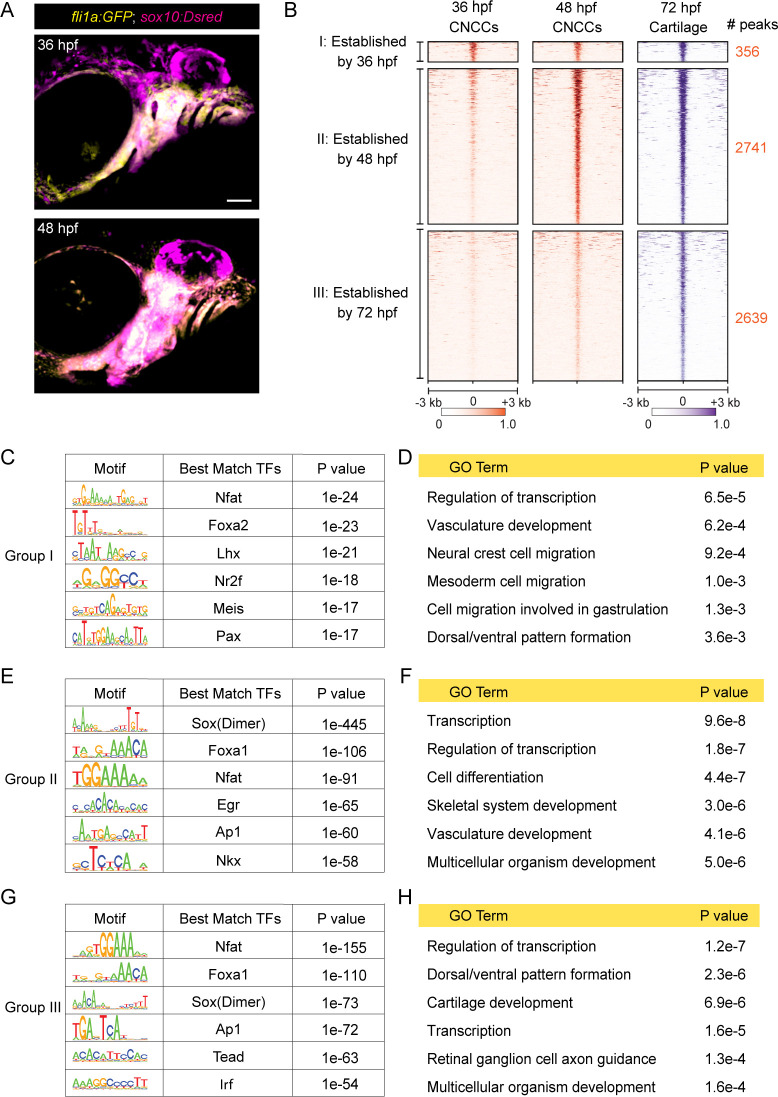
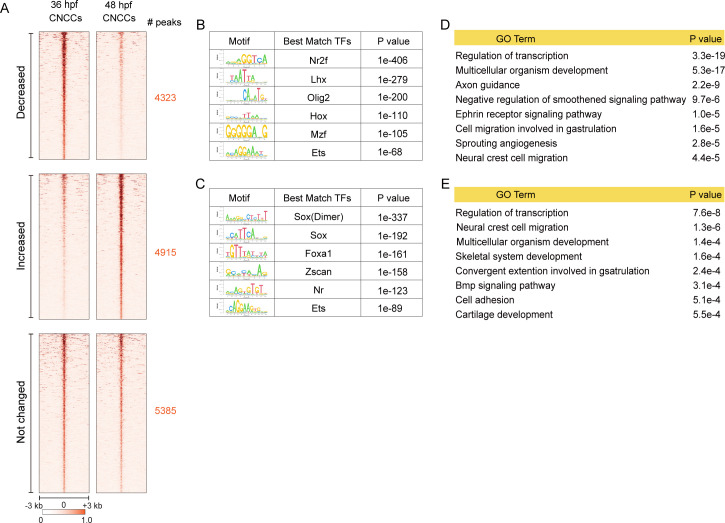
We next investigated when cartilage-associated chromatin accessibility is established in relation to CNCC development. CNCCs are first specified at ~10.5 hpf at the border of the neural keel, finish their migration into the pharyngeal arches by ~20 hpf, and then show the first histological signs of cartilage development in the jaw at ~52 hpf (Schilling and Kimmel, 1997). CNCC-derived arch ectomesenchyme cells can be uniquely identified by co-expression of fli1a:GFP and sox10:Dsred transgenes at 36 and 48 hpf (Askary et al., 2017), stages just prior to cartilage differentiation (Figure 2A). We therefore performed µATACseq on FACS-purified fli1a:GFP+; sox10:Dsred+ cells at these stages. 4915 of 14,623 elements gaining accessibility from 36 to 48 hpf were linked to GO terms including skeletal system development and cartilage development, and were enriched for Sox and Fox transcription factor binding motifs. 4323 elements with decreasing accessibility were linked to several GO terms related to cellular migration and enriched for motifs of neural crest-associated transcription factors (Nr2f, Lhx, Olig2, Hox, Ets), consistent with decommissioning of enhancers involved in earlier neural crest migration (Figure 2—figure supplement 1).
Figure 2. Dynamics of chromatin accessibility across facial chondrogenesis.
(A) Confocal images of CNCCs expressing fli1a:GFP and sox10:Dsred at 36 and 48 hpf. Lateral view with anterior to left. Scale bar = 100 μm. (B) Peak intensity plots of cartilage-accessible distal elements shown for chondrocytes at 72 hpf and CNCCs at 36 and 48 hpf. Chondrocyte accessible elements are pooled into three categories based on dynamics of chromatin accessibility across stages. (C, E, G) De novo motif enrichment recovered by Homer analysis among the three categories. Top six motifs are shown with associated p values after removing redundant motifs. (D, F, H) GO term analysis among the three categories.
Figure 2—figure supplement 1. Comparison of accessible regions between 36 and 48 hpf CNCCs.
To more specifically understand the timing of cartilage-associated chromatin accessibility, we next analyzed chondrocyte-specific accessible elements from our 72 hpf dataset for their accessibilities at 36 and 48 hpf (Figure 2B). Of the 5,736 elements enriched in chondrocytes at 72 hpf, only 6% (356) had peak accessibility at 36 hpf with no further increase in accessibility by 48 hpf (‘Group I’). In contrast, 48% (2741) displayed increased accessibility between 36 and 48 hpf (‘Group II’), and 46% (2639) between 48 and 72 hpf (‘Group III’). For Group I, de novo motif enrichment revealed predicted binding sites for members of the Nfat, Fox, Lhx, Nr2f, Meis, and Pax families, and significant GO terms included neural crest migration, cell migration in general, and dorsal/ventral pattern formation (Figure 2C,D). Combined with the known involvement of Foxd3 (Montero-Balaguer et al., 2006; Stewart et al., 2006), Lhx6/8 (Denaxa et al., 2009), Nr2f1/2/5 (Barske et al., 2018), Meis2 (Machon et al., 2015), and Pax9 (Nakatomi et al., 2010) in CNCC specification, migration, and dorsal–ventral arch patterning, many Group I elements likely represent retention of cis-regulatory elements involved in the earlier specification, migration, and regional patterning of CNCCs. Group II and Group III elements share many common predicted transcription factor binding motifs, including Sox dimer, Fox, Nfat, and Ap1 motifs previously described for mouse cartilage (Figure 2E,G; Supplementary file 1B; Ohba et al., 2015). An Nkx motif was recovered only for Group II (p=10−58, 36% of targets), an Egr motif was enriched for Group II (p=10−65, 55% of targets) versus Group III (p=10−20, 16% of targets), and a Tead motif was enriched for Group III (p=10−63, 36% of targets) versus Group II (p=10−20, 3% of targets). GO analysis for linked genes also revealed terms related to skeletal system development (Group II) and cartilage development (Group III), as well as more general terms such as transcription and cell differentiation (Figure 2F,H). We therefore conclude that the majority of chondrocyte-specific elements gain accessibility after pharyngeal arch formation and that transcription factor binding motifs change during cartilage differentiation. For example, enrichment of Nkx motifs in Group II elements might reflect the role of Nkx3.2 in limiting chondrocyte maturation (Provot et al., 2006) and promoting joint formation (Miller et al., 2003), while the preferential enrichment of the Tead motif, which is linked to growth-associated Hippo signaling (Ota and Sasaki, 2008), in Group III elements might reflect the later proliferative expansion of chondrocytes.
Requirement of Foxc1 for chromatin accessibility at a subset of cartilage elements
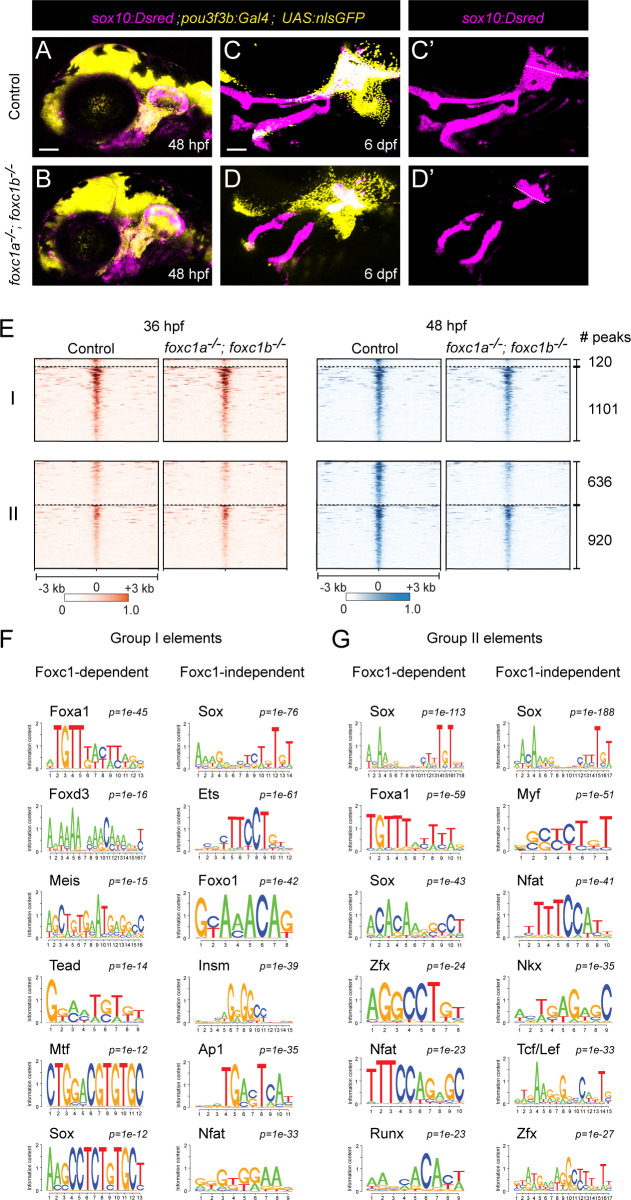
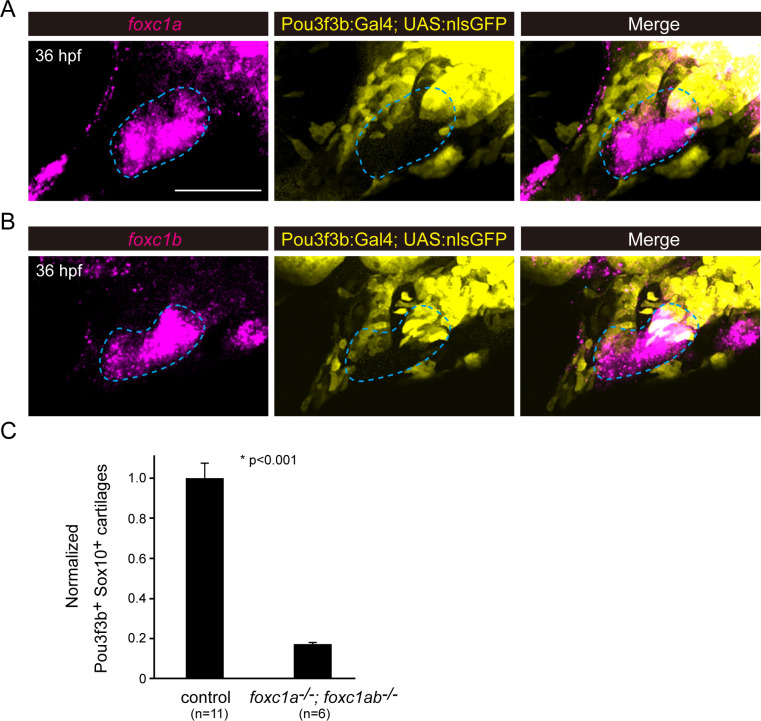
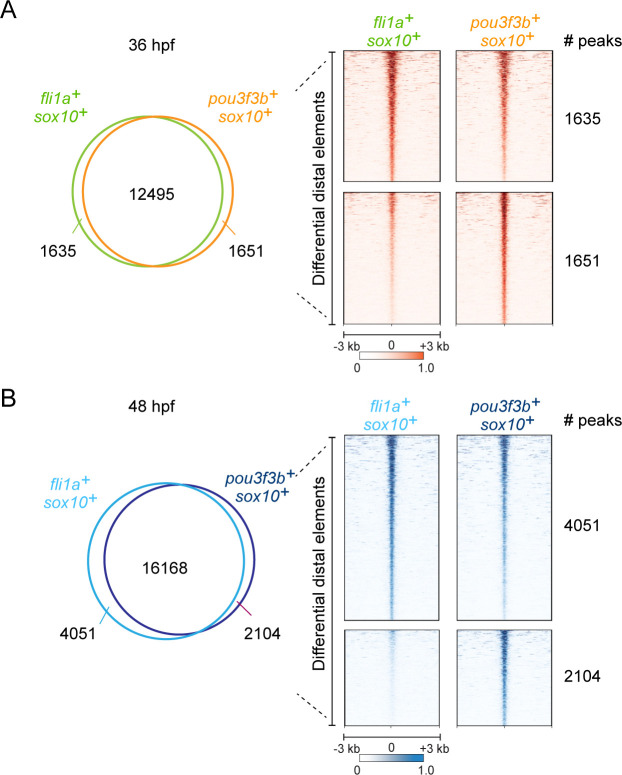
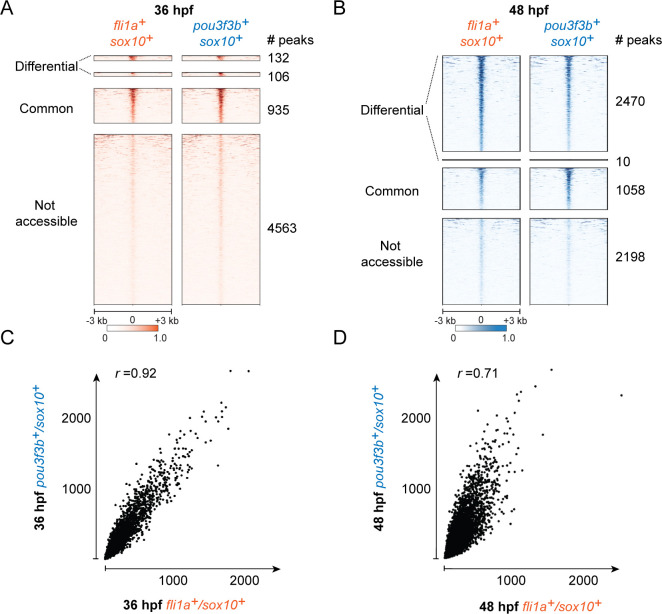
We had previously found that Foxc1 genes are essential for cartilage development in the upper face (Xu et al., 2018), and both our µATACseq analysis of zebrafish chondrocytes and published Sox9 ChIP-seq analysis in mouse (Ohba et al., 2015) reveals co-enrichment of Sox and Fox motifs in accessible regions near known cartilage genes. In zebrafish Foxc1 (foxc1a−/−; foxc1b−/−) mutants, cartilages of the upper/dorsal face fail to develop (Xu et al., 2018). In order to isolate the dorsal arch CNCC precursors affected in Foxc1 mutants, we used a pou3f3b:Gal4; UAS:nlsGFP (pou3f3b>GFP) dorsal CNCC transgenic line (Barske et al., 2020) along with the pan-CNCC sox10:Dsred transgenic line. In situ hybridization for foxc1a and foxc1b at 36 hpf showed partial overlap with the pou3f3b>GFP line in the dorsal-intermediate regions of the first and second arches (Figure 3—figure supplement 1A). Consistently, we observed reductions of cartilage in the pou3f3b>GFP domain of mutants at 6 days post-fertilization (dpf), except in the dorsal-most regions (close to the ear) that are pou3f3b>GFP-positive yet foxc1a/foxc1b-negative (Figure 3C,D; Figure 3—figure supplement 1B). As pou3f3b>GFP+; sox10:Dsred+ CNCCs were present at 48 hpf (Figure 3A,B), we performed µATACseq on these cells after FACS from Foxc1 mutants and controls at 36 and 48 hpf. A comparison of the 15,781 accessible regions in dorsal CNCCs (pou3f3b>GFP+; sox10:Dsred+) and pan-CNCCs (fli1a:GFP+; sox10:Dsred+) at 36 hpf revealed 79% with similar accessibility, 11% with greater accessibility in dorsal CNCCs, and 10% with greater accessibility in pan-CNCCs (Figure 3—figure supplement 2A). Of 22,323 elements at 48 hpf, 72% were similarly accessible, 10% more accessible in dorsal CNCCs, and 18% more accessible in pan-CNCCs (Figure 3—figure supplement 2B). A comparison of the 5,736 regions with specific accessibility in cartilage at 72 hpf revealed high correlation between dorsal- and pan-CNCCs at 36 hpf, with 96% displaying similar accessibility (r = 0.92, Figure 3—figure supplement 3A,C). By 48 hpf, however, we observed notable differences between accessibility of cartilage-specific elements, with 43% displaying greater accessibility in pan-CNCCs and only 0.2% displaying greater accessibility in dorsal CNCCs (r = 0.71, Figure 3—figure supplement 3B,D). The decreased accessibility of cartilage-specific elements in dorsal CNCCs at 48 hpf supports previous studies that dorsal chondrocytes develop later than other chondrocytes in the zebrafish face (Barske et al., 2016; Schilling and Kimmel, 1997).
Figure 3. Foxc1 dependency of facial chondrocyte chromatin accessibility.
(A,B) Confocal images show dorsal CNCCs of the first two arches labeled by sox10:Dsred and pou3f3b:Gal4; UAS:nlsGFP in control and foxc1a–/–; foxc1b–/– mutant embryos at 48 hpf. Scale bar = 100 μm. (C,D) Confocal images show loss of dorsal cartilages in foxc1a–/–; foxc1b–/– mutant embryos at 6 dpf. sox10:Dsred+ cartilages are seen in single channels in C’ and D’, with dashed lines highlighting boundaries of dorsal arch and otic cartilage. (E) Peak intensity plots of Group I and Group II elements in control and foxc1a–/–; foxc1b–/– mutant embryos. Peaks above the dashed lines are reduced in mutants. (F,G) De novo motif enrichment of Foxc1-dependent and Foxc1-independent Group I and Group II elements. Top six motifs are shown with associated p-values after removing redundant motifs.
Figure 3—figure supplement 1. Overlapping expression of foxc1a and foxc1b with pou3f3b>GFP in the dorsal-intermediate arches.
Figure 3—figure supplement 2. Comparison of accessible regions between pan- and dorsal CNCCs.
Figure 3—figure supplement 3. Accessibility of cartilage-enriched elements in earlier pan- and dorsal CNCCs.
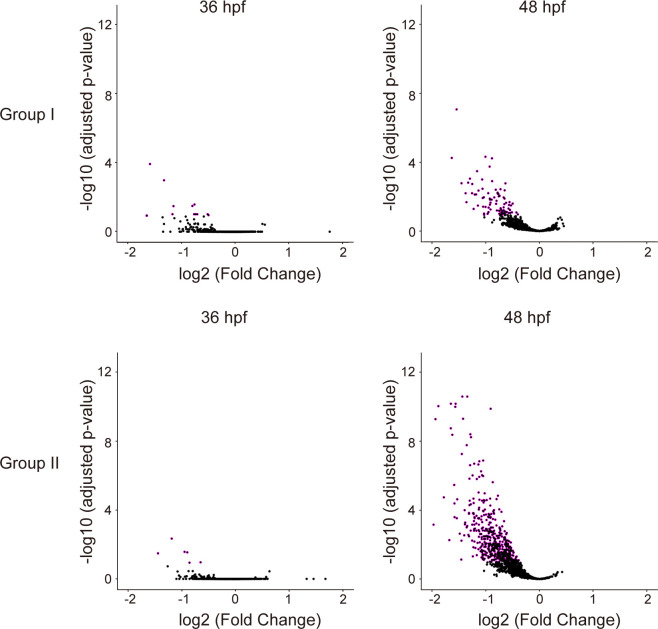
Figure 3—figure supplement 4. Volcano plots for differentially accessible peaks in Foxc1 mutants.
Analysis of cartilage-associated elements in Foxc1 mutants revealed that 10% (120/1221) of elements that have established peak accessibility by 36 hpf (i.e. Group I) and 41% (636/1556) of elements that increase accessibility between 36 and 48 hpf (i.e. Group II) had reduced accessibility in Foxc1 mutants (Figure 3E, Figure 3—figure supplement 4). De novo motif analysis of Foxc1-dependent and Foxc1-independent elements in Group I showed enrichment of Sox (p=10−12, p=10−76), Tead (p=10−14, p=10−20), Mtf (p=10−12, p=10−22), and Ets (p=10−12, p=10−61) motifs in both (Figure 3F, Supplementary file 1C). Whereas several types of Fox motifs were uncovered in both, a closer analysis revealed enrichment of Foxa2 and Foxd3 motifs only in Foxc1-dependent elements (p=10−45, 38% of targets; p=10−16, 18% of targets), and a Foxo1 motif only in Foxc1-independent elements (p=10−42, 49% of targets). Similarly in Group II elements, a Foxa1 motif was enriched only in Foxc1-dependent elements (p=10−59, 38% of targets), and Foxh1 and Foxp1 motifs only in Foxc1-independent elements (p=10−22, 22% of targets; p=10−19, 7% of targets) (Figure 3G, Supplementary file 1C). Although Foxc1 motifs were not in the database used for motif predictions, the selective presence of Foxa1/2 motifs in Foxc1-dependent elements is consistent with previous reports that the consensus sequence for Foxc1-bound peaks is nearly identical to Foxa1/2 motifs (Wang et al., 2016). Sox motifs were similarly enriched in both Group I and Group II Foxc1-dependent and -independent elements, and Nfat and Zfx motifs in Group II Foxc1-dependent and -independent elements. An Insm (p=10−39, 30% of targets) motif was uncovered only in Foxc1-independent Group I elements and an Nkx motif (p=10−35, 52% of targets) only in Foxc1-independent Group II elements. Whereas 33% (207/636) of Foxc1-dependent Group II elements had both Sox and Fox predicted motifs, only 16% (151/920) of Foxc1-independent Group II elements had both. These findings suggest that Foxc1-dependent and -independent cartilage elements may be commonly bound by Sox9 but likely differ in co-binding by Foxc1 and additional co-factors. For example, the presence of the Nkx motif only in Foxc1-independent elements suggests that it could be an alternative co-factor for Sox9, in line with the known roles for Nkx3.2 in chondrocyte biology (Provot et al., 2006).
Validation of Foxc1-dependent cartilage enhancers in zebrafish transgenesis assays
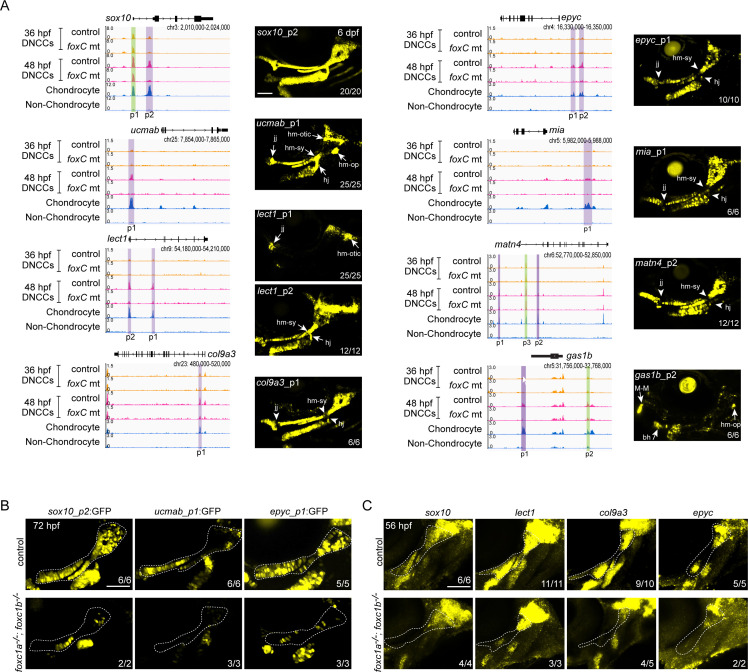
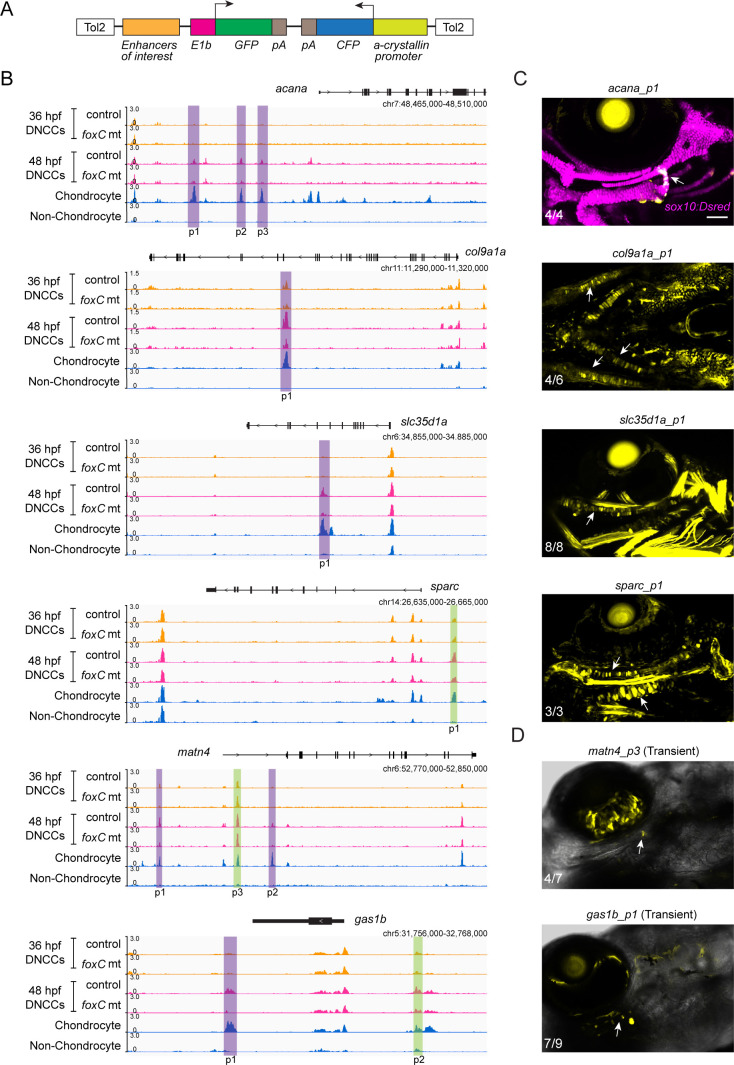
To verify whether Foxc1-dependent cartilage elements identified by µATACseq are chondrogenic enhancers, we tested the ability of individual elements in combination with an E1b minimal promoter to drive cartilage expression of green fluorescent protein (GFP) in zebrafish transgenic assays (Figure 4—figure supplement 1A). We tested 22 Foxc1-dependent Group II elements near 15 different genes, which included elements linked to genes with known cartilage function (ucmab, matn4, matn1, lect1, epyc, col9a1a, col9a3, sox10, acana, foxa3, mia) and others with unknown cartilage function (si:dkey33i1l.4, gas1b, lefty2, slc35d1a) (Supplementary file 2). We observed that 59% (13/22) of elements drove GFP expression in facial chondrocytes at 6 dpf. These included intronic elements within sox10, lect1, col9a3, col9a1a, and slc35d1a; distal 5′ elements near ucmab, epyc, mia, acana, and matn4; a distal 3′ element near gas1b; and a promoter-associated element for lect1. We confirmed cartilage expression in independent stable transgenic lines for all 13 positive elements (Figure 4A; Figure 4—figure supplement 1; Supplementary file 2). Whereas an element in the first intron of sox10 drove uniform cartilage-specific expression, most elements drove expression in specific sub-regions or particular differentiation stages of cartilage. A distal 5′ element of ucmab drove expression in chondrocytes of multiple joints in the zebrafish head, an intronic element of lect1 drove chondrocyte expression only in the jaw joint and hyomandibular-otic connection, a promoter-associated element of lect1 drove expression more strongly in the hyoid joint and hyomandibular-symplectic connection (though also more broadly in chondrocytes), a distal 5′ element of acana drove restricted expression at the hyoid joint, and a distal 3′ element of gas1b drove restricted expression at the Meckel’s–Meckel’s joint and connection between the hyomandibular cartilage and opercular bone. Reciprocally, elements associated with col9a3, epyc, mia, matn4, and col9a1a were expressed in chondrocytes but generally excluded from joint regions (particularly apparent at the hyoid joint and hyomandibular-symplectic connection). An intronic element for slc35d1a drove expression in both pharyngeal cartilage and muscle. Furthermore, we found that three enhancer transgenes with diverse expression patterns (broad sox10, joint-restricted ucmab, and joint-excluded epyc enhancers) all displayed reduced activity specifically in the dorsal cartilage regions affected in Foxc1 mutants (Figure 4B). We also confirmed by in situ hybridization that four genes linked to Foxc1-dependent enhancers (sox10, lect1, col9a3, epyc) showed reduced expression in cartilage-forming regions of the dorsal arches of Foxc1 mutants (Figure 4C), similar to our previous results for col2a1a, matn1, matn4, and acana (Xu et al., 2018).
Figure 4. In vivo validation of Foxc1-dependent cartilage enhancers.
(A) Genomic regions (gene loci and GRCz10 coordinates listed) for enhancer testing on the left and GFP expression driven by the indicated peaks in stable transgenic zebrafish at 6 dpf on the right. Peaks (p) tested are shown, with Foxc1-dependent regions in purple and Foxc1-independent elements in green. μATACseq reads are shown in each row, with chondrocyte and non-chondrocyte peaks from 72 hpf embryos. Confocal projections show cartilages of the first two arches in lateral view with anterior to the left. Arrows indicate enriched expression at joint regions, and arrowheads denote relative lack of expression. (B) Confocal projections show selective loss of sox10_p2:EGFP, ucmab_p1:EGFP, and epyc_p1:EGFP transgene expression in the dorsal cartilage domains (dashed outlines) of foxc1a−/−; foxc1b−/− mutants at 72 hpf. (C) Confocal projections of in situ hybridization show selective loss of sox10, lect1, col9a3, and epyc in the dorsal cartilage domain (dashed outline) of foxc1a−/−; foxc1b−/− mutants at 56 hpf. Numbers indicate proportion of embryos in which the displayed patterns were observed. bh, basihyal; DNCCs, dorsal CNCCs; jj, jaw joint; hj, hyoid joint; hm-op, hyomandibular-opercular joint; hm-otic, hyomandibular-otic junction; hm-sy, hyomandibular-symplectic junction; M-M, Meckel’s–Meckel’s joint. Scale bars = 100 μm.
Figure 4—figure supplement 1. Additional in vivo validation of cartilage-enriched accessible elements.
Figure 4—figure supplement 2. In vivo validation of accessible elements from Group I.
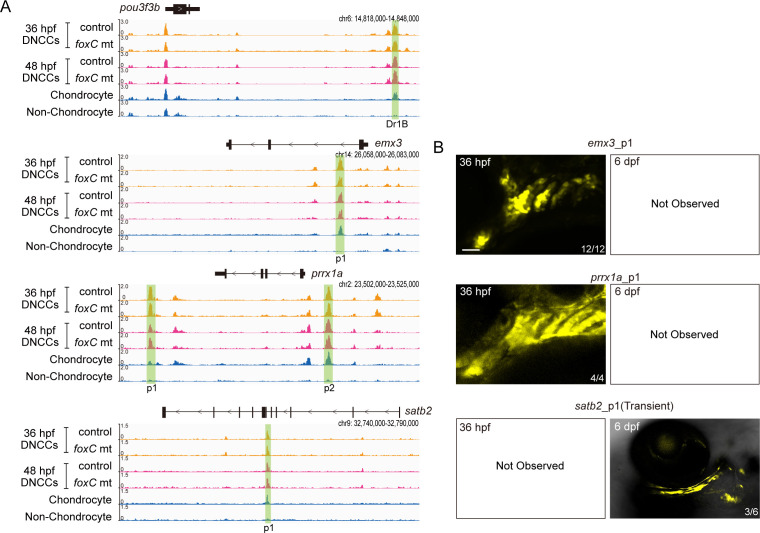
Testing of four Foxc1-independent Group II elements revealed two that drove cartilage expression (distal 5′ elements of gas1b and matn4), one that drove cartilage, bone, and ligament expression (distal 5′ element of sparc), and one with no activity (promoter-associated element of sox10) (Figure 4—figure supplement 1). Thus, the majority of tested Foxc1-dependent and -independent Group II elements are equally capable of driving cartilage expression. We also tested five Foxc1-independent Group I elements and found that two showed arch CNCC expression at 36 hpf and minimal cartilage expression at 6 dpf (prrx1a and emx3 elements), one no expression at 36 hpf and ligament expression at 6 dpf (satb2), and two no expression at either stage (prrx1a, cd248a) (Figure 4—figure supplement 2). In contrast, we did not observe 36 hpf arch CNCC expression in any of the 16 Group II elements that drove cartilage expression at 6 dpf. As most of the Group I elements tested had decreased accessibility from 36 to 48 hpf, it seems likely that these elements represent either neural crest elements in the process of decommissioning (e.g. prrx1a and emx3) or elements prefiguring non-cartilage fates (e.g. satb2). Thus, most cartilage enhancers appear to gain accessibility after 36 hpf, with activity of late-opening cartilage enhancers in diverse locations, indicating that global cartilage expression patterns are achieved in part through the summation of enhancers with more restricted activity.
Conclusion
Our findings indicate that Foxc1 function is required for the accessibility of close to half of chondrocyte enhancers in the zebrafish face. Given expression and function of Foxc1 in diverse cartilages (e.g. limb, rib, tracheal) in mouse, it seems likely that Foxc1 has a similar function in chondrocyte enhancer accessibility throughout the body. The co-enrichment of predicted Sox and Fox binding sites in 33% of chondrocyte enhancers suggests a model in which Foxc1 promotes Sox9 binding to these same enhancers by increasing chromatin accessibility, though this would require direct Sox9 binding studies to validate. However, not all Foxc1-dependent enhancers have predicted Fox binding motifs, which might suggest indirect regulation of chromatin accessibility in at least some cases. In addition, many enhancers do not appear to require Foxc1 activity. It is possible that other members of the Fox family compensate, such as Foxf1/2 in the facial midline (Xu et al., 2018) and Foxa2/3 during later hypertrophic maturation (Ionescu et al., 2012). Alternatively, there may be other co-factors that mediate chondrocyte enhancer accessibility and activation, such as Nkx3.2. We did not detect any obvious differences in the types of enhancer-proximal genes or the patterns and stages associated with Foxc1-dependent versus -independent enhancer activity. Further work will also be needed to understand the mechanism by which Foxc1 promotes chondrocyte enhancer accessibility, and the extent to which this reflects direct binding of Foxc1 to chondrogenic enhancers. Foxc1 lacks a chromatin modifying domain (Yoshida et al., 2015) and therefore would need to interact with a co-factor to directly open chromatin. Foxc1 could also act to maintain open chromatin, as shown for Foxa1 in the liver (Reizel et al., 2020). Given that both Foxc1 and Sox9 have expression in many tissues outside the skeletal system, it will also be important to determine whether additional factors help to further restrict their activity to chondrocyte enhancers within skeletogenic mesenchyme.
Materials and methods
Key resources table.
| Reagent type (species) or resource |
Designation | Source or reference | Identifiers | Additional information |
|---|---|---|---|---|
| Genetic reagent (D. rerio) | col2a1aBAC:GFPel483 | PMID:26555055 | RRID:ZFINID:ZDB-ALT-160204-6 | Available at ZIRC |
| Genetic reagent (D. rerio) | fli1a:eGFPy1 | PMID:12167406 | RRID:ZFINID:ZDB-ALT-011017-8 | Available at ZIRC |
| Genetic reagent (D. rerio) | sox10:Dsredel10 | PMID:22589745 | RRID:ZFINID:ZDB-ALT-120523-6 | |
| Genetic reagent (D. rerio) | pou3f3bGal4ff-el79 | PMID:32958671 | ||
| Genetic reagent (D. rerio) | UAS:nlsGFP;α-crystallin:Ceruleanel609 | PMID:32958671 | ||
| Genetic reagent (D. rerio) | foxc1ael543 | PMID:29777011 | RRID:ZFINID:ZDB-ALT-190103-11 | |
| Genetic reagent (D. rerio) | foxc1bel620 | PMID:29777011 | RRID:ZFINID:ZDB-ALT-190104-4 | |
| Antibody | Rabbit polyclonal anti-GFP | Torrey Pines Biolabs | RRID:AB_10013661 | Used at 1:1000 |
| Antibody | Goat polyclonal anti-rabbit Alexa Fluor 568 | Thermo Fisher Scientific |
RRID:AB_143157 | Used at 1:500 |
Zebrafish lines
The Institutional Animal Care and Use Committee of the University of Southern California approved all experiments on zebrafish (Danio rerio) (Protocol #10885). Existing mutant and transgenic lines used in this study include foxc1ael542 and foxc1bel620 (Xu et al., 2018); Tg(sox10:Dsred)el110 and Tg(fli1a:EGFP)y1 (Askary et al., 2017); Tg(col2a1aBAC:GFP)el483 (Paul et al., 2016); and Tg(UAS:nlsGFP;α-crystallin:Cerulean)el609 and pou3f3bGal4ff-el79 (Barske et al., 2020). For enhancer transgenic lines, we synthesized accessible elements with flanking attB4 and attB1 sequences using IDT gBlocks and cloned these into pDONR-P4-P1R using the Gateway Tol2kit (Invitrogen) to create p5E enhancer constructs (Kwan et al., 2007). We then combined p5E constructs with pME-E1b-GFP, p3E-polyA, and pDestTol2AB2 using LR clonase. Final DNA constructs were microinjected with transposase RNA (30 ng/µl each) into one cell stage zebrafish embryos. In most cases, multiple independent stable alleles per construct were analyzed in the F1 generation (Supplementary file 2).
In situ hybridization and immunohistochemistry
In situ hybridization and immunohistochemistry were performed as described (Xu et al., 2018). In addition to foxc1a and foxc1b probes (Xu et al., 2018), partial cDNAs were PCR-amplified with Phusion High-Fidelity DNA polymerase (New England Biolabs, Ipswich, MA), cloned into pCR_Blunt_II_Topo (ThermoFisher Scientific, Waltham, MA), linearized, and then synthesized with Sp6 or T7 RNA polymerase (Roche Life Sciences, Indianapolis, IN) as specified (Supplementary file 3). For combined in situ hybridization and immunohistochemistry using foxc1a or foxc1b probes, we used rabbit anti-GFP antibody (TP401, Torrey Pines Biolabs, Secaucus, NJ) to detect pou3f3b>GFP followed by goat anti-rabbit secondary antibody (A11008, Invitrogen, Carlsbad, CA).
Confocal imaging
In situ hybridization and transgenic embryos were imaged with a Zeiss LSM800 confocal microscope. Maximum-intensity projections are shown for stable transgenic lines, and single representative sections are shown for injected embryos. Image levels were modified consistently across samples in Adobe Photoshop CS6.
µATACseq
Wild-type embryos double positive for fli1a:EGFP and sox10:Dsred (36 and 48 hpf), or col2a1a:GFP and sox10:Dserd (72 hpf), were sorted under a fluorescent dissecting microscope (Leica M165FC) before dissociation. For Foxc1 mutant analysis, we performed incrosses of pou3f3b:Gal4+/−; UAS:nls-GFP+/−; sox10:Dsred+/−; foxc1a+/−; foxc1b+/− fish and then selected for GFP+/Dsred+ embryos on a fluorescent dissecting microscope. Genotyping was then performed on tail lysates collected from individual embryos at 27 hpf. We then pooled foxc1a−/−; foxc1b−/− double mutants and separate sibling controls (foxc1a+/−; foxc1b+/+, and foxc1a+/+; foxc1b+/+ embryos) for FACS. To facilitate embryo collection at the 36 hpf time point, embryos were moved at 27 hpf to an incubator set at 22°C to delay their development such that they reached 36 hpf the following morning. Cell dissociation and FACS were performed as previously described (Askary et al., 2017). Around 5,000 cells of each sample were centrifuged at 500 g for 20 m at 4°C, and the pellet was suspended with 20 μL of lysis buffer (10 mM Tris–HCl [pH 7.4], 5 mM MgCl2, 10% DMF, 0.2% N-P40) by pipetting 6–10 times to release the nuclei without purification. The cell lysate was then mixed with 30 μL reaction buffer (10 mM Tris–HCl [pH 7.4], 5 mM MgCl2, 10% DMF, and homemade Tn5 Transposase) by vortexing for 5 s. The reaction was incubated at 37°C for 20 min, followed by DNA purification using a Qiagen MiniElute kit. Purified DNA fragments were used to construct μATACseq libraries as previously described (Buenrostro et al., 2013) and sequenced using the NextSeq 500 platform (Illumina) with a minimum of 50 million paired-reads/sample. Two biological replicates of μATACseq experiments were performed for each condition.
Data analysis and statistics
The Encode analysis pipeline (https://github.com/ENCODE-DCC/chip-seq-pipeline) for ATACseq (Davis et al., 2018) was used with small modifications. The raw reads were trimmed to 37 bp and aligned to the zebrafish GRCz10 genome assembly by STAR aligner (Dobin et al., 2013). PCR duplicates, and the reads that aligned to ‘blacklist regions’ (Amemiya et al., 2019), were removed, and then peaks were called by model-based analysis of ChIP-Seq (MACS2) (Zhang et al., 2008), with p=10−7 cutoff and disabled dynamic lambda option (--nolambda) for individual replicates. Only peaks common for two biological replicates (Irreproducibility Discovery Rate < 0.1) were kept for further analysis. For visualization, bigwig files were generated from duplicates-removed bam files with bedtools and bedgraphtobigwig, and normalization was based on total read numbers. Heatmaps were generated with deeptools2 (Ramírez et al., 2016) based on the normalized bigwig signal files. Individual genomic loci were examined by IGV (Broad Institute). For quantitatively comparing the accessibility of distal regulatory elements between two conditions, peaks from two conditions were first merged, and only distal regulatory regions (1 kb upstream or 0.5 kb downstream from the transcription start sites) were kept for comparison. Raw read counts from each replicate were computed using ‘bedtools multicov’ function (bedtools multicov -bams input.bam -bed peak.bed > count.txt). Raw read count matrices from four replicates (two replicates per condition) were analyzed using DESeq2 package (Love et al., 2014). FDR = 0.1 was used as the cut off to filter the peaks that were differentially accessible between two conditions. Volcano plots were generated using ggplot2 package in R. Fold change and adjusted p value were outputs from DESeq2 package in R, which is the same analysis behind the heatmaps in Figure 3. We used a −log10 adjusted p value greater than one as the cutoff for determining significantly changed peaks. HOMER (Heinz et al., 2010) was used to identify de novo motifs and their associated p values. David 6.8 GO analysis was performed on the web interface (https://david.ncifcrf.gov/) based on nearest neighbor genes for all differentially accessible elements. Pearson correlation was calculated using cor() function in R.
Materials and correspondence
Requests for material should be directed to J. Gage Crump (gcrump@usc.edu).
Acknowledgements
We thank Jeffrey Boyd at the USC Stem Cell Flow Cytometry Core for FACS, David Ruble at the CHLA Sequencing Core, the high-performance computing core at USC, and Megan Matsutani, Jennifer DeKoeyer Crump, and Mathi Thiruppathy for fish care. We dedicate this work to the late Bartosz Balczerski whose passion as a postdoc inspired this project.
Funding Statement
The funders had no role in study design, data collection and interpretation, or the decision to submit the work for publication.
Contributor Information
J Gage Crump, Email: gcrump@usc.edu.
Carole LaBonne, Northwestern University, United States.
Kathryn Song Eng Cheah, The University of Hong Kong, Hong Kong.
Funding Information
This paper was supported by the following grants:
National Institute of Dental and Craniofacial Research R35 DE027550 to J Gage Crump.
National Institute on Deafness and Other Communication Disorders R01DC015829 to Neil Segil.
Additional information
Competing interests
No competing interests declared.
Author contributions
Conceptualization, Formal analysis, Supervision, Investigation, Visualization, Methodology, Writing - original draft, Writing - review and editing.
Data curation, Formal analysis, Methodology, Writing - review and editing.
Data curation, Formal analysis, Methodology.
Investigation.
Resources.
Supervision.
Conceptualization, Data curation, Formal analysis, Supervision, Funding acquisition, Writing - original draft, Project administration, Writing - review and editing.
Ethics
Animal experimentation: This study was performed in strict accordance with the recommendations in the Guide for the Care and Use of Laboratory Animals of the National Institutes of Health. All of the animals were handled according to approved institutional animal care and use committee (IACUC) protocol (#20771) of the University of Southern California.
Additional files
Detailed lists of predicted motifs for cartilage-accessible elements in 72 hpf controls (A), and based on timing of gain of accessibility (B), and dependence on Foxc1 function (C).
Description of independent alleles for each enhancer transgenic line, genomic coordinates of elements tested, and activity in cartilage in 6 dpf zebrafish.
Details on primer sequences used to amplify probe regions for cloning, enyzmes used to linearize the probe plasmids, and the types of RNA polymerase used to synthesize RNA probes for in situ hybridization.
Data availability
Chromatin accessibility data have been deposited in GEO under accession number GSE157575.
The following dataset was generated:
Crump G. 2020. Foxc1 establishes enhancer accessibility for craniofacial cartilage differentiation. NCBI Gene Expression Omnibus. GSE157575
References
- Amemiya HM, Kundaje A, Boyle AP. The ENCODE blacklist: identification of problematic regions of the genome. Scientific Reports. 2019;9:e45839. doi: 10.1038/s41598-019-45839-z. [DOI] [PMC free article] [PubMed] [Google Scholar]
- Askary A, Mork L, Paul S, He X, Izuhara AK, Gopalakrishnan S, Ichida JK, McMahon AP, Dabizljevic S, Dale R, Mariani FV, Crump JG. Iroquois proteins promote skeletal joint formation by maintaining chondrocytes in an immature state. Developmental Cell. 2015;35:358–365. doi: 10.1016/j.devcel.2015.10.004. [DOI] [PMC free article] [PubMed] [Google Scholar]
- Askary A, Xu P, Barske L, Bay M, Bump P, Balczerski B, Bonaguidi MA, Crump JG. Genome-wide analysis of facial skeletal regionalization in zebrafish. Development. 2017;144:2994–3005. doi: 10.1242/dev.151712. [DOI] [PMC free article] [PubMed] [Google Scholar]
- Barske L, Askary A, Zuniga E, Balczerski B, Bump P, Nichols JT, Crump JG. Competition between Jagged-Notch and Endothelin1 signaling selectively restricts cartilage formation in the zebrafish upper face. PLOS Genetics. 2016;12:e1005967. doi: 10.1371/journal.pgen.1005967. [DOI] [PMC free article] [PubMed] [Google Scholar]
- Barske L, Rataud P, Behizad K, Del Rio L, Cox SG, Crump JG. Essential role of Nr2f nuclear receptors in patterning the vertebrate upper jaw. Developmental Cell. 2018;44:337–347. doi: 10.1016/j.devcel.2017.12.022. [DOI] [PMC free article] [PubMed] [Google Scholar]
- Barske L, Fabian P, Hirschberger C, Jandzik D, Square T, Xu P, Nelson N, Yu HV, Medeiros DM, Gillis JA, Crump JG. Evolution of vertebrate gill covers via shifts in an ancient Pou3f3 enhancer. PNAS. 2020;117:24876–24884. doi: 10.1073/pnas.2011531117. [DOI] [PMC free article] [PubMed] [Google Scholar]
- Bi W, Deng JM, Zhang Z, Behringer RR, de Crombrugghe B. Sox9 is required for cartilage formation. Nature Genetics. 1999;22:85–89. doi: 10.1038/8792. [DOI] [PubMed] [Google Scholar]
- Buenrostro JD, Giresi PG, Zaba LC, Chang HY, Greenleaf WJ. Transposition of native chromatin for fast and sensitive epigenomic profiling of open chromatin, DNA-binding proteins and nucleosome position. Nature Methods. 2013;10:1213–1218. doi: 10.1038/nmeth.2688. [DOI] [PMC free article] [PubMed] [Google Scholar]
- Cirillo LA, Lin FR, Cuesta I, Friedman D, Jarnik M, Zaret KS. Opening of compacted chromatin by early developmental transcription factors HNF3 (FoxA) and GATA-4. Molecular Cell. 2002;9:279–289. doi: 10.1016/S1097-2765(02)00459-8. [DOI] [PubMed] [Google Scholar]
- Davis CA, Hitz BC, Sloan CA, Chan ET, Davidson JM, Gabdank I, Hilton JA, Jain K, Baymuradov UK, Narayanan AK, Onate KC, Graham K, Miyasato SR, Dreszer TR, Strattan JS, Jolanki O, Tanaka FY, Cherry JM. The encyclopedia of DNA elements (ENCODE): data portal update. Nucleic Acids Research. 2018;46:D794–D801. doi: 10.1093/nar/gkx1081. [DOI] [PMC free article] [PubMed] [Google Scholar]
- Denaxa M, Sharpe PT, Pachnis V. The LIM homeodomain transcription factors Lhx6 and Lhx7 are key regulators of mammalian dentition. Developmental Biology. 2009;333:324–336. doi: 10.1016/j.ydbio.2009.07.001. [DOI] [PMC free article] [PubMed] [Google Scholar]
- Dobin A, Davis CA, Schlesinger F, Drenkow J, Zaleski C, Jha S, Batut P, Chaisson M, Gingeras TR. STAR: ultrafast universal RNA-seq aligner. Bioinformatics. 2013;29:15–21. doi: 10.1093/bioinformatics/bts635. [DOI] [PMC free article] [PubMed] [Google Scholar]
- Dy P, Wang W, Bhattaram P, Wang Q, Wang L, Ballock RT, Lefebvre V. Sox9 directs hypertrophic maturation and blocks osteoblast differentiation of growth plate chondrocytes. Developmental Cell. 2012;22:597–609. doi: 10.1016/j.devcel.2011.12.024. [DOI] [PMC free article] [PubMed] [Google Scholar]
- Heinz S, Benner C, Spann N, Bertolino E, Lin YC, Laslo P, Cheng JX, Murre C, Singh H, Glass CK. Simple combinations of lineage-determining transcription factors prime cis-regulatory elements required for macrophage and B cell identities. Molecular Cell. 2010;38:576–589. doi: 10.1016/j.molcel.2010.05.004. [DOI] [PMC free article] [PubMed] [Google Scholar]
- Hong HK, Lass JH, Chakravarti A. Pleiotropic skeletal and ocular phenotypes of the mouse mutation congenital hydrocephalus (ch/Mf1) arise from a winged Helix/forkhead transcriptionfactor gene. Human Molecular Genetics. 1999;8:625–637. doi: 10.1093/hmg/8.4.625. [DOI] [PubMed] [Google Scholar]
- Inman KE, Purcell P, Kume T, Trainor PA. Interaction between Foxc1 and Fgf8 during mammalian jaw patterning and in the pathogenesis of syngnathia. PLOS Genetics. 2013;9:e1003949. doi: 10.1371/journal.pgen.1003949. [DOI] [PMC free article] [PubMed] [Google Scholar]
- Ionescu A, Kozhemyakina E, Nicolae C, Kaestner KH, Olsen BR, Lassar AB. FoxA family members are crucial regulators of the hypertrophic chondrocyte differentiation program. Developmental Cell. 2012;22:927–939. doi: 10.1016/j.devcel.2012.03.011. [DOI] [PMC free article] [PubMed] [Google Scholar]
- Jo A, Denduluri S, Zhang B, Wang Z, Yin L, Yan Z, Kang R, Shi LL, Mok J, Lee MJ, Haydon RC. The versatile functions of Sox9 in development, stem cells, and human diseases. Genes & Diseases. 2014;1:149–161. doi: 10.1016/j.gendis.2014.09.004. [DOI] [PMC free article] [PubMed] [Google Scholar]
- Kume T, Deng KY, Winfrey V, Gould DB, Walter MA, Hogan BL. The forkhead/winged Helix gene Mf1 is disrupted in the pleiotropic mouse mutation congenital hydrocephalus. Cell. 1998;93:985–996. doi: 10.1016/S0092-8674(00)81204-0. [DOI] [PubMed] [Google Scholar]
- Kwan KM, Fujimoto E, Grabher C, Mangum BD, Hardy ME, Campbell DS, Parant JM, Yost HJ, Kanki JP, Chien CB. The Tol2kit: a multisite gateway-based construction kit for Tol2 transposon transgenesis constructs. Developmental Dynamics. 2007;236:3088–3099. doi: 10.1002/dvdy.21343. [DOI] [PubMed] [Google Scholar]
- Lefebvre V, Huang W, Harley VR, Goodfellow PN, de Crombrugghe B. SOX9 is a potent activator of the chondrocyte-specific enhancer of the pro alpha1(II) collagen gene. Molecular and Cellular Biology. 1997;17:2336–2346. doi: 10.1128/MCB.17.4.2336. [DOI] [PMC free article] [PubMed] [Google Scholar]
- Liu CF, Angelozzi M, Haseeb A, Lefebvre V. SOX9 is dispensable for the initiation of epigenetic remodeling and the activation of marker genes at the onset of chondrogenesis. Development. 2018;145:dev164459. doi: 10.1242/dev.164459. [DOI] [PMC free article] [PubMed] [Google Scholar]
- Love MI, Huber W, Anders S. Moderated estimation of fold change and dispersion for RNA-seq data with DESeq2. Genome Biology. 2014;15 doi: 10.1186/s13059-014-0550-8. [DOI] [PMC free article] [PubMed] [Google Scholar]
- Lukoseviciute M, Gavriouchkina D, Williams RM, Hochgreb-Hagele T, Senanayake U, Chong-Morrison V, Thongjuea S, Repapi E, Mead A, Sauka-Spengler T. From pioneer to repressor: bimodal foxd3 activity dynamically remodels neural crest regulatory landscape in Vivo. Developmental Cell. 2018;47:608–628. doi: 10.1016/j.devcel.2018.11.009. [DOI] [PMC free article] [PubMed] [Google Scholar]
- Machon O, Masek J, Machonova O, Krauss S, Kozmik Z. Meis2 is essential for cranial and cardiac neural crest development. BMC Developmental Biology. 2015;15:40. doi: 10.1186/s12861-015-0093-6. [DOI] [PMC free article] [PubMed] [Google Scholar]
- Miller CT, Yelon D, Stainier DY, Kimmel CB. Two endothelin 1 effectors, hand2 and bapx1, pattern ventral pharyngeal cartilage and the jaw joint. Development. 2003;130:1353–1365. doi: 10.1242/dev.00339. [DOI] [PubMed] [Google Scholar]
- Montero-Balaguer M, Lang MR, Sachdev SW, Knappmeyer C, Stewart RA, De La Guardia A, Hatzopoulos AK, Knapik EW. The mother superior mutation ablates foxd3 activity in neural crest progenitor cells and depletes neural crest derivatives in zebrafish. Developmental Dynamics. 2006;235:3199–3212. doi: 10.1002/dvdy.20959. [DOI] [PubMed] [Google Scholar]
- Mori-Akiyama Y, Akiyama H, Rowitch DH, de Crombrugghe B. Sox9 is required for determination of the chondrogenic cell lineage in the cranial neural crest. PNAS. 2003;100:9360–9365. doi: 10.1073/pnas.1631288100. [DOI] [PMC free article] [PubMed] [Google Scholar]
- Nakatomi M, Wang XP, Key D, Lund JJ, Turbe-Doan A, Kist R, Aw A, Chen Y, Maas RL, Peters H. Genetic interactions between Pax9 and Msx1 regulate lip development and several stages of tooth morphogenesis. Developmental Biology. 2010;340:438–449. doi: 10.1016/j.ydbio.2010.01.031. [DOI] [PubMed] [Google Scholar]
- Ohba S, He X, Hojo H, McMahon AP. Distinct transcriptional programs underlie Sox9 regulation of the mammalian chondrocyte. Cell Reports. 2015;12:229–243. doi: 10.1016/j.celrep.2015.06.013. [DOI] [PMC free article] [PubMed] [Google Scholar]
- Ota M, Sasaki H. Mammalian tead proteins regulate cell proliferation and contact inhibition as transcriptional mediators of hippo signaling. Development. 2008;135:4059–4069. doi: 10.1242/dev.027151. [DOI] [PubMed] [Google Scholar]
- Paul S, Schindler S, Giovannone D, de Millo Terrazzani A, Mariani FV, Crump JG. Ihha induces hybrid cartilage-bone cells during zebrafish jawbone regeneration. Development. 2016;143:2066–2076. doi: 10.1242/dev.131292. [DOI] [PMC free article] [PubMed] [Google Scholar]
- Provot S, Kempf H, Murtaugh LC, Chung UI, Kim DW, Chyung J, Kronenberg HM, Lassar AB. Nkx3.2/Bapx1 acts as a negative regulator of chondrocyte maturation. Development. 2006;133:651–662. doi: 10.1242/dev.02258. [DOI] [PubMed] [Google Scholar]
- Ramírez F, Ryan DP, Grüning B, Bhardwaj V, Kilpert F, Richter AS, Heyne S, Dündar F, Manke T. deepTools2: a next generation web server for deep-sequencing data analysis. Nucleic Acids Research. 2016;44:W160–W165. doi: 10.1093/nar/gkw257. [DOI] [PMC free article] [PubMed] [Google Scholar]
- Reizel Y, Morgan A, Gao L, Lan Y, Manduchi E, Waite EL, Wang AW, Wells A, Kaestner KH. Collapse of the hepatic gene regulatory network in the absence of FoxA factors. Genes & Development. 2020;34:1039–1050. doi: 10.1101/gad.337691.120. [DOI] [PMC free article] [PubMed] [Google Scholar]
- Rice R, Rice DPC, Olsen BR, Thesleff I. Progression of calvarial bone development requires Foxc1 regulation of Msx2 and Alx4. Developmental Biology. 2003;262:75–87. doi: 10.1016/S0012-1606(03)00355-5. [DOI] [PubMed] [Google Scholar]
- Schilling TF, Kimmel CB. Musculoskeletal patterning in the pharyngeal segments of the zebrafish embryo. Development. 1997;124:2945–2960. doi: 10.1242/dev.124.15.2945. [DOI] [PubMed] [Google Scholar]
- Stewart RA, Arduini BL, Berghmans S, George RE, Kanki JP, Henion PD, Look AT. Zebrafish foxd3 is selectively required for neural crest specification, migration and survival. Developmental Biology. 2006;292:174–188. doi: 10.1016/j.ydbio.2005.12.035. [DOI] [PubMed] [Google Scholar]
- Sun J, Ishii M, Ting MC, Maxson R. Foxc1 controls the growth of the murine frontal bone rudiment by direct regulation of a bmp response threshold of Msx2. Development. 2013;140:1034–1044. doi: 10.1242/dev.085225. [DOI] [PMC free article] [PubMed] [Google Scholar]
- Vivatbutsiri P, Ichinose S, Hytönen M, Sainio K, Eto K, Iseki S. Impaired meningeal development in association with apical expansion of calvarial bone osteogenesis in the Foxc1 mutant. Journal of Anatomy. 2008;212:603–611. doi: 10.1111/j.1469-7580.2008.00893.x. [DOI] [PMC free article] [PubMed] [Google Scholar]
- Wang L, Siegenthaler JA, Dowell RD, Yi R. Foxc1 reinforces quiescence in self-renewing hair follicle stem cells. Science. 2016;351:613–617. doi: 10.1126/science.aad5440. [DOI] [PMC free article] [PubMed] [Google Scholar]
- Xu P, Balczerski B, Ciozda A, Louie K, Oralova V, Huysseune A, Crump JG. Fox proteins are modular competency factors for facial cartilage and tooth specification. Development. 2018;145:dev165498. doi: 10.1242/dev.165498. [DOI] [PMC free article] [PubMed] [Google Scholar]
- Yan YL, Willoughby J, Liu D, Crump JG, Wilson C, Miller CT, Singer A, Kimmel C, Westerfield M, Postlethwait JH. A pair of sox: distinct and overlapping functions of zebrafish sox9 co-orthologs in craniofacial and pectoral fin development. Development. 2005;132:1069–1083. doi: 10.1242/dev.01674. [DOI] [PubMed] [Google Scholar]
- Yoshida M, Hata K, Takashima R, Ono K, Nakamura E, Takahata Y, Murakami T, Iseki S, Takano-Yamamoto T, Nishimura R, Yoneda T. The transcription factor Foxc1 is necessary for Ihh-Gli2-regulated endochondral ossification. Nature Communications. 2015;6:6653. doi: 10.1038/ncomms7653. [DOI] [PubMed] [Google Scholar]
- Zhang Y, Liu T, Meyer CA, Eeckhoute J, Johnson DS, Bernstein BE, Nusbaum C, Myers RM, Brown M, Li W, Liu XS. Model-based analysis of ChIP-Seq (MACS) Genome Biology. 2008;9:R137. doi: 10.1186/gb-2008-9-9-r137. [DOI] [PMC free article] [PubMed] [Google Scholar]


