

Abstract
Alien mammalian carnivores have contributed disproportionately to global loss of biodiversity. In Australia, predation by the feral cat and red fox is one of the most significant causes of the decline of native vertebrates. To discover why cats have greater impacts on prey than native predators, we compared the ecology of the feral cat to a marsupial counterpart, the spotted-tailed quoll. Individual prey are 20–200 times more likely to encounter feral cats, because of the combined effects of cats' higher population densities, greater intensity of home-range use and broader habitat preferences. These characteristics also mean that the costs to the prey of adopting anti-predator behaviours against feral cats are likely to be much higher than adopting such behaviours in response to spotted-tailed quolls, due to the reliability and ubiquity of feral cat cues. These results help explain the devastating impacts of cats on wildlife in Australia and other parts of the world.
Keywords: feral cat, spotted-tailed quoll, relative predation impact, predator–prey interaction, alien carnivore, prey naivete
1. Introduction
Alien mammalian carnivores have contributed disproportionately to global biodiversity loss. Collectively, 30 species of alien mammalian predators have contributed to 58% of all vertebrate extinctions [1]. The scale of this impact is often attributed to naivete of prey towards novel predators, such that predator–prey encounters are more likely to result in death or increased costs to prey [2–4]. However, prey naivete frameworks (e.g. [4]) rarely incorporate the ecology and behaviour of alien predators, despite evidence that these affect the rate and outcomes of predator–prey interactions [5–7].
Figure 1 presents a framework to evaluate the mechanisms underpinning differences in the impact of novel versus familiar predators. In addition to classes of the prey response [3,4], it incorporates elements of predator ecology (following Sih et al. [8]), synthesizing existing frameworks into a format that can readily be applied to empirical data to make or test predictions. It breaks the predator–prey interaction into its three stages [9]: encounter, detection/recognition and response (figure 1, stages A : C). The encounter rate between predators and prey is largely predicted by their spatio-temporal overlap [8], noting that an encounter may be a direct interaction where predator and prey are physically within detection distance of each other [9], or an indirect interaction whereby prey detect cues (visual, auditory or olfactory) which suggest that a predator may be nearby [9]. The translation of the encounter rate to predation impact is influenced by prey behaviour in the detection/recognition and response stages (figure 1, stages B and C). In these stages, effective anti-predator behaviours such as avoidance or vigilance may reduce the risk of death, minimizing the consumptive effects (CEs) of the predator [10]. Prey naivete theory predicts the relative strength of CEs conferred by novel versus familiar predators under all scenarios of prey response [8] (figure 1, stage D).
Figure 1.

Conceptual framework for assessing relative predation impact of native versus introduced predators on shared native prey species. Predation impact depends on the rate of encounter between predator and prey (A), and the costs associated with each encounter (D). For our case study, rather than estimate the impact of each predator on a focal prey species, we predict the relative impact of cats versus quolls on all shared prey. These predictions are based on theoretical classes of prey response (scenarios 1 : 6, derived from prey naivete theory [2,3]) during the stages of a predator–prey encounter (stages A : C, [8,9]), to estimate the relative strengths of both consumptive and non-consumptive effects (D, [5,6]).
Anti-predator behaviours impose fitness costs, however, known as non-consumptive effects (NCEs) which are often equivalent to or outweigh CEs [10]. Whereas CEs only occur during the physical encounter with the predator, NCEs are also incurred by responding to cues which are spatially and temporally separated from the predator (e.g. scent and vocalizations) [6]. The magnitude of NCEs incurred in each encounter will be determined by the nature of prey response. The relative strength of NCEs conferred by different predators can, however, be theoretically predicted based on the hunting mode and habitat domain of the predator.
Hunting mode (usually categorized as ‘active hunting’, ‘sit-and-pursue’ or ‘sit-and-wait’) determines the degree of association between the predator and cues to its presence, and therefore how reliably these cues indicate encounter risk [5,6,11]. This in turn should influence how likely prey are to employ anti-predator responses and incur NCEs [11]. Habitat domain refers to the subset of available habitat used by an organism, incorporating both habitat preferences and movement range [5]. Costly, chronic avoidance responses by prey such as shifts to non-preferred foraging habitat and times are more effective against narrow-domain predators (those with strong habitat preferences, and/or limited and predictable movement) due to the availability of times or habitats with a lower risk of predator encounter. The narrower domain breadth of predators is, therefore, predicted to result in higher NCEs on prey [5].
In this manuscript, we apply the framework in figure 1 to a study system with an alien predator, the feral cat (Felis catus, hereafter cat) and an analogous native marsupial predator, the spotted-tailed quoll (Dasyurus maculatus, hereafter quoll). Feral cats are implicated in 26% of bird, mammal and reptile extinctions worldwide, and are a leading cause of decline and extinction of native vertebrate fauna in Australia [12,13]. This is despite the broad similarity between their predatory behaviour and that of quolls, which coexist with many species of prey that are threatened by cats. This similarity is illustrated by high dietary overlap [14] and similar (ambush) hunting mode [15] of the two species, as well as similar body size. While there is evidence that Australian prey recognize and respond to cats as a threat [16], the devastating impacts of cats in Australia suggest that cat behaviour is sufficiently distinct from native predators that native prey responses are inappropriate or insufficient.
Here, we use fine-scale GPS telemetry to compare the behaviour of cats and quolls. We quantify the risk to the prey of encountering each predator across the landscape, combining population densities with revisitation frequency and habitat selection ratios derived from telemetry data. This information is then mapped onto scenarios of prey naivete (figure 1, scenarios 1 : 6 [2]), to predict direct and indirect costs to prey from each encounter and thus the relative predation impact of cats and quolls on shared prey species.
2. Methods
(a). GPS tracking
Trapping and GPS collaring were undertaken at four sites in the Tasmanian Midlands agricultural region (figure 2, electronic supplementary material, table S1.1) between September 2015 and June 2017. Traps (30 cm wire-cage traps (Mascot Wireworks, Sydney) and 30 cm diameter PVC Tasmanian devil traps) were deployed for 5–10 nights per session. Trapped animals were transferred into canvas handling sacks, weighed, measured, microchipped and sexed. Cats (not quolls) were sedated using 0.15 ml kg−1 medetomidine (Domitor, Pfizer), injected intramuscularly. Sedation was reversed following handling using 0.075 ml kg−1 of atipamezole hydrochloride (Antisedan, Pfizer), also intramuscularly.
Figure 2.
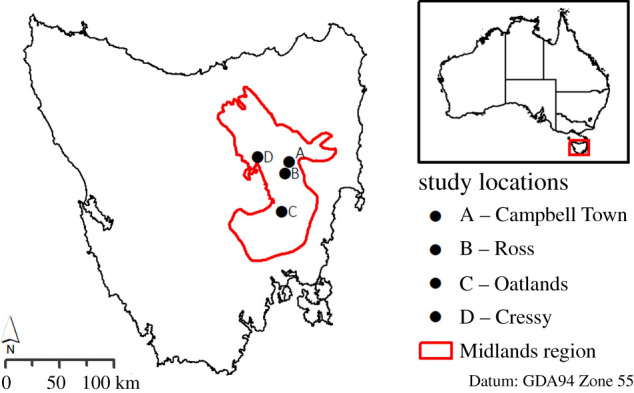
Study locations. Site coordinates: A (−41.8807, 147.5177), B (−41.9788, 147.4678), C (−42.2946, 147.4382), D (−41.8447, 147.169138). (Online version in colour.)
VHF + GPS collars were fitted only to adult animals to avoid poor collar fit due to rapid growth. Collars recorded locations every 5 or 15 min (electronic supplementary material, table S1.2) and featured a drop-off mechanism in case animals were not recaptured [17]. Animals were monitored regularly using the VHF beacon and re-trapped for collar removal after approximately one month.
Fifty-seven cats and 36 quolls were captured and 34 and 14 were fitted with GPS collars, respectively (electronic supplementary material, table S1.3). Data from 25 cats and 10 quolls were used in all analyses except revisitation frequency calculations, for which data from two cat and two quoll collars with less than two weeks data were discarded (electronic supplementary material, table S1.2). Data obtained were filtered and home range estimates calculated as described in [18] and electronic supplementary material, appendix S1.
(b). Risk of encounter
We estimated the risk of encountering each predator across the landscape (figure 1a) based on population densities, habitat preferences and revisitation frequency. Our calculation method differs from traditional approaches based on the ideal gas equation, which treat animals as randomly moving particles such that the encounter rate is directly proportional to their density and velocity ([19] and references within). Species-specific characteristics such as home-range extent, range of movement speeds and directionality of movement have considerable effects on encounter rates, which are not accounted for when animal movement is treated as random [19]. We, therefore, used empirical data derived from the GPS collars to directly estimate the rate at which animals were encountered in the landscape.
We divided the landscape into 30 m resolution raster cells, which were each classified into one of 14 habitat categories (electronic supplementary material, appendix S1). Recognizing that many prey species respond to habitat features at a finer spatial scale than these predators, we undertook analyses at the finest resolution possible, within the constraints of available broad-scale habitat data and the error implicit in the telemetry data (electronic supplementary material, appendix S1). From the telemetry data, we calculated the average number of times each animal was ‘encountered’ in each raster cell within its home range per tracking night (revisitation frequency). We multiplied the revisitation frequency estimates by habitat selection ratios (to account for population-level habitat preferences) and the average density of each species to determine the risk of encountering each species within each habitat type in the landscape. Finally, we divided the risk of encountering a cat by that of encountering a quoll to determine the relative risk of an encounter.
(i). Population density
Population densities at each tracking site have been previously derived using spatially explicit capture–mark–recapture analyses (electronic supplementary material, table S1.2, [18]). These were converted from animals km−2 to animals cell−1 by multiplying by 0.0009.
(ii). Habitat preference
Habitat selection ratios identify preferences or avoidances by comparing the proportion of time spent within each habitat type to its availability in the landscape. We calculated habitat selection ratios for each animal, then aggregated these to give population-level estimates for each species [20]. Habitat use was estimated as the proportion of GPS fixes within each habitat category, and available habitat was delineated using a circular polygon with radius equal to the animal's maximum recorded displacement from the home range centroid (design III analysis: habitat use and availability estimated per individual [20]). The derivation of habitat categories is described in electronic supplementary material, appendix S1. All calculations were performed using the adehabitatHS package [21] in the R statistical environment.
(iii). Revisitation
Revisitation frequency was calculated as the number of visits (NV) made per night by an animal to each 30 m raster cell within its home range. We derived revisitation distributions for each individual following Benhamou & Riotte-Lambert [22]. Revisitation was defined as a discrete visit separated by at least 2 h of activity more than 200 m away. Distributions were derived using the BRB/MKDE standalone software [23], snapping each distribution to the 30 m resolution habitat raster. The interpolated movement path was used to extract the NV for each raster cell, which was then averaged across the 95% kernel home range and standardized by number of tracking nights. Linear models were used to compare revisitation frequency between species, sexes and breeding states (electronic supplementary material, table S1.3). Species-level revisitation frequency was averaged across males and non-lactating females only, as lactating females showed reduced foraging movements and increased revisitation to dependent young.
(iv). Diel activity and behavioural state
We also considered the diel activity patterns and behavioural state of both species, as factors that would influence the rate and outcome of predator–prey encounters (available in electronic supplementary material, appendix S1). These results were not included in encounter rate calculations due to the similarity of each species' activity profile, difficulty of distinguishing between feral cat movement states, and because neither factor would influence the rate of indirect encounters (such as encounters with olfactory cues). These analyses may, however, be relevant in other systems or for comparisons with focal prey species.
(c). Cost per encounter
Six scenarios of prey response during the recognition (B) and response (C) phases of the encounter are identified based on prey naivete theory (figure 1, scenarios 1 : 6, [4]). For prey in each scenario, we predict the relative costs (CEs and NCEs), when encountering novel (cats) versus familiar (quolls) predators (D1 : 6). Relative CEs in all scenarios and NCEs in scenarios D1 and D4 are directly predicted by the level of naivete displayed. Relative NCEs for scenarios D2,3,5,6 are inferred by comparing the hunting mode and domain breadth of the predators. Rather than use qualitative descriptions of hunting mode which would not distinguish between cats and quolls, we use revisitation frequency calculations as a quantitative indication of cue reliability (i.e. higher revisitation denotes a tighter association between predators and cues).
3. Results
(a). Risk of encounter
Across the Midlands landscape, the risk of encountering a cat was always at least 20 times higher than the risk of encountering a quoll (figure 3). On average, the probability of a cat being present within each 30 m raster cell on any one night was 0.09 ± 0.03, compared to 0.004 ± 0.002 for quolls (electronic supplementary material, figure S1.4).
Figure 3.

Relative risk of encountering feral cats and spotted-tailed quolls in different habitat types across the Tasmanian Midlands landscape. (Online version in colour.)
(b). Population density and revisitation frequency
Cats had consistently higher population densities than quolls in the Midlands (averaging approximately 9 cats km−2 versus 0.4 quolls ha−1, electronic supplementary material, table S1.2). Cats also revisited areas within their home ranges almost twice as frequently as quolls (cats 8.0 ± 0.6 visits month−1 cell−1, versus quolls 3.5 ± 0.3 visits month−1 cell−1, electronic supplementary material, figure S1.1).
(c). Habitat preferences
Individual cats showed strong but variable habitat preferences, such that habitat selection at the population level was weaker than for quolls (electronic supplementary material, figure S1.2). Both species avoided open pasture (average selection ratio 0.4 ± 0.05 for cats and 0.1 ± 0.07 for quolls). Cats also showed consistent positive selection for woodland edge habitats (electronic supplementary material, figure S1.2). Quolls used all woodland habitats, including edges, at least in proportion to their availability; and preference strength increased with vegetation density. They also avoided urban and open areas of all types (electronic supplementary material, figure S1.2).
4. Discussion
We found that the likelihood of prey encountering an introduced feral cat is much greater than encountering a native spotted-tailed quoll in this highly modified agricultural landscape. This is in part due to higher population densities, but also to greater revisitation frequency and broader habitat preferences of cats. These latter characteristics are likely to increase the overall costs of anti-predator behaviours incurred by prey. The absolute rate of encounter, cost per encounter and therefore magnitude of predation impact from both predators will vary among prey species, driven by prey-specific differences in habitat use and anti-predator behaviours. Our results demonstrate, however, that in our study landscape there are no habitats in which prey are less likely to encounter a cat than a quoll (figure 3). In addition, the costs per cat encounter are predicted to be equivalent or higher than for quoll encounters under all scenarios of prey response. Therefore, the ecological and behavioural differences between the predators are predicted to result in impacts of cats being several orders of magnitude higher than those of their native counterpart for all shared prey species.
(a). Risk of encounter
While the absolute rate of encounter will vary according to the habitat preferences and behaviour of prey species, native prey are between approximately 20–200 times more likely to encounter a cat than a quoll in all habitats across our study area (figure 3). A large proportion of this difference is due to differences in density. Average densities of cats in the Midlands (0.9 cats km−2 [18]) are higher than the national average of 0.27 cats km−2 [24]. Although differences in encounter rates between cats and quolls may, therefore, be exaggerated compared to other regions, the large, exclusive home ranges of female quolls [25] mean that this species is never present in high densities, and estimates from this study (0.4 quolls km−2, [18]) are equivalent to the highest previously recorded densities (0.3 quolls km−2, [25]).
Differences in movement behaviour suggest that encounter rates of prey with cats would be higher regardless of relative densities. Despite each species travelling an equivalent distance per night [18], cats had consistently smaller home ranges and revisited areas within their home ranges more than twice as frequently as quolls. Cat activity, and therefore encounter probability, was also more consistent across habitats. Interestingly, although habitat selection at the population level was weak, individual cats show strong habitat selection. These individual preferences are in keeping with observations of specialization by individual cats, which have led to calls for predator profiling to remove ‘problem’ cats which have learnt to specialize on endangered or focal prey species [26].
(b). Cost per encounter
Once a predator is encountered, the cost to prey will depend on species-specific detection/recognition and anti-predator responses, as outlined in figure 1. Under levels 1–3 of prey naivete (figure 1, scenarios C1 : C3), the likelihood of prey mortality is higher when encountering alien feral cats rather than native quolls due to absent, inappropriate or ineffective responses. Level I naivete (C1) is decreasingly likely in contemporary Australian ecosystems given the 150+ years of shared evolutionary history [2], but may have contributed to rapid species declines immediately following cat arrival. There is more contemporary evidence for second and third-level naivete, including a recent meta-analysis showing that native prey species studied to date exhibit a non-zero response to feral cat presence [16]. Interestingly, approximately half the prey species studied actually decreased their anti-predator responses in the presence of cats, possibly resulting from infection with the Toxoplasma gondii parasite which can increase risk-taking behaviour and attraction to cat odour [16]. This specific scenario is not explicitly reflected by the figure 1 framework, which assumes that inappropriate responses will still impose NCEs on prey. In this case study, overall cat impacts on prey in this scenario are still likely to be higher given much higher encounter rates and CEs.
Under scenarios C4 or C5, prey respond effectively to cats, and CEs are predicted to be equivalent for encounters with both predators. To our knowledge, there are no published examples of scenario C4, where prey deploy effective but excessive responses, but such responses are possible. We have discounted the possibility of cats showing naivete toward prey and therefore not recognizing prey or conferring lower CEs than quolls (scenario C6, [8]). We have based this on the overlap in diet between the two carnivores, the tendency of cats to kill even non-palatable prey [27], and evidence of the devastating predation impact of feral cats on a wide range of prey types [12].
Anti-predator responses, whether effective or not, incur costs and are, therefore, more likely to be deployed with increasing cue reliability [5,6,11]. NCEs are, therefore, a product of the likelihood of such responses being employed, and the costs of the response used. Under scenarios C2,3 and 5, prey should be equally likely to respond to immediate and reliable cues (e.g. sight, sound) from both predators. Our results suggest, however, that indirect (e.g. scent) cues from cats are a more reliable indication of predation risk and are more likely to elicit a response than indirect quoll cues. Firstly, because cats revisit areas within their home range almost twice as often as quolls, prey are more likely to encounter fresh cat cues. Cue age can dramatically influence response: for example, bush rats (Rattus fuscipes) give up foraging significantly earlier in response to fresh dog scent, but show no such response to 1-day old scent [28]. Secondly, higher revisitation rates implies that cats are more likely to return within a shorter time frame [11]. This distinction would be better represented by considering the length and predictability of revisitation intervals, but in our case study, the tracking period was too short compared to the number of revisits for such an analysis.
The cost of anti-predator responses will depend on the type of response shown. Predators with narrow habitat domains should theoretically invoke costlier chronic responses in prey, such as shifts in habitat or activity times to avoid encounters [6]. Refuge times and habitats are less available when predators have broad domains, meaning that prey are more likely to employ defences only when under immediate risk [6]. In our case study, cats have slightly broader habitat preferences than quolls. These differences are subtle, however, and open habitats such as pasture avoided by quolls would offer little shelter or foraging opportunity for prey. In addition, meta-analyses suggest that the breadth of habitat domain is at best only weakly indicative of overall NCE strength [5,6]. We predict, therefore, that prey are likely to invoke anti-predator responses more frequently in response to cat cues, and that the costs of these responses are likely to be similar, such that overall NCEs on prey will be higher during cat encounters under scenarios C3 : C5. We are currently unable to test these predictions, and further work is needed to test their generality. Only two studies to date directly compare native prey responses to cat and quoll cues in areas where quolls occur naturally. Prey either showed no response to cats (level 1 naivete, [29]) or increased attraction and risk-taking behaviour in response to cat scents, possibly as a result of T. gondii infection [30].
(c). Implications
Using the framework shown in figure 1, we are able to conclude that the overall predation impact of feral cats on shared native prey in Australia is likely to be higher than their closest native archetype under all prey response scenarios. These results paint a pessimistic picture for the persistence of native prey in the presence of feral cats. Given the difficulties associated with broad-scale, long-term cat control [12], manipulating habitat structure may be the most effective method of managing cat impacts. Although cats are still likely to be encountered in complex habitats, there is mounting evidence that their hunting success is inversely related to the complexity of understorey structure [27,31–34]. There is also a large body of work demonstrating that anti-predator behaviours are less costly in proximity to refuge habitats (e.g. [9,35]). Maintaining and restoring understorey complexity to provide fine-scale predation refuges may, therefore, be an effective means of promoting native prey persistence, particularly within modified landscapes.
These results go some way to explaining the disproportionate impacts of feral cats on a broad range of native Australian prey. More broadly, this study demonstrates the value of integrating detailed knowledge of the spatial and temporal activity patterns of alien and native predators for comparing and predicting relative impact across all shared prey. The next steps will be to experimentally confirm these predictions for prey with different levels of naivete.
Supplementary Material
Acknowledgements
We thank project partners Greening Australia and collaborators Bush Heritage Australia, Tasmanian Land Conservancy and the Department of Primary Industries, Parks, Water and the Environment; Toby Patterson for assistance with HMM analyses; Rae and Lindsay Young, Annabel and Julian von Bibra, Isabelle and John Atkinson, Maria and John Weeding, Peter Meaburn, Roderic O'Connor, Joanne and Tony Jones, Tom Hingston, Gordon Laycock and Adrian Carpenter for property access and assistance; and the many volunteers who assisted with data collection.
Ethics
This project was undertaken with approval from the University of Tasmania Animal Ethics Committee (permit A0014805) and the Department of Primary Industries, Parks, Water and the Environment (permit TFA15124).
Data accessibility
Telemetry data are archived on the Movebank database (www.movebank.org, Movebank IDs 1121208171 and 1121239120).
Author contributions
R.P.H. designed the study, undertook fieldwork and data analysis and drafted the manuscript; R.Z.G. and K.M.P. assisted with fieldwork and data analysis and critically revised the manuscript; C.N.J. and M.E.J. assisted with study design and critically revised the manuscript. All authors gave final approval for publication and agree to be held accountable for the work performed therein.
Competing interests
We declare we have no competing interests.
Funding
This work was supported by an Australian Research Council (ARC) Linkage Scheme grant no. (LP130100949), an Ecological Society of Australia ‘The Nature Conservancy Applied Conservation Award’, a Holsworth Wildlife Research Endowment Grant and a Royal Zoological Society of NSW Ethel Mary Read Scholarship.
References
- 1.Doherty TS, Glen AS, Nimmo DG, Ritchie EG, Dickman CR. 2016. Invasive predators and global biodiversity loss. Proc. Natl Acad. Sci. USA 113, 11 261–11 265. ( 10.1073/pnas.1602480113) [DOI] [PMC free article] [PubMed] [Google Scholar]
- 2.Carthey AJR, Banks PB. 2014. Naïveté in novel ecological interactions: lessons from theory and experimental evidence. Biol. Rev. 89, 932–949. ( 10.1111/brv.12087) [DOI] [PubMed] [Google Scholar]
- 3.Banks PB, Dickman CR. 2007. Alien predation and the effects of multiple levels of prey naiveté. Trends Ecol. Evol. 22, 229–230. ( 10.1016/j.tree.2007.02.006) [DOI] [PubMed] [Google Scholar]
- 4.Carthey AJR, Blumstein DT. 2018. Predicting predator recognition in a changing world. Trends Ecol. Evol. 33, 106–115. ( 10.1016/j.tree.2017.10.009) [DOI] [PubMed] [Google Scholar]
- 5.Preisser EL, Orrock JL, Schmitz OJ. 2007. Predator hunting mode and habitat domain alter nonconsumptive effects in predator–prey interactions. Ecology 88, 2744–2751. ( 10.1890/07-0260.1) [DOI] [PubMed] [Google Scholar]
- 6.Schmitz OJ, Miller JRB, Trainor AM, Abrahms B. 2017. Toward a community ecology of landscapes: predicting multiple predator–prey interactions across geographic space. Ecology 98, 2281–2292. ( 10.1002/ecy.1916) [DOI] [PubMed] [Google Scholar]
- 7.Lima SL 2002. Putting predators back into behavioral predator–prey interactions. Trends Ecol. Evol. 17, 70–75. ( 10.1016/S0169-5347(01)02393-X) [DOI] [Google Scholar]
- 8.Sih A, Bolnick DI, Luttbeg B, Orrock JL, Peacor SD, Pintor LM, Preisser E, Rehage JS, Vonesh JR. 2010. Predator–prey naïveté, antipredator behavior, and the ecology of predator invasions. Oikos 119, 610–621. ( 10.1111/j.1600-0706.2009.18039.x) [DOI] [Google Scholar]
- 9.Lima SL, Dill LM. 1990. Behavioral decisions made under the risk of predation: a review and prospectus. Can. J. Zool. 68, 619–640. ( 10.1139/z90-092) [DOI] [Google Scholar]
- 10.Preisser EL, Bolnick DI, Benard MF. 2005. Scared to death? The effects of intimidation and consumption in predator–prey interactions. Ecology 86, 501–509. ( 10.1890/04-0719) [DOI] [Google Scholar]
- 11.Kats LB, Dill LM. 1998. The scent of death: chemosensory assessment of predation risk by prey animals. Écoscience 5, 361–394. ( 10.1080/11956860.1998.11682468) [DOI] [Google Scholar]
- 12.Doherty TS, Dickman CR, Johnson CN, Legge SM, Ritchie EG, Woinarski JCZ. 2017. Impacts and management of feral cats Felis catus in Australia. Mammal Rev. 47, 83–97. ( 10.1111/mam.12080) [DOI] [Google Scholar]
- 13.Woinarski JCZ, Burbidge AA, Harrison PL. 2015. Ongoing unraveling of a continental fauna: decline and extinction of Australian mammals since European settlement. Proc. Natl Acad. Sci. USA 112, 4531–4540. ( 10.1073/pnas.1417301112) [DOI] [PMC free article] [PubMed] [Google Scholar]
- 14.Glen AS, Pennay M, Dickman CR, Wintle BA, Firestone KB. 2011. Diets of sympatric native and introduced carnivores in the Barrington Tops, eastern Australia. Austral Ecol. 36, 290–296. ( 10.1111/j.1442-9993.2010.02149.x) [DOI] [Google Scholar]
- 15.Jones ME, Stoddart DM. 1998. Reconstruction of the predatory behaviour of the extinct marsupial thylacine (Thylacinus cynocephalus). J. Zool. 246, 239–246. ( 10.1111/j.1469-7998.1998.tb00152.x) [DOI] [Google Scholar]
- 16.Banks PB, Carthey AJR, Bytheway JP. 2018. Australian native mammals recognize and respond to alien predators: a meta-analysis. Proc. R. Soc. B 285, 20180857 ( 10.1098/rspb.2018.0857) [DOI] [PMC free article] [PubMed] [Google Scholar]
- 17.Thalmann S 2013. Evaluation of a degradable time-release mechanism for telemetry collars. Aust. Mammal. 35, 241–244. ( 10.1071/AM12041) [DOI] [Google Scholar]
- 18.Hamer R, Hradsky B, Andersen GE, Troy S, Johnson CN, Jones MWildl. Res. In press. Home range size and population density as alternative response mechanisms to variation in habitat productivity.
- 19.Hutchinson JMC, Waser PM. 2007. Use, misuse and extensions of ‘ideal gas’ models of animal encounter. Biol. Rev. 82, 335–359. ( 10.1111/j.1469-185X.2007.00014.x) [DOI] [PubMed] [Google Scholar]
- 20.Manly B, McDonald L, Thomas D, McDonald T, Erickson W. 2002. Resource selection by animals: statistical design and analysis for field studies. London, UK: Kluwer Academic Publisher. [Google Scholar]
- 21.Calenge C 2006. The package adehabitat for the R software: a tool for the analysis of space and habitat use by animals. Ecol. Model. 197, 516–519. [Google Scholar]
- 22.Benhamou S, Riotte-Lambert L. 2012. Beyond the utilization distribution: identifying home range areas that are intensively exploited or repeatedly visited. Ecol. Modell. 227, 112–116. ( 10.1016/j.ecolmodel.2011.12.015) [DOI] [Google Scholar]
- 23.Benhamou S 2018. BRB/MKDE. Biased random bridges for movement-based kernel density estimation: computation of utilization distribution, intensity distribution and recursion distribution with optional boundary management, habitat selection analyses, and (for mountain environments) slope-based area corrections. See https://www.cefe.cnrs.fr/fr/recherche/ee/ec/216-simon-benhamou?tmpl=component&type=raw.
- 24.Legge S, et al. 2017. Enumerating a continental-scale threat: how many feral cats are in Australia? Biol. Conserv. 206, 293–303. ( 10.1016/j.biocon.2016.11.032) [DOI] [Google Scholar]
- 25.Glen AS 2008. Population attributes of the spotted-tailed quoll (Dasyurus maculatus) in north-eastern New South Wales. Aust. J. Zool. 56, 137–142. ( 10.1071/ZO08025) [DOI] [Google Scholar]
- 26.Moseby KE, Peacock DE, Read JL. 2015. Catastrophic cat predation: a call for predator profiling in wildlife protection programs. Biol. Conserv. 191, 331–340. ( 10.1016/j.biocon.2015.07.026) [DOI] [Google Scholar]
- 27.McGregor H, Legge S, Jones ME, Johnson CN. 2015. Feral cats are better killers in open habitats, revealed by animal-borne video. PLoS ONE 10, e0133915 ( 10.1371/journal.pone.0133915) [DOI] [PMC free article] [PubMed] [Google Scholar]
- 28.Bytheway JP, Carthey AJR, Banks PB. 2013. Risk vs. reward: how predators and prey respond to aging olfactory cues. Behav. Ecol. Sociobiol. 67, 715–725. ( 10.1007/s00265-013-1494-9) [DOI] [Google Scholar]
- 29.McEvoy J, Sinn DL, Wapstra E. 2008. Know thy enemy: behavioural response of a native mammal (Rattus lutreolus velutinus) to predators of different coexistence histories. Aust. Ecol. 33, 922–931. ( 10.1111/j.1442-9993.2008.01863.x) [DOI] [Google Scholar]
- 30.Carthey AJR, Banks PB. 2016. Naiveté is not forever: responses of a vulnerable native rodent to its long term alien predators. Oikos 125, 918–926. ( 10.1111/oik.02723) [DOI] [Google Scholar]
- 31.Hohnen R, Tuft K, McGregor HW, Legge S, Radford IJ, Johnson CN. 2016. Occupancy of the invasive feral cat varies with habitat complexity. PLoS ONE 11, e0152520 ( 10.1371/journal.pone.0152520) [DOI] [PMC free article] [PubMed] [Google Scholar]
- 32.Leahy L, Legge SM, Tuft K, McGregor HW, Barmuta LA, Jones ME, Johnson CN. 2016. Amplified predation after fire suppresses rodent populations in Australia's tropical savannas. Wildl. Res. 42, 705–716. ( 10.1071/WR15011) [DOI] [Google Scholar]
- 33.Lawes MJ, et al. 2015. Correlates of recent declines of rodents in northern and southern Australia: habitat structure is critical. PLoS ONE 10, e0130626 ( 10.1371/journal.pone.0130626) [DOI] [PMC free article] [PubMed] [Google Scholar]
- 34.Davies HF, McCarthy MA, Firth RSC, Woinarski JCZ, Gillespie GR, Andersen AN, Geyle HM, Nicholson E, Murphy BP. 2017. Top-down control of species distributions: feral cats driving the regional extinction of a threatened rodent in northern Australia. Divers. Distrib. 23, 272–283. ( 10.1111/ddi.12522) [DOI] [Google Scholar]
- 35.Andruskiw M, Fryxell JM, Thompson ID, Baker JA. 2008. Habitat-mediated variation in predation risk by the American Marten. Ecology 89, 2273–2280. ( 10.1890/07-1428.1) [DOI] [PubMed] [Google Scholar]
Associated Data
This section collects any data citations, data availability statements, or supplementary materials included in this article.
Supplementary Materials
Data Availability Statement
Telemetry data are archived on the Movebank database (www.movebank.org, Movebank IDs 1121208171 and 1121239120).