In a retrospective cohort study based on data from adult members of a large integrated health system, the authors assessed the contribution of age, sex, race/ethnicity, neighborhood of residence, comorbidities, and measures of acute physiology to rates of COVID-19 testing, infection, hospitalization, mortality, and other health outcomes.
Visual Abstract. COVID-19 Racial Disparities in an Integrated Health System.
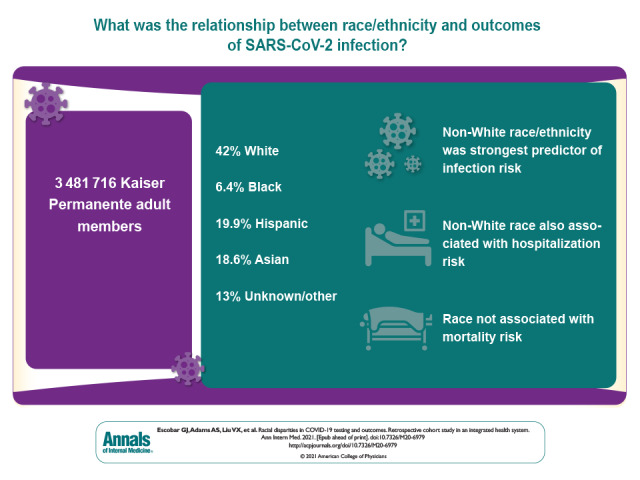
In a retrospective cohort study based on data from adult members of a large integrated health system, the authors assessed the contribution of age, sex, race/ethnicity, neighborhood of residence, comorbidities, and measures of acute physiology to rates of COVID-19 testing, infection, hospitalization, mortality, and other health outcomes.
Abstract
Background:
Racial disparities exist in outcomes after severe acute respiratory syndrome coronavirus 2 (SARS-CoV-2) infection.
Objective:
To evaluate the contribution of race/ethnicity in SARS-CoV-2 testing, infection, and outcomes.
Design:
Retrospective cohort study (1 February 2020 to 31 May 2020).
Setting:
Integrated health care delivery system in Northern California.
Participants:
Adult health plan members.
Measurements:
Age, sex, neighborhood deprivation index, comorbid conditions, acute physiology indices, and race/ethnicity; SARS-CoV-2 testing and incidence of positive test results; and hospitalization, illness severity, and mortality.
Results:
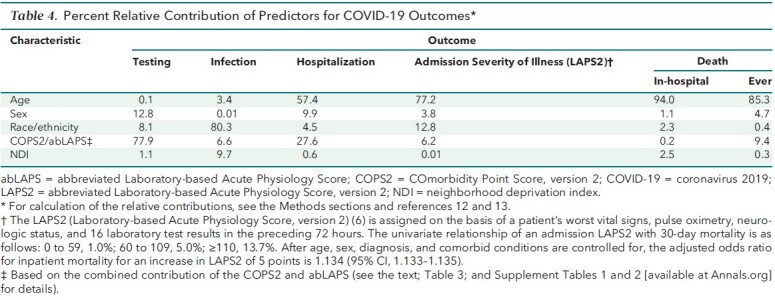
Among 3 481 716 eligible members, 42.0% were White, 6.4% African American, 19.9% Hispanic, and 18.6% Asian; 13.0% were of other or unknown race. Of eligible members, 91 212 (2.6%) were tested for SARS-CoV-2 infection and 3686 had positive results (overall incidence, 105.9 per 100 000 persons; by racial group, White, 55.1; African American, 123.1; Hispanic, 219.6; Asian, 111.7; other/unknown, 79.3). African American persons had the highest unadjusted testing and mortality rates, White persons had the lowest testing rates, and those with other or unknown race had the lowest mortality rates. Compared with White persons, adjusted testing rates among non-White persons were marginally higher, but infection rates were significantly higher; adjusted odds ratios [aORs] for African American persons, Hispanic persons, Asian persons, and persons of other/unknown race were 2.01 (95% CI, 1.75 to 2.31), 3.93 (CI, 3.59 to 4.30), 2.19 (CI, 1.98 to 2.42), and 1.57 (CI, 1.38 to 1.78), respectively. Geographic analyses showed that infections clustered in areas with higher proportions of non-White persons. Compared with White persons, adjusted hospitalization rates for African American persons, Hispanic persons, Asian persons, and persons of other/unknown race were 1.47 (CI, 1.03 to 2.09), 1.42 (CI, 1.11 to 1.82), 1.47 (CI, 1.13 to 1.92), and 1.03 (CI, 0.72 to 1.46), respectively. Adjusted analyses showed no racial differences in inpatient mortality or total mortality during the study period. For testing, comorbid conditions made the greatest relative contribution to model explanatory power (77.9%); race only accounted for 8.1%. Likelihood of infection was largely due to race (80.3%). For other outcomes, age was most important; race only contributed 4.5% for hospitalization, 12.8% for admission illness severity, 2.3% for in-hospital death, and 0.4% for any death.
Limitation:
The study involved an insured population in a highly integrated health system.
Conclusion:
Race was the most important predictor of SARS-CoV-2 infection. After infection, race was associated with increased hospitalization risk but not mortality.
Primary Funding Source:
The Permanente Medical Group, Inc.
The severe acute respiratory syndrome coronavirus 2 (SARS-CoV-2) pandemic has affected disadvantaged, Hispanic, and Black/African American populations disproportionately. Racial and ethnic disparities in coronavirus disease 2019 (COVID-19) incidence and outcomes have been widely reported and recently summarized (1). However, quantitative analyses showing how racial and ethnic disparities result in differential infection rates and adverse outcomes have not been reported. One important limitation of the current literature is that baseline population characteristics, testing rates, test positivity rates, incidence, hospitalization, and mortality have not been available within the same study. Integrated information systems that can track members across the care continuum provide an opportunity to gain insight into the role of race and ethnicity in the course of SARS-CoV-2 infection.
We performed a population-based study of SARS-CoV-2 testing, infection, hospitalization, and mortality during the initial phase of the pandemic in the United States. We sought to evaluate the contribution of race/ethnicity in COVID-19 testing, incidence, hospitalization, and death during the initial phase of the pandemic (1 February 2020 to 31 May 2020). A better understanding of the role of race/ethnicity could inform health system strategies aimed at mitigating disparities. Our study was done at Kaiser Permanente Northern California (KPNC), an integrated health care delivery system serving 4.4 million members. Integrated information systems permit quantifying predictors and outcomes across a continuum that includes patients' underlying risk, testing data, infection rates, and outcomes.
Methods
Setting
Under a mutual exclusivity agreement, 9500 physicians of The Permanente Medical Group care for 4.4 million Kaiser Foundation Health Plan (KFHP) members at facilities owned by Kaiser Foundation Hospitals. Deployment of the Epic electronic health record (www.epicsystems.com) was completed in mid-2010.
Testing Protocols
Testing for suspected SARS-CoV-2 infection was initially performed by the Centers for Disease Control and Prevention and then by State of California and local health departments. Testing was internalized on 13 March 2020. All testing was performed by using SARS-CoV-2 assays with the Roche Cobas 8800, Hologic Panther Fusion, Hologic Panther Aptima, or Cepheid Infinity Testing systems. Testing was initially performed only for symptomatic patients. On 2 April 2020, testing was expanded to include asymptomatic surgical patients; on 21 April 2020, it was further expanded to asymptomatic patients, consistent with health agency recommendations prioritizing health care workers and first responders, close contacts, essential workers, those with high risk medical conditions, congregate setting residents, and employees.
Study Population
We identified all records of KFHP members who met these criteria: alive, 18 years of age or older, members on 1 February 2020, and with continuous membership (unless they died) during the study period (1 February 2020 to 31 May 2020). We then scanned KPNC databases, linking members' records to the following data elements: self-reported race and ethnicity (captured by medical assistants in the outpatient setting, admission clerks for hospitalized patients, and/or at the time of KFHP enrollment); individual Elixhauser comorbid conditions (2) and the aggregate Elixhauser score (3); Charlson Comorbidity Index score (4); and neighborhood deprivation index (NDI), a composite index ranging from –5 to 5, with more positive values indicating worsening neighborhood characteristics (such as poverty and unemployment) (5).
We also captured 3 composite indices that are assigned to adults in the KPNC system: a longitudinal comorbidity score (COmorbidity Point Score, version 2 [COPS2]), an outpatient physiology-based severity of illness score (abbreviated Laboratory-based Acute Physiology Score [abLAPS]), and a 72-hour severity of illness score (Laboratory-based Acute Physiology Score, version 2 [LAPS2]). Each month, all adults with a KPNC medical record number are assigned a COPS2, which is based on diagnoses accrued in the preceding 12 months, with higher scores associated with increasing mortality risk (6). They are also assigned a monthly abLAPS, which is based on 14 laboratory tests obtained in the preceding month; higher scores are associated with increased physiologic abnormalities (7, 8) (Supplement 1). As described elsewhere (6, 9–11), we also scanned KPNC databases to identify hospitalizations, admission to the intensive care unit (ICU), assisted ventilation, and in-hospital and all-cause deaths. For hospitalized patients, we also captured their admission LAPS2, which is assigned at the time of first entry to a non–emergency department hospital unit (6). The LAPS2 is based on vital signs, neurologic status, pulse oximetry, and 16 laboratory tests in the 72 hours preceding hospitalization; higher scores indicate increasing physiologic derangement. In KPNC, the COPS2, abLAPS, and LAPS2 are used for multiple predictive models (for example, death, ICU admission, rehospitalization). They are used as scalar values permitting separate quantitative assessment of patients' acute physiology and longitudinal comorbidity burden; for example, 2 patients could have the same comorbidity burden but different acute physiology.
This data-only project was approved by the KPNC Institutional Review Board, which waived the requirement for informed consent from participants.
Outcomes
Using KPNC databases, we extracted information on whether SARS-CoV-2 testing occurred among all members in the cohort. For members with a positive test result, we used KPNC databases to extract information on hospitalizations and deaths (during the first hospitalization or ever during the entire study period). Follow-up for these 3 outcomes in KPNC data sources was complete during the study period. Among hospitalized patients, we also examined admission illness severity (LAPS2), ICU admission, occurrence of mechanical ventilation, and in-hospital death.
Statistical Analysis
Descriptive and nongeographic statistical analyses were conducted by using R, version 3.6.0.
The exposure of interest was race/ethnicity, which we grouped into 5 categories: White; Black/African American; Hispanic; Asian; and all other, including unknown race. For multivariate analyses, we used logistic regression for dichotomous outcomes (tested or not, infected, hospitalized, in-hospital death, death during study period) and linear regression for the continuous outcome (LAPS2). We adjusted all models for age, sex, NDI, and members' most recent abLAPS and COPS2. Because these latter 2 variables are correlated and because most members have very low scores, we adjusted for COPS2 and abLAPS by using a derived variable that divided patients into 3 mutually exclusive comorbidity groups: low risk (the reference category for all models), medium risk, and high risk. The low-risk group consisted of members with COPS2 of 10 or less and abLAPS of 0 (the lowest possible scores); after removing these healthy members, we defined the other 2 risk groups on the basis of COPS2 terciles and the upper and lower half of the abLAPS distribution in the remaining members (Supplement Tables 1 and 2). We quantified the relative contribution of each predictor by first calculating the difference in log-likelihood comparing the full model with all predictors and the model that omits the predictor of interest: that is, the likelihood ratio test statistic. This difference can be viewed as the contribution of information provided by the predictor. We then presented each difference as a percentage of the total of all differences corresponding to each predictor in the full model, which we refer to as the percent relative contribution of the predictor (12, 13).
As described elsewhere (14), we identified geographic SARS-CoV-2 infection clusters by using SaTScan software (www.satscan.org) (Supplement 2). We used a discrete Poisson-based model (15) to detect circular geographic clusters containing a higher-than-expected proportion of SARS-CoV-2 infection cases among the KPNC population. In addition to reporting the most likely cluster, secondary clusters reported were selected by using the Gini index (a measure of statistical dispersion [16]). Only clusters that were significant at the P < 0.05 level were reported. Members included in the study were assigned to census block groups based on their home address as of February 2020. The SARS-CoV-2 infection case and population counts were input to the SaTScan software at the census block group level. Owing to sparse membership outside the primary KPNC service area, the spatial analyses were restricted to 17 counties that comprise 96% of the study population. Spatial analyses for SARS-CoV-2 infection were adjusted for age and sex but not for NDI or race, and separate analyses were performed on the “low-risk” members (persons with COPS2 ≤10 and abLAPS of 0) and all other members. As a sensitivity analysis, we explored the possible confounding of the association between race/ethnicity and infection by location, using a multivariate model for infection that included an indicator variable for spatial cluster (in-cluster, not in-cluster) to represent location. Separate models were fit for low-risk members (persons with COPS2 ≤10 and abLAPS of 0) and all other members to parallel the spatial clustering analyses.
Role of the Funding Source
This study was funded by The Permanente Medical Group, Inc., and Kaiser Foundation Hospitals, Inc., which requested that the study be conducted and submitted for publication and provided comments on an initial draft. The analyses and final version of the paper were determined by the authors alone.
Results
We identified a total of 3 481 716 members (48% male) who met our inclusion criteria (Table 1; Supplement Table 1). The study population was 42.0% White, 6.4% Black/African American, 19.9% Hispanic, 18.6% Asian, 3.7% other race, and 9.3% unknown race (these last 2 categories were pooled in analyses). Compared with the other groups, Black/African Americans had higher rates of diabetes, obesity, hypertension, chronic pulmonary disease, and congestive heart failure. White persons (2.5%) and Black/African American persons (2.3%) had higher rates of cancer (Supplement Table 3).
Table 1. Study Cohort Characteristics and Unadjusted Outcomes.
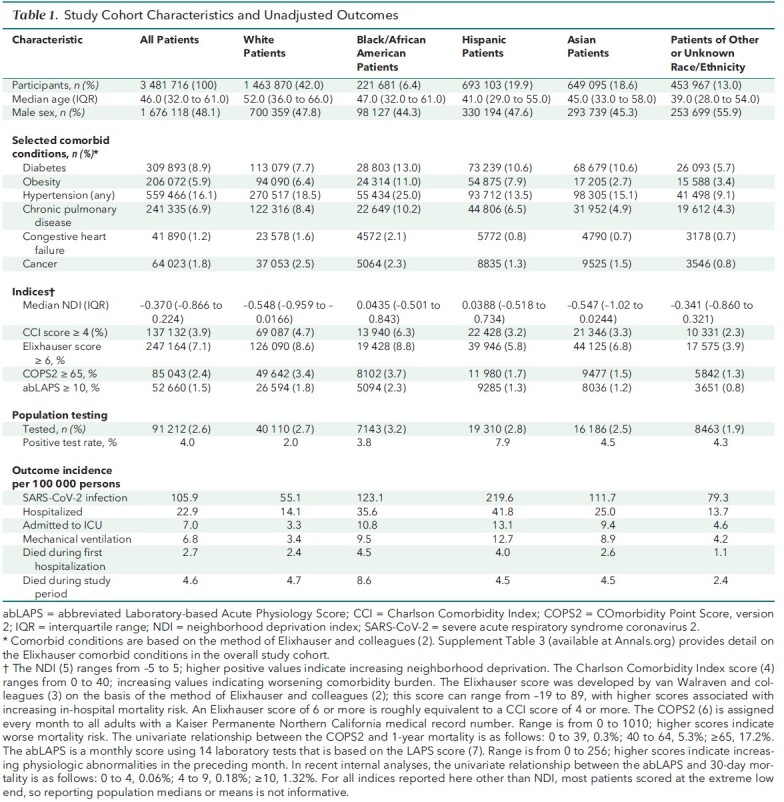
The low-risk COPS2/abLAPS comorbidity group included 2 765 338 members; the medium-risk group, 369 530; and the high-risk group, 346 848. The proportion of members who were in the low-risk comorbidity group was 74% of White persons, 74% of Black/African American persons, 84% of Hispanic persons, 83% of Asian persons, and 89% of those of other or unknown race (Supplement Table 2). White persons and Asian persons lived in more advantaged neighborhoods, as evidenced by lower NDI, than did Black/African American persons, Hispanic persons, and persons of other/unknown races.
A total of 91 212 (2.6%) members were tested for SARS-CoV-2 infection, of whom 3686 (4.0%) had positive results, for an incidence of 105.9 per 100 000 persons (range across racial groups, 55.1 to 219.6). Unadjusted testing rates were relatively similar across racial groups except for those with other/unknown race. Unadjusted rates of positive SARS-CoV-2 tests (incidence) were lower for White persons. Hospitalization, ICU admission, assisted ventilation, in-hospital death, and total deaths among infected patients during the study period were higher among African American persons, Hispanic persons, and Asian persons.
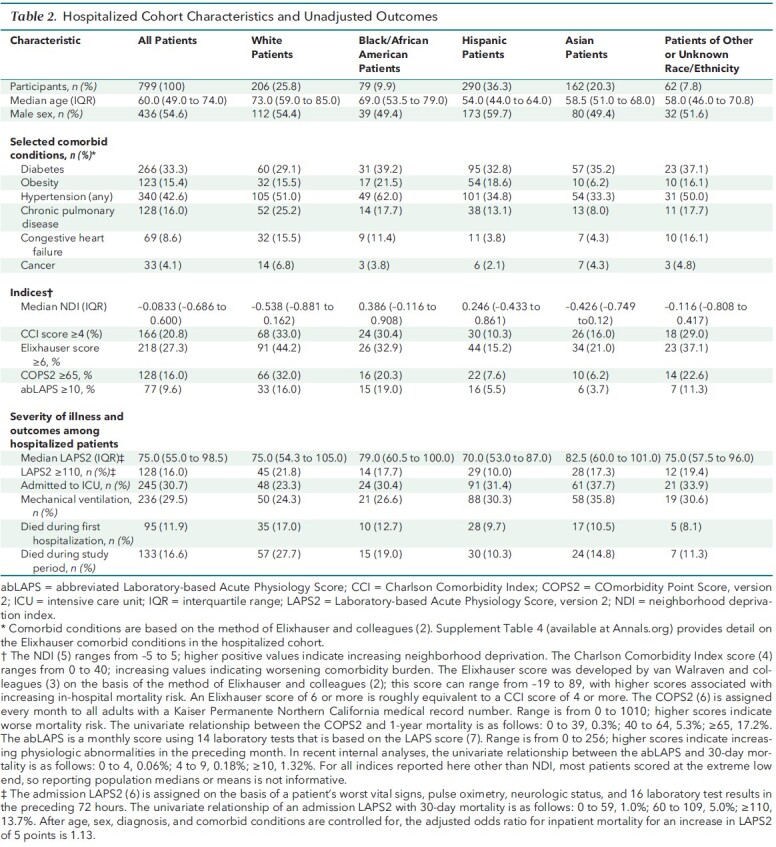
Unadjusted patient characteristics and outcomes among hospitalized patients are shown in Table 2, and comorbidities are shown in Supplement Table 4. Compared with other racial/ethnic groups, White patients were older and had a higher comorbidity burden; they also came from more advantaged neighborhoods than did Black/African American persons, Hispanic persons, and Asian persons. Asian persons and Black/African American persons had somewhat higher unadjusted admission severity of illness scores (median LAPS2, 82 and 79, respectively, versus 70 for Hispanic persons and 75 for White persons). Unadjusted mortality rates were highest for White persons (17.0% during their first hospitalization and 27.7% during the study period), followed by Black/African American persons (12.7% and 19.0%, respectively), Asian persons (10.5% and 14.8%), persons of other/unknown race (8.1% and 11.3%), and Hispanic persons (9.7% and 10.3%).
Table 2. Hospitalized Cohort Characteristics and Unadjusted Outcomes.
In multivariate modeling (Table 3; Supplement Table 5), decreasing age, female sex, and increasing comorbidity burden were associated with testing, as were Black/African American and Hispanic race. Increasing NDI was associated with decreased likelihood of being tested, as was being of other/unknown race. Infection was much more likely among non-White persons, with the highest adjusted odds ratios (aORs) found among Hispanic persons (aOR, 3.93 [95% CI, 3.59 to 4.30]) and Asian persons (2.19 [CI, 1.98 to 2.42]). In sensitivity analysis, race remained a strong predictor of infection within geographic clusters even when NDI was included (Supplement 2). The risk for hospitalization was elevated for Black/African American persons, Hispanic persons, and Asian persons relative to White persons (aOR range, 1.42 to 1.47) but was not elevated for persons of other/unknown race. With respect to severity of illness on admission, LAPS2s were significantly elevated among Asian persons (12.6 points compared with White persons), persons of other/unknown race (11.8), and Hispanic persons (6.7). However, none of the other racial/ethnic groups had statistically significant aORs for in-hospital death or death during the study period compared with White persons.
Table 3. Multivariable Analyses to Risk Factors for SARS-CoV-2 Testing, Incidence, and Infection Outcomes.
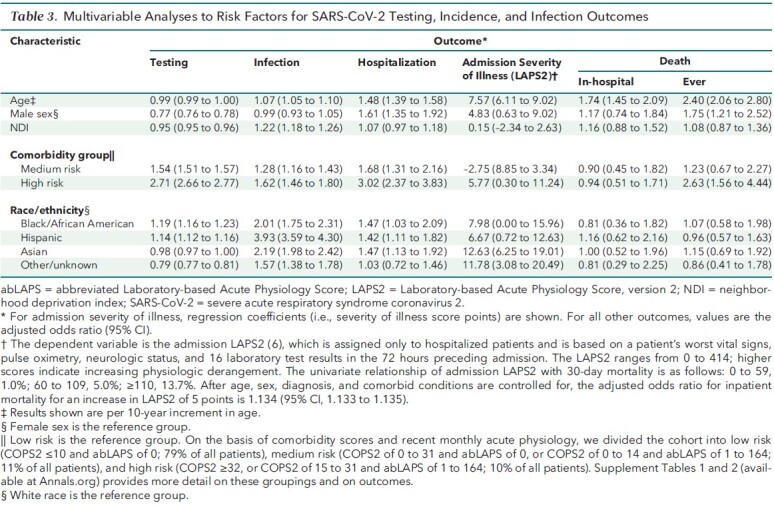
Table 4 shows the relative contributions of the key predictors in the multivariate models. With respect to testing, most of the model explanatory power was due to sex (12.8%) and comorbidity/acute physiology (77.9%), with race/ethnicity only accounting for 8.1%. In contrast, the likelihood of infection was largely due to race, with 80.3% of the model explanatory power. For the remaining outcomes, the most important predictor was age, with race only contributing 4.5% for hospitalization, 12.8% for admission LAPS2, 2.3% for in-hospital death, and 0.4% for death during the study period.
Table 4. Percent Relative Contribution of Predictors for COVID-19 Outcomes*.
Our geographic clustering analyses (Supplement 2) found that infections were clustered in areas with higher proportions of non-White members. This was evident among members with low risk as well as among members with a significant comorbidity burden.
Discussion
This study reports and quantifies racial and ethnic differences across aspects of the care continuum, from testing to mortality, in the COVID-19 pandemic. Race/ethnicity was the most important factor in a patient's likelihood of becoming infected with SARS-CoV-2. Compared with White persons, the other racial groups had increased incidence of SARS-CoV-2 infection that persisted after controlling for age, sex, NDI, and preexisting comorbidity burden. Infection clusters were located in areas with higher proportions of non-White members. After infection, race/ethnicity made a smaller contribution than other factors with respect to severity of illness on admission, hospitalization, and death. Non-White persons had higher adjusted admission severity of illness scores, suggesting that future efforts to improve outcomes could focus on patients' initial contact with the health system when they first suspect SARS-CoV-2 infection.
Several studies have reported that non-White persons are overrepresented among infected patients, hospitalized patients, and deaths after SARS-CoV-2 infection (17–21). It has also been observed that hospitalization rates for SARS-CoV-2 infection during the acute phase of the pandemic in New York City and Massachusetts were highest in areas with greater African American and Hispanic populations (22, 23). Our study has the unique advantage of being based on a defined population of patients at risk and having followed this cohort through the full range of outcomes from testing to death.
Studies that quantified risk-adjusted, race/ethnicity-specific hospitalization risk have reported similar results to ours. Using Sutter Health data in California, Azar and colleagues (17) found directionally similar results to ours with respect to hospitalization among African American persons (aOR, 2.7 [P = 0.007], compared with 1.47 [CI, 1.03 to 2.09] in our cohort), but, in contrast to our study, they did not find that infected Hispanic persons and Asian persons were at higher risk for hospitalization. Petrilli and coworkers (18) found an elevated hospitalization risk among Hispanic persons only. Like our study, articles providing risk-adjusted race- and ethnicity-specific mortality data in hospitalized patients with SARS-CoV-2 infection have reported that the effect of race/ethnicity is substantially decreased or even absent (20, 24). However, the OpenSAFELY study, which used an at-risk population of 17.3 million patients but did not provide hospitalization data, reported increased COVID-19–related mortality among non-White patients that persisted after risk adjustment (21). More recently, a report using data from the Epic system also showed results broadly similar to ours (25).
Our study expands on the recent literature in other ways. Among patients with SARS-CoV-2 infection, racial/ethnic variation is primarily driven by patients' comorbidity burden, because the risk attributable to race and ethnicity is substantially reduced when comorbidity is added to the models. In our cohort, non-White persons tended to be younger than White persons. However, non-White persons had elevated rates for other risk factors for infection (comorbid conditions and neighborhood deprivation). Many factors may contribute to comorbidity and intrinsic risk (26), including the totality of ways in which societies foster racial discrimination, through mutually reinforcing inequitable systems (structural racism) (27–29). Our data are consistent with the notion that one of the key proximate mediating mechanisms for variation in outcomes among non-White persons is having excess comorbidity (30, 31).
Our observation that admission severity of illness was 6 to 12 points higher in non-White persons points to possible loci for health system interventions. The severity of illness score we used, LAPS2, was based on variables reflecting the 72 hours preceding discharge from the emergency department (that is, when the patient physically entered a non–emergency department hospital unit). Thus, the most likely potential reason for higher scores is differential time to presentation for emergency department or outpatient care, although we cannot exclude other factors that could lead to delays in hospitalization. Understanding temporal factors in patients' decision to seek care, including quantification of possible racial disparities, could lead to changes in advice and referral protocols, particularly if stronger efforts were made to incorporate culturally competent care into such protocols.
Our study has limitations. First, our data derive from the early stage of the pandemic, a period characterized by rapidly changing understanding of the disease and diagnosis and treatment patterns. At present, we cannot quantify the potential sampling biases associated with the change in testing availability that occurred in the latter part (April and May) of our study period. In addition, KPNC, a health system with an unusually high degree of integration, cares for an insured population, so our findings may not be generalizable to other settings with worse access to or coordination of care, nor may they be applicable to other underserved, unemployed populations living in impoverished areas. However, this also permitted us to conduct a study in which the population's access to care was relatively equal. Given time pressure and limited resources, we could not measure other possible factors (such as trust in the health care system) that could affect patients' willingness to interact with the health system.
Nonetheless, our findings are robust and suggest that health systems that aim to decrease racial and ethnic disparities should expand their focus on community interventions to prevent the spread of infection to vulnerable populations, particularly through community education, contact tracing, and public health partnerships. Additional interventions in the initial phase of care before hospitalization, including standardized procedures for initial clinical contact through virtual outreach and culturally sensitive workflows, may also present a critical opportunity to mitigate the effects of racial and ethnic disparities among patients with SARS-CoV-2 infection.
Supplementary Material
Footnotes
This article was published at Annals.org on 9 February 2021
References
- 1. Artiga S, Corallo B, Pham O. Racial disparities in COVID-19: key findings from available data and analysis. Kaiser Family Foundation. 17 August 2020. Accessed at www.kff.org/racial-equity-and-health-policy/issue-brief/racial-disparities-covid-19-key-findings-available-data-analysis/ on 17 August 2020.
- 2. Elixhauser A , Steiner C , Harris DR , et al. Comorbidity measures for use with administrative data. Med Care. 1998;36:8-27. [PMID: ] [DOI] [PubMed] [Google Scholar]
- 3. van Walraven C, Austin PC, Jennings A, et al.. A modification of the Elixhauser comorbidity measures into a point system for hospital death using administrative data. Med Care. 2009;47:626-33. [PMID: ] doi: 10.1097/MLR.0b013e31819432e5 [DOI] [PubMed] [Google Scholar]
- 4. Deyo RA , Cherkin DC , Ciol MA . Adapting a clinical comorbidity index for use with ICD-9-CM administrative databases. J Clin Epidemiol. 1992;45:613-9. [PMID: ] [DOI] [PubMed] [Google Scholar]
- 5. Messer LC , Laraia BA , Kaufman JS , et al. The development of a standardized neighborhood deprivation index. J Urban Health. 2006;83:1041-62. [PMID: ] [DOI] [PMC free article] [PubMed] [Google Scholar]
- 6. Escobar GJ , Gardner MN , Greene JD , et al. Risk-adjusting hospital mortality using a comprehensive electronic record in an integrated health care delivery system. Med Care. 2013;51:446-53. [PMID: ] doi: 10.1097/MLR.0b013e3182881c8e [DOI] [PubMed] [Google Scholar]
- 7. Escobar GJ , Greene JD , Scheirer P , et al. Risk-adjusting hospital inpatient mortality using automated inpatient, outpatient, and laboratory databases. Med Care. 2008;46:232-9. [PMID: ] doi: 10.1097/MLR.0b013e3181589bb6 [DOI] [PubMed] [Google Scholar]
- 8. van Walraven C, Escobar GJ, Greene JD, et al.. The Kaiser Permanente inpatient risk adjustment methodology was valid in an external patient population. J Clin Epidemiol. 2010;63:798-803. [PMID: ] doi: 10.1016/j.jclinepi.2009.08.020 [DOI] [PubMed] [Google Scholar]
- 9. Escobar GJ , Greene JD , Gardner MN , et al. Intra-hospital transfers to a higher level of care: contribution to total hospital and intensive care unit (ICU) mortality and length of stay (LOS). J Hosp Med. 2011;6:74-80. [PMID: ] doi: 10.1002/jhm.817 [DOI] [PubMed] [Google Scholar]
- 10. Escobar GJ , Ragins A , Scheirer P , et al. Nonelective rehospitalizations and postdischarge mortality: predictive models suitable for use in real time. Med Care. 2015;53:916-23. [PMID: ] doi: 10.1097/MLR.0000000000000435 [DOI] [PMC free article] [PubMed] [Google Scholar]
- 11. Escobar GJ , Plimier C , Greene JD , et al. Multiyear rehospitalization rates and hospital outcomes in an integrated health care system. JAMA Netw Open. 2019;2:e1916769. [PMID: ] doi: 10.1001/jamanetworkopen.2019.16769 [DOI] [PMC free article] [PubMed] [Google Scholar]
- 12. Knaus WA , Wagner DP , Draper EA , et al. The APACHE III prognostic system: risk prediction of hospital mortality for critically ill hospitalized adults. Chest. 1991;100:1619-36. [PMID: ] [DOI] [PubMed] [Google Scholar]
- 13. Harrell FE Jr. Unitless index of adequacy of a subset of predictors, In: Regression Modeling Strategies: With Applications to Linear Models, Logistic and Ordinal Regression, and Survival Analysis. Springer; 2015:207-8.
- 14. Lieu TA , Ray GT , Klein NP , et al. Geographic clusters in underimmunization and vaccine refusal. Pediatrics. 2015;135:280-9. [PMID: ] doi: 10.1542/peds.2014-2715 [DOI] [PubMed] [Google Scholar]
- 15. Han J , Zhu L , Kulldorff M , et al. Using Gini coefficient to determining optimal cluster reporting sizes for spatial scan statistics. Int J Health Geogr. 2016;15:27. [PMID: ] doi: 10.1186/s12942-016-0056-6 [DOI] [PMC free article] [PubMed] [Google Scholar]
- 16. Kulldorff M. A spatial scan statistic. Communications in Statistics: Theory and Methods. 1997;26:1481-96.
- 17. Azar KMJ , Shen Z , Romanelli RJ , et al. Disparities in outcomes among COVID-19 patients in a large health care system in California. Health Aff (Millwood). 2020;39:1253-1262. [PMID: ] doi: 10.1377/hlthaff.2020.00598 [DOI] [PubMed] [Google Scholar]
- 18. Petrilli CM , Jones SA , Yang J , et al. Factors associated with hospital admission and critical illness among 5279 people with coronavirus disease 2019 in New York City: prospective cohort study. BMJ. 2020;369:m1966. [PMID: ] doi: 10.1136/bmj.m1966 [DOI] [PMC free article] [PubMed] [Google Scholar]
- 19. Gross CP , Essien UR , Pasha S , et al. Racial and ethnic disparities in population-level Covid-19 mortality [Letter]. J Gen Intern Med. 2020;35:3097-3099. [PMID: ] doi: 10.1007/s11606-020-06081-w [DOI] [PMC free article] [PubMed] [Google Scholar]
- 20. Price-Haywood EG , Burton J , Fort D , et al. Hospitalization and mortality among Black patients and White patients with Covid-19. N Engl J Med. 2020;382:2534-2543. [PMID: ] doi: 10.1056/NEJMsa2011686 [DOI] [PMC free article] [PubMed] [Google Scholar]
- 21. Williamson EJ , Walker AJ , Bhaskaran K , et al. Factors associated with COVID-19-related death using OpenSAFELY. Nature. 2020;584:430-436. [PMID: ] doi: 10.1038/s41586-020-2521-4 [DOI] [PMC free article] [PubMed] [Google Scholar]
- 22. Wadhera RK , Wadhera P , Gaba P , et al. Variation in COVID-19 hospitalizations and deaths across New York City boroughs. JAMA. 2020;323:2192-2195. [PMID: ] doi: 10.1001/jama.2020.7197 [DOI] [PMC free article] [PubMed] [Google Scholar]
- 23. Figueroa JF, Wadhera RK, Lee D, et al. Community-level factors associated with racial and ethnic disparities in COVID-19 Rates In Massachusetts. Health Aff (Millwood). 2020:101377hlthaff202001040. [DOI] [PMC free article] [PubMed]
- 24. Tartof SY , Qian L , Hong V , et al. Obesity and mortality among patients diagnosed with COVID-19: results from an integrated health care organization. Ann Intern Med. 2020;173:773-781. doi: 10.7326/M20-3742 [DOI] [PMC free article] [PubMed] [Google Scholar]
- 25. Rubin-Miller L Alban C, Artiga S, et al. COVID-19 racial disparities in testing, infection, hospitalization, and death: analysis of Epic patient data. Kaiser Family Foundation. 16 September 2020. Accessed at www.kff.org/coronavirus-covid-19/issue-brief/covid-19-racial-disparities-testing-infection-hospitalization-death-analysis-epic-patient-data/ on 16 September 2020.
- 26. Selden TM , Berdahl TA . COVID-19 and racial/ethnic disparities in health risk, employment, and household composition. Health Aff (Millwood). 2020;39:1624-1632. [PMID: ] doi: 10.1377/hlthaff.2020.00897 [DOI] [PubMed] [Google Scholar]
- 27. Phelan JC , Link BG . Controlling disease and creating disparities: a fundamental cause perspective. J Gerontol B Psychol Sci Soc Sci. 2005;60 Spec No 2:27-33. [PMID: ] [DOI] [PubMed] [Google Scholar]
- 28. Bailey ZD , Krieger N , Agénor M , et al. Structural racism and health inequities in the USA: evidence and interventions. Lancet. 2017;389:1453-1463. [PMID: ] doi: 10.1016/S0140-6736(17)30569-X [DOI] [PubMed] [Google Scholar]
- 29. Hardeman RR , Medina EM , Kozhimannil KB . Structural racism and supporting Black lives—the role of health professionals. N Engl J Med. 2016;375:2113-2115. [PMID: ] [DOI] [PMC free article] [PubMed] [Google Scholar]
- 30. Assari S . Number of chronic medical conditions fully mediates the effects of race on mortality; 25-year follow-up of a nationally representative sample of Americans. J Racial Ethn Health Disparities. 2017;4:623-631. [PMID: ] doi: 10.1007/s40615-016-0266-4 [DOI] [PMC free article] [PubMed] [Google Scholar]
- 31. Assari S . The benefits of higher income in protecting against chronic medical conditions are smaller for African Americans than Whites. Healthcare (Basel). 2018;6. [PMID: ] doi: 10.3390/healthcare6010002 [DOI] [PMC free article] [PubMed] [Google Scholar]
Associated Data
This section collects any data citations, data availability statements, or supplementary materials included in this article.


