Mutations in the actin-regulatory protein Hem-1 result in primary immunodeficiency disease in humans. Using murine models, Suwankitwat et al. show that myeloid-specific Hem-1 is essential for the development of alveolar macrophages and protection against influenza A virus and Streptococcus pneumoniae.
Abstract
Hematopoietic protein-1 (Hem-1) is a hematopoietic cell–specific actin-regulatory protein. Loss-of-function (LOF) variants in the NCKAP1L gene encoding Hem-1 have recently been found to result in primary immunodeficiency disease (PID) in humans, characterized by recurring respiratory infections, asthma, and high mortality. However, the mechanisms of how Hem-1 variants result in PID are not known. In this study, we generated constitutive and myeloid cell–specific Nckap1l-KO mice to dissect the importance of Hem-1 in lung immunity. We found that Hem-1–deficient mice accumulated excessive surfactant and cell debris in airways (pulmonary alveolar proteinosis) due to impaired development of alveolar macrophages (AMs) and reduced expression of the AM differentiation factor Pparg. Residual Hem-1–deficient AMs shifted to a proinflammatory phenotype, and Hem-1–deficient neutrophils and monocytes failed to migrate normally. Myeloid cell–specific Hem-1–deficient mice exhibited increased morbidity following influenza A virus or Streptococcus pneumoniae challenge. These results provide potential mechanisms for how LOF variants in Hem-1 result in recurring respiratory diseases.
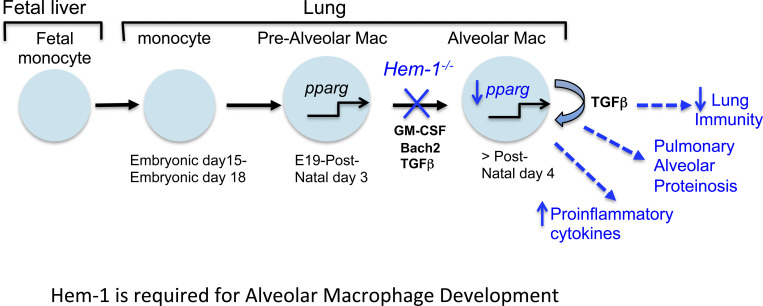
Graphical Abstract
Introduction
Reorganization of the actin cytoskeleton is important for many “active” aspects of immune responses to infection, including migration to sites of infection, formation of the phagocytic cup, and restriction of cytoplasmic vesicle release. At the heart of these processes is the coordinated, directional polymerization and depolymerization of filamentous actin (F-actin), which is initiated upon ligation of important immune receptors, including TLRs, chemokine receptors, BCRs, and TCRs, and integrins (Dominguez and Holmes, 2011). Receptor–ligand interaction leads to activation of guanine nucleotide exchange factors such as Vav, Dock2, and Dock8, which activate the Rho family of GTPases (including Rac and Cdc42; Cook et al., 2014). Active Cdc42 then recruits and activates the Wiskott-Aldrich syndrome protein (WASp) actin nucleation-promoting adapter complex, whereas active Rac predominantly activates the WASp family verprolin homologous protein (WAVE) regulatory complex 1 (WRC1) or WRC2 (Cotteret and Chernoff, 2002). In hematopoietic cells, WRC2 consists of WAVE2, hematopoietic stem/progenitor cell protein (HSPC300), Abelson-interacting protein 1/2 (Abi1/2), Cyfip1/2, and Hem-1, the only hematopoietic cell–specific WRC2 member (Hromas et al., 1991; Weiner et al., 2006). In response to immune receptor activation, WRC2 activates the actin-related protein 2/3 complex (Arp2/3), which stimulates actin nucleation and induction of actin-regulated processes.
The importance of actin regulation in protective immunity is underscored by observations that mutations in actin-regulatory proteins can result in primary immunodeficiency diseases (PIDs) in humans (Janssen et al., 2016). For example, loss-of-function (LOF) variants in WASP, WIP (WASp-interacting protein), RAC2, DOCK2, and DOCK8 have been noted to cause PIDs characterized by disruption of myeloid and lymphoid lineage functions, often leading to autoimmune disease and/or cancer (see Burns et al., 2017 for review). Although PIDs due to variants in WRC components had not been previously noted, five children from four unrelated kindreds were recently described whereby LOF variants in the NCKAPL1 gene resulted in severe PID (Cook et al., 2020). Affected children presented with recurring respiratory and skin infections, asthma, and high mortality. However, the molecular and cellular mechanisms of how Hem-1 regulates protective immunity are still poorly defined.
In this study, we generated constitutive and myeloid cell–specific Hem-1–deficient mice to uncover the cell-specific requirements of the WRC in overall immunity. Our results reveal that Hem-1 is required for the normal development and functions of resident alveolar macrophages (AMs), including the prevention of pulmonary alveolar proteinosis (PAP), an interstitial lung disease characterized by the accumulation of cell debris and surfactant protein in airways (Kelly and McCarthy, 2020). Myeloid cell–specific disruption of Hem-1 also resulted in increased AM proinflammatory cytokine release and increased sensitivity to influenza A virus (IAV) and pneumococcal challenge.
Results and discussion
Generation of Hem-1–deficient mice
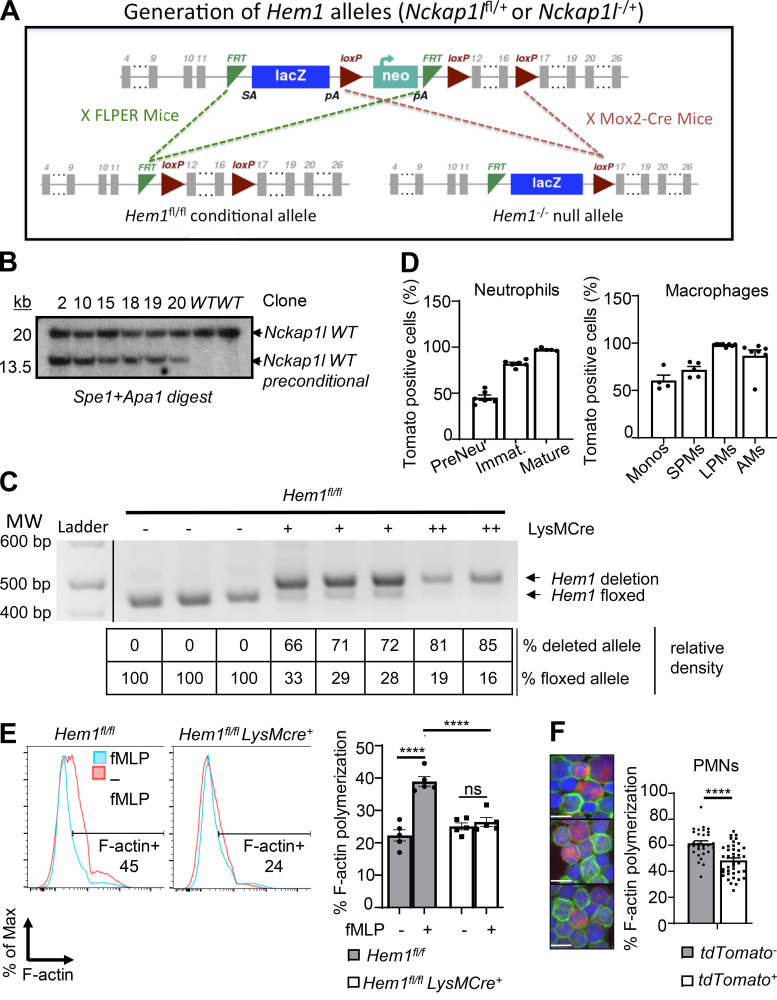
To delete Hem-1 in a cell type–specific manner, an Nckap1l (herein Hem1) floxed-targeting construct (Fig. S1 A) was electroporated into embryonic stem (ES) cells, and six clones were confirmed to be correctly targeted (Fig. S1 B). Hem1fl/+ mice were generated by crossing Hem1 preconditional mice with FLPER recombinase mice (Kaartinen and Nagy, 2001). To generate “constitutive” Hem1−/− mice, preconditional mice were bred to Mox2-Cre, which deleted exons 12–16 in germline cells. To delete Hem-1 in myeloid cells, Hem1 floxed mice were bred to Lyz2-Cre (also known as LysMCre) mice, which express the Cre enzyme in myeloid cells (macrophages, monocytes, and neutrophils) and to a lesser extend in dendritic cells (Clausen et al., 1999). Mice were generated that were heterozygous (Hem1fl/flLysMCre+) or homozygous for LysMCre (Hem1fl/fl LysMCre+/+) and thus expressed higher levels of Cre. Analyses of bone marrow (BM)–derived macrophages (BMDMs) using semiquantitative PCR indicated ∼70% deletion in Hem1fl/flLysMCre+ mice and ∼85% deletion in Hem1fl/fl LysMCre+/+ mice (Fig. S1 C). To assess Cre expression in different cell populations, Hem1fl/flLysMCre+ mice were bred to tdTomato mice, whereby Cre activities were tracked by expression of RFP (Madisen et al., 2010). Analysis of Hem1fl/flLysMCre+tdTomato mice indicated strong Cre-mediated deletion in immature and mature neutrophils (>95%), large and small peritoneal macrophages (LPMs and SPMs), and AMs (∼95%; Fig. S1 D). Analyses of neutrophils from Hem1fl/flLysMCre+ mice and Hem1fl/flLysMCre+tdTomato mice, using flow cytometry and fluorescent microscopy, revealed impaired F-actin polymerization following fMLP stimulation (Fig. S1, E and F). These results indicated that Hem1 is effectively disrupted in myeloid cells from Hem1fl/flLysMCre+ mice and Hem1fl/fl LysMCre+/+ mice.
Figure S1.
Generation of constitutive and myeloid cell–specific Hem1-null mice. (A) Strategy used to generate Hem1 conditional mice. The Hem1fl/fl conditional targeting construct was generated by flanking exons 12–16 of the Nckap1l gene with loxP sites, with the addition of a lacZ reporter and neomycin selection cassette flanked by flippase recognition target (FRT) sites. Hem1 preconditional mice were bred to FLPER mice to delete the lacZ and Neo cassettes, resulting in Hem1 floxed conditional mice. Hem1−/− mice were generated by breeding Hem1 preconditional mice to Mox2-Cre mice, resulting in deletion of the Neo and FRT cassettes. (B) 6 ES cell clones were tested by Southern blotting and were confirmed to be correctly targeted to the Nckap1l locus. (C) PCR analysis of genomic DNA isolated from Hem1fl/flLysMCre+ BMDMs. Shown are the relative percentage of deleted versus floxed alleles based on semiquantitative densitometry. (D) Bar graphs show the percentages of RFP-positive cells reflective of Cre expression in the indicated populations of myeloid cells derived from Hem1fl/flLysMCre+tdTomato mice. (E) Flow cytometric histogram of BM neutrophils showing phalloidin staining (reflective of F-actin) with and without 1 μM fMLP stimulation for 2 min. Bar graph shows the percentage of phalloidin+ cells. (F) Fluorescence imaging of neutrophils from Hem1fl/flLysMCre+ tdTomato+ mice showing Cre-expressing cells (red), FITC phalloidin (green), and nuclei staining DAPI (blue; left) with bar graph showing the percentage of F-actin polymerization using ImageJ (right). Tomato+ cells have less F-actin polymerization (green). Scale bars, 10 µm. Data shown are mean ± SEM from n = 5–7 mice (6–12 wk old)/genotype representative of >2 independent exps. ****, P < 0.0001; Student’s two-tailed t test. Immat., immature; Monos, monocytes; PMNs, polymorphonuclear cells.
Loss of Hem-1 results in neutrophilia, lymphopenia, and a reduction in AMs
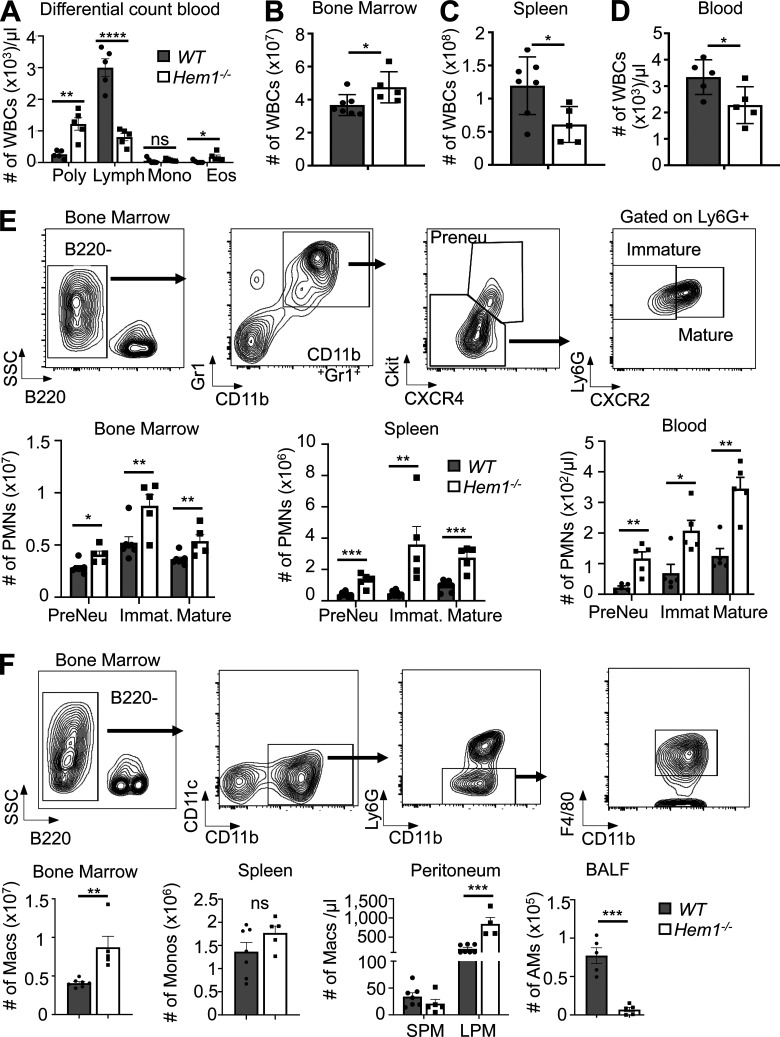
Analyses of peripheral blood (PB) from constitutive Hem1−/− mice revealed neutrophilia, lymphopenia, and eosinophilia (Fig. 1 A), which paralleled results seen in mice containing a noncoding point mutation in Hem1 (Park et al., 2012). This was associated with increased total white blood cells (WBCs) in BM (Fig. 1 B); reduced WBCs in spleen and PB at ∼8 wk of age (Fig. 1, C and D); and increased numbers of preneutrophils (PreNeu), immature, and mature neutrophils in BM, spleen, and PB (Fig. 1 E). The numbers of BM macrophages and LPMs were also increased in BM and peritoneum, respectively (Fig. 1 F). In contrast, the numbers of resident AMs in bronchoalveolar lavage fluid (BALF) were significantly decreased (Fig. 1 F).
Figure 1.
Constitutive disruption of Hem1 results in increased myelopoiesis, neutrophilia, eosinophilia, and lymphopenia. Bar graphs of data from 6–12-wk-old Hem1−/− and WT mice. (A) Complete blood and differential counts. Poly, neutrophils. (B–D) The number of WBCs in BM (B), spleen (C), and blood (D) as determined by flow cytometry. (E and F) Gating strategy and bar graphs depicting the number of PreNeu, immature (Immat.), and mature neutrophils in BM, spleen, and blood (E) and the number of monocytes (Monos) and macrophages (Macs) in BM, spleen, peritoneum (SPMs, CD19−CD11c−CD11b+F4/80int; LPMs, CD19−CD11c−CD11b+F4/80hi), and airway (singlet gated, CD45.2+ CD11c+SiglecF+CD11bintCD64+; Misharin et al., 2013; F). Data shown are mean ± SEM from n = 5–7 mice/genotype, six or more independent exps. *, P < 0.05; **, P < 0.01; ***, P < 0.001; ****, P < 0.0001; Student’s two-tailed t tests. Lymph, lymphocytes; Mono, monocytes; Eos, eosinophils; PMNs, polymorphonuclear cells; SSC, side scatter.
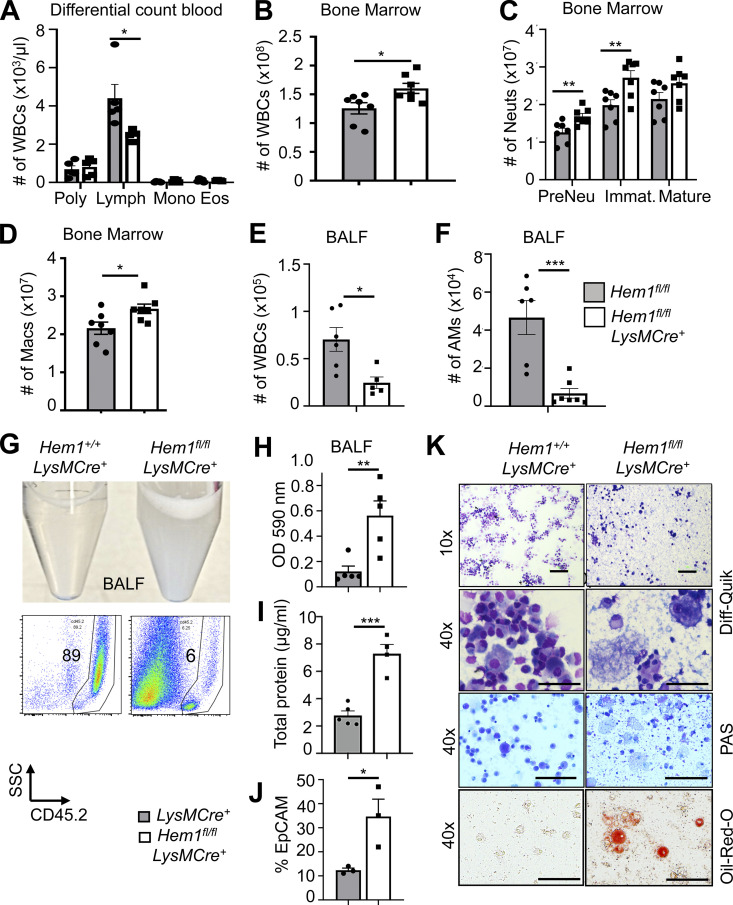
To probe the cell-autonomous roles of Hem-1 in myeloid cells, we assessed the numbers of developing myeloid cells in PB, BM, spleen (not shown), and BALF from Hem1fl/flLysMCre+, Hem1fl/flLysMCre+/+, and control mice. We found that the total numbers of WBCs, neutrophils, and monocytes were increased in BM but not PB compared with control mice (Fig. 2, A–D). Similar to Hem1−/− mice, the number of WBCs and AMs in BALF was decreased in Hem1fl/flLysMCre+ mice relative to control mice (Fig. 2, E and F). BALF from Hem1fl/flLysMCre+ mice was much more opaque (Fig. 2 G, top) and was manifested by increased CD45.2negSSClow cell debris (Fig. 2 G, bottom), increased OD at 590 nm (Fig. 2 H), increased total protein (Fig. 2 I), and increased percentage of epithelial cell adhesion molecule–positive (EpCAM+) epithelial cells (Fig. 2 J). Cytospin analyses of BALF revealed increased debris, dead cells, extruded nuclei, and foamy lipid within AMs as evaluated using Diff-Quik–, periodic acid–Schiff-, and Oil Red O–stained preparations (Fig. 2 K).
Figure 2.
Myeloid-specific disruption of Hem1 results in lymphopenia, increased myelopoiesis, and decreased AMs, resulting in PAP. Bar graphs of data derived from Hem1fl/flLysMCre+ and Hem1fl/fl control mice. (A) Complete blood and differential counts. Poly, neutrophils. (B) Total WBC number in BM. (C) Total neutrophil (Neut) number in BM. Immat., immature. (D) Total macrophage (Macs) number in BM (gated as in Fig. 1, E and F). (E) Total WBC number in BALF. (F) Total number of AMs (singlet gated, CD45.2+CD11c+SiglecF+CD11bintCD64+) in BALF. (G) Representative photograph of BALF (top) and flow histogram of BALF showing CD45.2 percentages and SSCloCD45.2− debris (bottom). (H–J) Bar graphs depicting BALF turbidity assessed by OD at 590 nm (H), total protein in BALF measured by Bradford assay (I), and percentage of EpCAM+ cells in BALF by flow cytometry (J). (K) Representative microscope images of BALF cytospins stained with Diff-Quik, periodic acid–Schiff (PAS), and Oil Red O. Scale bars, 100 µm. The data represent the mean ± SEM from n = 4–7 mice (6–12 wk old)/genotype, ≥ 5 independent exps. *, P < 0.05; **, P < 0.01; ***, P < 0.001; Student’s two-tailed t tests. Lymph, lymphocytes; Mono, monocytes; Eos, eosinophils; SSC, side scatter.
Hem-1 is required for the development of AMs
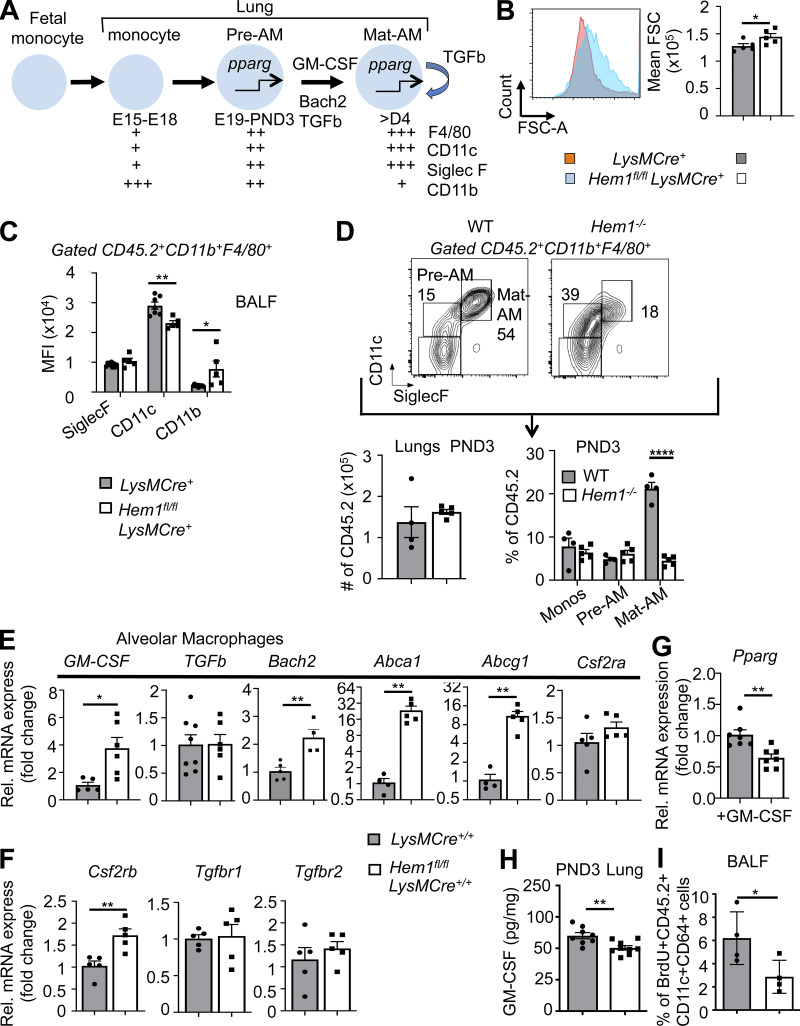
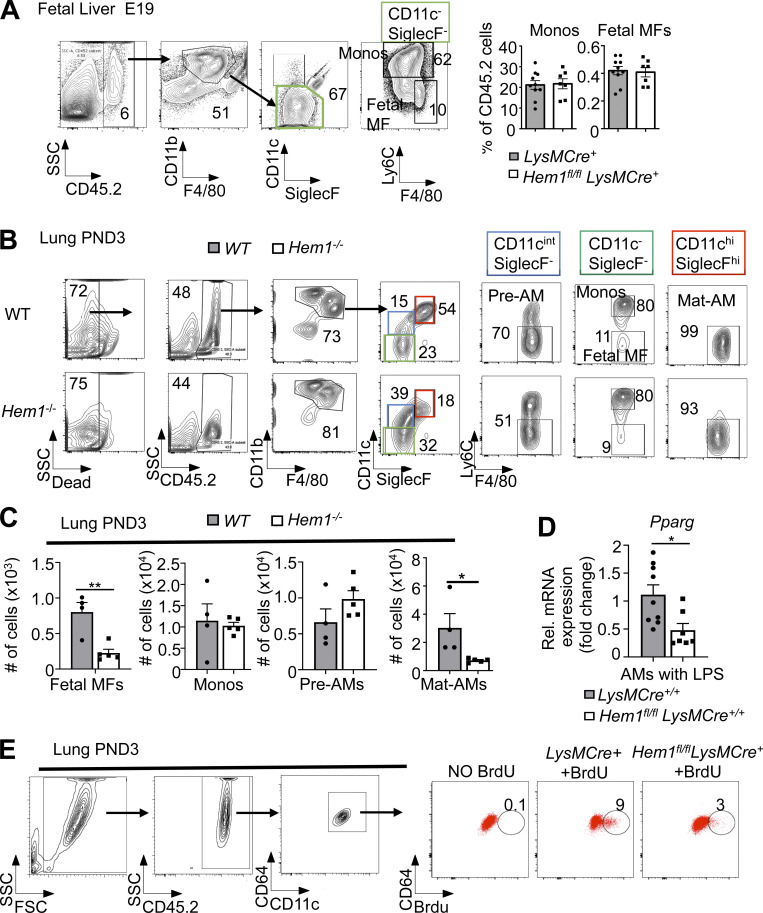
Long-lived tissue-resident AMs are uniquely generated around embryonic day 15 (E15), when fetal monocytes (FMs) migrate from fetal liver (FL) to lungs, where the cells differentiate into pre-AMs in response to GM-CSF and TGFβ produced by alveolar epithelial cells, FMs, and AMs (Yu et al., 2017; Kopf et al., 2015; Fig. 3 A). Up-regulation of the nuclear receptor peroxisome proliferator–activated receptor-γ (PPARG) by GM-CSF and TGFβ then induces a transcriptional program that instructs the development of pre-AMs into mature AMs (Mat-AMs; Hashimoto et al., 2013; Chen et al., 1988; Schneider et al., 2014a). Mature resident AMs, which can be distinguished from shorter-lived adult monocyte-derived AMs by high expression of CD11c and SiglecF, are then maintained throughout life by self-renewal with little contribution from circulating BM-derived monocytes. To define where AM development is affected, we first harvested FL cells from E19 Hem1fl/flLysMCre+ and LysMCre+ embryos and found that the representation of FMs and fetal macrophages was equivalent (Fig. S2 A). We next assessed the representation of monocytes, macrophages, pre-AMs, and AMs from postnatal day 3 (PND3) lungs from WT, Hem1−/−, Hem1fl/flLysMCre+, and Hem1fl/fl pups when AM development is maximal (Todd et al., 2016). Flow analyses revealed that Hem1-deficient AMs were larger in size (Fig. 3 B) and expressed lower levels of CD11c and higher CD11b, indicative of immaturity (Fig. 3 C). The frequencies of monocytes and pre-AMs in the lungs from WT and Hem1−/− mice were equivalent (Fig. 3 D; and Fig. S2, B and C). However, the percentages and the number of AMs were significantly decreased in lung tissue from Hem1−/− versus WT mice (Figs. 3 D and S2 C), consistent with impaired maturation at the pre-AM to AM stage.
Figure 3.
Hem-1 is required for the development of AMs. (A) Diagram depicting the development of tissue-resident AMs (Mat-AMs) from FMs and pre-AMs. GM-CSF, Pparg (pparg), Bach2, and TGFβ stimulate AM development (Kopf et al., 2015). (B and C) Flow cytometric analyses of AMs in BALF from adult Hem1fl/flLysMCre+ and LysMCre+ mice showing forward scatter–A (FSC-A) histogram (left) and mean FSC (right; B) and mean fluorescence intensity (MFI) of surface marker expression (C; gated as in D). (D) Gating strategy (top) and bar graphs showing the number of CD45.2+ cells (bottom left) and percentages of cells in lungs from PND3 WT and Hem1−/− mice (bottom right). (E and F) Gene expression as measured by real-time PCR in BALF-derived AMs from adult Hem1fl/flLysMCre+/+ and LysMCre+/+ mice after 24 h of LPS (10 μg/ml) stimulation. (G) Pparg expression in FACS-purified lung monocytes from PND3 Hem1fl/flLysMCre+ and LysMCre+ mice after 24 h in vitro GM-CSF (40 ng/ml) stimulation. (H) GM-CSF levels in lungs from PND3 Hem1fl/flLysMCre+ and LysMCre+ mice, as measured by ELISA. (I) Percentages of BrdU+CD45.2+CD11c+CD64+ cells in BALF from adult Hem1fl/flLysMCre+ and LysMCre+ mice after 4 d of daily BrdU injections. Shown data are mean ± SEM from n = 4–9 mice/genotype/≥2 independent exps. *, P < 0.05; **, P < 0.01; ****, P < 0.0001; Student’s two-tailed t tests. Monos, monocytes; Rel., relative.
Figure S2.
Developmental analyses of monocytes and macrophages in FL and PND3 lungs and functional analyses of adult monocytes. (A–C) Flow cytometric analysis of immune cells derived from E19 FL isolated from Hem1fl/flLysMCre+ and LysMCre+ control mice (A) and PND3 lungs isolated from WT and Hem1−/− mice (B and C). (C) Total number of monocytes (Monos; singlet gated, ghost−CD45.2+CD11bhiF4/80+CD11c−SiglecF−Ly6C+), fetal macrophages (MFs; singlet gated, ghost−CD45.2+CD11bhiF4/80+CD11c−SiglecF−Ly6C−), pre-AMs (singlet gated, ghost−CD45.2+CD11bintF4/80+CD11c+SiglecF−Ly6C−), and Mat-AMs (singlet gated, ghost−CD45.2+CD11bintF4/80+CD11c+SiglecF+Ly6C−) harvested from PND3 lung tissues. (D) Pparγ (Pparg) expression as determined by real-time PCR in AMs harvested from 6–12-wk-old Hem1fl/flLysMCre+/+ and LysMCre+/+ mice after culturing overnight in LPS (10 µg/ml). (E) Reduced BrdU incorporation by Hem-1–deficient AMs. Percentages of BrdU+CD45.2+CD11c+CD64+ cells in BALF from adult Hem1fl/flLysMCre+ and LysMCre+ mice after 4 d of daily BrdU injections. Gating strategies are shown. Data shown are mean ± SEM from n = 4–9 mice/genotype representative of >2 independent exps. *, P < 0.05; **, P < 0.01; Student’s two-tailed t test. Rel., relative; SSC, side scatter.
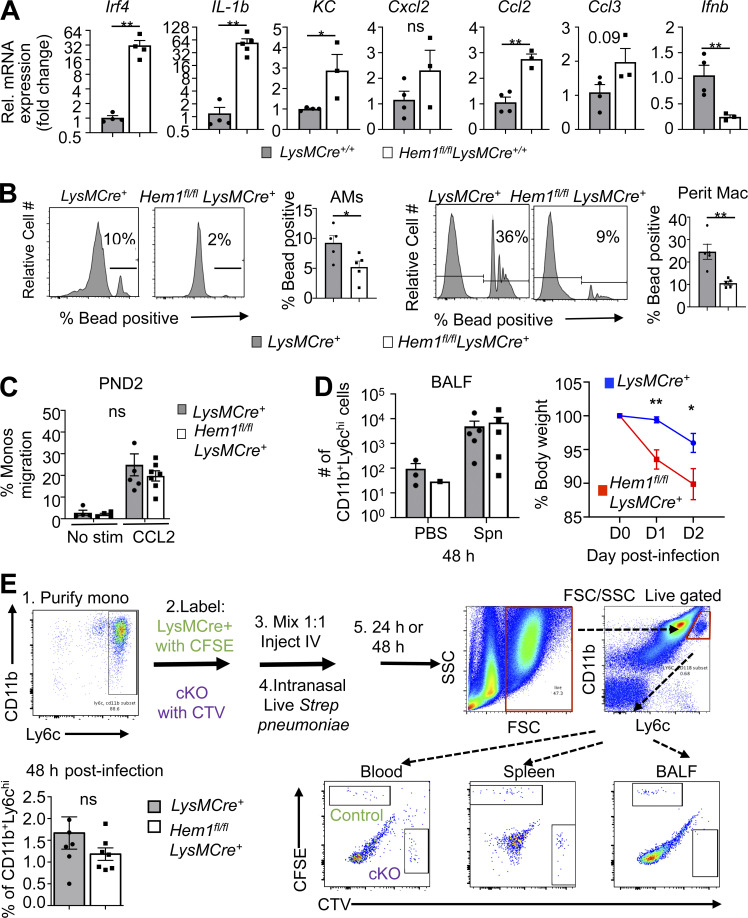
To determine why AM development is impaired following disruption of Hem-1, we assessed levels of Csf2, Csf2r (encoding GM-CSF and GM-CSF receptor), Pparg, Bach2, and other AM modulating factors in AMs from adult Hem1fl/flLysMCre+/+ and LysMCre+/+ control mice. The transcriptional repressor Bach2 in particular controls AM development and the abilities of AMs to metabolize lipids and cholesterol (Nakamura et al., 2013) by stimulating expression of the ATP-binding cassette transporters Abca1 and Abcg1, which drive efflux of excess cholesterol. mRNA levels of GM-CSF, Csf2rb, Bach2, Abca1, and Abcg1 were increased in Hem1fl/flLysMCre+/+ relative to control LPS-activated AMs, and expression of Tgfb, Tgfbr1, Tfgbr2, and Csf2ra was similar (Fig. 3, E and F). However, Pparg levels were decreased both in LPS-stimulated AMs from Hem1fl/flLysMCre+/+ mice (Fig. S2 D) and GM-CSF–stimulated PND3 lung monocytes derived from Hem1fl/flLysMCre+ mice (Fig. 3 G). Total GM-CSF protein levels were also decreased in whole-lung homogenates from Hem1fl/flLysMCre+ pups relative to control pups (Fig. 3 H), and in vivo BrdU incorporation in CD11c+CD64+ BALF cells was reduced after 4 d of daily BrdU injections (Fig. 3 I; Guilliams et al., 2013). Interestingly, AMs from adult Hem1fl/flLysMCre+/+ mice expressed higher levels of proinflammatory cytokine and chemokine mRNAs and lower levels of anti-inflammatory mRNAs relative to control AMs following stimulation with LPS (Fig. S3 A), suggesting that the remaining Hem-1–deficient immature AMs and other AMs are functionally altered. Hem1fl/flLysMCre+ AMs and peritoneal macrophages (PMs) were also deficient in their abilities to phagocytose fluorescently labeled beads following oropharyngeal (o.p.) or i.p. administration, respectively, relative to control mice (Fig. S3 B). These results suggest that disruption of Hem-1 impairs both AM development and functions.
Figure S3.
Functional analyses of fetal and adult AMs and monocytes. (A) Cytokine expression in AMs from 6–12-wk-old Hem1fl/flLysMCre+/+ and LysMCre+/+ mice after 24-h LPS (10 µg/ml) stimulation as measured by real-time PCR. (B) Flow cytometric histograms showing the relative cell numbers of AMs (gated as in Fig. S2 B) that have phagocytosed 1-µm fluorescent beads in BALF from Hem1fl/fl LysMCre+ and LysMCre+ mice after 1 h of o.p. LPS followed by 30 min of o.p. bead exposure (MOI, 20). Bar graphs show the percentages of bead-positive AMs (left). Histogram of relative cell number of PMs (ghost−CD11b+F4/80+) taking up 1-µm fluorescent beads in peritoneal fluid from Hem1fl/fl LysMCre+ and LysMCre+ mice after 1 h of i.p. bead injection (4 × 10⁶ particles; MOI, 20). Bar graph shows the percentages of bead-positive PMs (right). Data shown are mean ± SEM from n = 3–5 mice (6–12 wk old)/genotype; representative of 2–3 independent exps. *, P < 0.05; **, P < 0.01; Student’s two-tailed t test. (C) Purified monocytes (Monos) from PND2 LysMCre+ and Hem1fl/flLysMCre+ migrate similarly in Transwell plates in response to CCL2 after 4-h stimulation. (D) Hem1fl/flLysMCre+ and LysMCre+ control mice were infected with 2 × 10⁶ live Spn via oropharyngeal delivery and monocyte recruitment into BALF and measured at 48 h afterinfection (left); body weights were measured daily for 48 h after Spn infection (right). (E) Hem-1–deficient adult monocytes home normally to BALF 48 h after transfer. LysMCre+ and Hem1fl/flLysMCre+ adult monocytes were purified (Purify mono) using magnetic beads. WT monocytes were labeled with CFSE, and Hem1fl/fl LysMCre+ cells were labeled with CTV. Cells were mixed 1:1, and 2 × 10⁶ numbers of cells were injected i.v. Mice were then anesthetized; 5 × 10⁶ CFU Spn were delivered i.n. 48 h after infection; mice were euthanized and BALF collected. The percentage of CFSE+ or CTV+ of CD11bhiLy6chi cells in BALF are shown. Data shown are mean ± SEM from n = 4–7 mice/genotype representative of >2 independent exps. *, P < 0.05; **, P < 0.01; Student’s two-tailed t test. cKO, conditional KO; FSC, forward scatter; KC, keratinocyte chemoattractant; Rel., relative; SSC, side scatter.
Hem-1–deficient neutrophils and monocytes fail to migrate efficiently
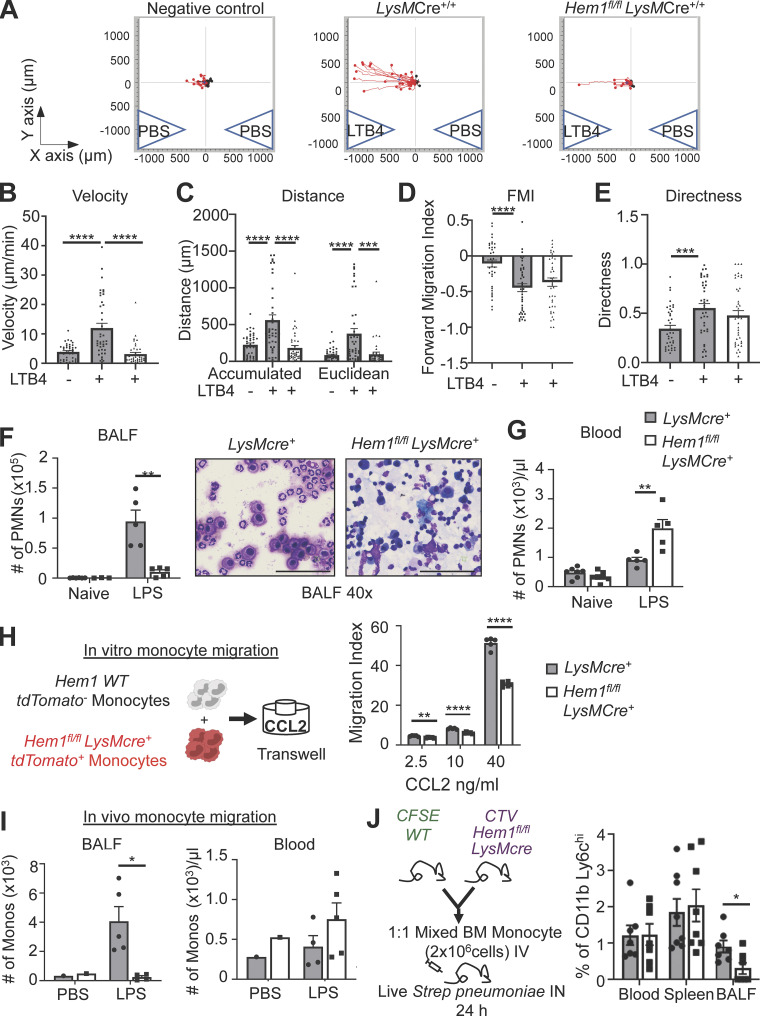
We next investigated whether disruption of Hem-1 affected monocyte and neutrophil migration, which could contribute to impaired lung immunity. Purified neutrophils from Hem1fl/flLysMCre+/+ and LysMCre+/+ control mice were loaded into µ-Slide Chemotaxis chambers, and cell migration was assessed in response to the leukotriene B4 (LTB4) chemoattractant and PBS control using time-lapse video microscopy. Loss of Hem-1 resulted in reduced velocity and distance traveled, whereas forward migration index (FMI) and directness were not affected (Fig. 4, A–E). To assess the abilities of neutrophils to migrate in vivo, we assessed neutrophil numbers in BALF and PB 2 h after o.p. LPS delivery. We found increased numbers of neutrophils in PB and reduced numbers in BALF from Hem1fl/flLysMCre+ mice compared with control mice (Fig. 4, F and G), consistent with impaired migration.
Figure 4.
Myeloid-specific Hem1 disruption impairs neutrophil and monocyte migration. (A–E) Live-cell 2D imaging of BM-derived neutrophils isolated from LysMCre+/+ and Hem1fl/fl LysMCre+/+ mice in response to LTB4 or PBS stimulation for 1 h. 40 cells were tracked per chamber. Images and bar graphs show individual cell migration (A), migration velocity (B), total distance traveled (accumulated = total distance; Euclidean = straight-line distance between start and stop points; C), FMI (D), and directness of migration (E). (F and G) In vivo neutrophil migration to BALF in response to o.p. 10-µg LPS administration. (F) Neutrophil number in BALF before and 2 h after o.p. LPS (left) and Diff-Quik staining of BALF cytospin (right). Scale bars, 100 µm. (G) Neutrophil number in PB before and after o.p. LPS. (H) Diagram depicting an in vitro competitive adult-derived monocyte Transwell migration assay between tdTomato− WT and tdTomato+ Hem1fl/flLysMCre+ monocytes in response to 4 h of CCL2 stimulation. Bar graph shows the percentage of migrated cells (stimulated versus unstimulated = migration index). (I) In vivo monocyte migration to BALF in response to o.p. LPS administration. Monocyte number (singlet gated, CD45.2+CD11b+Ly6G−Ly6C+) in BALF (left) or PB (right) 24 h after o.p. PBS or LPS. (J) Diagram of chimera BM monocytes of mice with Spn infection (left) and percentage of CD11b+Ly6Chi monocytes in blood, spleen, and BALF of WT and Hem1fl/flLysMcre+ cells. Data shown are mean ± SEM from n = 3–5 mice (6–12 wk old)/genotype, ≥2 independent exps. *, P < 0.05; **, P < 0.01; ***, P < 0.001; ****, P < 0.0001; Student’s two-tailed t tests. PMNs, polymorphonuclear cells.
To test whether disruption of Hem-1 alters fetal- and adult-derived monocyte migration, we purified adult BM monocytes from Hem1fl/flLysMCre+tdTomato+ and LysMCre+ control mice, mixed the cells 1:1, and assessed migration in response to monocyte chemotactic peptide-1 (CCL2) using Transwell plates (Fig. 4 H). We found a significant reduction in the abilities of adult Hem1fl/flLysMCre+ monocytes to migrate at all doses of CCL2, whereas FMs migrated similarly to control monocytes (Fig. S3 C). To assess whether loss of Hem-1 alters adult monocyte migration in vivo in Hem1fl/flLysMCre+/+ and LysMCre+/+ control mice, we measured monocyte recruitment to BALF 24 h after o.p. LPS or 48 h after i.n. live Streptococcus pneumoniae (Spn) administration. We found a reduction in the percentage and total number of Hem-1–deficient monocytes migrated to BALF relative to PBS control mice 24 h after LPS (Fig. 4 I). However, the percentage of cells migrated in response to Spn at 48 h was not different, despite significant reductions in body weight (BW) in Hem-1–deficient mice (Fig. S3 D). To separate the influences of the different lung environments on monocyte recruitment, we purified adult BM monocytes from Hem1fl/flLysMCre+ and LysMCre+ control mice, labeled the cells with CellTrace Violet (CTV) and CFSE dyes, and injected the cells mixed at a 1:1 ratio i.v. into WT host mice. Recipient mice were then infected with Spn i.n., and monocyte migration into BALF was assessed at 24 and 48 h after infection. Hem-1–deficient monocytes had reduced migration into BALF at 24 h (Fig. 4 J) but not 48 h (Fig. S3 E) relative to WT monocytes. These results suggest that Hem-1 is required for maximal migration of neutrophils and adult monocytes.
Hem-1 disruption increases sensitivity to IAV and Spn challenge
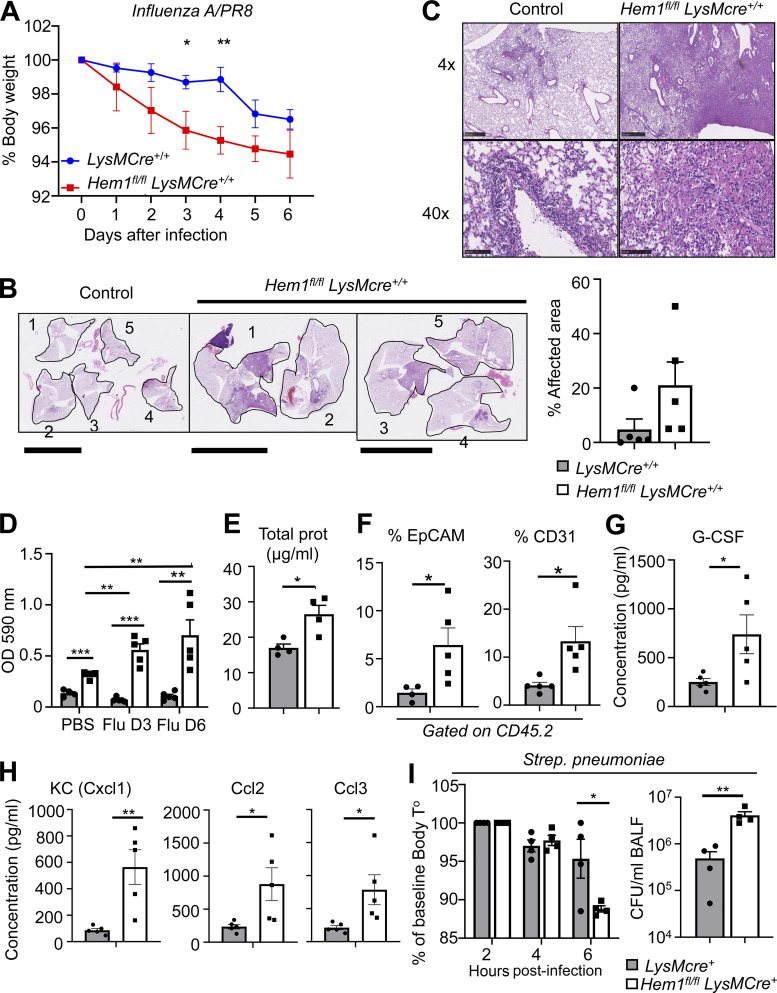
We next assessed whether myeloid cell–specific disruption of Hem-1 alters susceptibility to IAV and Spn, important community-acquired pathogens. We challenged Hem1fl/flLysMCre+/+ and control mice with 10 PFU of the IAV/PR8 strain or PBS control via o.p. instillation and measured daily BW for 6 d post infection (dpi). Hem1fl/flLysMCre+/+ mice exhibited greater daily BW loss (Fig. 5 A), despite equal IAV PFUs in lung tissues (not shown). Analyses of H&E-stained lung sections revealed that four of five Hem1fl/flLysMCre+/+ lobes had consolidating lesions involving ∼50–70% of each lobe compared with LysMCre+/+ control mice, in which two of five lobes had lesions involving <10% of each lobe (Fig. 5 B). Lesions in Hem1fl/flLysMCre+/+ mice consisted of ∼90% neutrophils and 10% mononuclear cells embedded in a coagulum of amorphous pink proteinaceous material, necrotic cells, and debris, whereas LysMCre+/+ mice had very mild lesions that were mostly lymphocyte dominant (Fig. 5 C). Analyses of BALF at day 3 and day 6 indicated that infection of Hem1fl/flLysMCre+/+ mice with IAV resulted in increased OD (Fig. 5 D), total protein (Fig. 5 E), and EpCAM- and CD31-expressing cells (Fig. 5 F) relative to PBS-infected or naive Hem1fl/flLysMCre+/+ mice. BALF from IAV-infected Hem1fl/flLysMCre+/+ mice had increased levels of the proinflammatory cytokines and chemokines, including granulocyte colony-stimulating factor (G-CSF; Fig. 5 G), keratinocyte chemoattractant (KC), CCL2, and CCL3 (Fig. 5 H) compared with the control BALF, which is consistent with increased efforts to recruit inflammatory cells.
Figure 5.
Myeloid cell–specific disruption of Hem1 increases sensitivity to IAV and pneumococcus challenge. (A–H) Hem1fl/flLysMCre+/+ and LysMCre+/+ control mice were infected with IAV PR8 strain or PBS control via o.p. route and were monitored for 6 dpi. (A) Hem1fl/flLysMCre+/+ mice exhibited increased BW loss in response to IAV infection compared with control mice. (B and C) H&E staining of lung tissue 6 dpi. Low-power images of single lung lobes from five control mice (1–5) and five Hem1fl/flLysMCre+/+ mice (1–5; B). Scale bars in B, 10 mm. Bar graph shows the percentage of areas affected by inflammation. (C) 4× and 40× magnification of representative lung tissues showing increased lung inflammation and protein (pink). Scale bars in C, 500 µm (upper) and 100 µm (lower). Bar graphs showing OD of BALF after IAV instillation normalized to PBS instilled control (D), total protein in BALF 6 dpi (E), and percentage of EpCAM+ and CD31+ cells in BALF 6 dpi (F). (G and H) Concentrations of cytokines in BALF 6 dpi as measured by multiplex immunoassay. G-CSF, granulocyte colony-stimulating factor. (I) Hem1fl/flLysMCre+ and LysMCre+ control mice were infected with 2 × 10⁶ CFU of Spn via o.p. route. Bar graphs show body temperature (T°) changes during 6 h after infection (left) and Spn CFU in BALF 7 h after infection (right). Shown are mean ± SEM from n = 4–5 mice (6–12 wk old)/genotype, two independent exps. *, P < 0.05; **, P < 0.01; ***, P < 0.001; Student’s two-tailed t tests.
To further define how disruption of Hem1 alters susceptibility to acute bacterial respiratory infections, Hem1fl/flLysMCre+ mice and LysMCre+ control mice were challenged with 2 × 10⁶ Spn CFU via o.p. delivery. Body temperature rapidly declined in Hem1fl/flLysMCre+ mice relative to control mice by 6 h after infection, which correlated with an approximately fivefold increase in Spn CFU in BALF relative to controls (Fig. 5 I). These results suggest that myeloid-specific disruption of Hem-1 results in increased morbidity following IAV and Spn challenge.
Hem-1 regulates lung innate immunity
Children with PID due to LOF variants in NCKAP1L are characterized by recurring respiratory infections, pneumonitis, asthma, decreased pulmonary function, and high mortality. In this study, we found that mice with myeloid cell–specific Hem-1 deficiency and otherwise normal T, B, and natural killer cell functions surprisingly developed PAP and were more susceptible to IAV and Spn challenge, due in part to impaired development of resident AMs and poor clearance of inflammation stimulating dead cells (efferocytosis) and bacteria. Hem-1–deficient AMs also produced increased levels of proinflammatory cytokines and phagocytosed poorly in vivo, suggesting that the residual AMs were functionally unique and likely contributed to excessive inflammation during infection.
Resident AMs develop via a unique process whereby FL precursors migrate to lung tissue and mature shortly around birth in response to GM-CSF and TGFβ, which together induce expression of PPARG. PPARG in turn controls an intrinsic transcriptional program required for AM functions, including cholesterol and lipid metabolism. Mice with prenatal targeted deletion of Csf2 or Csf2rb (Trapnell and Whitsett, 2002), Pparg (Baker et al., 2010; Schneider et al., 2014b), or Bach2 (Nakamura et al., 2013) have reduced numbers of AMs, resulting in PAP, poor blood oxygenation, and increased morbidity. Similarly, humans with PAP due to mutations in either CSF2RA or CSF2RB express low levels of PPARG (Bonfield et al., 2003). In this study, we found that Hem-1 deficiency resulted in a block in AM development at the pre-AM cell stage, which correlated with reduced Pparg expression in response to GM-CSF stimulation, and reduced proliferation. GM-CSF protein was also reduced in lung tissue from Hem1fl/flLysMCre+ mice, perhaps reflecting a reduction in AMs producing GM-CSF. Because both GM-CSF and autocrine TGFβ produced by AMs induce Pparg expression, these results suggest that a reduction in GM-CSF, combined with poor Pparg induction and proliferation in response to GM-CSF, and decreased total autocrine TGFβ, may collectively contribute to impaired pre-AM to AM differentiation. Mice deficient in the actin-bundling protein L-plastin similarly exhibited defective AM development due to failure of pre-AMs to migrate to the appropriate lung niche where GM-CSF is expressed (Todd et al., 2016). Our data suggest that Hem-1, in part via regulation of AM development and functions, as well as neutrophil and monocyte migration, is important for efferocytosis and optimal immunity to IAV and pneumococcus. These results provide a unique model for how LOF variants in NCKAP1L predispose PID patients to chronic respiratory infections and asthma.
Materials and methods
Constitutive and conditional Nckap1l (Hem1)-KO mice
A C57BL/6J Nckap1l (herein Hem1) floxed-targeting construct whereby exons 12–16 of Hem1 are flanked by loxP sites was obtained from the trans–National Institutes of Health (trans-NIH) Knockout Mouse Project Repository (Sanger identifier PG00089_Y_3_F01; https://bacpacresources.org/kompSearch.php). Nckap1l gene–targeted mouse ES cells were produced by electroporating the Nckap1l floxed construct into G4 (129S6/SvEvTac × C57BL/6Ncr F1 hybrid cells) ES cells. Correct homologous recombination was confirmed by PCR and Southern blotting from genomic DNA isolated from targeted ES cells under antibiotic selection. Hem1fl/+ mice were generated by crossing Hem1 preconditional mice with FLPER recombinase mice (Gt(ROSA)26Sortm1(FLP1)Dym; Kaartinen and Nagy, 2001; obtained from Richard Palmiter (University of Washington, Seattle, WA). To generate “constitutive” Hem1−/− mice, preconditional mice were bred to Mox2Cre (Meox2tm1(cre)Sor) mice (obtained from Richard Palmiter), which deleted exons 12–16 in germline cells. To generate conditional myeloid cell lineage–specific Hem1-null mice, Hem1 floxed mice were bred to LysMCre (Lyz2tm1(cre)lfo) mice (Clausen et al., 1999; obtained from The Jackson Laboratory). To evaluate Hem1 deletion efficacy, Hem1fl/flLysMCre mice were bred to tdTomato mice (B6.Cg-Gt(ROSA)26Sortm9(CAG-tdTomato)Hze/J; obtained from Richard Palmiter). Mice were maintained in individually ventilated cages at the University of Washington in Association for Assessment and Accreditation of Laboratory Animal Care International–accredited specific pathogen–free animal facilities. All procedures performed in mice were reviewed and approved by the University of Washington Institutional Animal Care and Use Committee. For Hem1−/− and Hem1fl/flLysMCre+ experiments (exps), littermates were used as controls. For Hem1fl/flLysMCre+/+ exps, age-matched LysMCre+/+ or Hem1fl/fl mice were used as controls. Because we did not appreciate sex differences in our studies, male and female mice were used interchangeably. Exps were performed on generations G4–G8 mice, C57BL/6J background.
PCR
Genomic DNAs were isolated using extraction solution, tissue preparation solution, and neutralization solution (Sigma-Aldrich). Primers for PCR amplification are listed in Table S1. PCR was performed using the EmeraldAmp GT PCR Master Mix (Takara). PCR conditions were as follows: 1 cycle of 3 min at 94°C, followed by 35 cycles of 30 s at 94°C, 50 s at 55°C, and 50 s at 72°C, and extension with 7-min incubation at 72°C. Agarose gels were imaged by Gel Documentation System (Bio-Rad Laboratories). Densitometry was determined using ImageJ (NIH).
Flow cytometry and antibodies
RBCs were lysed in ammonium chloride potassium (ACK) lysis buffer (Invitrogen/Life Technologies) and resuspended in 3% FBS, followed by anti-CD16/32 antibody (BioLegend) staining for 10 min on ice to block Fc receptors. Cells were stained with various fluorescent dye–conjugated antimouse antibodies, including the following: B220 (RA3-6B2), CD11b (M1/70), Gr1 (RB6-8C5), and CXCR4 (L276F12; Fisher Scientific); cKit (2B8), CXCR2 (SA044G4), Ly6G (1A8), Ly6C (HK1.4), F4/80 (BM8), and Ghost dye (Tonbo Biosciences); CD64 (X54-5/7.1), MCD11c (N418), and SiglecF (S17007L; BD Biosciences); and CD19 (6D5), EpCAM (G8.8), and CD31 (390; BioLegend). Subsets of myeloid cells were identified based on cell surface markers: total hematopoietic cells (CD45.2+; Tonbo Biosciences), monocytes (CD45.2+CD11bhiF4/80+CD11c−SiglecF−Ly6C+), fetal macrophages (CD45.2+CD11bhiF4/80+CD11c−SiglecF−Ly6C−), pre-AMs (CD45.2+CD11bintF4/80+CD11c+SiglecF−Ly6C−), Mat-AMs (CD45.2+CD11bintF4/80+CD11c+SiglecF+Ly6C−; Todd et al., 2016), and combined pre-AMs and Mat-AMs (CD45.2+CD11c+SiglecF+CD11bintCD64+; Misharin et al., 2013). Neutrophil development was assessed as described previously (Evrard et al., 2018). For gating strategies, ghost−CD45.2+B220− cells were gated before analysis, and myeloid cells were defined as CD11b+Gr1+. PreNeu were gated within the CXCR4+cKit+ population, and immature (Ly6G+CXCR2−) and mature neutrophils (Ly6G+CXCR2+) were gated from the remaining population. Macrophages were gated within CD11b+F4/80+ after gating CD11c−Ly6G− (Weischenfeldt and Porse, 2008). Flow cytometric data were acquired on BD FACSCanto II or LSR II flow cytometers (BD Biosciences), and data were analyzed using FlowJo software.
Lung and liver tissue processing
Lungs and livers were collected and stored in ice-cold 2% FBS/PBS. Tissues were cut into small pieces, followed by incubation in collagenase IV (Worthington Biochemical) and DNase I (Sigma-Aldrich) for 30 min at 37°C. The tissues were further homogenized using syringe plungers and were passed through 70-µm cell strainers (VWR International). The cells were stained with appropriate antibodies after lysing RBCs with ACK lysis buffer (Guilliams et al., 2013).
AM culture
Cells were purified according to Nayak et al. (2018). Following euthanasia, BALF was collected by catheterizing tracheas and flushing three times with 0.9 ml of 5 mM EDTA/PBS. Collected cells were cultured in DMEM supplemented with 10% FBS, 20% L-929 culture supernatant, 1 mM sodium pyruvate, 10 mM Hepes, and 1× penicillin/streptomycin overnight.
F-actin polymerization assay
F-actin assay was described previously (Park et al., 2008). BM cells were isolated and plated on 96-well plates, followed by 1 μM fMLP stimulation for 2 min. Cells were fixed, permeabilized, and intracellularly stained with FITC-phalloidin (Thermo Fisher Scientific) and appropriate antibodies. The intensities of F-actin polymerization were measured by flow cytometry or imaged by fluorescence microscopy (Nikon Eclipse 50i) after preparing cytospin slides. F-actin staining was quantified using ImageJ.
Isolation of murine BM neutrophils
BM cells were harvested, and RBCs were lysed with ACK lysis buffer. Osmolarity was restored with 1.2% NaCl before passing through a 70-µm cell strainer. Neutrophils were purified using a 62% Percoll gradient following centrifugation. The purity of neutrophils was >90% based on flow cytometric analyses.
2D neutrophil chemotaxis assay
The neutrophil chemotaxis imaging assays were performed as previously described (Zengel et al., 2011; Bzymek et al., 2016). Briefly, 6 µl of 3 × 10⁶ cells/ml neutrophils were allowed to adhere for 20 min to cell channels connecting two 60-µl reservoirs on µ-Slide Chemotaxis chambers (80326; Ibidi). Two reservoirs were gently filled with 60 µl media, and reservoirs were loaded with 30 µl of 1 µM LTB4 or PBS. Cells were imaged by phase-contrast microscopy (2.4 Nikon Live) via a 10× objective lens. Images were captured every 1 min for 1 h, and cell migration tracks were analyzed with ImageJ (NIH) using a manual track plugin and chemotaxis and migration tools from Ibidi. 40 randomly selected neutrophils were manually tracked in each chemotaxis exp. FMI, directness, distance, and velocity were used as the metrics for chemotactic efficiency.
In vivo migration assays
In vivo LPS-induced migration into BALF was described previously (Rittirsch et al., 2008; Knapp et al., 2006). 10 µg LPS O111:B4 (Sigma-Aldrich) in 50 µl PBS was delivered via o.p. route under isoflurane anesthesia. 2 h (neutrophil assay) or 24 h after LPS administration (monocyte assay), mice were euthanized, and PB and BALF were collected (Nayak et al., 2018) and stained with CD45.2/CD11b/Ly6G (neutrophils) or CD45.2/CDC11b/Ly6C (monocytes) antibodies and analyzed by flow cytometry. Total cell numbers were determined using hemocytometers. For chimera assay, BM monocytes from WT and Hem1fl/flLysMCre+ mice were purified using magnetic beads (monocyte isolation kit; Miltenyi Biotec) and stained with CFSE and CTV, respectively. 2 × 10⁶ cells were mixed 1:1 and injected i.v. into C57BL/6 host mice. Mice were then infected with 5 × 10⁶ CFU of Spn G39 strain via i.n. route. 24 h or 48 h after infection, the mice were euthanized, and blood, spleen, and BALF were collected and stained with CD11b and Ly6C.
Transwell migration assays
BM monocytes were purified from tdTomato+ Hem1fl/fl LysMcre+ and tdTomato− WT mice by EasySep Mouse Monocyte Isolation Kit (STEMCELL Technologies). The KO cells were mixed 1:1 with tdTomato− WT cells and plated into a 5-µm pore size of 24 Transwell inserts containing different doses of CCL2 in the lower chamber. The cells were incubated 4 h at 37°C in 5% CO2. Migration abilities were analyzed by flow cytometry gating on CD11b+Ly6C+ cells and evaluating migration index (stimulated versus unstimulated).
Generation of BMDMs
Mouse BMDM isolation was described previously (Weischenfeldt and Porse, 2008). Following RBC lysis, total BM cells were cultured in DMEM supplemented with 10% FBS, 20% L-929 culture supernatant, 1 mM sodium pyruvate, and 10 mM Hepes in a humidified incubator with 5% CO2 at 37°C for 7 d. The purity of BMDMs was >95% based on flow cytometry analysis.
IAV infection
6–10-wk-old male mice were anesthetized under isoflurane and inoculated with 50 µl of 10 PFU of H1N1 influenza (PR8/A) in PBS via the o.p. route. BW, clinical appearance, and mortality were monitored daily. At 3 and 6 dpi, mice were bled to quantify viral load using plaque assays.
Histology
Lungs were perfused and fixed with 10% neutral buffered formalin and then paraffin embedded, sectioned, and stained with H&E. Inflammatory changes were visualized using the NDP.view program and semiquantified using ImageJ.
Oil Red O staining
Oil Red O staining was described previously (Takahashi et al., 2016). Cytospin slides of BALF were air dried and fixed in 10% formalin, then washed twice in distilled water and dipped in 60% isopropyl alcohol. Slides were stained with Oil Red O (Sigma-Aldrich) for 15 min, then washed twice in distilled water and mounted with mounting medium (Ibidi).
BALF turbidity and total protein assays
BALF turbidity was assessed by spectrophotometry at OD 590 nm. Total protein in BALF was determined by Bradford assay according to the manufacturer's instructions (Bio-Rad Laboratories). The protein was measured at OD 595 nm (Bradford, 1976), and BSA dilutions were used as protein standards.
Cytokine assays
Cytokine protein levels in BAL supernatants were measured using Mouse Cytokine Array/Chemokine Array 31-Plex (MD31; Eve Technologies). GM-CSF protein levels were measured by ELISA (capture/detection antibodies from BioLegend). Lung pieces from PND3 pups were digested in Tris-NaCl-Tween buffer, and supernatants were quantitated by Bradford assay. Equal amounts of protein (2 mg) were tested by ELISA.
BrdU assay
Mice were injected i.p. with 200 µl BrdU labeling reagent (00-0103; Invitrogen) or PBS daily for 3 d and euthanized on day 4 after injection to collect BALF. The cells were stained with appropriate fluorescent antibodies and analyzed by flow cytometry (Kamei et al., 2016).
Gene expression analyses
Gene expression analyses were performed as described previously (Iwata et al., 2016). Gene expression was evaluated by real-time PCR from AMs cultured in 10 µg/ml LPS O111:B4 (Sigma-Aldrich) or 40 ng/ml GM-CSF for 24 h (Draijer et al., 2019; Wong et al., 2012). RNA was extracted using an RNAqueous-4PCR kit (Invitrogen/Life Technologies). First-strand cDNAs were synthesized from RNA using SuperScript III reverse transcription (Invitrogen/Life Technologies). The cDNAs were amplified by quantitative real-time PCR using SYBR Green PCR Master Mix (Thermo Fisher Scientific). Thermal cycling was initiated with a first denaturation step of 5 min at 95°C, followed by 40 cycles of 95°C for 10 s and 60°C for 30 s. The fluorescence emitted from amplified DNA was read at 60°C at the end of each cycle. The data were analyzed using the iCycler iQ and Real-Time PCR Optical System software version 3.0 (Bio-Rad Laboratories). The threshold cycle (Ct) was compared with that of GAPDH and referred to as ΔCt. The relative gene level was expressed as 2−ΔΔCt, in which ΔΔCt equals ΔCt of the experimental sample minus ΔCt of the control sample. Primer sequences are provided in Table S1.
Phagocytosis assay
Macrophage phagocytosis assays were performed as previously described (Scheraga et al., 2016). Mice were nebulized with 10 µg LPS O111:B4 (Sigma-Aldrich) in 50 µl PBS via o.p. route under isoflurane anesthesia. 1 h after LPS administration, 1-µm fluorescent beads (multiplicity of infection [MOI], 20; Bangs Laboratories, Inc.) were delivered via o.p. route under anesthesia. 30 min later, the mice were euthanized to collect BALF. For PMs, mice were injected with 1-µm fluorescent beads (4 × 10⁶ particles) i.p. 1 h after injection, the mice were euthanized to collect peritoneal fluid. The cells were stained with appropriate antibodies and analyzed by flow cytometry.
Spn infection
Spn infection was described previously (Stark et al., 2018 Preprint). Mice were infected with 2 × 10⁶ CFU Spn TIGR4 or 5 × 10⁶ CFU G39 (titered and obtained from J.W. Rosch) in 50 µl PBS via o.p. route under isoflurane anesthesia. Body temperature was measured at 0, 4, and 6 h after infection using an infrared thermometer. Mice were euthanized at 7 h after infection, and bacterial loads were quantified by CFU assay using blood agar.
Statistical analysis
All statistical analysis was performed using GraphPad Prism software. Statistical differences were determined using Student’s t test with the Holm-Sidak correction for multiple comparisons or two-way ANOVA. All data are presented as mean ± SEM. *, P < 0.05; **, P < 0.01; ***, P < 0.001; ****, P < 0.0001.
Online supplemental material
Fig. S1 depicts the generation of constitutive and myeloid cell–specific Hem1-null mice. Fig. S2 shows the results of developmental analyses of monocytes and macrophages in FL and PND3 lungs and functional analyses of adult monocytes. Fig. S3 shows the results of functional analyses of fetal and adult AMs and monocytes. Table S1 lists PCR primer sequences used for genotyping and gene expression analyses.
Supplementary Material
lists PCR primer sequences used for genotyping and gene expression analyses.
Acknowledgments
We thank V. Bae and K. Bui for assistance with the mouse colony; R. Palmiter for assistance with the Southern blots; and C. Frevert (University of Washington, Seattle, WA), J. Felgenhauer (University of Washington, Seattle, WA), and J. Brune (University of Washington, Seattle, WA) for providing IAV.
This work was supported by National Institutes of Health grant R01AI092092 (to B.M. Iritani) and a Royal Thai Government scholarship (to N. Suwankitwat).
Author contributions: N. Suwankitwat, H. Park, S. Libby, A. Avalos, and B.M. Iritani designed and performed the exps and wrote the manuscript; H.D. Liggitt analyzed the histopathology; A. Ruddell assisted with microscopy; and J.W. Rosch titered and provided the S. pneumoniae and infection guidelines.
References
- Baker, A.D., Malur A., Barna B.P., Ghosh S., Kavuru M.S., Malur A.G., and Thomassen M.J.. 2010. Targeted PPARγ deficiency in alveolar macrophages disrupts surfactant catabolism. J. Lipid Res. 51:1325–1331. 10.1194/jlr.M001651 [DOI] [PMC free article] [PubMed] [Google Scholar]
- Bonfield, T.L., Farver C.F., Barna B.P., Malur A., Abraham S., Raychaudhuri B., Kavuru M.S., and Thomassen M.J.. 2003. Peroxisome proliferator-activated receptor-γ is deficient in alveolar macrophages from patients with alveolar proteinosis. Am. J. Respir. Cell Mol. Biol. 29:677–682. 10.1165/rcmb.2003-0148OC [DOI] [PubMed] [Google Scholar]
- Bradford, M.M. 1976. A rapid and sensitive method for the quantitation of microgram quantities of protein utilizing the principle of protein-dye binding. Anal. Biochem. 72:248–254. 10.1016/0003-2697(76)90527-3 [DOI] [PubMed] [Google Scholar]
- Burns, S.O., Zarafov A., and Thrasher A.J.. 2017. Primary immunodeficiencies due to abnormalities of the actin cytoskeleton. Curr. Opin. Hematol. 24:16–22. 10.1097/MOH.0000000000000296 [DOI] [PubMed] [Google Scholar]
- Bzymek, R., Horsthemke M., Isfort K., Mohr S., Tjaden K., Müller-Tidow C., Thomann M., Schwerdtle T., Bähler M., Schwab A., and Hanley P.J.. 2016. Real-time two- and three-dimensional imaging of monocyte motility and navigation on planar surfaces and in collagen matrices: roles of Rho. Sci. Rep. 6:25016. 10.1038/srep25016 [DOI] [PMC free article] [PubMed] [Google Scholar]
- Chen, B.D., Mueller M., and Chou T.H.. 1988. Role of granulocyte/macrophage colony-stimulating factor in the regulation of murine alveolar macrophage proliferation and differentiation. J. Immunol. 141:139–144. [PubMed] [Google Scholar]
- Clausen, B.E., Burkhardt C., Reith W., Renkawitz R., and Förster I.. 1999. Conditional gene targeting in macrophages and granulocytes using LysMcre mice. Transgenic Res. 8:265–277. 10.1023/A:1008942828960 [DOI] [PubMed] [Google Scholar]
- Cook, D.R., Rossman K.L., and Der C.J.. 2014. Rho guanine nucleotide exchange factors: regulators of Rho GTPase activity in development and disease. Oncogene. 33:4021–4035. 10.1038/onc.2013.362 [DOI] [PMC free article] [PubMed] [Google Scholar]
- Cook, S.A., Comrie W.A., Poli M.C., Similuk M., Oler A.J., Faruqi A.J., Kuhns D.B., Yang S., Vargas-Hernández A., Carisey A.F., et al. 2020. HEM1 deficiency disrupts mTORC2 and F-actin control in inherited immunodysregulatory disease. Science. 369:202–207. 10.1126/science.aay5663 [DOI] [PMC free article] [PubMed] [Google Scholar]
- Cotteret, S., and Chernoff J.. 2002. The evolutionary history of effectors downstream of Cdc42 and Rac. Genome Biol. 3:reviews0002.1. 10.1186/gb-2002-3-2-reviews0002 [DOI] [PMC free article] [PubMed] [Google Scholar]
- Dominguez, R., and Holmes K.C.. 2011. Actin structure and function. Annu. Rev. Biophys. 40:169–186. 10.1146/annurev-biophys-042910-155359 [DOI] [PMC free article] [PubMed] [Google Scholar]
- Draijer, C., Penke L.R.K., and Peters-Golden M.. 2019. Distinctive effects of GM-CSF and M-CSF on proliferation and polarization of two major pulmonary macrophage populations. J. Immunol. 202:2700–2709. 10.4049/jimmunol.1801387 [DOI] [PMC free article] [PubMed] [Google Scholar]
- Evrard, M., Kwok I.W.H., Chong S.Z., Teng K.W.W., Becht E., Chen J., Sieow J.L., Penny H.L., Ching G.C., Devi S., et al. 2018. Developmental analysis of bone marrow neutrophils reveals populations specialized in expansion, trafficking, and effector functions. Immunity. 48:364–379.e8. 10.1016/j.immuni.2018.02.002 [DOI] [PubMed] [Google Scholar]
- Guilliams, M., De Kleer I., Henri S., Post S., Vanhoutte L., De Prijck S., Deswarte K., Malissen B., Hammad H., and Lambrecht B.N.. 2013. Alveolar macrophages develop from fetal monocytes that differentiate into long-lived cells in the first week of life via GM-CSF. J. Exp. Med. 210:1977–1992. 10.1084/jem.20131199 [DOI] [PMC free article] [PubMed] [Google Scholar]
- Hashimoto, D., Chow A., Noizat C., Teo P., Beasley M.B., Leboeuf M., Becker C.D., See P., Price J., Lucas D., et al. 2013. Tissue-resident macrophages self-maintain locally throughout adult life with minimal contribution from circulating monocytes. Immunity. 38:792–804. 10.1016/j.immuni.2013.04.004 [DOI] [PMC free article] [PubMed] [Google Scholar]
- Hromas, R., Collins S., Raskind W., Deaven L., and Kaushansky K.. 1991. Hem-1, a potential membrane protein, with expression restricted to blood cells. Biochim. Biophys. Acta. 1090:241–244. 10.1016/0167-4781(91)90109-Y [DOI] [PubMed] [Google Scholar]
- Iwata, T.N., Ramírez J.A., Tsang M., Park H., Margineantu D.H., Hockenbery D.M., and Iritani B.M.. 2016. Conditional disruption of Raptor reveals an essential role for mTORC1 in B cell development, survival, and metabolism. J. Immunol. 197:2250–2260. 10.4049/jimmunol.1600492 [DOI] [PMC free article] [PubMed] [Google Scholar]
- Janssen, W.J.M., Geluk H.C.A., and Boes M.. 2016. F-actin remodeling defects as revealed in primary immunodeficiency disorders. Clin. Immunol. 164:34–42. 10.1016/j.clim.2016.01.009 [DOI] [PubMed] [Google Scholar]
- Kaartinen, V., and Nagy A.. 2001. Removal of the floxed neo gene from a conditional knockout allele by the adenoviral Cre recombinase in vivo. Genesis. 31:126–129. 10.1002/gene.10015 [DOI] [PubMed] [Google Scholar]
- Kamei, A., Gao G., Neale G., Loh L.N., Vogel P., Thomas P.G., Tuomanen E.I., and Murray P.J.. 2016. Exogenous remodeling of lung resident macrophages protects against infectious consequences of bone marrow-suppressive chemotherapy. Proc. Natl. Acad. Sci. USA. 113:E6153–E6161. 10.1073/pnas.1607787113 [DOI] [PMC free article] [PubMed] [Google Scholar]
- Kelly, A., and McCarthy C.. 2020. Pulmonary alveolar proteinosis syndrome. Semin. Respir. Crit. Care Med. 41:288–298. 10.1055/s-0039-3402727 [DOI] [PubMed] [Google Scholar]
- Knapp, S., Florquin S., Golenbock D.T., and van der Poll T.. 2006. Pulmonary lipopolysaccharide (LPS)-binding protein inhibits the LPS-induced lung inflammation in vivo. J. Immunol. 176:3189–3195. 10.4049/jimmunol.176.5.3189 [DOI] [PubMed] [Google Scholar]
- Kopf, M., Schneider C., and Nobs S.P.. 2015. The development and function of lung-resident macrophages and dendritic cells. Nat. Immunol. 16:36–44. 10.1038/ni.3052 [DOI] [PubMed] [Google Scholar]
- Madisen, L., Zwingman T.A., Sunkin S.M., Oh S.W., Zariwala H.A., Gu H., Ng L.L., Palmiter R.D., Hawrylycz M.J., Jones A.R., et al. 2010. A robust and high-throughput Cre reporting and characterization system for the whole mouse brain. Nat. Neurosci. 13:133–140. 10.1038/nn.2467 [DOI] [PMC free article] [PubMed] [Google Scholar]
- Misharin, A.V., Morales-Nebreda L., Mutlu G.M., Budinger G.R.S., and Perlman H.. 2013. Flow cytometric analysis of macrophages and dendritic cell subsets in the mouse lung. Am. J. Respir. Cell Mol. Biol. 49:503–510. 10.1165/rcmb.2013-0086MA [DOI] [PMC free article] [PubMed] [Google Scholar]
- Nakamura, A., Ebina-Shibuya R., Itoh-Nakadai A., Muto A., Shima H., Saigusa D., Aoki J., Ebina M., Nukiwa T., and Igarashi K.. 2013. Transcription repressor Bach2 is required for pulmonary surfactant homeostasis and alveolar macrophage function. J. Exp. Med. 210:2191–2204. 10.1084/jem.20130028 [DOI] [PMC free article] [PubMed] [Google Scholar]
- Nayak, D.K., Mendez O., Bowen S., and Mohanakumar T.. 2018. Isolation and in vitro culture of murine and human alveolar macrophages. J. Vis. Exp. (134):57287. 10.3791/57287 [DOI] [PMC free article] [PubMed] [Google Scholar]
- Park, H., Staehling-Hampton K., Appleby M.W., Brunkow M.E., Habib T., Zhang Y., Ramsdell F., Liggitt H.D., Freie B., Tsang M., et al. 2008. A point mutation in the murine Hem1 gene reveals an essential role for Hematopoietic protein 1 in lymphopoiesis and innate immunity. J. Exp. Med. 205:2899–2913. 10.1084/jem.20080340 [DOI] [PMC free article] [PubMed] [Google Scholar]
- Park, H., Staehling K., Tsang M., Appleby M.W., Brunkow M.E., Margineantu D., Hockenbery D.M., Habib T., Liggitt H.D., Carlson G., and Iritani B.M.. 2012. Disruption of Fnip1 reveals a metabolic checkpoint controlling B lymphocyte development. Immunity. 36:769–781. 10.1016/j.immuni.2012.02.019 [DOI] [PMC free article] [PubMed] [Google Scholar]
- Rittirsch, D., Flierl M.A., Day D.E., Nadeau B.A., McGuire S.R., Hoesel L.M., Ipaktchi K., Zetoune F.S., Sarma J.V., Leng L., et al. 2008. Acute lung injury induced by lipopolysaccharide is independent of complement activation. J. Immunol. 180:7664–7672. 10.4049/jimmunol.180.11.7664 [DOI] [PMC free article] [PubMed] [Google Scholar]
- Scheraga, R.G., Abraham S., Niese K.A., Southern B.D., Grove L.M., Hite R.D., McDonald C., Hamilton T.A., and Olman M.A.. 2016. TRPV4 mechanosensitive ion channel regulates lipopolysaccharide-stimulated macrophage phagocytosis. J. Immunol. 196:428–436. 10.4049/jimmunol.1501688 [DOI] [PMC free article] [PubMed] [Google Scholar]
- Schneider, C., Nobs S.P., Heer A.K., Kurrer M., Klinke G., van Rooijen N., Vogel J., and Kopf M.. 2014a. Alveolar macrophages are essential for protection from respiratory failure and associated morbidity following influenza virus infection. PLoS Pathog. 10:e1004053. 10.1371/journal.ppat.1004053 [DOI] [PMC free article] [PubMed] [Google Scholar]
- Schneider, C., Nobs S.P., Kurrer M., Rehrauer H., Thiele C., and Kopf M.. 2014b. Induction of the nuclear receptor PPAR-γ by the cytokine GM-CSF is critical for the differentiation of fetal monocytes into alveolar macrophages. Nat. Immunol. 15:1026–1037. 10.1038/ni.3005 [DOI] [PubMed] [Google Scholar]
- Stark, A.-K., Okkenhaug K., and Banham-Hall E.. 2018. Acute Streptococcus pneumoniae lung infection: mouse model and characterisation of the immune response. Protoc. Exch. (Preprint posted September 24, 2018) 10.1038/protex.2018.114 [DOI] [Google Scholar]
- Takahashi, T., Sugawara W., Takiguchi Y., Takizawa K., Nakabayashi A., Nakamura M., Nagano-Ito M., and Ichikawa S.. 2016. Identification of plants that inhibit lipid droplet formation in liver cells: Rubus suavissimus leaf extract protects mice from high-fat diet-induced fatty liver by directly affecting liver cells. Evid. Based Complement. Alternat. Med. 2016:4282758. 10.1155/2016/4282758 [DOI] [PMC free article] [PubMed] [Google Scholar]
- Todd, E.M., Zhou J.Y., Szasz T.P., Deady L.E., D’Angelo J.A., Cheung M.D., Kim A.H.J., and Morley S.C.. 2016. Alveolar macrophage development in mice requires L-plastin for cellular localization in alveoli. Blood. 128:2785–2796. 10.1182/blood-2016-03-705962 [DOI] [PMC free article] [PubMed] [Google Scholar]
- Trapnell, B.C., and Whitsett J.A.. 2002. Gm-CSF regulates pulmonary surfactant homeostasis and alveolar macrophage-mediated innate host defense. Annu. Rev. Physiol. 64:775–802. 10.1146/annurev.physiol.64.090601.113847 [DOI] [PubMed] [Google Scholar]
- Weiner, O.D., Rentel M.C., Ott A., Brown G.E., Jedrychowski M., Yaffe M.B., Gygi S.P., Cantley L.C., Bourne H.R., and Kirschner M.W.. 2006. Hem-1 complexes are essential for Rac activation, actin polymerization, and myosin regulation during neutrophil chemotaxis. PLoS Biol. 4:e38. 10.1371/journal.pbio.0040038 [DOI] [PMC free article] [PubMed] [Google Scholar]
- Weischenfeldt, J., and Porse B.. 2008. Bone marrow-derived macrophages (BMM): isolation and applications. CSH Protoc. 2008:pdb.prot5080. 10.1101/pdb.prot5080 [DOI] [PubMed] [Google Scholar]
- Wong, M.H., Chapin O.C., and Johnson M.D.. 2012. LPS-stimulated cytokine production in type I cells is modulated by the renin-angiotensin system. Am. J. Respir. Cell Mol. Biol. 46:641–650. 10.1165/rcmb.2011-0289OC [DOI] [PMC free article] [PubMed] [Google Scholar]
- Yu, X., Buttgereit A., Lelios I., Utz S.G., Cansever D., Becher B., and Greter M.. 2017. The cytokine TGF-β promotes the development and homeostasis of alveolar macrophages. Immunity. 47:903–912.e4. 10.1016/j.immuni.2017.10.007 [DOI] [PubMed] [Google Scholar]
- Zengel, P., Nguyen-Hoang A., Schildhammer C., Zantl R., Kahl V., and Horn E.. 2011. μ-Slide Chemotaxis: a new chamber for long-term chemotaxis studies. BMC Cell Biol. 12:21. 10.1186/1471-2121-12-21 [DOI] [PMC free article] [PubMed] [Google Scholar]
Associated Data
This section collects any data citations, data availability statements, or supplementary materials included in this article.
Supplementary Materials
lists PCR primer sequences used for genotyping and gene expression analyses.


