

Abstract
Objective
To examine the relationship between the fraction of cell‐free DNA (cfDNA) affected by aneuploidy compared to the overall fetal fraction of a prenatal screening specimen and its effect on positive predictive value (PPV).
Method
CfDNA specimens positive for trisomy 13, 18, and 21 with diagnostic outcomes were analysed over a 22‐month period in one clinical laboratory. For each positive specimen, a “mosaicism ratio” (MR) was calculated by dividing the fraction of cfDNA affected by aneuploidy by the overall fetal fraction of the specimen. PPVs were calculated and analyzed based on various MR ranges.
Results
Trisomy 13 was the aneuploidy most commonly seen in mosaic form, followed by trisomy 18 and trisomy 21. Significant differences in positive predictive values were noted for all three trisomies between samples with an MR in the “mosaic” versus “non‐mosaic” range, as well as between results classified as “low‐mosaic” versus “high‐mosaic.”
Conclusion
PPVs may be influenced, in part, by the mosaicism ratio associated with a particular result. The data generated from this study may be useful in providing more personalized risk assessments for patients with positive cfDNA screening results.
What's already known about this topic?
Cell‐free DNA (cfDNA) screening has a relatively high positive predictive value for common aneuploidies compared to traditional serum biochemical screening.
CfDNA results may be discordant with the chromosomal status of the fetus due to mosaicism, co‐twin demise, and maternal findings, among others.
What does this study add?
A metric called “mosaicism ratio” can be calculated from data generated via massively parallel sequencing by comparing the fraction of “over‐represented” cfDNA to the overall fetal fraction of the specimen.
Mosaicism ratio may be a useful tool in identifying cfDNA results more likely to be discordant with the genetic status of the fetus.
1. INTRODUCTION
Cell‐free DNA screening for fetal aneuploidy assessment during pregnancy has been clinically available in the United States since 2011. This screening modality has grown in popularity, in part, due to the significantly increased positive predictive value (PPV) compared to traditional screening methods. 1 Despite the relatively high PPV of cell‐free DNA (cfDNA) screening, “false positive” or discordant results are a well‐established phenomenon with this screening technology. Various biological etiologies have been identified as the cause of these discrepancies, including: mosaicism, co‐twin demise, and maternal findings (chromosome abnormalities, malignancies, fibroids), among others. 2
A vast amount of data has been generated from cfDNA screening over the past 8 years. With time, patterns have emerged suggesting that certain samples may present with data that make a “false positive” or discordant result more likely. Specifically, cfDNA data can sometimes suggest when placental mosaicism or other biological phenomena may be present which could impact the positive predictive value associated with the result.
Previous studies from other research groups have focused on how cfDNA data metrics may be used to identify pregnancies at high risk of fetoplacental mosaicism, 3 or pregnancies at risk for maternal copy number variants. 4
The purpose of this study is to describe how a novel metric, “mosaicism ratio,” is calculated in the event of a positive cfDNA result at one clinical laboratory, and how this metric can be used to identify cfDNA results more likely to be discordant with the genetic status of the fetus.
2. METHODS
The current study focused on samples analyzed using the most recent cfDNA noninvasive prenatal testing (NIPT) assay version in one clinical laboratory. Maternal blood samples submitted to Sequenom Laboratories® for MaterniT®21 PLUS were subjected to DNA extraction, library preparation, and genome‐wide massively parallel sequencing, as previously described. 5
A novel laboratory method of estimating fetal fraction contribution in a prenatal cfDNA screening specimen was described in detail in a prior publication. 6 In summary, the genome was divided into 50 kilobase (kb) contiguous segments or “bins.” Circulating cell‐free DNA fragments, consisting of maternal DNA fragments and “fetal” DNA fragments contributed by the trophoblastic layer of the placenta, were sequenced and aligned to the genome, and bin count data were normalized. A training set was developed using samples from pregnancies with male fetuses. Bins associated with the Y chromosome, used as a direct measure of male fetal fraction, were compared to bins across the autosomes to identify genomic bins which vary in proportion to Y chromosome fetal fraction. Once developed, this method allowed for estimation of fetal fraction from autosomal bins for pregnancies with either a male or a female fetus, independent of the aneuploidy status of the fetus. The overall fetal fraction of a specimen, quantified based on autosomal bins, was denoted “SeqFF.”
In a similar manner, in samples with a detected CNV involving a whole chromosome or subchromosomal region, an “affected fraction” of cfDNA can be assessed for an individual chromosome or chromosomal segment by analyzing bins only associated with the chromosome or segment of interest. This metric is denoted the “CBSFF” or “Circular Binary Segmentation Fetal Fraction.”
Circular binary segmentation (CBS) is used to identify copy number variants (CNVs), and CBSFF (or “affected fraction”) is determined by calculating the fraction of cfDNA required to generate the observed change of sequencing counts in the CNV region. In other words, the CBSFF is estimated by comparing the median coverage of the event region and the median coverage of the reference samples. The reference set was established based on euploid female samples. Assuming a non‐mosaic fetal CNV, the “affected fraction” should equate to the overall fetal fraction. 7 , 8
Once the overall sample FF (SeqFF) and affected fraction (CBSFF) are determined, a “mosaicism ratio” (MR) can be calculated. First described in 2017, the MR is derived by dividing the “affected fraction” estimated for the aberrant chromosome or chromosomal segment over the fetal fraction estimated for all chromosomes (i.e., CBSFF divided by SeqFF). 9 , 10 When these two measures are approximately equal and the mosaicism ratio is roughly 1.0, this suggests that the cfDNA contributed from the placenta is aneuploid in non‐mosaic form. A depressed mosaicism ratio suggests that there is less aneuploid cfDNA contribution than there is fetal fraction, which may be indicative of placental mosaicism or other biological phenomena, such as prior co‐twin demise. A visual representation of the laboratory data generated from a “non‐mosaic” versus “mosaic” event can be seen in Figure S1.
Current laboratory protocol will generally include reporting results as “mosaic” positives when the MR falls below 0.7. This threshold was established from original, internal laboratory data analysis of 3373 samples positive for trisomy 21, 18, or 13, with ad hoc clinician feedback on discordant results. This analysis identified a decline in positive predictive value for results with an MR below 0.7 (Figure 1).
FIGURE 1.
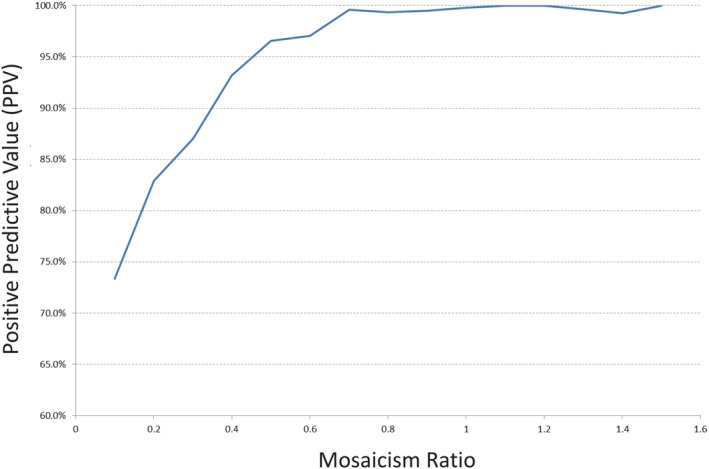
Data from original, internal studies of mosaicism ratio showing impact of mosaicism ratio on positive predictive value. Analysis of 3373 samples screen positive for trisomy 21, 18, or 13 from cfDNA analysis. Positive predictive values based on all available ad hoc clinician feedback regarding discordant results [Colour figure can be viewed at wileyonlinelibrary.com]
For the current study, samples from singleton gestations positive for trisomy 21, trisomy 18, or trisomy 13 from the MaterniT® 21 PLUS test were compiled from April 2018 to February 2020. Only samples from this cohort with diagnostic outcomes were included in PPV analysis. Diagnostic outcomes were obtained from two sources. First, outcome information from ad hoc feedback was collected, when available, from the ordering provider. Second, positive cfDNA samples were cross‐referenced with cytogenetic and SNP microarray diagnostic results submitted to LabCorp and Integrated Genetics from chorionic villus, amniocentesis, postnatal peripheral blood, and product of conception specimens during a corresponding timeframe. The process of consolidation and comparison of data across the three datasets (cfDNA results, cytogenetic results and microarray results) was approved by Aspire IRB under clinical protocol SCMM‐RND‐402.
For a cfDNA sample to be considered a match to a cytogenetic and/or microarray specimen, the diagnostic and screening results were required to have identical patient identifiers (name and date of birth), and the collection date for the diagnostic test had to be within 90 days of the patient's cfDNA screening date. When multiple diagnostic results (e.g., cytogenetic and microarray results, or CVS and amniocentesis results) were available for the same patient, results were combined under one final characterization.
A cfDNA result was classified as a “true positive” when the abnormality identified by cfDNA screening was confirmed (in mosaic or non‐mosaic form) by karyotype or microarray analysis from diagnostic testing. A “false positive” classification was assigned when the abnormal screening result was not confirmed by diagnostic testing. Positive predictive values were calculated by dividing the number of true positive results in a particular cohort by the total positive results (true positives plus false positives) in that cohort.
Confidence intervals were calculated using the VassarStats Website for Statistical Computation (Clinical Calculator #1). 11 Comparison of ratios was performed using a two‐sample, two‐sided proportional Z test. 12 For all calculations, p‐values less than 0.05 were considered statistically significant.
3. RESULTS
During the study period (April 2018–February 2020), 4597 positive results were issued for one of the three core trisomies, consisting of 554 results positive for trisomy 13 (T13), 1022 trisomy 18 (T18), and 3021 trisomy 21 (T21). Diagnostic outcomes from clinician feedback and internally matched karyotype and microarray specimens were available for 17% (n = 779) of the positive samples, including 114 T13, 197 T18, and 468 T21 specimens. Diagnostic outcomes volunteered by clinicians were available for 64 cases. Data matching with diagnostic specimens resulted in an additional 715 unique cases for analysis.
Patient demographic and cfDNA laboratory metrics were available for 763 of the 779 matched cases in this study. Data for the matched cohort were analysed and compared to the broader screen‐positive group (n = 4510 cases with maternal age provided; n = 3747 cases with gestational age provided) during the same timeframe. The average maternal age in the matched cohort was 35.6 years, which is similar to the average maternal age seen in the broader screen‐positive group of 35.4 years (p > 0.05). On average, samples were submitted for cfDNA screening earlier in pregnancy for the matched cases than the broader screening group (13.1 weeks vs. 14.3 weeks; p < 0.0001).
A testing indication for cfDNA screening was provided in 628 of the 779 cases in the matched cohort. The most common indication for screening in the matched cohort was advanced maternal age (76.4%), followed by multiple indications (9.6%), ultrasound findings (6.4%), abnormal serum screen (5.1%), no known high‐risk indication (1.9%), and personal/family history (0.6%).
For the matched cohort, a testing indication for provided for 644 of the 779 diagnostic specimens. The most common reason for diagnostic testing in the matched cohort was “multiple indications” (64.0%), followed by abnormal screening (26.1%), “other” (5.7%), advanced maternal age (2.2%) and ultrasound findings (2.0%).
As noted above, 715 of the 779 cases with diagnostic outcomes were from cases matched via internal laboratory databases of karyotype and SNP microarray results. A review of the 715 cases found that, in the majority of cases (602/715, 84%), a karyotype was ordered for diagnostic testing. There were 84 cases (12%) in which only a SNP microarray was ordered, and 29 cases (4%) where both karyotype and SNP microarray results were identified for the same patient. The majority of samples (58%, n = 412) were from amniotic fluid specimens, 36% (n = 258) from chorionic villus specimens, and 6% (n = 45) from products of conception.
The distribution of MRs by aneuploidy type, as shown in Figure 2 was similar for the cases with diagnostic outcomes and for the overall positive screening cohort for each aneuploidy, with no statistically significant differences in distributions identified between the two cohorts. Of the total positive results (n = 4597), 49% of the T13 specimens, 26% of the T18 specimens, and 5% of the T21 specimens showed an MR in the “mosaic” range (between 0.2 and 0.7). In the cohort with diagnostic outcomes (n = 779), 57% of T13, 31% of T18, and 6% of T21 results had an MR in the “mosaic” range. Similar distributions were seen between the cohorts when cases were further subdivided into “high mosaic” (MR 0.5–0.69) and “low mosaic” (MR 0.2–0.49) groups, with the only statistically significant difference in cohorts seen in the “high mosaic” group for T18 samples (i.e., more samples with diagnostic outcomes were in the 0.5–0.69 MR range than in the overall positive screening cohort, p = 0.0455). See Table S1 for further details.
FIGURE 2.
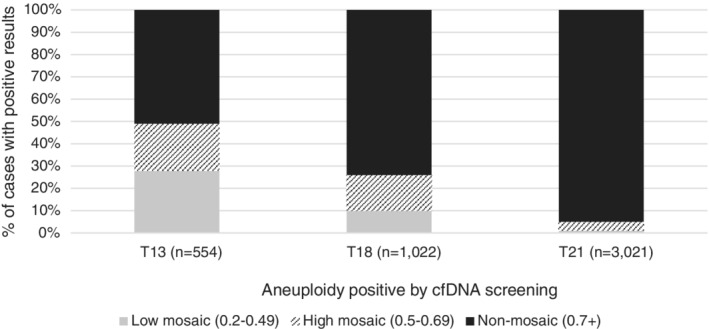
Distribution of mosaicism ratios by MR group and aneuploidy in the overall positive screening cohort (n=4597)
Positive predictive values were calculated for each aneuploidy in the cohort with diagnostic outcomes and then stratified by 0.1 MR ranges (Figure 3) and by MR groups (Figure 4). MR groups were defined as “low mosaic” when the MR was between 0.2 and 0.49, “high mosaic” when the MR was between 0.5 and 0.69, and “non‐mosaic” when the MR was 0.7 and above (consistent with laboratory reporting protocols). Additional details regarding PPVs by 0.1 MR range can be viewed in Table S2.
FIGURE 3.
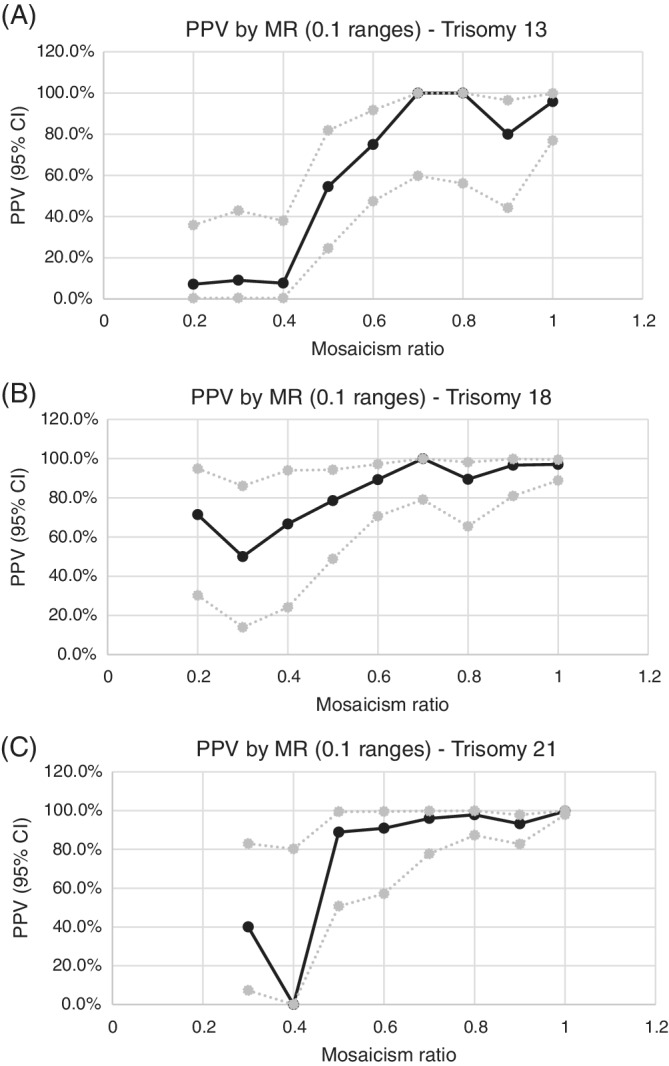
Graph of PPVs by MR (in 0.1 ranges) with upper and lower 95th confidence intervals—(A) trisomy 13, (B) trisomy 18, (C) trisomy 21
FIGURE 4.
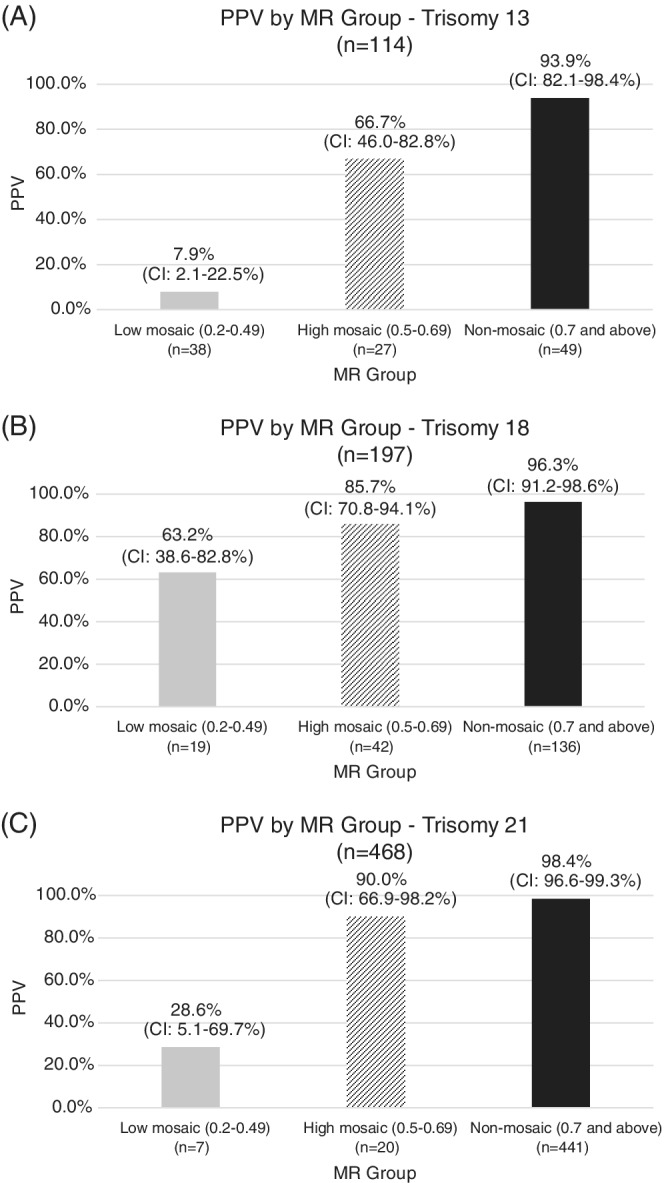
PPV by MR group with upper and lower 95th confidence intervals—A, trisomy 13, B, trisomy 18, C, trisomy 21
Analysis of the 779 cases with diagnostic outcomes showed an overall positive predictive value (PPV) of 58.8% [95% CI: 49.2, 67.8] for T13 (n = 67/114), 90.9% [95% CI: 85.7, 94.3] for T18 (n = 179/197), and 97.0% [95% CI: 94.9, 98.3] for T21 (n = 454/468). When the MR was “non‐mosaic,” PPVs were consistently high for all three trisomies: 93.9% [95% CI: 82.1, 98.4] T13 (n = 46/49), 96.3% [95% CI: 91.2, 98.6] T18 (n = 131/136), 98.4% [95% CI: 96.6, 99.3] T21 (n = 434/441). PPVs were significantly lower for samples with a mosaic MR (0.2–0.7) versus non‐mosaic MR (0.7 and above) for all three trisomies. Samples with MRs in the “mosaic” range (0.2–0.7) were divided into “low mosaic” (0.2–0.49) and “high mosaic” (0.5–0.69) groups. For all three trisomies, the PPV was significantly lower for “low mosaic” samples than “high mosaic” samples.
With regard to diagnostic studies, when mosaicism was documented on the karyotype or microarray results, or when the ordering provider disclosed that diagnostic results were mosaic, this information was noted and compiled. Seven cases of trisomy 13, five cases of trisomy 18, and 10 cases of trisomy 21 mosaicism were identified from diagnostic testing. The cases presenting with mosaic diagnostic results showed a wide range of MRs (from 0.2 to 1.53). Please refer to Table S3 for further details regarding these mosaic cases.
4. DISCUSSION
Mosaicism is a common biological finding, estimated to occur in 1%–2% of pregnancies. 13 Studies from chorionic villi and amniocentesis specimens have provided valuable insight into the various types of mosaicism which can exist during pregnancy. Even though the fetus and the placenta originate from the same zygote, it is well‐established that biological differences can exist, not only between the fetus and the placenta, but also between the layers of the placenta itself. These biological differences, resulting from mosaicism, can occur because of errors during meiosis or mitosis.
Prenatal cfDNA screening analyzes circulating cell‐free DNA originating from the trophoblastic layer of the placenta during pregnancy. The trophoblast is also the source of cells analysed during direct preparation of a CVS specimen (typically for fluorescent in situ hybridization studies or direct microarray), whereas the mesenchymal layer is analyzed from cultured CVS samples (usually for karyotype or microarray analysis on cultured cells). As mosaicism can occur in either or both layers of the placenta (with or without fetal involvement), or in the fetus (with or without placental involvement), discordant results can present from various combinations of prenatal screening and diagnostic tests. 13
CfDNA screening may be suggestive of placental mosaicism or other biological event when the fraction of cfDNA associated with the aneuploid chromosome or segment is less than the overall fetal fraction of the specimen, and the data generated from the current study suggest that PPV of cfDNA results may be influenced, in part, by how these two metrics compare to one another (i.e., the mosaicism ratio).
While all three trisomies demonstrate high PPVs (>90%) when the MR is considered “non‐mosaic” (0.7 or above), variability in PPVs is seen among the core aneuploidies as MR decreases. The core aneuploidy most likely to be found in mosaic form is trisomy 13, followed by trisomy 18, and trisomy 21, respectively.
Focusing on cases with diagnostic outcomes, trisomy 13 samples with a non‐mosaic MR (0.7 and above) showed the highest PPV at 93.9% (CI: 82.1–98.4%); 24% of results (n = 27) had a high mosaic MR (0.5–0.69) and the PPV in this cohort was 66.7% (CI: 46.0–82.8%); 33% of trisomy 13 cases (n = 38) were found to have a low mosaic MR (0.2–0.49) with a PPV of 7.9% (CI: 2.1–22.5%). From historical studies of chorionic villi, trisomy 13 mosaicism commonly involves the cytotrophoblast with lesser mesenchymal and fetal involvement. 13 , 14 Therefore, this could explain why cfDNA may be more likely to identify mosaic trisomy 13 results, and may contribute to the lower PPV associated with these findings.
Trisomy 18 showed higher PPVs across all MR ranges as compared to trisomy 13. Non‐mosaic results demonstrated a PPV of 96.3% (CI: 91.2–98.6%). High mosaic results comprised 21% of cases (n = 42), with a PPV of 85.7% (CI: 70.8–94.1%), and low mosaic results were seen in 10% of cases (n = 19), but showed a relatively high PPV of 63.2% (CI: 38.6–82.8%). Biologically, trisomy 18 mosaicism is more likely to involve the mesenchymal layer of the placenta, and also involve true fetal mosaicism. 13 , 14 Therefore, regardless of the level of mosaicism, trisomy 18 findings may be more likely to be confirmed by diagnostic testing.
The data associated with trisomy 21 was unique compared to the other trisomies. There were very few samples presenting with mosaic data, with 4% showing high mosaic data, and only 1% showing low mosaic data. The PPV associated with non‐mosaic cases (approximately 95% of positive T21 results) was 98.4% (CI: 96.6–99.3%). High mosaic results showed a 90.0% PPV (CI: 66.9–98.2%), though only 20 cases contributed data in this cohort. The PPV of low mosaic results, again few in number (n = 7), was 28.6% (CI: 5.1–69.7%). Similar to trisomy 18, studies of placental tissue have found that trisomy 21 mosaicism often involves the mesenchyme and fetus, potentially resulting in a higher likelihood of diagnostic confirmation when observed in the placental cytotrophoblast. 13 , 14
A review of the distribution of mosaicism ratios for each aneuploidy in the study cohort with diagnostic outcomes closely resembles the distribution of MRs seen in the broader cohort of screen positive results issued during the study timeframe. This correlation suggests that the findings from the current data set with diagnostic outcomes may show similar trends to the overall positive screening cohort.
A review of the karyotype and microarray data presented in the current study demonstrates that, even in the event of a depressed or “mosaic” MR from cfDNA screening, diagnostic testing typically delivers a binary, “normal” or “abnormal,” non‐mosaic result. Only 22 of the 779 cases (2.8%) with diagnostic outcomes showed overt mosaicism on diagnostic testing. Biologically, there are several reasons why cfDNA may show mosaic data in the apparent absence of mosaicism from diagnostic testing. First, chorionic villus sampling analyzes cells from a localized biopsy of the placenta. Therefore, even if mosaicism is present in the placenta it could be missed if the mosaic load is directionally skewed in the focal, biopsied region. On the other hand, cfDNA may represent a more global view of the placental composition, as cells from the cytotrophoblast are presumably shedding cfDNA broadly from the placenta. Consequently, placental mosaicism, when present, may be more likely to be detected by cfDNA screening than by chorionic villus sampling.
Additionally, amniocentesis may be the preferred diagnostic test as a follow‐up to an abnormal cfDNA screen, as the results are considered more representative of the fetus than the placenta. Given the common biological origin of DNA analyzed by cfDNA screening and CVS, CVS may be discouraged to avoid detection of confined placental mosaicism which may have been the cause of the initial abnormal cfDNA results. As previously noted, in the current study, approximately 58% of diagnostic studies were performed from amniocentesis specimens. By definition, none of these cases would have detected placental mosaicism, if present in the pregnancy.
A final reason why a “mosaic” cfDNA screen may not directly correlate with a mosaic diagnostic outcome is that there are other biological reasons why cfDNA results may have a depressed MR. For instance, if a co‐twin demise occurred earlier in the pregnancy, cfDNA being released from the residual retained placental cells could remain in maternal circulation for several weeks after the loss. 15 If the demised twin was affected with aneuploidy, then the cfDNA being contributed by the residual placenta could result in a positive cfDNA screen for the surviving twin, perhaps with a depressed MR due to the normal cfDNA contribution from the surviving euploid fetus.
5. CONCLUSION
Experience with cfDNA screening since 2011 has uncovered trends that allow for a better understanding of the technology and interpretation of the data. One of the trends that has become apparent is the tendency for samples with “mosaic” cfDNA data to have lower positive predictive values.
The current study explores the association between a laboratory data metric, deemed “mosaicism ratio,” and the PPV associated with the result. In general, as MR decreases, so does PPV, and this study helps to quantify that correlation.
Regardless of the MR or PPV associated with the patient's result, current guidelines strongly recommend confirming positive cfDNA results using amniocentesis or chorionic villus sampling. A high MR does not replace the need for confirmatory testing, and a low MR should not diminish the need for follow‐up diagnostic studies.
Even in instances where cfDNA results are not confirmed by diagnostic studies, possibly because mosaicism is present but confined to the placenta, these findings should not be dismissed as clinically irrelevant. Placental mosaicism, in the apparent absence of fetal involvement, has been associated with an increased risk for adverse pregnancy outcomes and fetal anomalies for certain aneuploidies, often due to placental dysfunction, occult fetal mosaicism, or uniparental disomy resulting from early trisomy rescue, among other causes. 16
The data presented in this study may help clinicians provide a more personalized risk assessment for their patients based on sample‐specific metrics. As the collective understanding of cfDNA technology continues to evolve, it is important for laboratories to report data trends and findings that may assist providers with result interpretation and patient counselling.
Future studies could focus on sex chromosome aneuploidies, rare autosomal aneuploidies, or copy number variants and the impact of MR on PPV for these conditions. Additionally, studies could address the application of mosaicism ratio in multifetal gestations.
CONFLICT OF INTEREST
All authors are employees of Laboratory Corporation of America Holdings.
Supporting information
Figure S1 50 kb trace suggestive of (A) non‐mosaic trisomy 13 data, and (B) mosaic trisomy 13 data from prenatal cfDNA screening specimens
Table S1: Comparison of the number of cases in the overall positive screening cohort vs. cohort with diagnostic outcomes, divided by MR ranges for trisomy 13, trisomy 18, and trisomy 21
Table S2: PPVs by 0.1 MR range with lower and upper 95th confidence interval
Table S3: Diagnostic studies with mosaic karyotype and/or microarray results
ACKNOWLEDGMENT
Theresa Boomer, MS, CGC.
Rafalko JM, Caldwell S, Tynan J, Almasri E, Weinblatt V, McCullough R. Impact of mosaicism ratio on positive predictive value of cfDNA screening. Prenatal Diagnosis. 2021;41:28–34. 10.1002/pd.5863
DATA AVAILABILITY STATEMENT
Research data are not shared.
REFERENCES
- 1. Norton M, Jacobsson B, Swamy G, et al. Cell‐free DNA analysis for noninvasive examination of trisomy. N Engl J Med. 2015;372(17):1589‐1597. [DOI] [PubMed] [Google Scholar]
- 2. American College of Obstetricians and Gynecologists . Cell‐free DNA Screening for Fetal Aneuploidy. Committee opinion number 640. Obstet Gynecol. 2015;126:e31‐e37. [DOI] [PubMed] [Google Scholar]
- 3. Brison N, Neofytou M, Dehaspe L, et al. Predicting fetoplacental chromosomal mosaicism during non‐invasive prenatal testing. Prenat Diagn. 2018;38(4):258‐266. [DOI] [PubMed] [Google Scholar]
- 4. Oneda B, Sirleto P, Baldinger R, et al. Genome‐wide non‐invasive prenatal testing in single‐ and multiple‐pregnancies at any risk: identification of maternal polymorphisms to reduce the number of unnecessary invasive confirmation testing. European Journal of Obstetrics & Gynecology and Reproductive Biology. 2020;252:19‐29. [DOI] [PubMed] [Google Scholar]
- 5. Jensen T, Zwiefelhofer T, Tim R, et al. High‐throughput massively parallel sequencing for fetal aneuploidy detection from maternal plasma. PLoS ONE. 2013;8(3):e57381. [DOI] [PMC free article] [PubMed] [Google Scholar]
- 6. Kim S, Hannum G, Geis J, et al. Determination of fetal DNA fraction from the plasma of pregnant women using sequence read counts. Prenat Diagn. 2015;35(8):810‐815. [DOI] [PubMed] [Google Scholar]
- 7. Lefkowitz R, Tynan J, Liu T, et al. Clinical validation of a noninvasive prenatal test for genomewide detection of fetal copy number variants. Am J Obstet Gynecol. 2016;215(2):227.e1‐227.e16. [DOI] [PubMed] [Google Scholar]
- 8. Zhao C, Tynan J, Ehrich M, et al. Detection of fetal subchromosomal abnormalities by sequencing circulating cell‐free DNA from maternal plasma. Clin Chem. 2015;61(4):608‐616. [DOI] [PubMed] [Google Scholar]
- 9. Ehrich M, Tynan J, Mazloom A, et al. Genome‐wide cfDNA screening: clinical laboratory experience with the first 10,000 cases. Genet Med. 2017;19:1332‐1337. [DOI] [PubMed] [Google Scholar]
- 10. Wardrop J, McCullough R, Boomer T, Cacheris P. Mosaicism ratio in cfDNA testing: a potential tool to identify discordant results. Poster Presented at the American College of Medical Genetics and Genomics (ACMG) Annual Clinical Genetics Meeting, Phoenix, AZ. 2017:21‐25.
- 11. VassarStats: Website for Statistical Computation . 2020. http://vassarstats.net/. Accessed April 23, 2020.
- 12. Social Science Statistics . 2020. https://www.socscistatistics.com/tests/ztest/. Accessed April 23, 2020.
- 13. Grati F. Chromosomal mosaicism in human Feto‐placental development: implications for prenatal diagnosis. J Clin Med. 2014;3(3):809‐837. [DOI] [PMC free article] [PubMed] [Google Scholar]
- 14. Grati F. Implications of fetoplacental mosaicism on cell‐free DNA testing: a review of a common biological phenomenon. Ultrasound Obstet Gynecol. 2016;48(4):415‐423. [DOI] [PubMed] [Google Scholar]
- 15. Bevilacqua E, Chen K, Wang Y, et al. Cell‐free DNA analysis after reduction in multifetal pregnancy. Ultrasound Obstet Gynecol. 2020;55(1):132‐133. [DOI] [PubMed] [Google Scholar]
- 16. Kalousek D. Pathogenesis of chromosomal mosaicism and its effect on early human development. Am J Med Genet. 2000;91(1):39‐45. [DOI] [PubMed] [Google Scholar]
Associated Data
This section collects any data citations, data availability statements, or supplementary materials included in this article.
Supplementary Materials
Figure S1 50 kb trace suggestive of (A) non‐mosaic trisomy 13 data, and (B) mosaic trisomy 13 data from prenatal cfDNA screening specimens
Table S1: Comparison of the number of cases in the overall positive screening cohort vs. cohort with diagnostic outcomes, divided by MR ranges for trisomy 13, trisomy 18, and trisomy 21
Table S2: PPVs by 0.1 MR range with lower and upper 95th confidence interval
Table S3: Diagnostic studies with mosaic karyotype and/or microarray results
Data Availability Statement
Research data are not shared.