

Abstract
A nonlinear mixed effects modeling approach was used to conduct a model‐based meta‐analysis (MBMA) of longitudinal, summary‐level, baseline‐corrected 28‐joint Disease Activity Score (ΔDAS28) clinical trial data from seven approved rheumatoid arthritis (RA) drugs (abatacept, adalimumab, certolizumab, etanercept, rituximab, tocilizumab, and tofacitinib), representing 130 randomized clinical trials in 27,355 patients. All of the drugs except tocilizumab were found to have relatively similar ΔDAS28 time courses and efficacy (baseline‐corrected and placebo‐corrected) at 24 weeks and beyond of approximately 0.87–1.3 units in the typical RA patient population. Tocilizumab was estimated to have a differentially greater response of 1.99 at 24 weeks, likely due to its disproportionate effect on the acute‐phase cytokine interleukin‐6. Baseline DAS28, disease duration, percentage of male participants, and the year of conduct of the trial were found to have statistically significant effects on the timing and/or magnitude of ΔDAS28 in the control arms. Clinical trial simulations using the present MBMA indicated that abatacept, certolizumab, etanercept, tocilizumab, and tofacitinib would be expected to have a greater than 70% probability of showing a statistically significant difference vs. control at Week 6 with a sample size of ~ 30 patients per arm. In future RA clinical trials, an interim analysis conducted as early as 6 weeks after treatment initiation, with relatively small sample sizes, should be sufficient to detect the ΔDAS28 treatment effect vs. placebo.
Study Highlights.
WHAT IS THE CURRENT KNOWLEDGE ON THE TOPIC?
☑ This is the first model‐based meta‐analysis of 28‐joint Disease Activity Score (DAS28) in rheumatoid arthritis (RA). Prior model‐based meta‐analyses in RA have focused on American College of Rheumatology score.
WHAT QUESTION DID THIS STUDY ADDRESS?
☑ Is DAS28–erythrocyte sedimentation rate highly related with DAS28–C‐reactive protein across RA therapies with different mechanisms of action? Can historical data on the time‐course of DAS28 be used to estimate the comparative efficacy of RA therapies? Can a model‐based meta‐analysis (MBMA) of DAS28 across numerous RA therapies be used to determine the minimum time and sample size to conduct an interim analysis?
WHAT DOES THIS STUDY ADD TO OUR KNOWLEDGE?
☑ This analysis provides a robust comparative efficacy of numerous RA therapies using DAS28. It also uses clinical trial simulation to propose an optimal time and sample size for conducting an interim analysis of efficacy.
HOW MIGHT THIS CHANGE CLINICAL PHARMACOLOGY OR TRANSLATIONAL SCIENCE?
☑ This analysis demonstrates the utility of MBMAs in integrating data across therapies and clinical trials, and then utilizing the data for decision making in clinical drug development. The work provides the methodology and framework for how this can be implemented.
Rheumatoid arthritis (RA) is an autoimmune disease characterized by inflammation, autoantibody production, and progressive joint damage. 1 Multiple clinical indexes are available to evaluate RA disease activity, including the 28‐joint Disease Activity Score (DAS28). 2 DAS28 is a continuous measure of disease activity and typically exhibits a normal distribution in populations with RA. 3 DAS28 integrates measures of physical examination (tender and swollen joint counts), acute‐phase reactants (erythrocyte sedimentation rate (ESR) or C‐reactive protein (CRP)), and patient self‐assessed global health; the combination of these variables into a single score may more comprehensively capture disease severity than the individual variables. 4 , 5 Two additional advantages of the DAS28 include (i) its clinical diagnostic utility, meaning that scores can be readily interpreted to reflect disease activity categories (i.e., remission (< 2.6) and low (≥ 2.6 to < 3.2), moderate (≥ 3.2 to ≤ 5.1), or high (> 5.1) disease activity), and (ii) its high sensitivity to detect small changes in disease severity. 6 , 7 Such high sensitivity to changes in disease activity has led to increased adoption of DAS28 in clinical practice and for regulatory agencies to assess its efficacy over the dichotomous American College of Rheumatology (ACR) score. 8 , 9 , 10 The high sensitivity of DAS28 makes it particularly useful in the design of smaller clinical trials, typically early in development, where large sample sizes are less feasible. 11
In addition to conventional synthetic disease‐modifying antirheumatic drugs (csDMARDs) such as methotrexate, a range of biologic agents and small molecules are approved for the treatment of RA, encompassing a variety of mechanisms of action (MoAs). Existing clinical practice recommendations in the United States and Europe provide evidence‐based algorithms for the treatment of RA. 12 , 13 The competitive nature of drug development in RA necessitates informed decision making as early as possible based on the efficacy of investigational treatments relative to that of approved drugs. Additionally, early decision making in clinical development will reduce the risk that patients with RA undergo prolonged exposure to ineffective drugs. In early‐stage clinical trials in RA, efficacy is typically assessed over a period of ≥ 12 weeks. 14 , 15 , 16 , 17 , 18 , 19 Considering the abundance of DAS28 data that have been reported for approved therapies, this analysis sought to determine (i) whether evaluation of DAS28 at a timepoint prior to 12 weeks can be predictive of longer‐term efficacy, and (ii) whether historical DAS28 data for approved RA treatments can be used to evaluate the comparative efficacy of novel RA treatments in early development.
Model‐based meta‐analysis (MBMA) is an approach to meta‐analysis that explicitly incorporates model‐based regression of longitudinal response and/or dose response in the analysis of summary‐level data. 20 As in traditional meta‐analysis, MBMA allows for the estimation of the mean trial outcome and its variability. The additional benefit of this approach is its ability to quantify the impact of population/trial design characteristics. Thus, the inclusion of a model to characterize longitudinal treatment responses and/or the dose response allows for MBMA to predict/simulate new clinical scenarios through clinical trial simulation. 21 , 22 MBMA approaches are increasingly being used to leverage existing publicly available data and to inform the development of new drugs in a range of diseases. 22 , 23 , 24 , 25 , 26 Previous longitudinal MBMAs established the framework for indirectly comparing the magnitude of treatment response and time course in RA, using ACR scores. 25 , 27 , 28 Based on these previous MBMAs, it is reasonable to hypothesize that the existing MBMA framework can be extended to other efficacy measures (e.g., DAS28).
Here, we describe the application of an MBMA to characterize baseline‐corrected DAS28 (ΔDAS28) time‐course profiles for RA treatments with different MoAs to determine whether this analysis can guide early decision making for the development of RA treatments. In particular, whether early efficacy assessment (< 12 weeks) could be indicative of efficacy at 12 weeks and beyond, and whether historical ΔDAS28 data could be used for assessment of comparative efficacy of new vs. approved RA treatments.
METHODS
Data sources
The data analyzed in this report were derived from the Quantify RA Clinical Outcomes Database (version 03/08/2018; Certara, Princeton, NJ, USA), a comprehensive database of RA clinical trials published from 1994 to 2018, named “RA database” hereafter. It includes efficacy and safety information on all biologics and newer synthetic DMARDs currently approved or in development for the treatment of RA. The RA database contains information for 266 clinical trials, representing 884 treatment arms and ~ 94,609 patients from 507 references (see Supplementary Materials ). An earlier version of the RA database, including publications up to 2009, was described by Mandema et al. in 2011. 29
Assessment of the DAS28‐CRP vs. DAS28‐ESR relationship
Most of the trials in the RA database reported either DAS28‐ESR or DAS28‐CRP, with only a small number (~ 10%) reporting both. Separate modeling of each end point was not feasible because of the limited number of records for some of the drugs. To examine whether it was reasonable to pool records of the two DAS28 end points, an analysis of the linear relationship between the two end points was conducted.
Time‐matched DAS28‐ESR and DAS28‐CRP records were extracted from the RA database. Records with missing DAS28‐ESR and/or DAS28‐CRP values were excluded, and duplications due to multiple reports of the same trial outcome were removed. The data set consisted of 323 paired records of DAS28‐ESR and DAS28‐CRP representing 17 drugs with six distinct MoAs (anti–cluster of differentiation 20 (CD20), T‐cell costimulation modulation, interleukin (IL)‐17 inhibition, anti–IL‐6R, anti‐tumor necrosis factor (TNF), and Janus kinase inhibition) (Table 1 ) and trial durations of up to 52 weeks (Table S1 ). The linear relationship between DAS28‐ESR and DAS28‐CRP was assessed using linear mixed‐effects (LME) regression (Eq. 1 ) with weighting by sample size in R (v.3.4.3; Bristol‐Myers Squibb, Princeton, NJ, USA):
| (1) |
where the DAS28‐CRP (DAS28_CRP in Eq. 1 ) in study i, arm j, observation k, was estimated based on the linear relationship with the DAS28‐ESR (DAS28_ESR in Eq. 1 ) measurement in study i, arm j, observation k, with an intercept of b and a slope of a. Interstudy () and interarm () random effects were estimated, with the residual random effects weighted by the square root of the sample size in each study arm (Ni,j)−0.5 εi,j,k. Baseline DAS28, drug class, and duration of treatment were evaluated as covariates with Akaike information criterion used for model selection. The performance of this model (Eq. 1 ) was also examined using diagnostic plots.
Table 1.
Distribution by mechanism of action of time‐matched pairs of DAS28‐ESR and DAS28‐CRP in the correlation analysis
| Mechanism (drug) | Number of paired records |
|---|---|
| Anti‐CD20 (CT‐P10, ofatumumab, rituximab) | 21 |
| T‐cell costimulation modulator (abatacept) | 7 |
| Anti–IL‐17 (secukinumab) | 28 |
| Anti–IL‐6R (sarilumab, vobarilizumab) | 42 |
| Anti‐TNF (adalimumab, certolizumab, CT‐P13, etanercept, golimumab, infliximab) | 27 |
| JAK inhibitor (baricitinib, peficitinib, tofacitinib) | 102 |
| DMARD (predominantly methotrexate, as background) | 85 |
CD20, cluster of differentiation 20; CRP, C‐reactive protein; DAS28, 28‐joint Disease Activity Score; DMARD, disease‐modifying anti‐rheumatic drug; ESR, erythrocyte sedimentation rate; IL‐17, interleukin‐17; IL‐6R, interleukin‐6 receptor; JAK, Janus kinase; TNF, tumor necrosis factor.
To ascertain the degree to which the marginal DAS28‐CRP predictions could be inaccurate, absolute percentage error (APE; Eq. 2 ), and mean APE (MAPE; Eq. 3 ) were calculated. The APE provides individual relative prediction errors, and the 95th percentile of the APE can serve as a worst‐case measure of the inaccuracy of predictions. The MAPE provides the average of all individual relative prediction errors.
| (2) |
| (3) |
Assessment of the CRP vs. ESR relationship
The DAS28‐CRP vs. DAS28‐ESR relationship could not be assessed for tocilizumab as none of the 14 trials of tocilizumab in the RA database reported both DAS28‐ESR and DAS28‐CRP. Because it was desirable to include tocilizumab in the DAS28 MBMA, we sought to determine whether the ΔDAS28 data for tocilizumab could be pooled into the analysis set based on the DAS28‐CRP vs. DAS28‐ESR relationship described above. As such, it was necessary to demonstrate that this relationship would be applicable to tocilizumab. As the only difference between the calculation of DAS28‐CRP and DAS28‐ESR is the CRP/ESR measurement, any relationship that may exist between DAS28‐CRP and DAS28‐ESR should be reflected in the relationship between CRP and ESR. A data set extracted from the RA data set containing time‐matched pairs of CRP and ESR was used to conduct an LME regression similar to the one described above for DAS28‐CRP vs. DAS28‐ESR. The data set contained 689 paired data records from 15 different drug mechanisms, representing 32 different drugs (including tocilizumab). The CRP vs. ESR relationship was described with the following equation (Eq. 4 ):
| (4) |
where the CRP in study i, arm j, observation k, was estimated based on the linear relationship with the ESR measurement in study i, arm j, observation k with an intercept of b and a slope of a. Interstudy () and interarm () random effects were estimated, with the residual random effects weighted by the square root of sample size in each study arm (Nij)−0.5 εi,j,k
MBMA of the ΔDAS28 time course
ΔDAS28 time‐course data for randomized treatment (either placebo or active drug on a stable background of csDMARDs) were extracted from the RA database for the following therapies representing diverse MoAs: abatacept, adalimumab, certolizumab, etanercept, rituximab, tocilizumab, and tofacitinib. Eligible trials included all patients with active RA; trial arms in which patients received concomitant RA treatment (other than csDMARDs and the investigational drug being evaluated) were excluded. Trials in which patients received prior biologic therapy were eligible for inclusion. Records with baseline or all post‐baseline DAS28 values missing were excluded; duplications were removed. Active treatment arms were included in the MBMA for the regulatory‐approved doses in adults with moderate‐to‐severe RA. ΔDAS28‐ESR and ΔDAS28‐CRP were pooled for the MBMA by converting ΔDAS28‐ESR to ΔDAS28‐CRP using the relationship described in Eq. 1 . The MBMA data set consisted of 994 longitudinal ΔDAS28 summary‐level data records, representing data from 27,355 patients evaluated in 130 randomized, controlled clinical trials (197 trial arms) of seven approved RA drugs with five distinct MoAs. The data set included 106 background DMARD treatment arms, many of which came from trials that met the overall criteria for inclusion, but with active arms that did not meet the criteria for inclusion. This allowed for a more robust estimate of the time course of ΔDAS28 in placebo and the associated between‐trial covariate effects. The key characteristics of the trials and patient populations included in the meta‐analysis are provided in Table 2 .
Table 2.
Characteristics of studies extracted from the RA database used in an MBMA of change from baseline in DAS28 over time
| Mechanism | Drug | Number of trials | Number of patients | Baseline DAS28 a | Age (years) a | % male a | Disease duration (years) a |
|---|---|---|---|---|---|---|---|
| T‐cell costimulation modulator | Abatacept | 16 | 3478 | 5.9 (4.0–6.4) | 51 (45–56) | 20 (12–41) | 6.6 (0.5–12) |
| Anti‐TNF | Adalimumab | 15 | 2802 | 5.8 (5.5–6.4) | 53 (48–56) | 21 (15–28) | 5.3 (0.3–11) |
| Anti‐TNF | Certolizumab | 10 | 2654 | 5.5 (3.9–6) | 53 (50–56) | 21 (16–28) | 5.6 (0.24–8.7) |
| Anti‐TNF | Etanercept | 8 | 1747 | 4.9 (3.8–5.7) | 52 (48–60) | 18 (12–29) | 7.7 (6.2–9.3) |
| Anti‐CD20 | Rituximab | 14 | 1336 | 5.8 (5.3–6.2) | 53 (51–58) | 21 (9.8–33) | 9.9 (4.9–13) |
| Anti–IL‐6R | Tocilizumab | 18 | 3724 | 5.5 (4.4–6) | 53 (50–57) | 19 (9.8–27) | 7.8 (2.2–11) |
| JAK inhibitor | Tofacitinib | 10 | 1611 | 5.6 (5–5.8) | 53 (50–55) | 17 (12–28) | 8.3 (2.9–13) |
| Placebo b | Placebo | 106 | 10003 | 5.7 (3.7–6.5) | 53 (46–61) | 19 (0–45) | 8.2 (0.57–14) |
All patients were on stable background therapies, predominantly methotrexate.
CD20, cluster of differentiation 20; DAS28, 28‐joint disease activity score; IL‐6R, interleukin‐6 receptor; JAK, Janus kinase; MBMA, model‐based meta‐analysis; RA database, Quantify RA Clinical Outcomes Database; TNF, tumor necrosis factor.
Values are mean (min–max) of the reported mean values for the studies, converted to DAS28‐CRP using the LME (linear mixed‐effects) model. Means are weighted by the square root of sample size for each trial.
Placebo refers to background therapy in the control arm of the various studies included in the analysis.
A non‐linear mixed‐effects modeling approach was implemented to characterize the mean ΔDAS28 vs. time and inter‐trial variability using the methodology previously described by Ahn and French in 2010. 30 Two different models of ΔDAS28 vs. time were evaluated, one with an exponential function (Eq. 5 ) and the other with a Hill function Eq. 6 . In both models, the ΔDAS28 at time t, ΔDAS28(t) for a given study i, arm j, was the sum of placebo and drug effects, both on top of background therapies.
| (5) |
| (6) |
where is the maximum ΔDAS28 in the placebo arm for study i, is the maximum ΔDAS28 treatment effect in the active treatment arm for each drug in study i, arm j; and represent the rate of change vs. time in ΔDAS28 for placebo and each drug in study i, respectively; and represent the time to reach half of maximum ΔDAS28 for placebo and each drug in study i; γ is the Hill coefficient that governs the shape of the ΔDAS28 vs. time relationship in the Hill function; Ni,j is the mean sample in the study i, arm j; and εi,j (t) is the within‐arm residual error estimated with an additive normal distribution. Inter‐trial variability for the model parameters was estimated using additive normal (E max; Eq. 7 ) or proportional log‐normal (Rt and ET50; Eq. 8 ) distributions.
| (7) |
| (8) |
where Pi is the parameter estimate for an individual trial, P TV is the estimated typical value of the parameter, ηi is the random effect for inter‐trial variability, and Ni is the mean sample size per arm for the trial. Both the interarm and within‐arm residual random effects were weighted using the square root of the sample size normalized to 100 participants. 26
Covariate selection for testing was based on clinical plausibility and focused on baseline variables. Tested covariates included mean baseline DAS28, mean age, percentage of male participants in a given trial arm (binary; < 18.5%), mean disease duration (years), percentage of participants who failed methotrexate (binary; < 100%), percentage of participants on background csDMARDs (binary; < 50%), and the year of trial conduct (Table 2 ). Covariates were incorporated in the model additively with continuous covariates being log transformed and normalized to the median value in the data set (Eq. 9 ), and binary categorical covariate effects estimated only for the particular category selected (Eq. 10 ). The median of the covariate values was used as the cutoff for binary (%) variables, thus converting a continuous % scale to yes/no binary covariate (i.e., percentage of male participants < 18.5% = 0; percentage of male participants ≥ 18.5% = 1). Covariate effects were each estimated separately, and then incorporated into the full model if the reduction in the objective function value (OFV) was statistically significant at a level of 0.05 (nominal). A sequential backward elimination procedure was conducted using the full model in which the criterion for retaining a covariate was an increase in OFV that was statistically significant at a level of 0.01 (nominal).
| (9) |
| (10) |
where COVEFFi is the covariate effect in study i; θCOV is the estimated effect of the covariate; COVi is the covariate value for study i; COVmed is the median covariate value in the data set; and INDi is an indicator variable with a value of 1 or 0 depending on the presence or absence of the categorical variable. Covariate effects on E max, ET50, and γ were evaluated for drug and placebo arms.
Estimation of model parameters was conducted in NONMEM 7.3 (ICON plc, Dublin, Ireland), using the first‐order conditional estimation algorithm. Covariate selection was conducted using Perl Speaks NONMEM v4.4.8. 31 Estimation of the uncertainty in the model parameters was conducted using the Sampling Importance Resampling method described by Dosne et al. 32
Given that three different overlapping data sets were used in the above described analyses, a Venn diagram of the overlap of the data sets is provided in the supplement (Figure S1 ).
RA clinical trial simulation
The longitudinal ΔDAS28 model was used to conduct a simulation of hypothetical RA clinical trials to determine the optimal timing of an interim analysis of efficacy. Baseline characteristics of the simulated RA population were based on the median values across the trials in the meta‐analysis data set.
As the MBMA could predict only the mean ΔDAS28(t), an LME model was developed using the MBMA data set to estimate the within‐arm intersubject variance so that clinical trial simulation could be performed. The model was based on the relationship between the pooled (i.e., sum of variances of all sources) and sample variance (i.e., within‐arm interpatient variance) as described in Furukawa et al. (Eq. 11 ). 33
| (11) |
where Vi(t) is the variance of study i as a function of time, normalized to sample size (N − 1) 33 ; β0,i is the estimated variance at t = 0 in study i; β 1 is the estimate for the effect of time (normalized to the median time (t med)); β 2 is the estimate for the effect of ∆DAS28i (t); and ηi and εi (t) are the between‐trial and within‐trial random effects, respectively.
Two sets of clinical trial simulations were conducted, the first in which the sample size was held constant at N = 50 per arm but the timing of the interim analysis varied between 0 and 12 weeks; the other in which the timing of the interim analysis was held constant at 6 weeks but the sample size varied between N = 2 and 300 per arm. Ten thousand trials were simulated to determine the probability of detecting a statistically significant difference (asymptotic normal 90% confidence intervals do not overlap) between the treatment and placebo arms for each scenario. The simulations were conducted using R (v.3.5.2).
RESULTS
Assessment of the DAS28‐CRP vs. DAS28‐ESR relationship
A strong linear relationship between DAS28‐CRP and DAS28‐ESR that was independent of drug class, baseline DAS28, and time since start of treatment was demonstrated by the model in Eq. 1 (Figure 1 ). The slope (a) and intercept (b) parameters were estimated to be 0.899 ± 0.00568 and −0.194 ± 0.0484, respectively, indicating a linear relationship with a constant difference of 0.2 units. The inter‐trial and interarm standard deviations (SDs) were 0.183 and 0.084, respectively, indicating a low variance relative to the range of DAS28 measurements. The marginal predictions of DAS28‐CRP were reasonably accurate with a 95th percentile of the APE of 13% and a MAPE of 4.2%. These results provide confidence in pooling the ΔDAS28‐ESR and ΔDAS28‐CRP data in the subsequently described MBMA.
Figure 1.
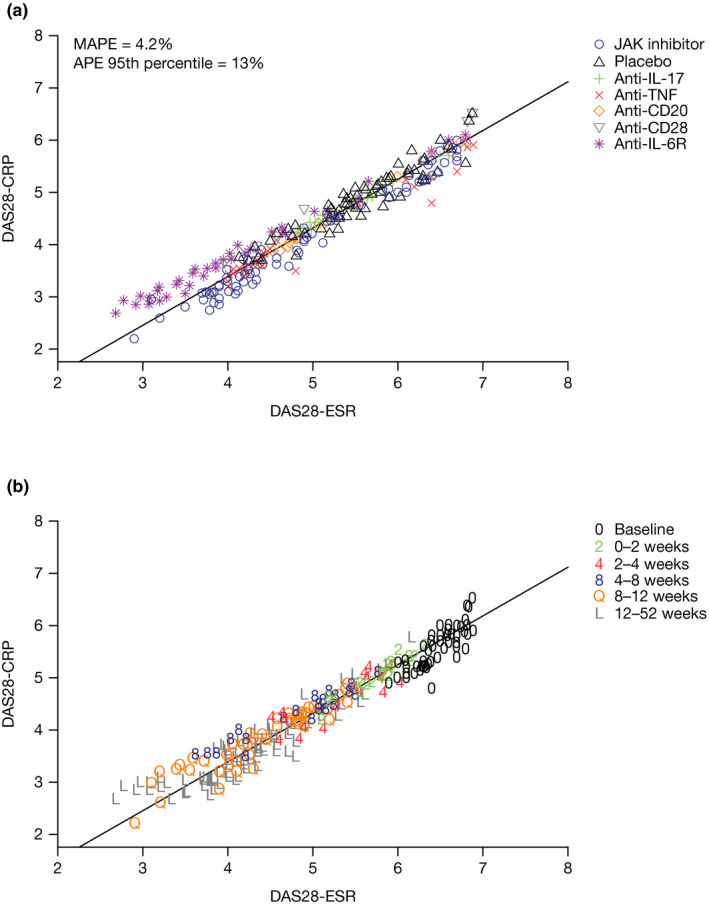
DAS28‐ESR and DAS28‐CRP relationship (a) by mechanism of action and (b) by duration of treatment. DAS28‐CRP = −0.194 ± 0.0484 × DAS28‐ESR + 0.899 ± 0.00568. APE, absolute percentage error; CD, cluster of differentiation; DAS28, 28‐joint Disease Activity Score; CRP, C‐reactive protein; ESR, erythrocyte sedimentation rate; IL, interleukin; JAK, Janus kinase; MAPE, mean APE; TNF, tumor necrosis factor.
Assessment of the CRP vs. ESR relationship
CRP and ESR were found to have a strong linear relationship that was not dependent on drug MoA (Figure S2 ), indicating that the DAS28‐CRP vs. DAS28‐ESR relationship established above was applicable to tocilizumab.
MBMA of the ΔDAS28 time course
Prior to conducting the MBMA, ΔDAS28‐ESR values from studies that did not report DAS28‐CRP were converted to ΔDAS28‐CRP using the aforementioned LME model. This provided summary‐level ΔDAS28‐CRP data from 197 trial arms from 130 randomized controlled trials of seven different approved RA therapies to conduct the MBMA (Table 2 ). Funnel plots of the ΔDAS28‐CRP data relative to the weights for the observations indicate that the meta‐analysis data were not biased with respect to the sampling variance for any of the drugs included in the MBMA (data not shown). Of the two models evaluated, based on a comparison of the Akaike information criterion (E max: −1587, exponential: −1412), the E max model provided a better fit to the ΔDAS28 vs. time data compared with the exponential model. A term for progression of ΔDAS28‐CRP over time was added, in addition to the drug and placebo effects, because it improved the fit of the data (ΔOFV ~ 108):
| (12) |
where PROG is the increase in ΔDAS28‐CRP over time (i.e., worsening of disease symptoms), and was estimated to be 0.105 units per year. This final model provided a good fit to the mean ΔDAS28 time course data for all treatments and trials (Figure 2 ).
Figure 2.
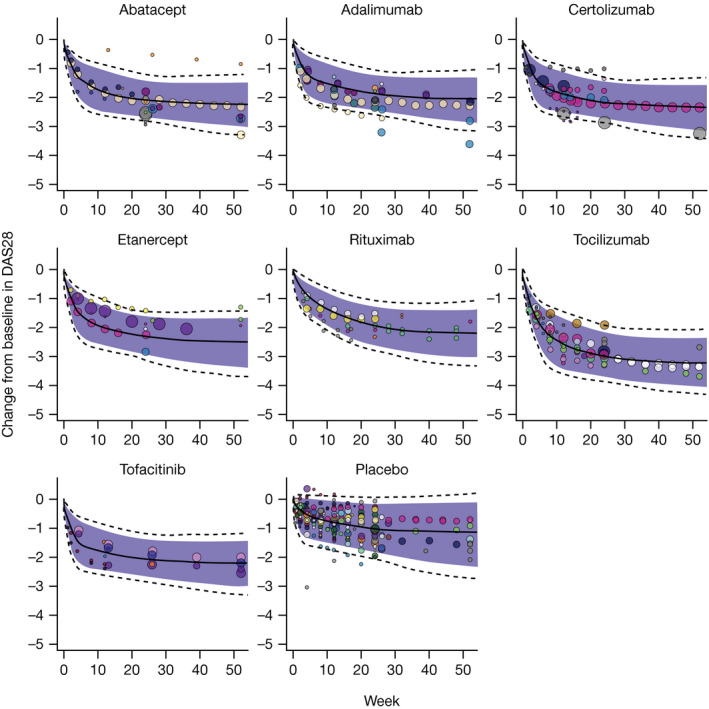
Mean observed and predicted DAS28 change from baseline vs. time. Solid lines: median predicted ΔDAS28; dotted lines: 95% prediction interval for ΔDAS28; shaded region: 90% prediction interval for ΔDAS28; circles represent observed trial mean ΔDAS28 with size proportional to sample size, and a separate color for each trial. Data above the prediction interval for abatacept were from an arm with a small sample size (n = 43) in Manders et al. that had a relatively low baseline (DAS28‐ESR ~ 4.7; DAS28‐CRP ~ 4.0). 48 ΔDAS28, change from baseline in DAS28; DAS28, 28‐joint Disease Activity Score.
The model‐estimated parameters for treatment and covariate effects are provided in Table S3 . Of the covariate‐parameter combinations evaluated, several significant trial‐level covariate effects were estimated for the placebo ΔDAS28 response (E max,placebo ~ baseline DAS28; E max,placebo ~ disease duration; ET50,placebo ~ baseline DAS28; γ placebo ~ (male participants < 18.5%)) and one for the slope of ΔDAS28 progression (PROG ~ trial year; Table S3 ). The estimated ΔDAS28 treatment effects at 4, 12, 24, and 48 weeks in a typical RA population for the seven drugs in the meta‐analysis are provided in Table 3 . Similarly, Figure 3a shows the 24‐week ΔDAS28 for all seven therapies and placebo in the same population, while Figure 3b shows the 24‐week time course of ΔDAS28 treatment effects (i.e., placebo‐subtracted ΔDAS28). All of the drugs except for tocilizumab are estimated to have similar ΔDAS28 responses at 24 weeks and beyond in the typical RA patient population. Tocilizumab is estimated to be associated with a greater ΔDAS28 response with a 48‐week response of 2.15. Rituximab had a relatively slower onset of action compared with the other drugs (Figure 3b and Table 3 ).
Table 3.
Estimated DAS28 baseline normalized placebo and treatment effects at different timepoints in patients who failed methotrexate on a background DMARD
| Drug |
Maintenance treatment regimen |
Decrease from baseline in DAS28 (Median and 95% CI) a , b | |||
|---|---|---|---|---|---|
| 4 weeks | 12 weeks | 24 weeks | 48 weeks | ||
| Abatacept | 10 mg/kg IV q.4wk or 125 mg q.wk SC | 0.715 (0.571–0.896) | 1.02 (0.852–1.19) | 1.14 (0.96–1.32) | 1.22 (1.02–1.41) |
| Adalimumab | 40 mg SC q.2wk | 0.607 (0.459–0.788) | 0.801 (0.637–0.977) | 0.871 (0.701–1.05) | 0.911 (0.735–1.1) |
| Certolizumab | 200 mg SC q.2wk or 400 mg SC q.4wk | 0.802 (0.643–0.993) | 1.04 (0.853–1.24) | 1.13 (0.921–1.34) | 1.18 (0.956–1.39) |
| Etanercept | 50 mg SC q.wk | 0.794 (0.56–1.14) | 1.06 (0.833–1.31) | 1.17 (0.921–1.41) | 1.23 (0.965–1.49) |
| Rituximab | 1,000 mg INF × 2/year | 0.368 (0.295–0.456) | 0.75 (0.609–0.897) | 1.02 (0.816–1.21) | 1.24 (0.976–1.49) |
| Tocilizumab | 8 mg/kg IV q.4wk | 1.14 (1.01–1.28) | 1.73 (1.58–1.88) | 1.99 (1.82–2.16) | 2.15 (1.96–2.33) |
| Tofacitinib | 5 mg PO b.i.d. | 0.756 (0.603–0.916) | 0.949 (0.766–1.13) | 1.01 (0.817–1.21) | 1.05 (0.844–1.25) |
| Placebo c | NA | 0.576 (0.496–0.658) | 0.872 (0.794–0.948) | 1.07 (0.984–1.15) | 1.25 (1.12–1.36) |
b.i.d., twice daily; CI, confidence interval; DAS28, 28‐joint Disease Activity Score; DMARD, disease‐modifying anti‐rheumatic drug; IL‐6R, interleukin‐6 receptor; INF, infusion; IV, intravenous; JAK, Janus kinase; NA, not applicable; PO, oral; q.wk, weekly; q.2wk, every 2 weeks; q.4wk, every 4 weeks; SC, subcutaneous.
95% confidence interval represents the variability in the posterior distribution of parameters and inter‐trial variability.
Estimated mean DAS28 response in a trial with 19% male participants, with a mean age of 53 years, a disease duration of 8.2 years, and a mean baseline DAS28 of 6.2.
Placebo is only corrected for baseline DAS28, while the drug effects are corrected for baseline and placebo.
Figure 3.
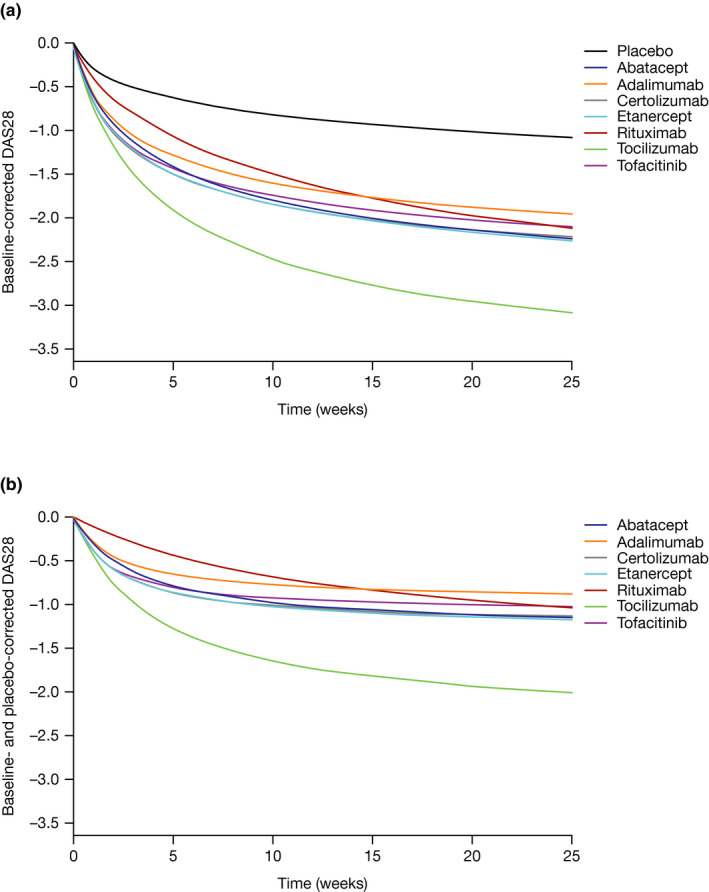
Change from baseline in (a) mean DAS28 and (b) placebo‐corrected. Treatment regimens: abatacept: 10 mg/kg IV q.4wk or 125 mg SC q.wk; adalimumab: 40 mg SC q.2wk; certolizumab: 200 or 400 mg SC q.2wk; etanercept: 50 mg SC q.wk; rituximab: 1,000 mg INF × 2/year; tocilizumab: 8 mg/kg SC q.4wk; tofacitinib: 5 mg PO b.i.d. DAS28 response in a population that failed methotrexate, is on a background of DMARD and that is 19% male, with a mean age of 53 years, a disease duration of 8.2 years, and a mean baseline DAS28 of 6.2. b.i.d., twice daily; DAS28, 28‐joint Disease Activity Score; DMARD, disease‐modifying anti‐rheumatic drug; INF, infusion; IV, intravenous; PO, oral; q.wk, weekly; q.2wk, every 2 weeks; q.4wk, every 4 weeks; SC, subcutaneous.
RA clinical trial simulation
Estimation of ΔDAS28 SD
Intersubject variability of ΔDAS28, expressed as SD, was estimated using the LME model, as shown in Eq. 11 . The SD was estimated to be 1.10 ± 0.0414 and was found to increase slightly with time (0.0043/week) and magnitude of ΔDAS28 (0.0798 per unit of ΔDAS28). This LME model enabled conversion of arm‐level ΔDAS28 predictions to individual‐level predictions. The marginal predictions of SDs over time were consistent with the observed arm‐level data (Figure S3 ).
Clinical trial simulations
Hypothetical RA clinical trials were simulated to determine the appropriate sample size and timing for an interim analysis of efficacy. The simulated clinical trials were assumed to all have the same baseline characteristics to remove their effects on response time courses. Clinical trial simulations indicated that abatacept, certolizumab, etanercept, tocilizumab and tofacitinib would be expected to have a greater than 70% probability of showing a statistically significant difference compared with placebo at Week 6, with a sample size of ~ 30 patients per arm (Figure 4 ).
Figure 4.
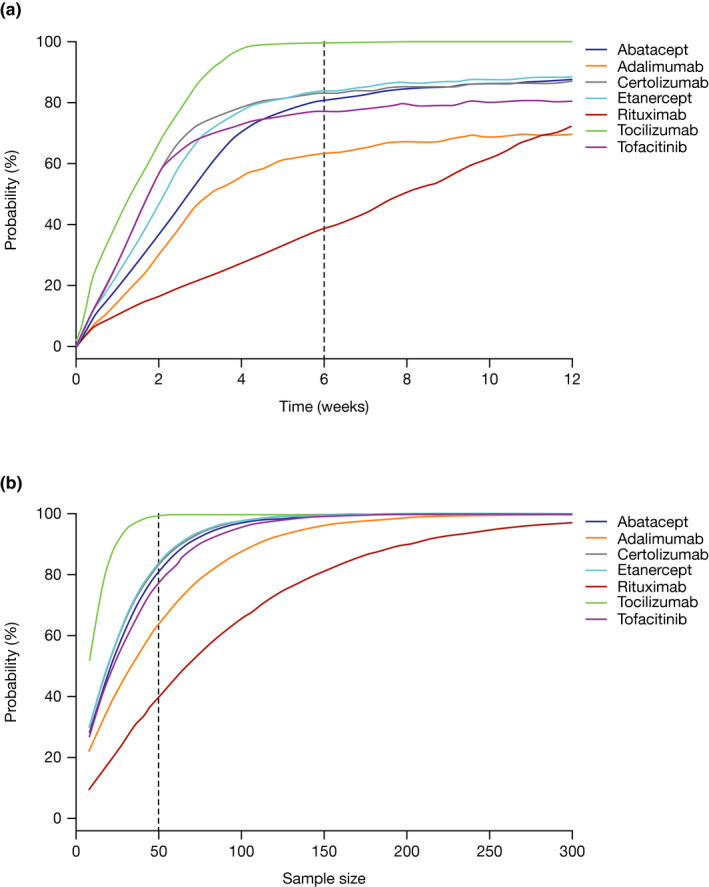
Clinical trial simulation to evaluate the effect of timing and sample size on the utility of DAS28 to demonstrate a treatment effect for different RA therapies. (a) Probability of detecting a treatment effect vs. placebo as a function of time with a constant sample size of N = 50 per arm. (b) Probability of detecting a treatment effect vs. placebo as a function of sample size (per arm) after 6 weeks of treatment. Treatment regimens: abatacept: 10 mg/kg IV or 125 mg SC; adalimumab: 40 mg SC q.2wk; certolizumab: 200 or 400 mg SC q.2wk; etanercept: 50 mg SC q.wk; rituximab: 1,000 mg INF × 2/year; tocilizumab: 8 mg/kg SC q.4wk; tofacitinib: 5 mg PO b.i.d. Dotted lines represent the interim analysis time of (a) 6 weeks or (b) the sample size of N = 50. ΔDAS28, change from baseline in 28‐joint Disease Activity Score; b.i.d., twice daily; DAS28, 28‐joint Disease Activity Score; INF, infusion; IV, intravenous; PO, oral; q.wk, weekly; q.2wk, every 2 weeks; q.4wk, every 4 weeks; RA, rheumatoid arthritis; SC, subcutaneous.
DISCUSSION
The MBMA reported here allows a comparison of the ΔDAS28 time course for seven approved RA therapies, with normalization for trial‐level covariates. The MBMA permits the prediction of the treatment‐specific effects for each of these drugs in a typical RA population. Patients in most of the trial arms in the MBMA had an inadequate response to methotrexate and were rheumatoid factor seropositive with longstanding RA. Some of the arms in the analysis included patients who were previously exposed to biologic agents, primarily anti‐TNFs; most of these patients experienced anti‐TNF failure. Abatacept, adalimumab, certolizumab, etanercept, rituximab, and tofacitinib were estimated to be associated with relatively similar placebo‐corrected ΔDAS28 responses at 24 weeks and beyond of ~ 0.87–1.26 units in the typical RA patient population. Tocilizumab is estimated to have a greater 24‐week ΔDAS28 response of 1.99.
Previous analyses based on cross‐sectional individual patient data identified a strong linear relationship between DAS28‐CRP and DAS28‐ESR. 34 , 35 In the current analysis, a similar relationship was also seen between arm‐level mean DAS28‐ESR and DAS28‐CRP, which was independent of time and drug MoA. This was still true despite a high degree of heterogeneity in baseline variables and treatments in this analysis. While tocilizumab was not included in this analysis due to the lack of relevant data, the strong relationship between CRP and ESR across a variety of MoAs suggested that the LME model for predicting DAS28‐CRP based on DAS28‐ESR would be applicable to tocilizumab. This CRP vs. ESR relationship was found to be independent of time and MoA, suggesting that anti–IL‐6R drugs may not affect CRP differently than ESR, a finding that has been reported previously. 36 Together, these findings justified the pooling of baseline‐corrected DAS28‐CRP in the MBMA, whether they were directly reported or derived from DAS28‐ESR using the established relationship, and support tracking only one of these two end points in future RA clinical trials. The combination of both DAS28‐ESR and DAS28‐CRP data enabled a more robust MBMA, using as much of the available clinical trial data as possible.
While this is the first longitudinal meta‐analysis of DAS28 in RA that we are aware of, these findings are consistent with prior meta‐analyses using ACR scores. In an MBMA of all of these drugs (except tofacitinib) using ACR scores, a slightly better efficacy for the 8 mg/kg tocilizumab dose compared with the other drugs evaluated was seen. 29 A similar differentiation between these compounds was seen in those reaching 20% reduction in ACR criteria. 27 In a Bayesian network meta‐analysis, tocilizumab had greater efficacy compared with rituximab, abatacept, and tofacitinib. 37 Another network meta‐analysis demonstrated that tocilizumab had greater efficacy using ACR scores vs. rituximab and abatacept. 38 However, it appears that the degree of difference for tocilizumab is greater in DAS28 than in ACR scores. This is likely due to the disproportionate effect of IL‐6R inhibition on acute‐phase inflammation, resulting in a much greater effect on either ESR or CRP. 39 While there are qualitative similarities between DAS28 and ACR scores, as reflected by the similar results of the DAS28 MBMA reported here and prior analyses based on ACR scores, 27 , 29 , 37 , 38 the quantitative relationship between the two end points appears to be nonlinear and complex. 40
Of the covariates evaluated on the study level, the effect of background treatment vs. time, the effects of baseline DAS28, disease duration, and the percentage of male participants (< 18.5%) could be estimated (Table S3 ). Baseline DAS28 also had an impact on the progression of DAS28 over time. No covariate effects could be estimated on the drug treatment effects. Higher baseline DAS28 was associated with a slightly greater maximum placebo response (~ 0.7% per DAS28 unit) and a longer time to maximum placebo response (~ 24% per DAS28 unit). Both of these effects are likely due to an intrinsic relationship between baseline DAS28 and the DAS28 change over time. Longer disease duration was associated with a reduced placebo response (~ 0.8% per 5 years), consistent with the known effect of disease duration on clinical responses in RA. 41 This analysis included clinical trials from 1994 to 2018. Earlier trials tended to have a greater background DAS28 progression compared with more recent ones (~ 0.31 DAS28 units/year in 2000 vs. ~ 0.0025 DAS28 units/year in 2016). This is likely associated with an improvement in the background DMARD therapies and their administration/compliance over the years. A reduction in baseline disease activity as measured by DAS28 has been observed in clinical trials conducted from 2000 to 2010. 42
Given the wide range of therapeutic options for patients with RA, the development of new drugs requires an efficient strategy that effectively leverages the rich clinical data from RA trials and allows for early “go”/“no‐go” decision making based on efficacy and safety. DAS28 is already used as the primary efficacy end point in early clinical development of RA treatments. Past clinical experience with anti‐TNF agents indicates that the response to treatment within 12 weeks can predict efficacy at 1 year as measured with a variety of efficacy end points. 43 , 44 , 45 , 46 , 47 The simulations conducted with this MBMA model suggest that a decision based upon efficacy is feasible even sooner than 12 weeks after initiation of treatment. This would reduce the exposure of patients with RA to potentially ineffective therapies, and permit redeployment of resources toward more promising drug candidates.
Clinical trial simulation of all seven RA drugs included in the MBMA with a typical design demonstrates that nearly all of the approved RA drugs would have a high probability of demonstrating efficacy vs. placebo after only 4–6 weeks of treatment (Figure 4 ). The only exception is rituximab due to its apparently slower onset of treatment effect. Tocilizumab shows the greatest separation from placebo at the earliest time, and with the smallest sample size, due to its estimated higher treatment effect. What we can derive from these clinical trial simulations is that we would expect nearly all drugs that are efficacious in RA to demonstrate a statistically significant separation from placebo by Week 6 with as few as 30 patients. Given the highly competitive nature of the treatment landscape in RA, the few drugs with a slower onset of action that do not display efficacy by Week 6 may not be desirable for further clinical development. Based on the MBMA and clinical trial simulations, it appears reasonable to include a decision‐making step on efficacy at the 6‐week timepoint, with relatively small sample sizes. This would enable an early evaluation of efficacy with limited resource commitment, notwithstanding any potential safety/tolerability issues.
The MBMA reported here permits comparison of emerging DAS28 data from a new compound with historical data from the seven drugs included in the analysis. The comparison would be able to account for differences in study design and execution, allowing for a decision to be made on the potential competitiveness of the new investigational drug with these prior‐approved therapies. As additional therapies are approved, they can also be included in the MBMA to make the scope more comprehensive.
Funding
This work was supported by Bristol Myers Squibb.
Conflicts of Interest
All authors are employees of Bristol Myers Squibb and hold company stock.
Author Contributions
T.L. and Y.L. wrote the manuscript. T.L., Y.L., R.W., and M.N. designed the research. T.L., Y.L., and M.B.‐P. performed the research. T.L., Y.L., and M.B.‐P. analyzed the data. T.L. and M.B.‐P. contributed new reagents / analytical tools.
Supporting information
Supplementary Material
Acknowledgments
The authors acknowledge the support of Timothy Reilly and Bindu Murthy (Bristol Myers Squibb, Princeton, NJ) for this analysis. Preliminary results of this study were presented at the 6th American Conference on Pharmacometrics, October, 2015, Crystal City, VA; the review and feedback provided by Jonathan French and other experts at this conference was greatly appreciated. Professional medical writing and editorial assistance was provided by Stephen Moore, PhD, at Caudex (at the time the manuscript was developed) and Lola Parfitt, MRes, at Caudex, and was funded by Bristol Myers Squibb.
Data Availability Statement
Bristol Myers Squibb policy on data sharing may be found at https://www.bms.com/researchers‐and‐partners/clinical‐trials‐and‐research/disclosure‐commitment.html.
References
- 1. McInnes, I.B. & Schett, G. The pathogenesis of rheumatoid arthritis. N. Engl. J. Med. 365, 2205–2219 (2011). [DOI] [PubMed] [Google Scholar]
- 2. Prevoo, M.L. , van't Hof, M.A. , Kuper, H.H. , van Leeuwen, M.A. , van de Putte, L.B. & van Riel, P.L. Modified disease activity scores that include twenty‐eight‐joint counts. Development and validation in a prospective longitudinal study of patients with rheumatoid arthritis. Arthritis Rheum. 38, 44–48 (1995). [DOI] [PubMed] [Google Scholar]
- 3. Fransen, J. & van Riel, P.L.C.M. The disease activity score and the EULAR response criteria. Rheum. Dis. Clin. North. Am. 35, 745–757, vii‐viii (2009). [DOI] [PubMed] [Google Scholar]
- 4. van der Heijde, D.M. , van 't Hof, M. , van Riel, P.L. , & van de Putte, L.B. Development of a disease activity score based on judgment in clinical practice by rheumatologists. J. Rheumatol. 20, 579–581 (1993). [PubMed] [Google Scholar]
- 5. van der Heijde, D.M. et al Judging disease activity in clinical practice in rheumatoid arthritis: first step in the development of a disease activity score. Ann. Rheum. Dis. 49, 916–920 (1990). [DOI] [PMC free article] [PubMed] [Google Scholar]
- 6. Balsa, A. et al Value of disease activity score 28 (DAS28) and DAS28‐3 compared to American College of Rheumatology‐defined remission in rheumatoid arthritis. J. Rheumatol. 31, 40–46 (2004). [PubMed] [Google Scholar]
- 7. Anderson, J. et al Rheumatoid arthritis disease activity measures: American College of Rheumatology recommendations for use in clinical practice. Arthritis Care Res. 64, 640–647 (2012). [DOI] [PMC free article] [PubMed] [Google Scholar]
- 8. European Medicines Agency . Guideline on clinical investigation of medicinal products for the treatment of rheumatoid arthritis <https://www.ema.europa.eu/en/documents/scientific‐guideline/guideline‐clinical‐investigation‐medicinal‐products‐treatment‐rheumatoid‐arthritis_en.pdf> (2017).
- 9. European Medicines Agency . Assessment report: truxima <https://www.ema.europa.eu/en/documents/assessment‐report/truxima‐epar‐public‐assessment‐report_en.pdf> (2016).
- 10. Wells, G. et al Validation of the 28‐joint disease activity score (DAS28) and European League Against Rheumatism response criteria based on C‐reactive protein against disease progression in patients with rheumatoid arthritis, and comparison with the DAS28 based on erythrocyte sedimentation rate. Ann. Rheum. Dis. 68, 954–960 (2009). [DOI] [PMC free article] [PubMed] [Google Scholar]
- 11. US Food and Drug Administration . Guidance for industry rheumatoid arthritis: developing drug products for treatment <https://www.fda.gov/media/86066/download> (2013).
- 12. Singh, J.A. et al 2012 update of the 2008 American College of Rheumatology recommendations for the use of disease‐modifying antirheumatic drugs and biologic agents in the treatment of rheumatoid arthritis. Arthritis Care Res (Hoboken). 64, 625–639 (2012). [DOI] [PMC free article] [PubMed] [Google Scholar]
- 13. Smolen, J.S. et al EULAR recommendations for the management of rheumatoid arthritis with synthetic and biological disease‐modifying antirheumatic drugs: 2016 update. Ann. Rheum. Dis. 76, 960–977 (2017). [DOI] [PubMed] [Google Scholar]
- 14. Tanaka, Y. et al Safety, pharmacokinetics, and efficacy of E6011, an antifractalkine monoclonal antibody, in a first‐in‐patient phase 1/2 study on rheumatoid arthritis. Mod. Rheumatol. 28, 58–65 (2018). [DOI] [PubMed] [Google Scholar]
- 15. Burmester, G.R. et al A randomised phase IIb study of mavrilimumab, a novel GM‐CSF receptor alpha monoclonal antibody, in the treatment of rheumatoid arthritis. Ann. Rheum. Dis. 76, 1020–1030 (2017). [DOI] [PubMed] [Google Scholar]
- 16. Westhovens, R. et al Filgotinib (GLPG0634/GS‐6034), an oral JAK1 selective inhibitor, is effective in combination with methotrexate (MTX) in patients with active rheumatoid arthritis and insufficient response to MTX: results from a randomised, dose‐finding study (DARWIN 1). Ann. Rheum. Dis. 76, 998–1008 (2017). [DOI] [PubMed] [Google Scholar]
- 17. Huizinga, T.W.J. et al Phase 1b randomized, double‐blind study of namilumab, an anti‐granulocyte macrophage colony‐stimulating factor monoclonal antibody, in mild‐to‐moderate rheumatoid arthritis. Arthritis Res. Ther. 19, 53 (2017). [DOI] [PMC free article] [PubMed] [Google Scholar]
- 18. Genovese, M.C. et al Efficacy and safety of ABT‐494, a selective JAK‐1 inhibitor, in a phase IIb study in patients with rheumatoid arthritis and an inadequate response to methotrexate. Arthritis Rheumatol. 68, 2857–2866 (2016). [DOI] [PMC free article] [PubMed] [Google Scholar]
- 19. Damjanov, N. et al Safety and efficacy of SBI‐087, a subcutaneous agent for B cell depletion, in patients with active rheumatoid arthritis: results from a phase II randomized, double‐blind, placebo‐controlled study. J. Rheumatol. 43, 2094–2100 (2016). [DOI] [PubMed] [Google Scholar]
- 20. Mandema, J.W. , Gibbs, M. , Boyd, R.A. , Wada, D.R. & Pfister, M. Model‐based meta‐analysis for comparative efficacy and safety: application in drug development and beyond. Clin. Pharmacol. Ther. 90, 766–769 (2011). [DOI] [PubMed] [Google Scholar]
- 21. Dodds, M.G. , Salinger, D.H. , Mandema, J. , Gibbs, J.P. & Gibbs, M.A. Clinical trial simulation to inform phase 2: comparison of concentrated vs. distributed first‐in‐patient study designs in psoriasis. CPT Pharmacometrics Syst. Pharmacol. 2, e58 (2013). [DOI] [PMC free article] [PubMed] [Google Scholar]
- 22. Zierhut, M.L. , Chen, Y. , Pithavala, Y.K. , Nickens, D.J. , Valota, O. & Amantea, M.A. Clinical trial simulations from a model‐based meta‐analysis of studies in patients with advanced hepatocellular carcinoma receiving antiangiogenic therapy. CPT Pharmacometrics Syst. Pharmacol. 5, 274–282 (2016). [DOI] [PMC free article] [PubMed] [Google Scholar]
- 23. Teng, Z. et al Model‐based meta‐analysis for multiple myeloma: a quantitative drug‐independent framework for efficient decisions in oncology drug development. Clin. Transl. Sci. 11, 218–225 (2018). [DOI] [PMC free article] [PubMed] [Google Scholar]
- 24. Chan, P. et al Model‐based meta‐analysis on the efficacy of pharmacological treatments for idiopathic pulmonary fibrosis. CPT Pharmacometrics Syst. Pharmacol. 6, 695–704 (2017). [DOI] [PMC free article] [PubMed] [Google Scholar]
- 25. Wang, Y. et al Short‐term efficacy reliably predicts long‐term clinical benefit in rheumatoid arthritis clinical trials as demonstrated by model‐based meta‐analysis. J. Clin. Pharmacol. 56, 835–844 (2016). [DOI] [PMC free article] [PubMed] [Google Scholar]
- 26. Korell, J. , Martin, S.W. , Karlsson, M.O. & Ribbing, J. A model‐based longitudinal meta‐analysis of FEV1 in randomized COPD trials. Clin. Pharmacol. Ther. 99, 315–324 (2016). [DOI] [PubMed] [Google Scholar]
- 27. Demin, I. , Hamrén, B. , Luttringer, O. , Pillai, G. & Jung, T. Longitudinal model‐based meta‐analysis in rheumatoid arthritis: an application toward model‐based drug development. Clin. Pharmacol. Ther. 92, 352–359 (2012). [DOI] [PubMed] [Google Scholar]
- 28. Reeve, R. , Pang, L. , Ferguson, B. , O'Kelly, M. , Berry, S. & Xiao, W. Rheumatoid arthritis disease progression modeling. Ther. Innov. Regul. Sci. 47, 641–650 (2013). [DOI] [PubMed] [Google Scholar]
- 29. Mandema, J.W. , Salinger, D.H. , Baumgartner, S.W. & Gibbs, M.A. A dose‐response meta‐analysis for quantifying relative efficacy of biologics in rheumatoid arthritis. Clin. Pharmacol. Ther. 90, 828–835 (2011). [DOI] [PubMed] [Google Scholar]
- 30. Ahn, J.E. & French, J.L. Longitudinal aggregate data model‐based meta‐analysis with NONMEM: approaches to handling within treatment arm correlation. J. Pharmacokinet. Pharmacodyn. 37, 179–201 (2010). [DOI] [PubMed] [Google Scholar]
- 31. Lindbom, L. , Pihlgren, P. & Jonsson, E.N. PsN‐Toolkit–a collection of computer intensive statistical methods for non‐linear mixed effect modeling using NONMEM. Comput. Methods Programs Biomed. 79, 241–257 (2005). [DOI] [PubMed] [Google Scholar]
- 32. Dosne, A.G. , Bergstrand, M. & Karlsson, M.O. An automated sampling importance resampling procedure for estimating parameter uncertainty. J. Pharmacokinet. Pharmacodyn. 44, 509–520 (2017). [DOI] [PMC free article] [PubMed] [Google Scholar]
- 33. Furukawa, T.A. , Barbui, C. , Cipriani, A. , Brambilla, P. & Watanabe, N. Imputing missing standard deviations in meta‐analyses can provide accurate results. J. Clin. Epidemiol. 59, 7–10 (2006). [DOI] [PubMed] [Google Scholar]
- 34. Hensor, E.M.A. , Emery, P. , Bingham, S.J. & Conaghan, P.G. & YEAR Consortium . Discrepancies in categorizing rheumatoid arthritis patients by DAS‐28(ESR) and DAS‐28(CRP): can they be reduced? Rheumatology (Oxford). 49, 1521–1529 (2010). [DOI] [PubMed] [Google Scholar]
- 35. Inoue, E. , Yamanaka, H. , Hara, M. , Tomatsu, T. & Kamatani, N. Comparison of disease activity score (DAS)28‐ erythrocyte sedimentation rate and DAS28‐ C‐reactive protein threshold values. Ann. Rheum. Dis. 66, 407–409 (2007). [DOI] [PMC free article] [PubMed] [Google Scholar]
- 36. Smolen, J.S. & Aletaha, D. Interleukin‐6 receptor inhibition with tocilizumab and attainment of disease remission in rheumatoid arthritis: the role of acute‐phase reactants. Arthritis Rheum. 63, 43–52 (2011). [DOI] [PubMed] [Google Scholar]
- 37. Lee, Y.H. & Bae, S.‐C. Comparative efficacy and safety of tocilizumab, rituximab, abatacept and tofacitinib in patients with active rheumatoid arthritis that inadequately responds to tumor necrosis factor inhibitors: a Bayesian network meta‐analysis of randomized controlled trials. Int. J. Rheum. Dis. 19, 1103–1111 (2016). [DOI] [PubMed] [Google Scholar]
- 38. Schoels, M. , Aletaha, D. , Smolen, J.S. & Wong, J.B. Comparative effectiveness and safety of biological treatment options after tumour necrosis factor alpha inhibitor failure in rheumatoid arthritis: systematic review and indirect pairwise meta‐analysis. Ann. Rheum. Dis. 71, 1303–1308 (2012). [DOI] [PubMed] [Google Scholar]
- 39. Isaacs, J.D. , Harari, O. , Kobold, U. , Lee, J.S. & Bernasconi, C. Effect of tocilizumab on haematological markers implicates interleukin‐6 signalling in the anaemia of rheumatoid arthritis. Arthritis Res. Ther. 15, R204 (2013). [DOI] [PMC free article] [PubMed] [Google Scholar]
- 40. Minocha, M. , Mandema, J. & Othman, A.A. Quantitative assessment of the relationship between the DAS28 continuous scores and the proportion of responders based on the ACR criteria in rheumatoid arthritis: a meta‐analysis. Ann. Rheum. Dis. 75, 191 (2016). [Google Scholar]
- 41. Furst, D.E. , Kavanaugh, A. , Florentinus, S. , Kupper, H. , Karunaratne, M. & Birbara, C.A. Final 10‐year effectiveness and safety results from study DE020: adalimumab treatment in patients with rheumatoid arthritis and an inadequate response to standard therapy. Rheumatology (Oxford). 54, 2188–2197 (2015). [DOI] [PubMed] [Google Scholar]
- 42. Aga, A.‐B. et al Time trends in disease activity, response and remission rates in rheumatoid arthritis during the past decade: results from the NOR‐DMARD study 2000–2010. Ann. Rheum. Dis. 74, 381–388 (2015). [DOI] [PubMed] [Google Scholar]
- 43. Aletaha, D. , Funovits, J. , Keystone, E.C. & Smolen, J.S. Disease activity early in the course of treatment predicts response to therapy after one year in rheumatoid arthritis patients. Arthritis Rheum. 56, 3226–3235 (2007). [DOI] [PubMed] [Google Scholar]
- 44. Curtis, J.R. , Luijtens, K. & Kavanaugh, A. Predicting future response to certolizumab pegol in rheumatoid arthritis patients: features at 12 weeks associated with low disease activity at 1 year. Arthritis Care Res (Hoboken). 64, 658–667 (2012). [DOI] [PMC free article] [PubMed] [Google Scholar]
- 45. Curtis, J.R. et al Clinical response within 12 weeks as a predictor of future low disease activity in patients with early RA: results from the TEAR trial. J. Rheumatol. 40, 572–578 (2013). [DOI] [PMC free article] [PubMed] [Google Scholar]
- 46. Curtis, J.R. et al Predicting low disease activity and remission using early treatment response to antitumour necrosis factor therapy in patients with rheumatoid arthritis: exploratory analyses from the TEMPO trial. Ann. Rheum. Dis. 71, 206–212 (2012). [DOI] [PMC free article] [PubMed] [Google Scholar]
- 47. Kavanaugh, A. et al Clinical, functional and radiographic consequences of achieving stable low disease activity and remission with adalimumab plus methotrexate or methotrexate alone in early rheumatoid arthritis: 26‐week results from the randomised, controlled OPTIMA study. Ann. Rheum. Dis. 72, 64–71 (2013). [DOI] [PMC free article] [PubMed] [Google Scholar]
- 48. Manders, S.H.M. et al Cost‐effectiveness of abatacept, rituximab, and TNFi treatment after previous failure with TNFi treatment in rheumatoid arthritis: a pragmatic multi‐centre randomised trial. Arthritis Res Ther. 17, 134 (2015). [DOI] [PMC free article] [PubMed] [Google Scholar]
Associated Data
This section collects any data citations, data availability statements, or supplementary materials included in this article.
Supplementary Materials
Supplementary Material
Data Availability Statement
Bristol Myers Squibb policy on data sharing may be found at https://www.bms.com/researchers‐and‐partners/clinical‐trials‐and‐research/disclosure‐commitment.html.