

Abstract
Objective
Friedreich ataxia (FA) is a progressive genetic neurodegenerative disorder with no approved treatment. Omaveloxolone, an Nrf2 activator, improves mitochondrial function, restores redox balance, and reduces inflammation in models of FA. We investigated the safety and efficacy of omaveloxolone in patients with FA.
Methods
We conducted an international, double‐blind, randomized, placebo‐controlled, parallel‐group, registrational phase 2 trial at 11 institutions in the United States, Europe, and Australia (NCT02255435, EudraCT2015‐002762‐23). Eligible patients, 16 to 40 years of age with genetically confirmed FA and baseline modified Friedreich's Ataxia Rating Scale (mFARS) scores between 20 and 80, were randomized 1:1 to placebo or 150mg per day of omaveloxolone. The primary outcome was change from baseline in the mFARS score in those treated with omaveloxolone compared with those on placebo at 48 weeks.
Results
One hundred fifty‐five patients were screened, and 103 were randomly assigned to receive omaveloxolone (n = 51) or placebo (n = 52), with 40 omaveloxolone patients and 42 placebo patients analyzed in the full analysis set. Changes from baseline in mFARS scores in omaveloxolone (−1.55 ± 0.69) and placebo (0.85 ± 0.64) patients showed a difference between treatment groups of –2.40 ± 0.96 (p = 0.014). Transient reversible increases in aminotransferase levels were observed with omaveloxolone without increases in total bilirubin or other signs of liver injury. Headache, nausea, and fatigue were also more common among patients receiving omaveloxolone.
Interpretation
In the MOXIe trial, omaveloxolone significantly improved neurological function compared to placebo and was generally safe and well tolerated. It represents a potential therapeutic agent in FA. ANN NEUROL 2021;89:212–225
Friedreich ataxia (FA) is a progressive autosomal recessive genetic neurodegenerative disorder affecting approximately 5,000 patients in the United States and 22,000 patients globally. In an overwhelming majority of patients, FA is caused by a biallelic trinucleotide (GAA) repeat expansion in the first intron of the FXN gene, which impairs transcription and significantly reduces the amount of functional frataxin protein. 1 , 2 In 4% of patients, there is a single expanded allele combined with a conventional mutation on the other allele. 3 The pathological consequences of frataxin deficiency include disruption of iron–sulfur cluster biosynthesis, cellular iron dysregulation, mitochondrial dysfunction, and increased sensitivity to oxidative stress in vitro, 4 , 5 leading to the clinical features of FA.
Ataxia is the most common clinical feature in FA, reflecting both proprioceptive loss and cerebellar disease. Patients can also develop spasticity, visual and hearing loss, and non‐neurological features such as cardiomyopathy, diabetes, and scoliosis. In most patients, symptoms begin between 5 and 15 years of age, and patients lose the ability to ambulate by their mid‐20s. 1 , 2 FA shortens life span, most often through consequences of cardiomyopathy; average age at death is 37.5 years. 6 , 7 Currently, there are no approved therapies for FA, and >15 clinical trials have failed to reach their primary endpoints in recent years. 8
Frataxin deficiency causes dysregulation in antioxidant defenses, which could contribute to disease pathology through a vicious cycle of mitochondrial dysfunction, impaired nuclear factor erythroid 2‐related factor 2 (Nrf2) signaling, and decreased adenosine triphosphate production. 9 , 10 , 11 , 12 In the healthy state, oxidative stress causes Nrf2 translocation to the nucleus to increase the expression of antioxidant genes, protecting cells from damage. In FA, both mitochondrial function and Nrf2 signaling are dysregulated. 9 , 10 , 11 , 12 Cultured cells from patients with FA exhibit hypersensitivity to oxidative insults, likely due to impairment in Nrf2 signaling and decreases in Nrf2‐mediated endogenous antioxidants such as reduced glutathione, NAD(P)H:quinone oxidoreductase 1, and superoxide dismutase. 10 Moreover, when fibroblasts from FA patients are challenged with agents that induce oxidative stress, Nrf2 fails to activate, preventing induction of antioxidant Nrf2 target genes. Because the nervous system is sensitive to changes in cellular redox status, impairment of Nrf2 activation may contribute to neurodegeneration in FA. 13 , 14
Omaveloxolone and related triterpenoid analogues are among the most potent known activators of Nrf2. 15 Treatment with omaveloxolone in vitro restores mitochondrial function in fibroblasts from FA patients and in neurons from multiple FA mouse models. 16 The safety and efficacy of omaveloxolone in patients with FA was evaluated in a 2‐part, multicenter, double‐blind, placebo‐controlled, randomized trial (MOXIe, NCT02255435). The 12‐week, dose‐ranging portion of the study (Part 1) identified the optimal omaveloxolone dose for induction of pharmacodynamic measures of Nrf2. 17 Omaveloxolone also improved selected measures including cardiopulmonary exercise testing and neurological function, as assessed by the modified Friedreich's Ataxia Rating Scale (mFARS). 17 Part 2 of the trial, described here, aimed to study the effects of omaveloxolone on neurological function, after 48 weeks of treatment in patients with FA.
Patients and Methods
Study Design
The Part 2 portion of the MOXIe trial was an international, multicenter, double‐blind, randomized, placebo‐controlled, registrational, parallel‐group phase 2 trial to evaluate the safety and efficacy of omaveloxolone 150mg per day in patients with FA. The trial was conducted at 11 clinical institutions in the United States, Europe, and Australia, and was approved by institutional review boards or independent ethics committees associated with the individual study sites.
Participants
Eligible patients were 16 to 40 years of age with genetically confirmed FA, had baseline mFARS scores between 20 and 80, and could complete maximal exercise testing on a recumbent stationary bicycle. These mFARS scores represent individuals just after the time of presentation at the mildest and several years after loss of ambulation at the most severe. Patients were excluded if they had uncontrolled diabetes, clinically significant cardiac disease, active infections, significant laboratory abnormalities, or interfering medical conditions. Patients who developed diabetes or cardiac disease (such as arrhythmias) remained in the study unless the subject chose to withdraw. All patients provided written informed consent.
Randomization and Masking
Patients were randomly assigned in a 1:1 ratio to receive placebo or 150mg per day of omaveloxolone. A 1:1 ratio was chosen to maximize the statistical power of comparisons between treatment groups and to allow a balanced comparison of safety and efficacy. Randomization was generated using a centralized interactive web response system, and stratified by pes cavus status (with pes cavus and without pes cavus) based on findings from a previous study. 17 Moreover, patients with severe pes cavus have a musculoskeletal foot deformity and may represent a subtype of FA with subtly different clinical phenotypes, so patients with pes cavus were included in the study but limited to 20% of subjects enrolled. In this study, pes cavus was systematically defined by the visualization of a flashlight on the medial aspect of the foot when shown from the lateral aspect. This confirms the inability of the foot to flatten completely, a component (along with high arches) necessary for the diagnosis of pes cavus. If the test was positive on one foot, the individual was categorized as having pes cavus. The sponsor, investigators, and patients were unaware of group assignments. Study medications and packaging were identical in appearance to ensure adequate masking.
Procedures
Following randomization on day 1, patients self‐administered study drug for 48 weeks. Neurological function assessments (mFARS) and maximal exercise testing were conducted during screening and at weeks 4, 12, 18, 24, 36, and 48 (Fig 1A). Other efficacy measures were also assessed during screening and either once every 12 weeks (Patient Global Impression of Change [PGIC], Clinician Global Impression of Change [CGIC]) or once every 24 weeks (9‐hole peg test [9‐HPT], timed 25‐foot walk test [T25‐FW], Activities of Daily Living [FA‐ADL] score). Routine laboratory testing was performed at all scheduled visits and analyzed by a central laboratory. During the study, subjects maintained their typical exercise routine. A follow‐up safety visit occurred at week 52 (4 weeks after last dose).
FIGURE 1.
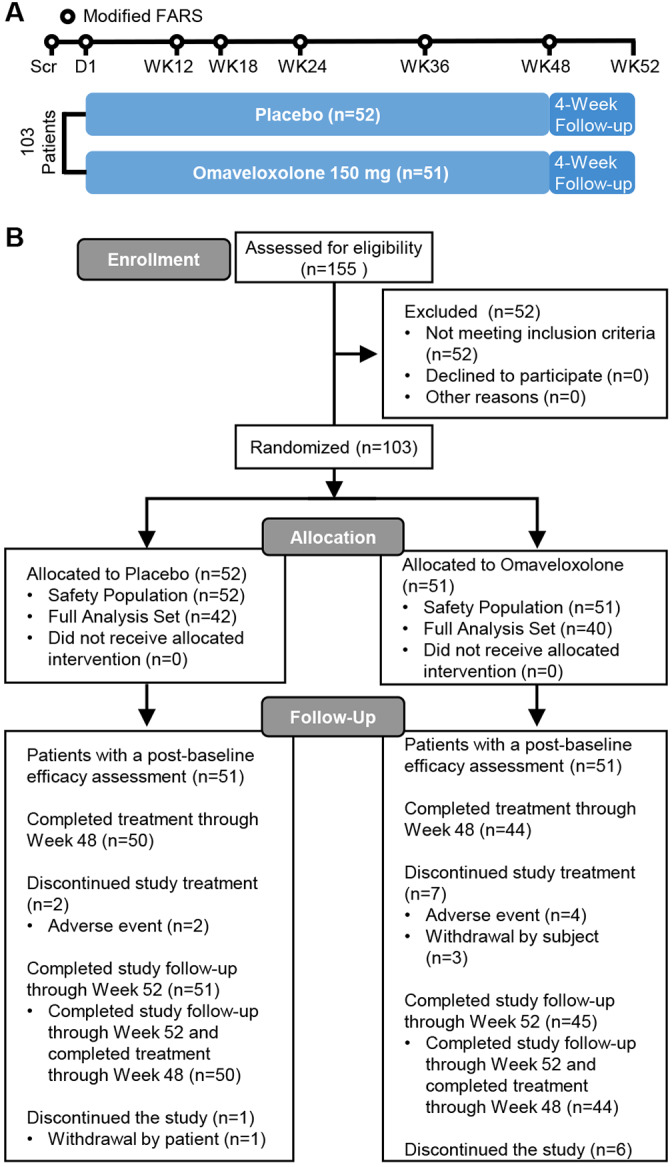
Study schema for the MOXIe Part 2 trial and CONSORT diagram. FARS = Friedreich's Ataxia Rating Scale; Scr=screening. [Color figure can be viewed at www.annalsofneurology.org]
Outcomes
The primary outcome was the change from baseline in mFARS compared with placebo at 48 weeks. The mFARS, which was generally administered by the lone investigator at each site, provides a quantifiable measure of neurological function in FA patients, and has 4 subsections (bulbar, upper limb coordination, lower limb coordination, and upright stability). Scores range from 0 to 99, with lower scores indicating better neurological function. To minimize potential bias, examiners performing neurological assessments were blinded to all other results, including laboratory values. Key secondary outcome measures included the PGIC, CGIC, 9‐HPT, T25‐FW, frequency of falls, peak work during maximal exercise testing, and FA‐ADL scores (using FA‐validated ADL questionnaire), all evaluated at week 48 as change from baseline, and performed as previously described. 17 , 18 , 19 We also recorded vital signs, electrocardiograms, and the frequency and severity of adverse events at each visit. Echocardiograms were also performed during screening, and at weeks 24 and 48. Patient safety was monitored by an independent data and safety monitoring committee.
Statistical Analysis
We calculated that with 80 patients, a longitudinal analysis would provide approximately 85% power to test a mean (± standard deviation) difference in the change from baseline in the mFARS of 2.0 ± 3.5 points between those randomized to omaveloxolone and those randomized to placebo, assuming a 2‐sided type I error rate of 0.05.
A full analysis set (FAS) was used for primary analysis of efficacy and limited to patients without pes cavus who had at least one postbaseline measurement. Safety analyses included all randomized patients (ARP). We used mixed models repeated measures (MMRM) to analyze the primary outcome. The MMRM used site (degrees of freedom [df] = 10) and baseline mFARS (df = 1) as covariates and the following fixed factors: treatment group (df = 1), time (df = 4), the interaction between treatment and time (df = 5), and the interaction between baseline and time (df = 5). The analysis used postbaseline mFARS values collected through 48 weeks (6 repeated measurements at weeks 4, 12, 18, 24, 36, and 48) as the response. We assumed an unstructured covariance matrix to model the within‐subjected variance–covariance errors and did not impute for missing data in the primary analysis of efficacy.
We analyzed secondary endpoints using a hierarchical approach to maintain the familywise overall type I error rate of 0.05. Several additional functional measures served as secondary endpoints that were analyzed using a fixed‐sequence hierarchical approach to maintain the familywise overall type I error rate of 0.05: PGIC, CGIC, 9‐HPT, T25‐FW, frequency of falls, peak work, and FA‐ADL. The hierarchy order was prespecified in the statistical analysis plan based on natural history and Part 1 study data. Natural history data in published literature showed the annual rates of change for the secondary endpoints of 9‐HPT and T25‐FW to be very small (−0.001 ± 0.003 and −0.01 ± 0.04, respectively). 19 Multiyear follow‐up and/or large sample sizes would have been necessary to show statistically significant between‐group differences, based on an assumption of zero annual change from baseline (ie, halting progression) in the omaveloxolone cohort. Therefore, these endpoints were not expected to show statistical significance and were placed lower in the hierarchy. It was hypothesized that PGIC and CGIC might improve from baseline, although these endpoints were not assessed in Part 1 of the study.
Post Hoc Sensitivity Analyses
Because randomization was stratified by presence of pes cavus, the prespecified model included pes cavus as a covariate. However, some baseline characteristics consistent with more advanced disease (eg, longer GAA1 repeat length and history of cardiomyopathy; Table 1) were more prevalent in the patients randomized to omaveloxolone than in patients randomized to placebo, and were not included in the prespecified model. Although all demographic and baseline characteristics were explored in a post hoc manner for inclusion as covariates in the repeated measures model, history of cardiomyopathy and GAA1 repeat length provided the best overall model fit. Accordingly, additional post hoc sensitivity analyses were also performed to assess the impact of controlling for the imbalances in these baseline disease characteristics between the randomized cohorts.
TABLE 1.
Baseline and Demographic Characteristics
| Parameter | FAS | ARP | Pes Cavus Patients | |||
|---|---|---|---|---|---|---|
| Placebo, n = 42 | Omaveloxolone, n = 40 | Placebo, n = 52 | Omaveloxolone, n = 51 | Placebo, n = 10 | Omaveloxolone, n = 10 | |
| Female, n (%) | 14 (33) | 24 (60) | 17 (33) | 31 (61) | 3 (30) | 7 (70) |
| Age at screening, yr | ||||||
| Mean (SD) | 23.6 (7.8) | 24.2 (6.5) | 24.1 (7.8) | 23.4 (6.1) | 26.0 (8.2) | 19.9 (2.6) |
| Median | 21.0 | 23.0 | 21.0 | 22.0 | 27.0 | 20.0 |
| <18 yr, n (%) | 13 (31) | 7 (18) | 15 (29) | 9 (18) | 2 (20) | 2 (20) |
| Race, White, n (%) | 40 (95.2) | 40 (100) | 50 (96.2) | 50 (98) | 10 (100) | 9 (90) |
| mFARS, mean (SD) | 38.8 (11) | 40.9 (10.4) | 37.9 (10.8) | 40.8 (10.2) | 34.4 (9.3) | 41.1 (9.9) |
| Peak work, W/kg, mean (SD) | 1.2 (0.6) | 1.1 (0.5) | 1.2 (0.6) | 1.1 (0.6) | 1.4 (0.7) | 1.1 (0.8) |
| ADL, mean (SD) | 9.9 (4.8) | 10.7 (4.8) | 9.9 (4.7) | 11.0 (4.5) | 9.8 (4.4) | 12.2 (3.4) |
| Age at onset, yr, mean (SD) | 15.1 (5.3) | 15.9 (5.7) | 15.3 (5.3) | 14.8 (5.7) | 16.4 (5.3) | 10.9 (3.6) |
| Duration, yr, mean (SD) | 4.7 (4.7) | 4.8 (4.0) | 4.4 (4.4) | 4.7 (3.8) | 3.0 (2.7) | 4.6 (3.2) |
| GAA1 repeat length, mean (SD) | 693.8 (277.2) | 739.2 (214.9) | 676.2 (267.9) | 736.8 (206.8) | 585.6 (206.6) | 736.6 (200.1) |
| Ambulatory, n (%) | 39 (93) | 37 (93) | 49 (94) | 46 (90) | 10 (100) | 8 (80) |
| History of cardiomyopathy, n (%) | 12 (29) | 19 (48) | 15 (29) | 25 (49) | 3 (30) | 6 (60) |
| History of scoliosis, n (%) | 32 (76) | 29 (73) | 37 (71) | 39 (77) | 5 (50) | 10 (100) |
| Scoliosis surgery, n (%) | 7 (17) | 12 (30) | 10 (19) | 16 (31) | 3 (30) | 4 (40) |
ADL = Activities of Daily Living; ARP = all randomized patients; FAS = full analysis set; mFARS = modified Friedreich's Ataxia Rating Scale; SD = standard deviation.
Additionally, we also conducted post hoc sensitivity analyses to assess the impact of analysis methodology on the primary outcome. An analysis of covariance (ANCOVA) included the same covariates as the MMRM analysis (ie, baseline mFARS and site, as well as history of cardiomyopathy and GAA1 repeat length).
To evaluate the consistency of findings across primary and secondary outcomes, post hoc analyses were conducted to evaluate whether patients were improved, stable, or worsened from baseline in mFARS, FA‐ADL, and/or PGIC scores after 48 weeks. The categorical thresholds for determining improvements or worsening in mFARS or FA‐ADL were based on published annual rates of change for these measures and defined as follows. 19 Improvements were defined as changes from baseline ≤ −1.9 points for mFARS scores and ≤ −0.4 points for FA‐ADL scores, and PGIC scores < 4; stable scores were defined as changes from baseline between >−1.9 and <1.9 points for mFARS scores and >−0.4 and <0.4 for FA‐ADL scores, and PGIC scores = 4; worsening was defined as changes from baseline ≥ 1.9 points for mFARS scores and ≥ 0.4 points for FA‐ADL scores, and PGIC scores > 4.
All statistical analyses were performed using SAS (v9.4; SAS Institute, Cary, NC).
Results
Between October 20, 2017 and November 5, 2018, 155 patients were screened in the United States (n = 71), Italy (n = 7), United Kingdom (n = 8), Austria (n = 9), and Australia (n = 8). Of the patients screened, primarily reasons for not being eligible to participate in the study included inability to compete maximal exercise testing and screening mFARS scores. A total of 103 met entry criteria, with 82 patients were included in the FAS, including 40 patients who were randomly assigned to receive omaveloxolone and 42 patients who were randomly assigned to receive placebo. A total of 94 (91%) patients completed treatment through week 48, including 44 of 51 (86%) randomized to omaveloxolone and 50 of 52 (96%) randomized to placebo (see Fig 1B). One patient randomized to omaveloxolone did not have any postbaseline assessments and was excluded from the FAS population. Significance testing of baseline differences was not performed, but baseline characteristics were generally similar across the FAS and ARP populations (see Table 1). Although the distribution of baseline characteristics was generally similar between treatment groups, the omaveloxolone cohort had slightly more advanced disease, with higher average baseline mFARS scores, longer GAA1 repeat lengths, and a greater proportion of patients with a history of cardiomyopathy. Nearly all patients (92%) were ambulatory. Patients with pes cavus had a shorter GAA1 repeat length but otherwise were similar to other subjects in the study (see Table 1).
Patients randomized to omaveloxolone (n = 40) experienced a mean (± standard error of the mean) decrease from baseline in mFARS of −1.55 ± 0.69 (95% confidence interval [CI] = −2.93 to −0.18, df = 72.6) points at week 48 (Fig 2A). In contrast, patients randomized to placebo (n = 42) had a mean increase in mFARS of 0.85 ± 0.64 (95% CI = −0.43 to 2.13, df = 67.8) points, resulting in a difference between treatment groups of −2.40 ± 0.96 (95% CI = −4.31 to −0.5) points (p = 0.014; see Fig 2A).
FIGURE 2.
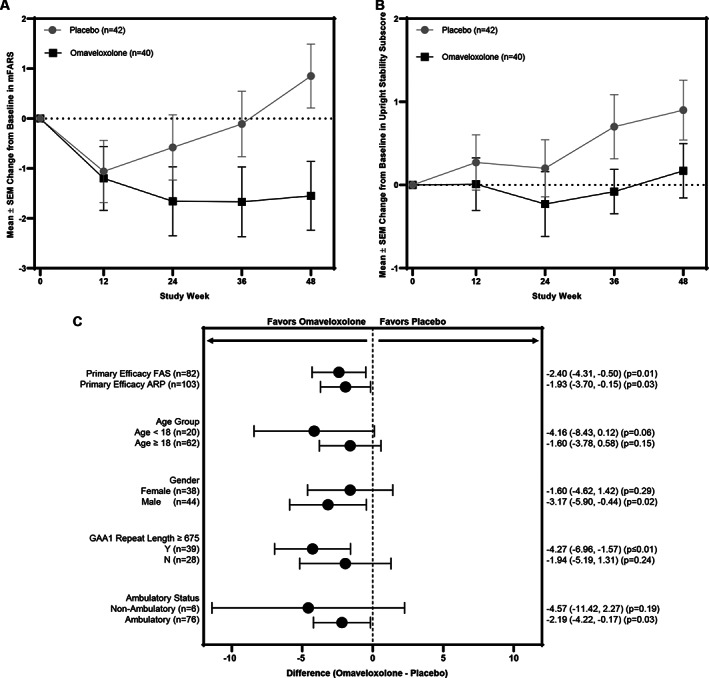
(A) Mean changes from baseline in modified Friedrich's Ataxia Rating Scale (mFARS) score over time in the full analysis set (FAS) for patients randomized to omaveloxolone (n = 40) or placebo (n = 42). The change from baseline in mFARS and p value was estimated using mixed models repeated measures (MMRM) analysis. Significant differences in the change from baseline in mFARS in the omaveloxolone group, as compared with the placebo group, were observed at week 48 (p = 0.014). The error bars indicate standard errors. SEM = standard error of the mean. (B) Mean changes from baseline in the upright stability scores (Section E) of mFARS over time estimated using MMRM analysis. (C) Forest plot representing the difference between omaveloxolone and placebo treatment groups for the change from baseline in mFARS score at week 48 for the following prespecified analysis populations: FAS (n = 82), all randomized patients (ARP; n = 103), and prespecified subgroups. The change from baseline at week 48 was estimated using MMRM analysis, and each p value was estimated from a test comparing the difference in means between the omaveloxolone and placebo groups.
Within the mFARS assessment, omaveloxolone improved each component (bulbar, upper limb coordination, lower limb coordination, and upright stability) relative to placebo, although the greatest effects were on the upright stability (see Fig 2B). Upright stability scores in placebo patients consistently worsened over time, with no observed placebo effect. Prespecified sensitivity analyses of the primary endpoint in ARP (n = 103), including those with pes cavus, confirmed the primary analysis in the FAS population, with a difference between omaveloxolone and placebo groups of −1.93 ± 0.90 (95% CI = −3.7 to −0.15) points (n = 103, p = 0.034; see Fig 2C ).
The improvements in mFARS with omaveloxolone were consistent across subgroups, including stratifications by age and sex (see Fig 2C). The greatest improvements in mFARS occurred in patients <18 years of age; pediatric patients randomized to placebo worsened by +2.52 ± 1.18 points at week 48, whereas pediatric patients randomized to omaveloxolone improved by −1.63 ± 1.78 points, resulting in a placebo‐corrected improvement of −4.16 ± 2.15 points (n = 20, p = 0.057; see Fig 2C). In addition, although numerical improvement was noted in every subgroup examined, the greatest treatment effects were observed in men and in subjects enrolled at sites in the United States.
Sensitivity Analyses of Primary MMRM Efficacy Results
To diminish the possibility that the primary results represent an aberration, post hoc analyses using ANCOVA were conducted to assess the impact of analysis methodology on the primary outcome. These analyses showed an even greater treatment effect with omaveloxolone at week 48, with an improvement in mFARS relative to placebo of −2.83 points (p = 0.0068). In addition, small differences in baseline characteristics were noted between the randomized omaveloxolone and placebo populations. Accounting for history of cardiomyopathy as a covariate in the model resulted in an improvement in mFARS of −2.65 points at week 48 for omaveloxolone relative to placebo (p = 0.0064; Fig 3A). In addition, although all patients had genetic confirmation of FA, not all randomized patients had baseline GAA1 repeat length data. Inclusion of GAA1 repeat length as a covariate in the longitudinal model for the patients with available data (n = 31 for omaveloxolone and n = 36 for placebo) also improved the treatment effect on mFARS with omaveloxolone, resulting in a difference between treatment groups of −3.37 points (p = 0.0017). Finally, inclusion of both cardiomyopathy and GAA1 repeat lengths into the longitudinal model further improved the treatment effect with omaveloxolone (difference of −3.48 points relative to placebo, p = 0.0012). Similar trends were observed when including the baseline covariates using an ANCOVA analysis (see Fig 3B).
FIGURE 3.
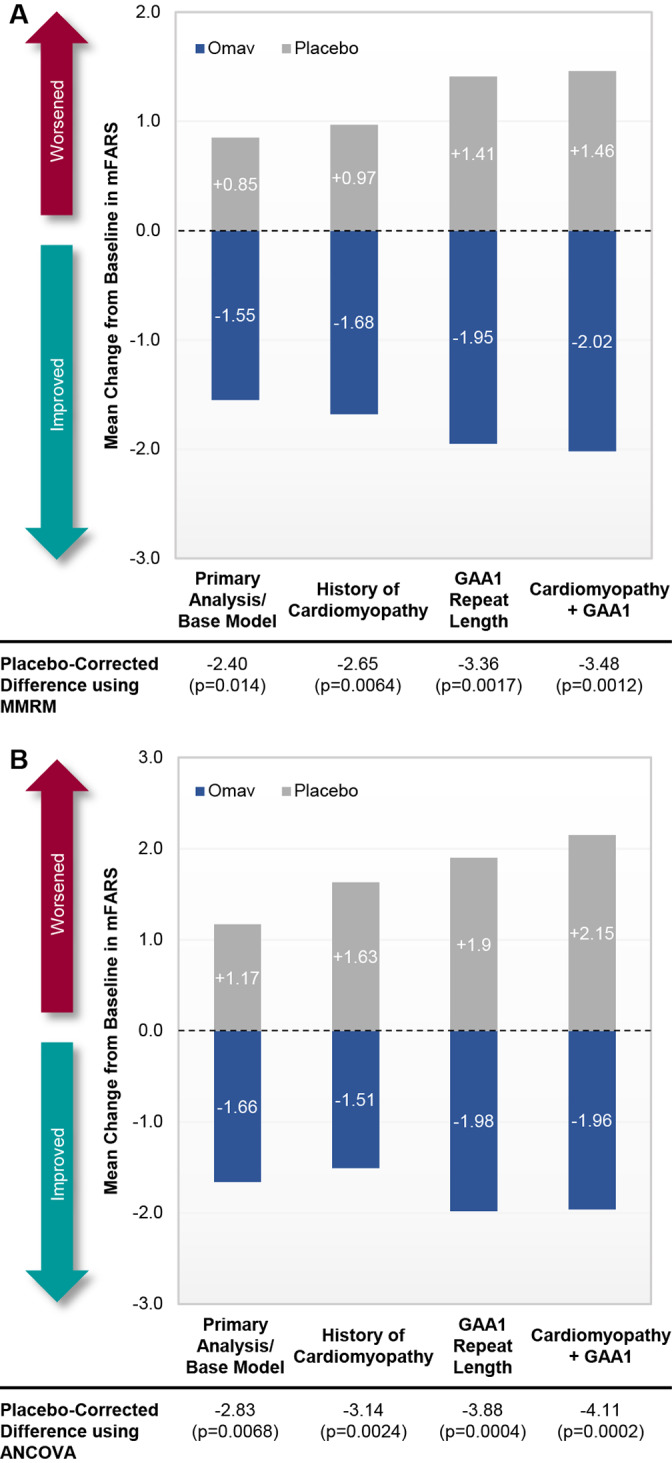
Post hoc analyses of change from baseline in modified Friedreich's Ataxia Rating Scale (mFARS) at week 48 with additional baseline covariates (full analysis set population). Data are presented as bar graphs comparing mean changes from baseline in mFARS at week 48 for patients randomized to omaveloxolone (Omav; n = 40) or placebo (n = 42) using the primary mixed model repeated measures (MMRM) methodology (A) or analysis of covariance (ANCOVA; B) with the inclusion of history of cardiomyopathy, GAA1 repeat length, or history of cardiomyopathy and GAA1 repeat length included as covariates. Note that the model with GAA1 repeat length as a covariate includes only those patients with baseline GAA1 repeat length data (n = 31 for omaveloxolone and n = 36 for placebo). [Color figure can be viewed at www.annalsofneurology.org]
Secondary Outcome Measures
Mean PGIC and CGIC scores at week 48 numerically improved in patients randomized to omaveloxolone (3.90 and 3.93, respectively), but did not statistically differ between treatment groups (Table 2). The PGIC and CGIC values at week 48 correlated positively with changes in mFARS (Pearson correlation for mFARS versus PGIC: r = 0.47, p < 0.0001; CGIC: r = 0.44, p < 0.0001). Because the first secondary endpoint in the hierarchy did not demonstrate statistically significant evidence of efficacy, omaveloxolone did not significantly improve any secondary efficacy measures relative to placebo. Nevertheless, all secondary endpoints numerically favored omaveloxolone. Omaveloxolone improved FA‐ADL scores relative to baseline and achieved nominal statistical significance relative to placebo at week 48 (−0.17 ± 0.45 and 1.14 ± 0.42, respectively, p = 0.042; see Table 2). All 9 sections of the FA‐ADL score numerically favored omaveloxolone. Finally, a post hoc analysis of FA‐ADL change employing additional covariates to account for imbalances in baseline characteristics (ie, baseline mFARS and history of cardiomyopathy) showed an even greater treatment effect with omaveloxolone at week 48, with an improvement in FA‐ADL relative to placebo of −1.50 points (p = 0.020).
TABLE 2.
Secondary Endpoints and Post Hoc Analyses of Proportion of Patients Who Improved or Worsened in Primary and Secondary Measures at Week 48
| Endpoint | Week 48 Change from Baseline a | Mean Difference ± SEM between Treatment Groups | |
|---|---|---|---|
| Placebo, n = 42 | Omaveloxolone, n = 40 | ||
| PGIC | 4.33 | 3.90 | −0.43, p = 0.13 |
| CGIC | 4.06 | 3.93 | −0.13, p = 0.52 |
| 9‐HPT, 1/s b | −0.0001 ± 0.0006, p = 0.82 | −0.0014 ± 0.0007, p = 0.04 | −0.0013 ± 0.0009, p = 0.18 |
| T25‐FW, 1/s c | −0.0226 ± 0.0053, p < .0001 | −0.0169 ± 0.0056, p = 0.004 | 0.0058 ± 0.0078, p = 0.46 |
| Frequency of falls, median (min, max) d | 8.5 (0, 131) | 3.0 (1, 89) | 0.30 ± 0.292, p = 0.30 |
| Peak work, W/kg | 0.090 ± 0.033, p = 0.005 | 0.03 ± 0.035, p = 0.33 | −0.06 ± 0.049, p = 0.22 |
| FA‐ADL | 1.14 ± 0.42, p = 0.009 | −0.17 ± 0.450, p = 0.71 | −1.30 ± 0.629, p = 0.04 |
| Placebo, n (%) | Omaveloxolone, n (%) | Ratio Omaveloxolone/Placebo | |
| mFARS scores | 41 | 34 | |
| Improved e | 11 (27%) | 16 (47%) | 1.75 |
| Worsened f | 18 (44%) | 7 (21%) | 0.47 |
| FA‐ADL score | 41 | 36 | |
| Improved e | 8 (20%) | 13 (36%) | 1.85 |
| Worsened f | 27 (66%) | 17 (47%) | 0.72 |
| PGIC | 41 | 36 | |
| Improved e | 11 (27%) | 16 (44%) | 1.66 |
| Worsened f | 17 (42%) | 11 (31%) | 0.74 |
| mFARS, FA‐ADL, PGIC | 41 | 34 | |
| All improved | 1 (2%) | 5 (15%) | 6.03 |
| None worsened | 7 (17%) | 13 (38%) | 2.24 |
Mean changes for PGIC and CGIC responses and p values were analyzed using an analysis of covariance, with treatment group and site as fixed factors and week 48 values as the outcome with multiple imputation for missing week 48 values based on the treatment group to which the subject is assigned. Mean changes and p values for 9‐HPT, T25‐FW, peak work, and FA‐ADL were estimated using a mixed‐model repeated measures analysis.
Analysis based on reciprocal of average time, nondominant hand.
Analysis based on reciprocal of average walk time.
Comparison in the frequency of falls for omaveloxolone patients versus placebo patients was estimated from the Poisson model with the natural logarithm of time on study (days) included as an offset term.
Improvements were defined as changes from baseline ≤ −1.9 points for mFARS scores and ≤ −0.4 points for FA‐ADL scores, and PGIC scores < 4.
Worsening was defined as changes from baseline ≥ 1.9 points for mFARS scores and ≥ 0.4 points for FA‐ADL scores, and PGIC scores > 4.
9‐HPT = 9‐hole peg test; CGIC = Clinician Global Impression of Change; FA‐ADL = Friedreich ataxia–validated Activities of Daily Living; max = maximum; mFARS = modified Friedreich's Ataxia Rating Scale; min = minimum; PGIC = Patient Global Impression of Change; SEM = standard error of the mean; T25‐FW = timed 25‐foot walk test.
To reconcile the differences between the primary and secondary outcomes, we examined the number of subjects responding to different measures. A greater proportion of omaveloxolone patients had improvements and fewer omaveloxolone patients had worsening of mFARS, FA‐ADL, or PGIC (see Table 2). Moreover, a greater proportion of omaveloxolone patients had improvements in mFARS, FA‐ADL, and PGIC, whereas a smaller proportion of patients experienced worsening in all 3 independent measures. Collectively, the data demonstrate that the improvements with omaveloxolone treatment were concordant across several clinical measures assessing how patients felt and functioned in daily life. This shows the internally consistent nature of the overall data despite the lack of statistical significance in the hierarchy of secondary measures.
Adverse Events
The rates of adverse events were similar in the omaveloxolone (100% of patients) and placebo groups (100%). Most adverse events were mild to moderate in intensity. The most common adverse events occurring more frequently in patients who received omaveloxolone than those who received placebo included headache, nausea, increased alanine and aspartate aminotransferase (ALT and AST, respectively), fatigue, diarrhea, and abdominal pain (Table 3). Apart from increases in aminotransferases, the excess occurrence of adverse events in patients receiving omaveloxolone was limited to the first 12 weeks of treatment as patients adjusted to treatment and developed improved drug tolerability. Patients reported adverse events less frequently between weeks 12 and 48, and they generally occurred with similar frequency across omaveloxolone and placebo groups (data not shown).
TABLE 3.
Overall Summary of Adverse Events
| Placebo, n = 52, n (%) | Omaveloxolone, n = 51, n (%) | |
|---|---|---|
| Any adverse event | 52 (100%) | 51 (100%) |
| Any SAE | 3 (6%) | 5 (10%) |
| Discontinuation due to adverse event | 2 (4%) | 4 (8%) |
| Adverse events occurring in > 20% of patients | ||
| Contusion | 19 (37%) | 17 (33%) |
| Headache | 13 (25%) | 19 (37%) |
| Upper respiratory tract infection | 15 (29%) | 14 (28%) |
| Excoriation | 12 (23%) | 13 (26%) |
| Nausea | 7 (14%) | 17 (33%) |
| Alanine aminotransferase increased | 1 (2%) | 19 (37%) |
| Fatigue | 7 (14%) | 11 (22%) |
| Diarrhea | 5 (10%) | 10 (20%) |
| Abdominal pain | 3 (6%) | 11 (22%) |
| Aspartate aminotransferase increased | 1 (2%) | 11 (22%) |
| SAEs | ||
| Atrial fibrillation | 1 (2%) | 1 (2%) |
| Anemia | 0 | 1 (2%) |
| Ankle fracture | 1 (2%) | 0 |
| Craniocerebral injury a | 0 | 1 (2%) |
| Gallbladder disorder | 1 (2%) | 0 |
| Laryngitis b | 0 | 1 (2%) |
| Noncardiac chest pain b | 0 | 1 (2%) |
| Palpitations b | 0 | 1 (2%) |
| Sinus tachycardia b | 0 | 1 (2%) |
| Ventricular tachycardia a | 0 | 1 (2%) |
| Viral upper respiratory tract infection b | 0 | 1 (2%) |
SAEs were reported in patients approximately 2 weeks after the last dose of study drug administration.
Multiple SAEs reported in a single patient.
SAE = serious adverse event.
Increases in aminotransferase levels in patients receiving omaveloxolone were maximal within the first 12 weeks of treatment and trended back toward baseline as therapy continued (Fig 4). Such increases were reversible, with mean serum ALT and AST concentrations declining to baseline values within 4 weeks following drug withdrawal. Fifteen (29%) omaveloxolone patients, but no placebo patients, had maximum ALT elevations ≥3 × the upper limit of normal (ULN). Of those patients, nearly all (12/15) had serum ALT concentrations that returned to normal within 4 weeks after drug discontinuation; similar trends were observed for AST. Increases in aminotransferases were not associated with increases in total bilirubin, and patients treated with omaveloxolone had small, but statistically significant, decreases in total bilirubin relative to baseline and to patients on placebo. None of the patients who received omaveloxolone met potential Hy's law criteria, had clinical symptoms, or had other testing to suggest hepatic injury.
FIGURE 4.
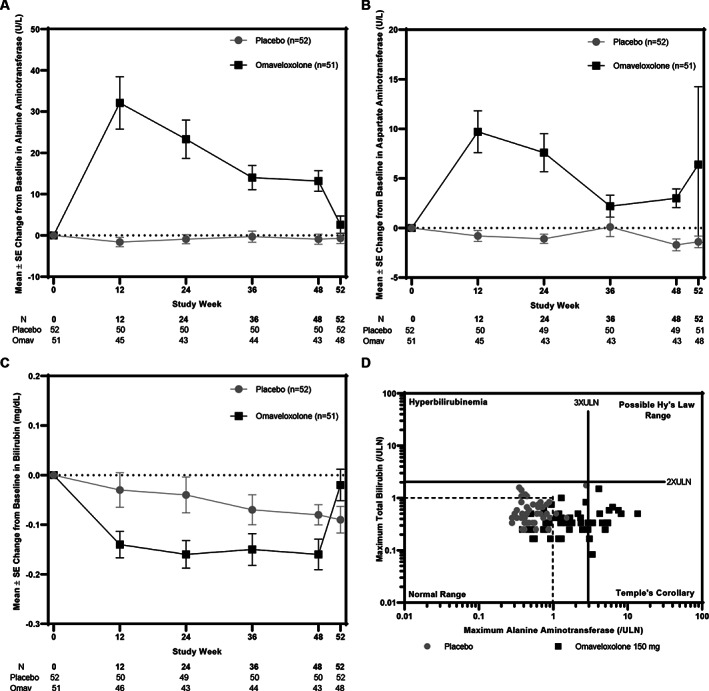
(A–C) Mean (± standard error [SE]) alanine aminotransferase (ALT; A), aspartate aminotransferase (B), and total bilirubin values (C) for all randomized patients in the omaveloxolone (Omav; n = 51) or placebo (n = 52) groups through 48 weeks of treatment. Post‐treatment values collected at week 52, 4 weeks after the last dose of study drug was administered, are also shown. (D) eDISH (Evaluation of Drug‐Induced Serious Hepatotoxicity) plot. Vertical lines correspond to 3 × the upper limit of normal (ULN) for ALT. Horizontal lines correspond to 2 × ULN for total bilirubin. No patients met potential Hy's criteria in the upper‐right quadrant.
Patients in both cohorts had mean decreases from baseline in systolic and diastolic blood pressure through week 48 (not shown). No changes were noted on echocardiograms in either group (not shown). On average, patients receiving omaveloxolone had mean decreases in weight relative to baseline and to patients receiving placebo at week 48. Such decreases were limited to adults and were more pronounced in overweight patients (baseline body mass index > 25 kg/m2; not shown).
Serious adverse events were reported in 3 omaveloxolone and 2 placebo patients while they were receiving study drug (see Table 3). Two additional omaveloxolone patients reported serious adverse events approximately 2 weeks after receiving the final dose. Four patients receiving omaveloxolone and 2 patients receiving placebo discontinued treatment due to the occurrence of an adverse event. Three additional patients receiving omaveloxolone withdrew consent for personal reasons. None of the serious adverse events or adverse events that led to treatment discontinuations occurred in the pediatric subgroup.
Other Changes in Laboratory Parameters
In a previous study, omaveloxolone lowered minimally elevated creatine kinase levels and restored minimally lowered ferritin levels in FA. 17 Both of these effects are consistent with normalization of subclinical but abnormal laboratory values. Thus here, we examined not only effects on ferritin, but also estimated glomerular filtration rate (eGFR; as an index of kidney function) and bilirubin (as an index of liver function). Over the course of 48 weeks, omaveloxolone increased ferritin levels and eGFR and lowered total bilirubin, consistent with restoration of biochemical abnormalities (see Figs 4C and 5) in FA.
FIGURE 5.
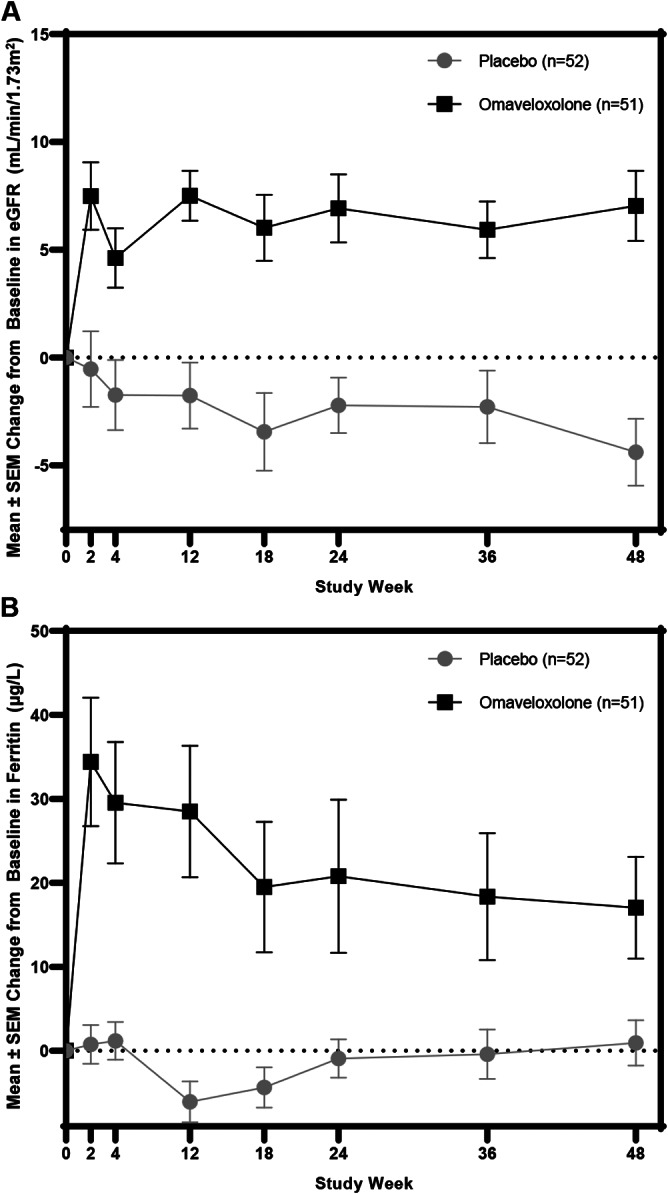
Data shown are mean (± standard error of the mean [SEM]) changes in serum ferritin (μg/l) and estimated glomerular filtration rate (eGFR; ml/min/1.73m2) over time for patients randomized to omaveloxolone or placebo.
Discussion
In our study, omaveloxolone treatment significantly improved neurological function relative to placebo after 48 weeks of treatment. Unlike patients treated with placebo, whose mFARS scores worsened, patients treated with omaveloxolone had improvements in neurological function after 48 weeks. This occurred not only in the primary analysis but also in post hoc analyses accounting for additional baseline covariates that were meaningfully different across randomized cohorts. Moreover, the magnitude of observed improvements is equivalent to approximately 2 years of FA disease progression, as judged by similar cohorts based on age in a natural history (FACOMS) study. 19 Although a small placebo response was noted during the first 12 weeks of the study, the two treatment groups steadily diverged thereafter, and the rate of disease progression between weeks 12 and 48 for patients randomized to placebo was similar to natural history data. 19 More importantly, the improvements in upright stability with omaveloxolone relative to placebo demonstrate an effect on the mFARS component that defines important clinical milestones in FA, including loss of ambulation. 20
Overall, the results correspond well with Part 1 of the MOXIe trial with respect to the temporal course and magnitude of improvement with omaveloxolone treatment. As in Part 1, omaveloxolone improved mFARS in subjects with pes cavus to a lesser degree than those without pes cavus. The replication of this finding suggests that it is real, although the immediate explanation is not obvious. Pes cavus is reported in about 50 to 70% of individuals with FA in natural history studies; its characterization does not usually reflect the systematic approach in the present study. 21 , 22 Using the specific criteria in the present study, individuals with particularly severe foot deformity were excluded. In natural history studies it is more common among more severely affected individuals, while in the present study GAA1 length was shorter among those with pes cavus. Although the reason is not entirely clear, pes cavus could identify a subgroup of FA patients with fixed deficits that do not readily reverse, a subgroup of individuals without abnormalities in functions targeted by omaveloxolone, or a subgroup not reproducibly assessed by the present protocol. Alternatively, the lower response may simply reflect that as assessed here, the participants designated as having pes cavus represent a more severely affected set of individuals with FA. From an anatomical perspective, a variety of neuroanatomic locations are affected in FA (eg, dorsal root ganglia, cerebellar dentate nuclei, sensory systems, corticospinal tracts); however, the sites at which omaveloxolone acts are unclear, suggesting that pes cavus may mark neuronal substrates for which omaveloxolone benefit is lower. 22 Nonetheless, no matter the exact biology of the effect of pes cavus, it represents a prespecified marker of those with less measurable improvement in response to omaveloxolone. This result may deserve further study.
The relative response to omaveloxolone treatment in mFARS subscores and specific subpopulations with FA also supports the potential global benefit of omaveloxolone. Improvement in the treatment groups reflected improvements observed in each of the individual components of the mFARS assessment (bulbar function, upper limb coordination, lower limb coordination, and upright stability) relative to placebo, although of greater magnitude in the upright stability and upper limb subscores. 19 Although this could reflect a preferential effect on those items, it may also result from the greater maximum score in those subscores. In addition, the greater response to omaveloxolone treatment in younger subjects and those with longer GAA repeat lengths suggests that omaveloxolone targets the most severe biochemical abnormalities in FA and may address deficits in those with more severe or most rapidly changing disease. 19
Overall, secondary endpoints did not demonstrate a benefit of omaveloxolone. Patients randomized to omaveloxolone had improvements in FA‐ADL scores that achieved nominal significance compared to patients randomized to placebo, but other secondary endpoints did not differ significantly between treatment groups. Available natural history data demonstrate that many of the secondary endpoints assessed here are insensitive to change, typically reaching significant changes without intervention over the course of years. 19 Given the small magnitude of annual changes and the small sample size, the study was not powered to detect a statistical difference between treatment groups in these secondary endpoints. Nevertheless, there were also improvements in selected secondary outcome measures, including the PGIC and FA‐ADL scores. Collectively, the improvements across multiple measures suggest that the improvements in neurological function with omaveloxolone translated to improvements in how patients felt (PGIC) and functioned (FA‐ADL).
Consistent with prior studies, omaveloxolone was generally well tolerated in this study, with few discontinuations or serious adverse events. Importantly, given the presence of cardiomyopathy in FA, omaveloxolone did not increase blood pressure and was not associated with adverse effects on electrocardiogram or echocardiogram parameters, including ventricular heart rate, QTcF, wall thicknesses, or ejection fraction. Treatment with omaveloxolone was associated with asymptomatic, transient, reversible increases in aminotransferases without liver injury. Such changes could represent a consequence of reactivation of hepatic function in FA. Although the liver is normal for clinical care in FA, liver frataxin levels are among the highest in the body and are decreased in animal models of FA. 23 , 24 , 25 Patients have subclinical decreases in a variety of hepatically synthesized proteins, including Apo A1 and ferritin, and hepatic knockout of frataxin is toxic to the liver in mice. 25 , 26 , 27 Activation of Nrf2 induces aminotransferase genes and serum activity of ALT and AST in some situations. Exposure of liver cells to omaveloxolone or its analogue, bardoxolone methyl, results in concentration‐dependent increases in both ALT and AST mRNA levels. 28 Omaveloxolone also increases ALT and AST protein levels in cell lines derived from nonhepatic tissues, such as colon, skeletal muscle, and kidney, indicating that omaveloxolone regulates transcription of ALT and AST genes in multiple organs. 28 , 29 ALT and AST catalyze the reversible transfer of amino groups between alanine or aspartate, respectively, and α‐ketoglutarate to form pyruvate or oxaloacetate and glutamate. 31 Thus, these enzymes play key roles in metabolic processes, including the tricarboxylic acid cycle. In addition, these enzymes influence redox balance and mitochondrial metabolism through glutathione production 30 and regulate the NAD+/NADH ratio via the malate–aspartate shuttle. 31 Accordingly, changes in aminotransferase levels may reflect physiological adaptations to restoration of Nrf2 levels in FA. 32 Similarly, elevations in serum γ‐glutamyl transferase (GGT), a protein involved in glutathione synthesis and also controlled by Nrf2, were observed in omaveloxolone‐treated patients in the present study (data not shown). Collectively, changes in GGT, ALT, AST, and total bilirubin observed with omaveloxolone do not appear to be associated with liver injury but are consistent with Nrf2‐mediated increases in enzymes of glutathione synthesis and mitochondrial bioenergetics, and thus an appropriate physiological response to Nrf2 activation. Longer‐term safety data collected from an open‐label extension study with omaveloxolone in patients with FA can help confirm this finding.
Furthermore, the response of plasma markers of renal and hepatic function match the role of Nrf2 in multiple organs. Both eGFR and total bilirubin levels improved in the FA subjects given omaveloxolone, although baseline levels were nominally in the normal range. This response essentially provides a biomarker of omaveloxolone activity in unaffected tissue, emphasizing its global effects on the FA phenotype.
Although potential unblinding can be a concern with side effects or the need for unplanned or additional laboratory testing (eg, if necessitated by aminotransferase increases), confounding factors such as concomitant medications and disease progression may also influence parameters, so treatment assignment is not truly known. Although nausea was reported more frequently in patients randomized to omaveloxolone, it was also reported in 14% of placebo participants. Second, the occurrence of adverse events was not temporally associated with the observed treatment effect on efficacy; adverse events tended to occur within the first 12 weeks after treatment initiation, whereas improvements in mFARS with omaveloxolone occurred beyond week 24. Third, to minimize potential bias, assessment of the primary outcome (mFARS) was conducted by a neurologist who was blinded to laboratory values in almost all cases, and several sections of the examination (eg, upright stability subscore) included timed components that are objective measures and not readily altered by subject effort. Collectively, although there are limitations, the data support that the observed benefit with omaveloxolone noted in the present study is unlikely to be reflective of any potential participant unblinding.
Limitations of the present study include the small sample size, modest duration, and possible limitations of the generalizability of the results. FA is a rare, progressive disease that precludes enrollment of a larger cohort or longer duration that could more robustly assess the effects of omaveloxolone in certain subpopulations, including pediatric patients. In particular, the recent set of outcome measures focuses on individuals at the middle stages of disease, when patients can perform an exercise test and almost all patients are ambulatory. This is not the most rapidly progressing group based on natural history studies, but is the most readily studied subgroup. 19 , 21 Thus, as other efficacy assessments, including the 9‐HPT and T25‐FW, were unimproved but underpowered, further studies may require cohorts with more advanced disease and longer‐term follow‐up to reliably determine the effect of omaveloxolone on such groups. Nevertheless, as Nrf2 dysfunction is found diffusely in FA and because change is more easily demonstrated in patients at earlier stages of the disease, it seems likely that at least some benefit will be noted throughout the course of the illness. Thus, omaveloxolone may be a potential therapeutic agent in many if not all stages of FA.
Author Contributions
D.R.L., C.M., and M.P.C. conceived and designed the study and drafted the initial manuscript. A.G., M.O., D.R.L., M.C., C.M., M.B.D., S.H.S., J.C.H., S.B., W.N., C.J.M., K.D.M., P.G., G.W., T.Z., and S.P. helped collect data, analyzed data, and revised the manuscript.
Potential Conflicts of Interests
This work was sponsored and funded by Reata Pharmaceuticals, which is developing omaveloxolone for clinical applications. M.P.C., C.J.M., M.O., and A.G. are employees of Reata Pharmaceuticals.
Acknowledgments
We acknowledge the supportive role of J. Farmer and the Friedreich's Ataxia Research Alliance as well as all MOXIe investigators, support staff, and patients. We appreciate the work of clinical trial coordinators T. Alexander, M. Amprosi, G.T. Black, L. Campbell, A. Castaldo, A. Clay, A. Cowsert, A. Eigentler, A. Fisher, Z. Fleszar, M. Green, L. Hauser, S. Heintzman, E. Indelicato, C. McDaniel, M. McGriff‐Baxter, L. Mezache, A. Mongelli, Dr L. Nanetti, S. Norman, C. Park, B. Sharot, E. Sperin, G. Tai, M. Tellez, and M. Wells. We thank Drs N. S. Klee and S. Pitts of Reata Pharmaceuticals for administrative assistance in coordinating author responses, forms, and biographical information for electronic submission.
References
- 1. Lynch DR, Farmer JM, Balcer LJ, Wilson RB. Friedreich ataxia: effects of genetic understanding on clinical evaluation and therapy. Arch Neurol 2002;59:743–747. [DOI] [PubMed] [Google Scholar]
- 2. Pandolfo M. Friedreich ataxia. Arch Neurol 2008;65:1296–1303. [DOI] [PubMed] [Google Scholar]
- 3. Galea CA, Huq A, Lockhart PJ, et al. Compound heterozygous FXN mutations and clinical outcome in Friedreich ataxia. Ann Neurol 2016;79:485–495. [DOI] [PubMed] [Google Scholar]
- 4. Delatycki MB, Bidichandani SI. Friedreich ataxia—pathogenesis and implications for therapies. Neurobiol Dis 2019;132:104606. [DOI] [PubMed] [Google Scholar]
- 5. Martelli A, Puccio H. Dysregulation of cellular iron metabolism in Friedreich ataxia: from primary iron‐sulfur cluster deficit to mitochondrial iron accumulation. Front Pharmacol 2014;5:130. [DOI] [PMC free article] [PubMed] [Google Scholar]
- 6. Tsou AY, Paulsen EK, Lagedrost SJ, et al. Mortality in Friedreich ataxia. J Neurol Sci 2011;307:46–49. [DOI] [PubMed] [Google Scholar]
- 7. Pousset F, Legrand L, Monin ML, et al. A 22‐year follow‐up study of long‐term cardiac outcome and predictors of survival in Friedreich ataxia. JAMA Neurol 2015;72:1334–1341. [DOI] [PubMed] [Google Scholar]
- 8. Strawser C, Schadt K, Hauser L, et al. Pharmacological therapeutics in Friedreich ataxia: the present state. Expert Rev Neurother 2017;17:895–907. [DOI] [PubMed] [Google Scholar]
- 9. D'Oria V, Petrini S, Travaglini L, et al. Frataxin deficiency leads to reduced expression and impaired translocation of NF‐E2‐related factor (Nrf2) in cultured motor neurons. Int J Mol Sci 2013;14:7853–7865. [DOI] [PMC free article] [PubMed] [Google Scholar]
- 10. Paupe V, Dassa EP, Goncalves S, et al. Impaired nuclear Nrf2 translocation undermines the oxidative stress response in Friedreich ataxia. PLoS One 2009;4:e4253. [DOI] [PMC free article] [PubMed] [Google Scholar]
- 11. Shan Y, Schoenfeld RA, Hayashi G, et al. Frataxin deficiency leads to defects in expression of antioxidants and Nrf2 expression in dorsal root ganglia of the Friedreich's ataxia YG8R mouse model. Antioxid Redox Signal 2013;19:1481–1493. [DOI] [PMC free article] [PubMed] [Google Scholar]
- 12. Anzovino A, Chiang S, Brown BE, et al. Molecular alterations in a mouse cardiac model of Friedreich ataxia: an impaired Nrf2 response mediated via upregulation of Keap1 and activation of the Gsk3beta axis. Am J Pathol 2017;187:2858–2875. [DOI] [PubMed] [Google Scholar]
- 13. Petrillo S, Piermarini E, Pastore A, et al. Nrf2‐inducers counteract neurodegeneration in frataxin‐silenced motor neurons: disclosing new therapeutic targets for Friedreich's ataxia. Int J Mol Sci 2017;18:2173. [DOI] [PMC free article] [PubMed] [Google Scholar]
- 14. Sahdeo S, Scott BD, McMackin MZ, et al. Dyclonine rescues frataxin deficiency in animal models and buccal cells of patients with Friedreich's ataxia. Hum Mol Genet 2014;23:6848–6862. [DOI] [PMC free article] [PubMed] [Google Scholar]
- 15. Dinkova‐Kostova AT, Liby KT, Stephenson KK, et al. Extremely potent triterpenoid inducers of the phase 2 response: correlations of protection against oxidant and inflammatory stress. Proc Natl Acad Sci U S A 2005;102:4584–4589. [DOI] [PMC free article] [PubMed] [Google Scholar]
- 16. Abeti R, Baccaro A, Esteras N, Giunti P. Novel Nrf2‐inducer prevents mitochondrial defects and oxidative stress in friedreich's ataxia models. Frontiers in Cellular Neuroscience. 2018;12 10.3389/fncel.2018.00188. [DOI] [PMC free article] [PubMed] [Google Scholar]
- 17. Lynch DR, Farmer J, Hauser L, et al. Safety, pharmacodynamics, and potential benefit of omaveloxolone in Friedreich ataxia. Ann Clin Transl Neurol 2019;6:15–26. [DOI] [PMC free article] [PubMed] [Google Scholar]
- 18. Lynch DR, Farmer JM, Tsou AY, et al. Measuring Friedreich ataxia: complementary features of examination and performance measures. Neurology 2006;66:1711–1716. [DOI] [PubMed] [Google Scholar]
- 19. Patel M, Isaacs CJ, Seyer L, et al. Progression of Friedreich ataxia: quantitative characterization over 5 years. Ann Clin Transl Neurol 2016;3:684–694. [DOI] [PMC free article] [PubMed] [Google Scholar]
- 20. Rummey C, Farmer JM, Lynch DR. Predictors of loss of ambulation in Friedreich's ataxia. EClinicalMedicine. 2020;18:100213. [DOI] [PMC free article] [PubMed] [Google Scholar]
- 21. Reetz K, Dogan I, Hohenfeld C, et al. Nonataxia symptoms in Friedreich ataxia: report from the registry of the European Friedreich's Ataxia Consortium for Translational Studies (EFACTS). Neurology 2018;91:e917–e930. [DOI] [PubMed] [Google Scholar]
- 22. Martinez AR, Moro A, Abrahao A, et al. Nonneurological involvement in late‐onset Friedreich ataxia (LOFA): exploring the phenotypes. Cerebellum 2017;16:253–256. [DOI] [PubMed] [Google Scholar]
- 23. Koutnikova H, Campuzano V, Foury F, Dollé P, Cazzalini O, Koenig M. Studies of human, mouse and yeast homologues indicate a mitochondrial function for frataxin. Nature Genetics. 1997;16:345–351. 10.1038/ng0897-345. [DOI] [PubMed] [Google Scholar]
- 24. Chandran V, Gao K, Swarup V, et al. Inducible and reversible phenotypes in a novel mouse model of Friedreich's ataxia. Elife 2017;6:e30054. [DOI] [PMC free article] [PubMed] [Google Scholar]
- 25. Stuwe SH, Goetze O, Arning L, et al. Hepatic mitochondrial dysfunction in Friedreich ataxia. BMC Neurol 2011;11:145. [DOI] [PMC free article] [PubMed] [Google Scholar]
- 26. Martelli A, Friedman LS, Reutenauer L, et al. Clinical data and characterization of the liver conditional mouse model exclude neoplasia as a non‐neurological manifestation associated with Friedreich's ataxia. Dis Model Mech 2012;5:860–869. [DOI] [PMC free article] [PubMed] [Google Scholar]
- 27. Wang Q, Guo L, Strawser CJ, et al. Low apolipoprotein A‐I levels in Friedreich's ataxia and in frataxin‐deficient cells: implications for therapy. PLoS One 2018;13:e0192779. [DOI] [PMC free article] [PubMed] [Google Scholar]
- 28. Miller GA, Bumeister R, Laidlaw J, et al. Bardoxolone methyl transcriptionally regulates transaminase levels and increases glutathione levels. Poster presented at: American Society of Nephrology 44th Annual Meeting; November 8–13, 2001; Philadelphia, PA.
- 29. Lewis JH, Jadoul M, Block GA, et al. Effects of bardoxolone methyl on hepatic enzymes in patients with type 2 diabetes mellitus and stage 4 CKD. Clin Transl Sci (in press). 10.1111/cts.12868. [DOI] [PMC free article] [PubMed] [Google Scholar]
- 30. Ellinger JJ, Lewis IA, Markley JL. Role of aminotransferases in glutamate metabolism of human erythrocytes. J Biomol NMR 2011;49:221–229. [DOI] [PMC free article] [PubMed] [Google Scholar]
- 31. McGill MR. The past and present of serum aminotransferases and the future of liver injury biomarkers. EXCLI J 2016;15:817–828. [DOI] [PMC free article] [PubMed] [Google Scholar]
- 32. Sookoian S, Pirola CJ. Liver enzymes, metabolomics and genome‐wide association studies: from systems biology to the personalized medicine. World J Gastroenterol 2015;21:711–725. [DOI] [PMC free article] [PubMed] [Google Scholar]