

Abstract
There is an urgent demand for analytic approaches that enable precise and representative quantification of the transport of biologically active compounds across cellular membranes. In this study, we established a new means to monitor membrane permeation kinetics, using total internal reflection fluorescence microscopy confined to a ≈500 nm thick mesoporous silica substrate, positioned underneath a planar supported cell membrane mimic. This way, we demonstrate spatiotemporally resolved membrane permeation kinetics of a small‐molecule model drug, felodipine, while simultaneously controlling the integrity of, and monitoring the drug binding to, the cell membrane mimic. By contrasting the permeation behaviour of pure felodipine with felodipine coupled to the permeability enhancer caprylate (C8), we provide evidence for C8‐facilitated transport across lipid membranes, thus validating the potential for this approach to successfully quantify carrier system‐induced changes to cellular membrane permeation.
Keywords: drug delivery, membrane permeation, mesoporous silica, supported lipid bilayer, total internal reflection fluorescence
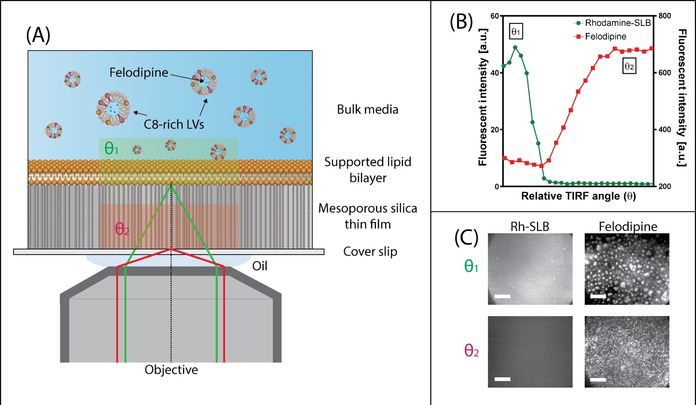
A unique angle: A new approach for monitoring the real‐time permeation of drug molecules, from the bulk phase, across a lipid membrane was established by supporting a lipid bilayer on mesoporous silica thin films. Through the use of TIRF microscopy, the angle of incidence of illumination light could be controlled to ensure the resulting evanescence was restricted within the thin film, and thus, only drug permeating the bilayer was resolved.
The cellular exchange and transport of small molecule bioactives are fundamental processes for biological activity that are strictly regulated by the plasma membrane. [1] Understanding how small molecules traverse the cellular membrane is therefore critical for the design and formulation development of novel drug candidates, where promotion of efficient cellular delivery is required to ensure desired therapeutic activity and response. [2] However, simulating and predicting the transport of small molecules across biological membranes in vitro presents a significant challenge due to the lack of facile, cost‐effective and biologically relevant approaches that deliver rapid and precise estimations of drug translocation.
In the context of oral drug delivery, small molecule therapeutics must readily absorb across the intestinal epithelium via transcellular and/or paracellular pathways to reach the systemic circulation, [3] or be hosted within a carrier system that promotes permeability, and thus bioavailability. [4] To simulate this process and screen drug candidates/carrier systems for permeability, static in vitro cellular models, such as the Caco‐2 cellular monolayer assay, have long been regarded as the benchmark approach. [5] However, the cost‐ and time‐exhaustive nature of cellular assays, limited biological relevancy, [6] and propensity for tight junction and/or cell monolayer disruption, lead to complications in obtaining and interpreting drug permeability kinetics with high accuracy. [7]
To overcome the hurdles associated with cellular assays, recent focus has been attributed to developing representative cell‐membrane mimics as a simplified approach for in vitro quantification of transcellular drug permeation. [8] In these systems, phospholipid membranes are adsorbed onto a porous polymeric support between a donor and acceptor cell, allowing for the elucidation of time‐dependent changes in drug concentration within the acceptor cell. [9] While supported artificial membrane assays ignore paracellular transport, several studies have demonstrated successful correlations between in vitro and in vivo pharmacokinetics, thus highlighting their ability to predict in vivo intestinal permeability. [10] However, the formation and integrity of the lipid membrane is neither monitored nor controlled using this approach, which increases susceptibility for random drug flux due to membrane disintegration. [11]
The aim of the present work was to overcome this limitation by combining the supported membrane approach with an analytical microscopy technique to validate bilayer integrity throughout drug permeation studies, while simultaneously allowing for the detection and quantification of drug permeation. This was accomplished using a ≈500 nm thick mesoporous silica thin films (MSTF) [12] serving as substrate for a supported lipid bilayer (SLB), [13] thereby enabling concurrent fluorescence recovery after photobleaching (FRAP) analysis of membrane integrity and total internal reflection fluorescence (TIRF) spatiotemporal monitoring of drug permeation into the MSTF.
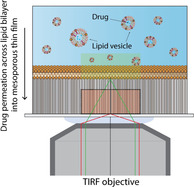
Formation of the supported lipid bilayer (SLB) was monitored with TIRF microscopy (Figure 1 A), through the inclusion of rhodamine‐labelled tracer vesicles (Rh‐POPC), [14] on both non‐porous (planar) and MSTF substrates with a pore size of ≈7 nm. [12] The rate of POPC vesicle adsorption and rupture [15] was ≈2‐fold greater on the planar silica substrate, compared to the MSTF, which was attributed to lower adhesion of vesicles to mesoporous silica; however, despite subtle microscopic differences in the actual rupture process, complete SLB formation over the entire surface was observed on both substrates (Figure 1). The integrity of the lipid membrane was verified using FRAP, [16] with substrate‐associated differences being observed for the diffusivity and immobile fraction of labelled Rh‐POPC lipids (Figure 1 C). The POPC bilayer adsorbed on MSTF exerted a ≈2‐fold greater diffusion constant (2.8±0.2 μm2 s−1 vs. 1.4±0.2 μm2 s−1) and 1.5‐fold reduction in immobile fraction (0.08±0.01 vs. 0.12±0.02), compared to the POPC bilayer on the planar silica substrate. This agrees with previous findings, [13] and accentuates that the influence of the substrate on the lipid membrane is significantly lower for a porous surface, when compared with a planar silica surface.
Figure 1.
A) TIRF micrographs contrasting the rate and behavior of SLB formation on a planar silica substrate versus MSTF (Scale bars=20 μm). B) Time‐induced changes in the number of vesicles adsorbed per 100×100 μm2 to a planar silica substrate (blue dots) versus MSTF (red squares) during the formation of SLBs. C) Variations in lipid membrane diffusion constant (green bars, left axis) and relative immobile fractions (pink checkered bars, right axis) for SLBs on planar and MSTF substrates. Data represents mean ± S.D. (n=3).
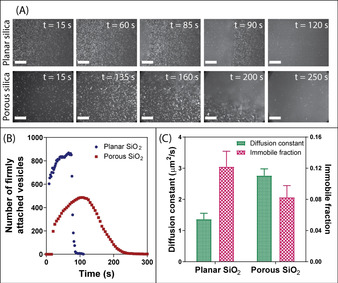
Before addressing drug permeation across SLBs formed on mesoporous silica, the partitioning of the auto‐fluorescent, poorly water‐soluble and orally administered drug, felodipine, to SLBs formed on non‐porous planar silica was investigated. Felodipine was encapsulated and solubilized within colloidal lipid vesicles (LVs; that is, mixed micelles and liposomes) [17] composed of biologically relevant concentrations of phospholipids and bile salts, [18] with and without the commonly used transient permeation enhancer (PE), sodium caprylate (C8). The inclusion of C8 (above its critical micelle concentration) did not impact the extent of LV adsorption to the SLB (Figure 2 A and B), but triggered a greater degree of drug spreading throughout the SLB, quantified by the time‐dependent increase in the diffuse diameter around the adsorbed LVs (Figure 2 C). These findings correlated closely to changes in mean normalized fluorescence kinetics (Figure 2 D), where LVs with and without C8 triggered a rapid initial increase in fluorescence intensity (within 1 min) due to vesicle adsorption onto the SLB, prior to a prolonged period of gradually increasing fluorescence intensity, with a ≈2‐fold greater mean normalized fluorescence for felodipine, after 20 min, when hosted within LVs including C8, compared to LVs alone. This is attributed to an increase in affinity of LVs to SLB containing the C8 and felodipine, which is consistent with the diffuse regions being visually brighter, suggesting more pronounced LV binding, fusion to the SLB and even aggregation, making them indistinguishable as individual entities.
Figure 2.
TIRF micrographs of SLBs formed on planar silica after 20 min incubation with auto‐fluorescent felodipine hosted in A) LVs and B) LVs with 100 mM C8. Scale bars=20 μm. C) The number of lipid vesicles adsorbed per 100×100 μm2 onto the SLB (green bars, left axis) and the average degree of felodipine spreading within the SLB (pink checkered bars, right axis), after 20 min. D) Mean normalised fluorescence as a function of time for felodipine partitioning towards a SLB on flat silica, when encapsulated in LVs (blue squares) and LVs with C8 (red circles). E) Simulation snapshots of felodipine interacting with lipid membranes, when hosted in LVs without C8 (left illustration) and LVs with C8 (right illustration). Note, the simulation included an upper and lower lipid membrane of equal composition and structure, since the simulation excludes the impact of gravitational settlement of LVs onto the bilayer. Data represents mean ± S.D. (n=3).
Previous studies have demonstrated that the primary permeation enhancement mechanism of medium‐chain fatty acids, for example, C8, when dosed at high concentrations, is to promote transcellular permeability by membrane perturbation. [19] PE molecules have been reported to rapidly insert and diffuse within lipid membranes, [20] which is in agreement with the current findings, where C8 promoted greater inclusion and diffusion of felodipine within the SLB. This was also supported by coarse‐grained molecular dynamics simulations which indicated a clear increase in the interaction with the lipid membrane for LVs with C8 compared to LVs alone, as shown in the right and left illustration in Figure 2 E. These simulations additionally showed that felodipine partitioned closely to phospholipid molecules within LVs containing lipid only, with limited drug detachment and partitioning towards the SLB, while LVs with C8 present promoted a significant (two‐fold) enhancement in the probability of felodipine detachment from the vesicle into the SLB.
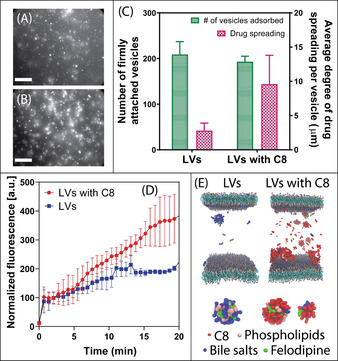
The C8‐provoked felodipine partitioning was hypothesized to correlate with enhanced felodipine permeation across the model lipid membrane. Since it is not possible to observe permeation across a SLB formed on planar silica, the lipid bilayer was instead supported on a mesoporous silica substrate as described above, allowing for time‐dependent drug diffusion across the SLB into the silica pores to be quantified, using TIRF‐confined evanescent wave illumination restricted to the porous film underneath the SLB. To correlate permeation with membrane partitioning, the angle of incidence, θ, of the TIRF light source was controlled to either induce total internal reflection (TIR) at the MSTF‐SLB interface, θ 1, or using a higher angle of incidence, θ 2, for TIR at the silica (cover slip)‐MSTF interface (Figure 3 A). The evanescent wave created by light reflecting at the interface between a material with a higher index of refraction (silica substrate) and a material with a lower index of refraction (MSTF) decays exponentially into the material of lower refractive index. [21] Subsequently, by increasing the angle of incidence above the critical angle required for TIR at the silica‐MSTF interface, it was possible to limit the depth of penetration of the evanescent wave to ≈100–200 nm into the MSTF pores, as verified by the fluorescence intensity of Rh‐POPC decreasing and the fluorescence intensity of felodipine increasing as a function of increasing angle of incidence, measured after 20 min incubation with felodipine in LVs with C8 (Figure 3 B). Moreover, visual observations of TIRF micrographs are indicative of LVs and C8 vesicles adsorbed on the SLB surface at θ 1 and submicron‐sized felodipine patches observed within the MSTF at θ 2 (Figure 3 C). The occurrence of submicron (up to micron) sized patches of felodipine within the MSTF was attributed to the tendency for the drug to partition in lipid aggregates and the strong adhesion between lipids and the silica surface within the porous film. Further, the existence of micron sized disordered mesoporous phases, [13] which according to observations made for mesoporous silicon scaffolds [22] may exist as independent diffusional systems that hamper complete connectivity throughout the film, could also promote the formation of small‐scale aggregates of water insoluble felodipine and lipids.
Figure 3.
A) Schematic representation of the TIRF experimental set up: a SLB was adsorbed onto a MSTF, whereby the angle of incidence was adjusted so that total internal reflection occurs at the silica–MSTF interface. This approach allows for identification of felodipine molecules that are transported across the SLB into the pores of the thin film. B) Fluorescent intensity of the SLB, detected via rhodamine‐labelled tracer lipids (green dots, left axis), and felodipine (red squares, right axis) as a function of angle of incidence. C) TIRF micrographs highlighting the change in fluorescence intensity and appearance of the SLB and felodipine at angles θ 1 and θ 2, as indicated in (B). Scale bars=20 μm.
A small increase in fluorescence intensity was observed when the pure drug was added to buffer alone. In contrast, felodipine fluorescence intensity within the MSTF pores was ≈5‐fold greater when administered with LVs, compared to the pure drug, which is attributed to the solubilizing capacity of the colloidal phases formed by the phospholipid species and bile salts (felodipine was added at 80 % its solubility limit). The ability for C8 to further promote permeation of felodipine was shown to correlate well with partitioning studies performed on the planar silica SLB, with a time‐dependent increase in felodipine fluorescence intensity within the MSTF being observed, leading to a mean normalized fluorescence intensity of 1048±315 AU after 20 min (Figure 4 C). In particular, analysis of the number and intensity of submicron felodipine patches within the MSTF after 20 min demonstrates a ≈5‐fold increase in drug permeation when administered with LVs and C8, compared to LVs alone (Figure 4 A and B). Changes in normalized fluorescence intensities due to felodipine permeation across the SLB displayed kinetics with multiple phases observed upon addition of LVs including C8 (Figure 4 C), where a lag phase was followed by a rapid and sustained increase in fluorescence intensity. This contrasts with the changes in normalized fluorescent intensity when felodipine‐encapsulated LVs with C8 were added to an SLB on planar silica (Figure 2 D), where a rapid increase in fluorescence intensity was observed within 60 s. Thus, the presence of a lag phase for LVs with C8 indicates that C8 must first bind to and insert within the lipid membrane prior to promoting transport of felodipine across the lipid membrane, into the pores of the MSTF.
Figure 4.
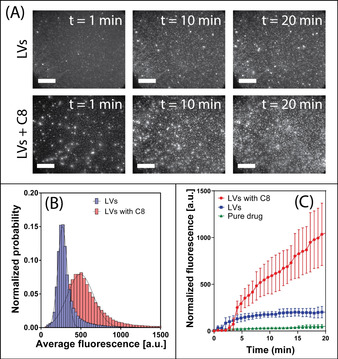
A) TIRF micrographs at various time points highlighting felodipine permeation across the SLB into the pores of the MSTF, when solubilized within LVs without a permeation enhancer (top row) and with C8 (bottom row). Scale bars=20 μm. B) Fluorescent intensity distributions for felodipine patches within MSTF when hosted in LVs (blue bars) and LVs with C8 (red bars). C) Mean normalized fluorescence as a function of time for felodipine within MSTF in TRIS buffer (i.e. pure drug) (green triangles), LVs (blue squares) and LVs with C8 (red circles). Data represents mean ± S.D. (n=3).
Importantly, the integrity of the SLB was not significantly disrupted during (or after) exposure to felodipine, when encapsulated within LVs including C8 (Figure 5). That is, monitoring of Rh‐POPC fluorescence at the MSTF‐SLB interface (θ 1), concurrently to felodipine permeation, revealed only a minor time‐dependent reduction in fluorescence intensity (Figures 5 A and C), being attributed to Rh‐POPC molecules within the SLB interchanging with lipids within LVs. Further, FRAP analysis post‐exposure to felodipine demonstrated essentially complete fluorescence recovery within 30 s after photobleaching (Figure 5 B), validating the presence of an intact SLB throughout the drug permeation process. A small increase in diffusion constant was even observed following felodipine exposure, from 2.8±0.2 μm2 s−1 to 3.5±0.7 μm2 s−1, which is consistent with previous findings that demonstrated the ability for saturated fatty acids (e.g. C8) to facilitate lipid packing and membrane fluidity. [23]
Figure 5.
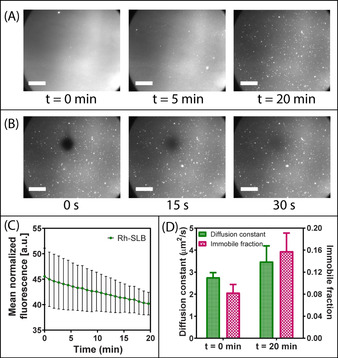
A) TIRF micrographs highlighting the time‐dependent changes in visual appearance of the rhodamine‐labelled SLB when exposed to felodipine encapsulated within LVs in the presence of C8. Scale bars=20 μm. B) TIRF micrographs revealing fluorescence recovery of the rhodamine‐labelled SLB after photobleaching. FRAP was performed on the SLB following exposure to felodipine hosted within LVs with C8. Thus, the ability for fluorescence recovery within 30 s after photobleaching indicates the presence of an intact SLB. C) Mean normalized fluorescence as a function of time for the rhodamine‐labelled SLB during exposure to felodipine hosted within LVs in the presence of C8. The TIRF angle was set at the MSTF‐SLB interface while monitoring Rh‐SLB fluorescence. D) Variations in lipid membrane diffusion constant (green bars, left axis) and relative immobile fractions (pink checkered bars, right axis) for SLBs pre‐exposure to felodipine hosted within LVs in the presence of C8 (t=0 min) and post‐exposure (t=20 min). Data represents mean ± S.D. (n=3).
In conclusion, TIRF microscopy has for the first time been used to monitor time‐dependent changes in the adsorption and diffusion of a bioactive drug compound from the bulk phase, to and through a supported cell‐membrane mimic, into the pores of a mesoporous silica film, thereby directly assessing in vitro drug permeation across a model lipid membrane. By harnessing the capabilities of TIRF microscopy, it was possible to elucidate the mechanism of action of a common PE on a model lipid membrane, while discriminating its ability to increase the diffusion and permeation of a solubilized drug molecule within and across a lipid membrane. Correlations between drug partitioning to a SLB on a flat surface and permeation across an SLB on a porous surface revealed that once inserted into the lipid membrane, felodipine readily diffused across the SLB and into the MSTF. In comparison with a solid planar support, the MSTF substrate ensures a more representative quantification of simulated drug permeation across a biological membrane, while the distribution within and integrity of the SLB can still be assessed. While the focus of the current study was to monitor and validate the C8‐induced permeability of a model drug in simulated oral delivery conditions, the approach has high potential to be broadly applied for optimizing small‐molecule bioactive permeation across widespread lipid membrane barriers, including cellular membranes and the blood–brain barrier. Since MSTF may facilitate some degree of active transport across the SLB, [22] it is critical that permeation kinetics of the pure drug are investigated as a negative control, with respect to carrier systems, as this mode of facilitated transport may be greater for other drug molecules than that observed for felodipine. It is therefore stipulated that employing such an approach to estimate drug permeation will prevent the need for costly and time‐exhaustive cellular assays, while still providing a biologically relevant prediction for in vivo permeability.
Conflict of interest
The authors declare no conflict of interest.
Supporting information
As a service to our authors and readers, this journal provides supporting information supplied by the authors. Such materials are peer reviewed and may be re‐organized for online delivery, but are not copy‐edited or typeset. Technical support issues arising from supporting information (other than missing files) should be addressed to the authors.
Supplementary
Acknowledgements
AstraZeneca (Mölndal, Sweden) is acknowledged for the generous donation of a felodipine sample. ÅForsk Foundation (16‐463) is acknowledged for the postdoctoral fellowship support for Paul Joyce. Molecular simulations were performed on resources provided by the Swedish National Infrastructure for Computing (SNIC) at the Uppsala Multidisciplinary Center for Advanced Computational Science (UPPMAX), the Center for High Performance Computing (PDC), and the High‐Performance Computing Center North (HPC2N). This study is part of the science program of the Swedish Drug Delivery Forum (SDDF) and received financial support from Vinnova (Dnr 2017‐02690) as well as the European Research Council grant (638965) and Swedish Research Council grant (2018‐3309). We also acknowledge funding from NordForsk for the Nordic University Hub project #85352 (Nordic POP, Patient Oriented Products).
P. Joyce, S. Jõemetsa, S. Isaksson, S. Hossain, P. Larsson, C. Bergström, F. Höök, Angew. Chem. Int. Ed. 2021, 60, 2069.
Contributor Information
Paul Joyce, Email: paul.joyce@unisa.edu.au.
Prof. Fredrik Höök, Email: fredrik.hook@chalmers.se.
References
- 1. Zhang R., Qin X., Kong F., Chen P., Pan G., Drug Delivery 2019, 26, 328–342. [DOI] [PMC free article] [PubMed] [Google Scholar]
- 2. Yang N. J., Hinner M. J., Methods Mol. Biol. 2015, 1266, 29–53. [DOI] [PMC free article] [PubMed] [Google Scholar]
- 3. Karasov W. H., J. Exp. Biol. 2017, 220, 2495–2501. [DOI] [PubMed] [Google Scholar]
- 4. Neves A. R., Queiroz J. F., Lima S. A. C., Figueiredo F., Fernandes R., Reis S., J. Colloid Interface Sci. 2016, 463, 258–265. [DOI] [PubMed] [Google Scholar]
- 5.
- 5a. Hubatsch I., Ragnarsson E. G., Artursson P., Nat. Protoc. 2007, 2, 2111; [DOI] [PubMed] [Google Scholar]
- 5b. Artursson P., Palm K., Luthman K., Adv. Drug Delivery Rev. 1996, 22, 67–84. [DOI] [PubMed] [Google Scholar]
- 6. Sittampalam S., Eglen R., Ferguson S., Maynes J. T., Olden K., Schrader L., Shelper T., Ferrer M., Assay Drug Dev. Technol. 2015, 13, 254–261. [DOI] [PMC free article] [PubMed] [Google Scholar]
- 7. Press B., Di Grandi D., Curr. Drug Metab. 2008, 9, 893–900. [DOI] [PubMed] [Google Scholar]
- 8.
- 8a. Sugano K., Nabuchi Y., Machida M., Aso Y., Int. J. Pharm. 2003, 257, 245–251; [DOI] [PubMed] [Google Scholar]
- 8b. Sugano K., Takata N., Machida M., Saitoh K., Terada K., Int. J. Pharm. 2002, 241, 241–251. [DOI] [PubMed] [Google Scholar]
- 9.
- 9a. Kerns E. H., Di L., Petusky S., Farris M., Ley R., Jupp P., J. Pharm. Sci. 2004, 93, 1440–1453; [DOI] [PubMed] [Google Scholar]
- 9b. Kansy M., Senner F., Gubernator K., J. Med. Chem. 1998, 41, 1007–1010. [DOI] [PubMed] [Google Scholar]
- 10.
- 10a. Nekkanti V., Rueda J., Wang Z., Betageri G. V., AAPS PharmSciTech 2016, 17, 1019–1029; [DOI] [PubMed] [Google Scholar]
- 10b. Delrivo A., Aloisio C., Longhi M. R., Granero G., AAPS PharmSciTech 2018, 19, 1437–1447; [DOI] [PubMed] [Google Scholar]
- 10c. Sugano K., Hamada H., Machida M., Ushio H., J. Biomol. Screening 2001, 6, 189–196. [DOI] [PubMed] [Google Scholar]
- 11. Matsson P., Bergström C. A. S., Nagahara N., Tavelin S., Norinder U., Artursson P., J. Med. Chem. 2005, 48, 604–613. [DOI] [PubMed] [Google Scholar]
- 12. Alberius P. C., Frindell K. L., Hayward R. C., Kramer E. J., Stucky G. D., Chmelka B. F., Chem. Mater. 2002, 14, 3284–3294. [Google Scholar]
- 13. Isaksson S., Watkins E. B., Browning K. L., Kjellerup Lind T., Cárdenas M., Hedfalk K., Höök F., Andersson M., Nano Lett. 2017, 17, 476–485. [DOI] [PubMed] [Google Scholar]
- 14. Pace H. P., Hannestad J. K., Armonious A., Adamo M., Agnarsson B., Gunnarsson A., Micciulla S., Sjövall P., Gerelli Y., Höök F., Anal. Chem. 2018, 90, 13065–13072. [DOI] [PubMed] [Google Scholar]
- 15. Mapar M., Jõemetsa S., Pace H., Zhdanov V. P., Agnarsson B., Höök F., J. Phys. Chem. Lett. 2018, 9, 5143–5149. [DOI] [PubMed] [Google Scholar]
- 16. Jönsson P., Jonsson M. P., Tegenfeldt J. O., Höök F., Biophys. J. 2008, 95, 5334–5348. [DOI] [PMC free article] [PubMed] [Google Scholar]
- 17. Zhou Z., Dunn C., Khadra I., Wilson C. G., Halbert G. W., Mol. Pharm. 2017, 14, 4132–4144. [DOI] [PMC free article] [PubMed] [Google Scholar]
- 18. Klein S., AAPS J. 2010, 12, 397–406. [DOI] [PMC free article] [PubMed] [Google Scholar]
- 19. Twarog C., Fattah S., Heade J., Maher S., Fattal E., Brayden D. J., Pharmaceutics 2019, 11, 1–21. [DOI] [PMC free article] [PubMed] [Google Scholar]
- 20. Hamilton J. A., Kamp F., Diabetes 1999, 48, 2255–2269. [DOI] [PubMed] [Google Scholar]
- 21.
- 21a. Thompson N. L., Burghardt T. P., Axelrod D., Biophys. J. 1981, 33, 435–454; [DOI] [PMC free article] [PubMed] [Google Scholar]
- 21b. Axelrod D., Thompson N. L., Burghardt T. P., J. Microsc. 1983, 129, 19–28. [DOI] [PubMed] [Google Scholar]
- 22. Kilian K. A., Böcking T., Gaus K., King-Lacroix J., Gal M., Gooding J. J., Chem. Commun. 2007, 1936–1938. [DOI] [PubMed] [Google Scholar]
- 23. Calder P. C., Yaqoob P., Harvey D. J., Watts A., Newsholme E. A., Biochem. J. 1994, 300, 509–518. [DOI] [PMC free article] [PubMed] [Google Scholar]
Associated Data
This section collects any data citations, data availability statements, or supplementary materials included in this article.
Supplementary Materials
As a service to our authors and readers, this journal provides supporting information supplied by the authors. Such materials are peer reviewed and may be re‐organized for online delivery, but are not copy‐edited or typeset. Technical support issues arising from supporting information (other than missing files) should be addressed to the authors.
Supplementary