

Abstract
New Findings
-
What is the central question of this study?
The study aimed to establish a novel model to study the chronic obstructive pulmonary disease (COPD)‐related cardiopulmonary effects of dynamic hyperinflation in healthy subjects.
-
What is the main finding and its importance?
A model of expiratory resistance breathing (ERB) was established in which dynamic hyperinflation was induced in healthy subjects, expressed both by lung volumes and intrathoracic pressures. ERB outperformed existing methods and represents an efficacious model to study cardiopulmonary mechanics of dynamic hyperinflation without potentially confounding factors as present in COPD.
Abstract
Dynamic hyperinflation (DH) determines symptoms and prognosis of chronic obstructive pulmonary disease (COPD). The induction of DH is used to study cardiopulmonary mechanics in healthy subjects without COPD‐related confounders like inflammation, hypoxic vasoconstriction and rarefication of pulmonary vasculature. Metronome‐paced tachypnoea (MPT) has proven effective in inducing DH in healthy subjects, but does not account for airflow limitation. We aimed to establish a novel model incorporating airflow limitation by combining tachypnoea with an expiratory airway stenosis. We investigated this expiratory resistance breathing (ERB) model in 14 healthy subjects using different stenosis diameters to assess a dose–response relationship. Via cross‐over design, we compared ERB to MPT in a random sequence. DH was quantified by inspiratory capacity (IC, litres) and intrinsic positive end‐expiratory pressure (PEEPi, cmH2O). ERB induced a stepwise decreasing IC (means (95% CI): tidal breathing: 3.66 (3.45–3.88), ERB 3 mm: 3.33 (1.75–4.91), 2 mm: 2.05 (0.76–3.34), 1.5 mm: 0.73 (0.12–1.58) litres) and increasing PEEPi (tidal breathing: 0.70 (0.50–0.80), ERB 3 mm: 11.1 (7.0–15.2), 2 mm: 22.3 (17.1–27.6), 1.5 mm: 33.4 (3.40–63) cmH2O). All three MPT patterns increased PEEPi, but to a far lesser extent than ERB. No adverse events during ERB were noted. In conclusion, ERB was proven to be a safe and efficacious model for the induction of DH and might be used for the investigation of cardiopulmonary interaction in healthy subjects.
Keywords: airflow limitation, elastic recoil, inspiratory capacity, positive end‐expiratory pressure, pulmonary mechanics

1. INTRODUCTION
Dynamic hyperinflation (DH) is a prognostically relevant factor in chronic obstructive pulmonary disease (COPD) (Aalstad et al., 2018; Casanova et al., 2005). DH is caused by airflow limitation and loss of elastic recoil and is strongly associated with poor quality of life, exercise intolerance (Cooper, 2006) and cardiac dysfunction (Barr et al., 2010; Hohlfeld et al., 2018). The identification of patients susceptible to DH is a key objective in the diagnosis and treatment of patients with COPD, especially in terms of cardiovascular comorbidities (Klooster et al., 2015). However, there are substantial safety issues when inducing DH in patients with COPD and the interpretation of underlying mechanisms and prognosis is confounded by the excess extrapulmonary comorbidity of COPD.
Previous approaches to inducing DH in patients with COPD have led to the method of metronome‐paced tachypnoea (MPT) (Weigt, Abrazado, Kleerup, Tashkin, & Cooper, 2008). Tachypnoea and a consecutive shortening of expiratory time determine a stepwise induction of DH. MPT has proved as a reliable tool for the diagnostic induction of DH and is applied to test therapeutic interventions in patients with COPD (Nakagawa et al., 2015). Recently, MPT revealed the induction of DH in healthy subjects (Cooper et al., 2014). In patients with COPD, many factors like inflammation (Sode, Dahl, & Nordestgaard, 2011; Vanfleteren et al., 2013), hypoxic vasoconstriction (Barbera & Blanco, 2009; Lopez‐Sanchez et al., 2013) and rarefication of pulmonary vasculature (Barr et al., 2010; Hueper et al., 2015; Liebow, 1959) confound the investigation of DH and its role in cardiopulmonary interaction. Hence, the induction of DH in healthy subjects represents a valuable tool to simulate cardiopulmonary mechanics of a diseased lung without the above‐mentioned confounders. Well‐established models of DH like the Starling resistor have revealed some technical limitations apart from a rather challenging application in practical use. For MPT, as an easily applicable model, the lack of airflow limitation as the main pathophysiological feature of COPD raises concerns about the validity of induced DH in healthy subjects. Indeed, MPT‐induced DH has only been measured by means of inspiratory capacity (IC). An invasive validation of DH via intrinsic positive end‐expiratory pressure (PEEPi) has not been conducted for MPT yet. The aim of this study was to establish a model for the controlled induction of DH, combining tachypnoea with expiratory airway resistance in healthy subjects. Further, we aimed to compare this model with MPT via IC and PEEPi measurement. We hypothesize that our model of expiratory resistance breathing (ERB) significantly increases PEEPi. Further, we hypothesize that ERB induces a significantly greater decrease in IC and increase in PEEPi compared to MPT. Rejecting the null hypothesis would characterize ERB as a valid tool to induce DH and to study cardiopulmonary consequences of DH in healthy subjects.
2. METHODS
2.1. Ethical approval
This study was conducted in accordance with the Declaration of Helsinki. Prior to inclusion, each subject received detailed explanations on all study‐related procedures and gave written informed consent. The study protocol as well as the participants’ information and the written informed consent were approved by the Ethics Committee of the City of Vienna (EK 15‐209‐1015). The study was registered with www.clinicaltrials.gov, under NCT03500822.
2.2. Study subjects
For this randomized, cross‐over interventional study, we enrolled a total of 14 participants. Subject inclusion criteria comprised 18–40 years of age, male sex, a body mass index (BMI) below 27 kg m−2 and lifelong non‐smoking (i.e. non‐smoking during recruitment and previous history of less than 100 cigarettes). Exclusion criteria covered obstructive lung diseases (i.e. asthma, COPD), cardiovascular diseases (i.e. heart failure, coronary artery disease, arterial hypertension) or any other relevant pulmonary or cardiac disorder as judged by the investigators. Prior to inclusion, each participant underwent a detailed physical examination and recording of medical history. Spirometry was conducted in each participant and airflow limitation was ruled out via spirometry by means of a portable ultrasound‐based spirometer (Easyone, NDD Medical, Zürich, Switzerland) using the reference equations of the European Respiratory Society (Quanjer et al., 1993). Subjects were recruited from the Medical University of Vienna, from the investigators’ circle of acquaintance and via public advertisements.
2.3. Induction of dynamic hyperinflation
Participants had to breathe through a mouthpiece connected to a conventional pneumotachograph (High‐Flow PNT Series 3830, Hans Rudolph, Shawnee, KS, USA). Downstream of the mouthpiece, a T‐connector coupled a one‐way valve with an expiratory airway stenosis (Figure 1a). Three different stenosis diameters (i.e. 1.5, 2.0 and 3.0 mm, Figure 1b) were used to grade different amounts of airflow limitation. During each ERB cycle subjects had to breathe at a constant rate of 30 bpm and a ratio of inspiration to expiration (I:E ratio) of 1:3 guided by a metronome. MPT was used as the control intervention with three different cycles (i.e. MPT1: respiratory rate of 40 bpm, I:E ratio of 1:1; MPT 2: respiratory rate of 40 bpm, I:E ratio of 1:2; MPT 3: respiratory rate of 30 bpm, I:E ratio of 1:2) as previously described (Cooper et al., 2014; Weigt et al., 2008).
FIGURE 1.

Mouthpiece with pneumotachograph, one‐way valves (a) and expiratory stenoses with various diameters (i.e. 1.5, 2.0 and 3.0 mm) (b)
2.4. Visit schedule
Study visits were conducted in a temperature‐controlled room, starting at 15.00 h with subjects fasting for at least 8 h. Following local anaesthesia of the nasopharyngeal mucous membrane, an oesophageal balloon catheter was administered as reported previously (Benditt, 2005). Briefly, the deflated balloon catheter was inserted while subjects were repeatedly swallowing in an upright position. During inspiration, we verified gastric position via positive pressure deflections. Following the inflation of 2 ml and deflation of 0.5 ml of air, subsequent withdrawal of the balloon led to negative pressure deflections indicative of intrathoracic position. Intra‐oesophageal placement of the total balloon was reached via a further withdrawal for an additional 10 cm and the detection of the cardiac pulsation in the pressure waveform. Participants were placed in a supine position under tidal breathing for 15 min. Prior to DH, subjects had to breathe through the mouthpiece for 3 min without metronome pacing.
Subjects were randomly allocated to start with either ERB or MPT. Each cycle of hyperinflation was followed by 60 s of tidal breathing without mouthpiece or metronome to let subjects return to tidal breathing. After completion of the three respective cycles, subjects from the ERB group crossed over to the MPT group and vice versa. At the end of each 60 s cycle, as well as the consecutive phase of tidal breathing, IC was measured via a pneumotachograph as recommended in the current guidelines (Miller et al., 2005; Rossi et al., 2015). In brief, following three constant tidal breaths, subjects were instructed to inspire deeply until total lung capacity starting at the end of the last expiratory manoeuvre. The preceding end‐expiratory lung volume (EELV) was taken as the anchor for the quantification of IC. PEEPi was quantified via an oesophageal pressure balloon (Model C76050U, Marquat Génie Biomédical, Boissy‐Saint‐Léger, France) and computed via a specialized pressure box (ICU‐Lab, KleisTEK Engineering, Bari, Italy) following previously published standards (Milic‐Emili, Mead, Turner, & Glauser, 1964). To account for volume drift due to a non‐perfectly calibrated flow transducer we performed a calibration towards the baseline value following the recommendations of the user manual (ICU‐Lab acquisition system, version 3.10), i.e. at the beginning of each visit prior to data acquisition, after a continuous operating time of 1 h and as soon as the pressure box has been moved. An overview over the visit schedule is given in Figure 2.
FIGURE 2.

Visit schedule with the sequence of dynamic hyperinflation with metronome‐paced tachypnoea (MPT) and expiratory resistance breathing (ERB) and outcome measurements. bpm, beats per minute; ERB, expiratory resistance breathing; I:E, inspiratory time :expiratory time; MPT, metronome‐paced tachypnoea
2.5. Sample size estimation and data analysis
Our study contained a continuous variable of matched pairs of subjects as the primary outcome measure. In a pilot study, the difference in the outcome measure of matched pairs showed a normal distribution. For these matched pairs, we calculated a sample size of 10 subjects in order to reject the null hypothesis with a probability of 0.9 (power). Type 1 error is 0.05 (level of significance). The number of subjects with incomplete data sets caused by technical problems or compliance during recording is estimated at four. Hence, we projected an overall sample size of 14 participants. These results were calculated using Stata software (StataCorp, College Station, TX, USA) and the ‘PS ‐ power and sample size’ program.
Descriptive statistics are expressed as means and 95% confidence intervals. To account for repeated measurements in individual subjects, we used robust standard errors. To compare the mean values between MPT and ERB, we used a generalized estimation equation with exchangeable correlation structure within the respective group. In case of drop‐out (because of technical reasons or adverse events, etc.), subjects were able to restart the intervention until cross‐over. In the case of a drop‐out after the cross‐over, subjects were excluded from the study. All parameters were analysed after anonymization by an investigator blinded for the breathing pattern.
The effects of ERB and MPT on respiratory mechanics were displayed by means of a Campbell diagram (Campbell, 1958). This was created by plotting mean oesophageal pressures against lung volumes under each of the six interventional conditions (i.e. ERB1, ‐2, ‐3; MPT1, ‐2, ‐3). Lung compliance was evaluated by the intersection line through the minimum and maximum lung volume of tidal breathing. Chest wall compliance was estimated to be 200 ml cmH2O−1 (Tobin, 1998). The intersection of the two pressure–volume relationships represents EELV during tidal breathing. DH is represented by the distance between the intersection of lung compliance and chest wall compliance with the respective pressure–volume cycle.
3. RESULTS
3.1. Study sample
Fourteen participants were enrolled in the study. The mean age was 27 ± 4 years and the mean BMI was 24 ± 2.3. None of the participants showed signs of airflow limitation on spirometry. Baseline anthropometrics and parameters of lung function are listed in Table 1. Each participant was randomized to one of the two intervention groups and all participants finalized the entire visit and were available for analysis.
TABLE 1.
Baseline anthropometrics and spirometry data of study participants
| Characteristic | Mean (95% CI) |
|---|---|
| Anthropometrics | |
| Age (years) | 27 (19–34) |
| Height (cm) | 181 (169–192) |
| Weight (kg) | 78 (61–96) |
| Spirometry | |
| FVC (%pred) | 5.55 (4.01–7.09) |
| FEV1 (%pred) | 4.63 (3.21–6.05) |
| FEV1 (%FVC) | 0.83 (0.72–0.95) |
n = 14. BMI, body mass index; FEV1, forced expiratory volume in 1 s; FVC, forced vital capacity; pred, predicted.
3.2. Efficacy of ERB for induction of DH
The mean PEEPi in subjects during tidal breathing amounted to 0.7 cmH2O. During ERB, we observed a significant stepwise increase of PEEPi with decreasing stenosis diameter from 11.2 (3 mm stenosis) to 22.3 (2 mm stenosis) and 33.4 cmH2O (1.5 mm stenosis). Similar results were found for IC, which amounted to 3.66 litres during tidal breathing and decreased significantly with ERB from 3.33 (3 mm stenosis) to 2.05 (2 mm stenosis) to 0.73 litres (1.5 mm stenosis). A detailed overview of changes in PEEPi and IC during ERB is given in Table 2.
TABLE 2.
Parameters of ventilation and dynamic hyperinflation during metronome‐paced tachypnoea and expiratory resistance breathing
| TB | MPT1 | MPT2 | MPT3 | ERB1 | ERB2 | ERB3 | |
|---|---|---|---|---|---|---|---|
| f R (beats min−1) |
14.7 (12.5–16.9) |
40.1 (39.6–40.7) |
40.8 (39.6–42.0) |
31.5 (29.5–33.5) |
30.3 (30.00–30.6) |
30.1 (29.8–30.5) |
30.1 (29.6–30.7) |
| P | <0.001 | <0.001 | <0.001 | <0.001 | <0.001 | < 0.001 | |
| V T (l) |
0.78 (0.58–0.97) |
0.75 (0.39–1.12) |
0.73 (0.45–1.02) |
0.83 (0.51–1.16) |
0.41 (0.34–0.48) |
0.33 (0.29–0.37) |
0.33 (0.21–0.45) |
| P | 0.825 | 0.592 | 0.534 | 0.001 | <0.001 | <0.001 | |
| (l min−1) |
10.4 (8.55–12.2) |
30.4 (15.3–45.3) |
39.7 (18.4–40.9) |
25.9 (16.0–35.9) |
12.5 (10.4–14.6) |
10.0 (8.81–11.1) |
9.9 (6.28–13.5) |
| P | 0.008 | 0.001 | 0.003 | 0.32 | 0.650 | 0.664 | |
| T i (s) |
1.92 (1.55–2.29) |
0.70 (0.67–0.73) |
0.56 (0.53–0.58) |
0.74 (0.71–0.77) |
0.48 (0.44–0.53) |
0.46 (0.43–0.50) |
0.48 (0.44–0.52) |
| P | <0.001 | <0.001 | <0.001 | <0.001 | <0.001 | <0.001 | |
| T e (s) |
2.59 (2.09–3.09) |
0.80 (0.77–0.83) |
0.92 (0.88–0.96) |
1.18 (1.11–1.25) |
1.51 (1.46–1.56) |
1.53 (1.50–1.56) |
1.52 (1.49–1.55) |
| P | <0.001 | <0.001 | <0.001 | <0.001 | <0.001 | 0.001 | |
| T i/T tot |
43.0 (41.1–44.8) |
0.47 (0.45–0.49) |
0.38 (0.36–0.40) |
0.39 (0.37–0.40) |
0.24 (0.22–0.27) |
0.23 (0.21–0.25) |
0.24 (0.22–0.26) |
| P | 0.002 | <0.001 | <0.001 | <0.001 | <0.001 | <0.001 | |
| T e/T tot |
57.2 (55.2–59.2) |
0.53 (0.52–0.55) |
0.62 (0.60–0.64) |
0.61 (0.60–0.63) |
0.76 (0.74–0.78) |
0.77 (0.75–0.79) |
0.76 (0.74–0.78) |
| P | 0.003 | <0.001 | 0.001 | <0.001 | <0.001 | <0.001 | |
| V T/T i (l s−1) |
0.40 (0.33–0.47) |
1.06 (0.59–1.53) |
1.30 (0.83–1.77) |
1.12 (0.70–1.54) |
0.89 (0.70–1.07) |
0.73 (0.62–0.84) |
0.70 (0.45–0.95) |
| P | 0.006 | 0.001 | 0.002 | <0.001 | <0.001 | 0.009 | |
| V T/T e (l s−1) |
0.30 (0.25–0.35) |
0.98 (0.45–1.51) |
0.80 (0.49–1.11) |
0.71 (0.43–0.98) |
0.27 (0.23–0.32) |
0.22 (0.19–0.24) |
0.22 (0.14–0.30) |
| P | 0.012 | 0.002 | 0.004 | 0.157 | 0.004 | 0.003 | |
| IRV (l) |
3.23 (2.54–3.91) |
3.27 (2.56–3.98) |
3.38 (2.77–3.98) |
3.38 (2.69–4.06) |
3.32 (2.28–4.36) |
1.82 (1.27–2.26) |
0.40 (0.94–0.70) |
| P | 0.911 | 0.680 | 0.700 | 0.754 | 0.004 | <0.001 | |
| IC (l) |
3.66 (3.45–3.88) |
3.43 (2.70–4.17) |
3.74 (2.65–4.82) |
3.82 (2.82–4.81) |
3.33 (1.75–4.91) |
2.05 (0.76–3.34) |
0.73 (0.12–1.58) |
| P | 0.001 | 0.482 | 0.184 | 0.368 | <0.001 | <0.001 | |
| PEF (l min−1) |
0.64 (0.53–0.75) |
1.05 (0.91–1.19) |
1.05 (0.87–1.22) |
1.00 (0.79–1.21) |
0.41 (0.35–0.48) |
0.37 (0.30–0.44) |
0.38 (0.29–0.48) |
| P | <0.001 | 0.001 | 0.010 | 0.003 | <0.001 | 0.001 | |
| ∆P oes (cmH20) |
32.9 (21.4–44.3) |
33.4 (24.5–41.3) |
33.6 (23.6–43.5) |
34.3 (23.8–44.8) |
39.2 (29.0–49.3) |
44.5 (35.6–53.5) |
47.4 (37.0–57.7) |
| P | 0.919 | 0.923 | 0.835 | 0.228 | 0.056 | 0.085 | |
| PTP (cmH2O s−1 m−1) |
155 (131–178) |
269 (187–351) |
253 (171–336) |
201 (125–277) |
248 (182–315) |
397 (326–467) |
547 (403–690) |
| P | 0.004 | 0.015 | 0.159 | 0.002 | <0.001 | <0.001 | |
| PEEPi (cmH2O) |
0.70 (0.50–0.80) |
1.90 (1.40–2.40) |
1.90 (0–5) |
1.10 (0–2.60) |
11.1 (7.0–15.2) |
22.3 (17.1–27.6) |
33.4 (3.40–63) |
| P | <0.001 | 0.003 | 0.012 | <0.001 | <0.001 | <0.001 |
Data are presented as means (95% CI); P‐values are calculated against tidal breathing. ERB, expiratory resistance breathing; f R, respiratory frequency; IC, inspiratory capacity; IRV, inspiratory reserve volume; MPT, metronome‐paced tachypnea; PEEPi, intrinsic positive end‐expiratory pressure; PEF, peak expiratory flow; ∆P oes, change in oesophageal pressure; PTP, oesophageal pressure time product; TB, tidal breathing; T e, expiratory time; T i, inspiratory time; T tot, total respiratory cycle time; , minute ventilation; V T, tidal volume.
3.3. Comparison between ERB‐ and MPT‐induced DH
One out of the three different MPT patterns (i.e. respiratory rate = 40 bpm, I:E ratio = 1:1) showed a significant reduction in IC compared to tidal breathing. A graphic illustration of subjects’ individual IC response to MPT and ERB is depicted in Figure 3a,b. Levels of PEEPi showed a significant increase during all three patterns of MPT. The PEEPi response with MPT was less pronounced compared to ERB as depicted via individual line charts in Figure 4a,b. For illustration purposes, an individual breath‐to‐breath curve of IC and PEEPi including the onset of inspiratory effort and inspiratory flow is plotted in Figure 5. One respiratory cycle during the MPT1 pattern is depicted in Figure 5a, and one respiratory cycle during the ERB1 pattern is depicted in supporting Figure 5b. The respective compliance curves of the lungs and chest wall are illustrated by plotting lung volumes against the corresponding oesophageal pressure (Figure 6).
FIGURE 3.

Line chart of individual dynamic changes in IC during hyperinflation by ERB (a) and MPT (b). ERB, expiratory resistance breathing; MPT, metronome‐paced tachypnoea; TB, tidal breathing
FIGURE 4.

Line chart of individual dynamic changes in PEEPi during hyperinflation by ERB (a) and MPT (b). ERB, expiratory resistance breathing; MPT, metronome‐paced tachypnoea; TB, tidal breathing
FIGURE 5.
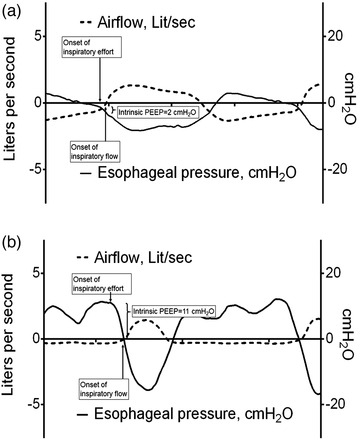
Sample of a study participant combining dynamic changes in airflow and oesophageal pressure during a respiratory cycle of MPT1 (a) and ERB1 (b). Dotted lines represent airflow (l s−1); continuous lines represent oesophageal pressure (cmH2O). PEEP, positive end‐expiratory pressure
FIGURE 6.

Illustration of mean lung compliance during spontaneous breathing, MPT and ERB by plotting mean lung volume against the corresponding oesophageal pressure (Campbell diagram). ERB, expiratory resistance breathing; MPT, metronome‐paced tachypnoea; TB, tidal breathing
3.4. Determinants of ERB‐induced dynamic hyperinflation
Multivariate linear regression analysis with anthropometric as well as baseline spirometric parameters as the independent variables during ERB revealed a significant association of PEEPi response to FVC (regression coefficient −2.798, P < 0.005) and FEV1/FVC (regression coefficient −3.653, P < 0.05), without significant associations to age, height and body weight. IC response was significantly positively associated with age (coeff. 0.030, P < 0.05), but not height, weight or spirometric determinants during ERB.
3.5. Safety results
There were no adverse events (neither serious nor severe) recorded during study‐related interventions and measurements. None of the participants had to discontinue the study visit due to subjective discomfort or objective safety reasons. Most participants perceived DH during ERB as a type of strenuous breathing comparable to intense endurance sports. In the group starting with MPT, data from two participants had to be excluded from the analysis due to technical problems with the flow transducer. These difficulties were identified by the investigators during subsequent off‐line analysis and were not perceived by the participants, nor did they cause them any adverse events.
4. DISCUSSION
In the present study, we established a novel model for the induction of DH. ERB substantially increased PEEPi and decreased IC in healthy participants. DH was much more pronounced during ERB compared to the established method of MPT. ERB is a safe and effective model to study pathophysiological mechanisms and test therapeutic interventions against DH.
4.1. Previous literature on induced DH
In our sample of healthy subjects, we observed significant changes of IC and PEEPi by all three airway stenoses applied. One of the first studies to modify IC via respiratory rate was Gelb et al. (2004). The authors investigated the effects of ventilation at doubled resting respiratory rate in patients with COPD and observed a mean decrease in IC of 400 ml, indicative of DH. Weigt et al. (2008) established a standardized application of the same approach by predetermining respiratory rates of 20, 30 and 40 bpm. They observed stepwise decreases in IC and suggested this so‐called MPT as a useful method to test DH in patients with COPD. Cooper et al. (2014) further elaborated this concept by including predefined I:E ratios in their MPT protocol. This study identified expiratory time as the most important determinant of DH. Data by van Leuteren et al. (2018) revealed a significant MPT‐mediated IC reduction, but no association to physical activity in patients with COPD was found. The authors claimed a more reliable method for the induction of DH. None of the above‐mentioned studies conducted measurements of PEEPi for a more appropriate characterization of DH during MPT. In contrast, our model of DH was validated by the gold standard of DH measurement, i.e. PEEPi. PEEPi can be measured by different techniques depending on study subjects and the underlying circumstances. In mechanically ventilated patients, an end‐expiratory hold manoeuvre is used to quantify PEEPi (Brochard, 2002; Perchiazzi, Rylander, Pellegrini, Larsson, & Hedenstierna, 2017). However, the prerequisites for this approach are deep sedation, absence of spontaneous breathing and controlled mechanical ventilation. In non‐sedated spontaneously breathing subjects, measurement of PEEPi requires the application of an oesophageal balloon, as in our study sample. A substantial difference between the two approaches is that end‐expiratory hold manoeuvre yields static PEEPi, whereas oesophageal pressure measurement results in dynamic PEEPi. Simultaneous comparison of the two techniques showed that static PEEPi exceeded dynamic PEEPi to a substantial amount in COPD patients under mechanical ventilation (Petrof, Legare, Goldberg, Milic‐Emili, & Gottfried, 1990). However, when investigating patients without airflow limitation, a subsequent study revealed a negligible difference between the two techniques (Maltais et al., 1994). Hence, in our spontaneously breathing participants, a rather modest difference between static and dynamic PEEPi can be assumed (Zakynthinos, Vassilakopoulos, Zakynthinos, Mavrommatis, & Roussos, 2000).
We observed a significant reduction of IC during ERB2 and ERB3 with 2.05 and 0.73 litres, respectively. A study investigating over 400 patients with COPD revealed a mean IC at rest between 1.9 and 2.5 litres depending on the severity of airflow limitation. During exercise IC was reduced at 1.45 to 2.25 litres (O'Donnell, Guenette, Maltais, & Webb, 2012). The increase in PEEPi during ERB was similar, ranging from 11.1 (ERB1) to 22.3 (ERB2) and 33.4 cmH2O (ERB3). Data by Tschernko et al. (1997) and colleagues found resting PEEPi levels of 5 cmH2O in COPD, which increased to 12.3 cmH2O during exercise. Patients during acute exacerbation of COPD showed a PEEPi of up to 20 cmH2O during sedation and mechanical ventilation (Ranieri, Dambrosio, & Brienza, 1996). In summary, the amount of hyperinflation through our ERB model is comparable to various clinical scenarios of COPD with ERB3 even exceeding the PEEPi reported patients with irreversible airflow limitation.
A visual integration of DH and work of breathing during tidal breathing, MPT and ERB is depicted via the Campbell diagram in Figure 6. Briefly, the area between the dashed and the continuous line indicates the work against the elastic forces of the chest wall and the lungs. The part of the pressure–volume curve left of the dashed line shows the work required to overcome resistance. Relaxation volume, where recoil pressure of the chest wall and the lungs is equivalent, is located at the intersection of the dashed line (lung compliance) and continuous line (chest wall compliance). The vertical distance of the lower margin of the respective cycles to the intersection represents elevated EELV indicative of DH, which increases stepwise from tidal breathing to ERB1, ERB2 and ERB3. The horizontal distance at the lower arc of the cycles (from right to left side) illustrates the change in pleural pressure generated by inspiratory muscles. With increasing PEEPi, higher work of breathing has to be provided before the onset of inspiratory flow. The dynamic changes of the pressure–volume curve from tidal breathing to ERB1, ERB2 and ERB3 are comparable to previous data from patients with COPD illustrated via the Campbell diagram (Chen, Li, Zheng, Luo, & Chen, 2016). Especially the resistive work of breathing is substantially increased during ERB as is the case in rapidly breathing patients with COPD (Loring, Garcia‐Jacques, & Malhotra, 2009). In a distinct form, this results in ineffective or wasted effort of inspiration as previously identified in patients with COPD during DH (Vassilakopoulos, 2008).
In the present study, we enrolled exclusively healthy subjects. The study by Cooper et al., (2014) was the first to identify DH in healthy participants. The amount of IC reduction was much lower in healthy subjects compared to COPD patients. However, a direct comparison between the two study groups was methodologically imprecise due to a substantially lower age in the healthy group. Similarly, the effects of MPT on IC were modest in our sample and the reduction of IC was much more pronounced during ERB compared to MPT. Two previously published experimental studies by Cheyne et al. investigated cardiopulmonary interaction during DH (Cheyne, Williams, Harper, & Eves, 2016, 2017). The authors induced DH by inspiratory as well as expiratory restrictive loading in healthy subjects. They observed a reduction in IC comparable to our ERB model. During resistive loading participants revealed significant increases in oesophageal pressure (Cheyne et al., 2016). However, with up to 7.5 cmH2O, these effects were much lower compared to the observations in the present study.
4.2. Mechanisms of dynamic hyperinflation
The differences of pulmonary mechanics during forced respiration between healthy subjects and patients with COPD are predominantly determined by airflow limitation. In healthy lungs, tidal volume along with respiratory rate increases in consequence of physical exercise (Henke, Sharratt, Pegelow, & Dempsey, 1988). In the presence of airflow limitation and reduced elastic recoil, as in patients with COPD, the time needed for passive deflation of the lungs is substantially prolonged. Hence, parts of the potentially removable gas remain in the lungs resulting in increased EELV (Gagnon et al., 2014; Rossi et al., 2015). Increased EELV during forced respiration can be measured indirectly by means of pneumotachographic assessment of IC. IC measurement is a non‐invasive and easily conducted method and hence widely used in clinical practice (Rossi et al., 2015). In our sample of healthy subjects, IC response to ERB was associated with age, but not with parameters of airflow limitation. The accurate assessment of DH via pressure measurement in spontaneously breathing subjects, however, requires the application of an oesophageal balloon (Akoumianaki et al., 2014). Its widespread use is hampered by a high technical effort and the need for experienced investigators. In our data, we observed a good conformity between IC and PEEPi during ERB. However, PEEPi, but not IC, was significantly negatively associated with FEV1/FVC as a marker for airflow limitation during ERB. Yan & Kayser (1997) conducted an evaluation of IC measurement via PEEPi quantification by an oesophageal balloon. These data identified IC as a reliable proxy for DH at least for the application in clinical practice.
The induction of DH via expiratory flow limitation has been studied extensively by means of a Starling resistor. Numerous studies revealed a valid and reproducible hyperinflation verified by increased intrathoracic pressures and compromised ventilation in healthy subjects (Aliverti et al., 2002, 2005; Iandelli et al., 2002; Kayser, Sliwinski, Yan, Tobiasz, & Macklem, 1997; Rolland‐Debord, Morelot‐Panzini, Similowski, Duranti, & Laveneziana, 2017). However, we sought to establish a technically less demanding, yet valid and reliable, approach for the induction of DH in clinical routine. Further, the application of the Starling resistor might be compromised by non‐linear and difficult to control flow rates, especially during higher pressure gradients for the simulation of severe airflow limitation (Jan, Kamm, & Shapiro, 1983; Jordanoglou & Pride, 1968; Mead, Turner, Macklem, & Little, 1967). In summary, our model might represent an easily applicable way to induce DH with constant flow rates even during high‐grade expiratory flow limitation.
A potentially relevant mechanism for the interpretation of DH via PEEPi might be confounding through abdominal muscle recruitment. The available literature on this topic covers the electromyographic assessment of abdominal muscle activity during the respiratory cycle in patients with COPD (Ninane, Rypens, Yernault, & De Troyer, 1992). The authors indicated that the evaluation of PEEPi during expiration could lead to an overestimation of DH. We did not conduct an electromyographic evaluation of abdominal muscle activity in our study. However, data by Laveneziana, Webb, Wadell, Neder, & O'Donnell (2014) demonstrated that muscle activation during expiration does not substantially influence DH quantified by EELV. In our study, we found a consistent deviation of lung volumes and pressures during ERB, indicating the presence of DH without relevant confounding by abdominal muscles.
4.3. Consequences of dynamic hyperinflation
The pathophysiological consequences of DH comprise various effects within and beyond the respiratory system which are accountable for several clinically relevant comorbidities in COPD. During inspiration from an increased EELV, respiratory muscles are required to overcome PEEPi in order to generate the pressure gradient accountable for inspiratory flow. This muscular work spent to overcome PEEPi represents a major determinant of increased work of breathing in patients with COPD (Sliwinski, Kaminski, Zielinski, & Yan, 1998). The simulation of this concept is clearly depicted in the Campbell diagram (Figure 6) of our healthy participants. From spontaneous breathing to each of the three ERB models, there is a substantial stepwise increase in the pressure gradient required to generate a corresponding volume change. The amount of increased work of breathing is depicted by the area between the intersection points of the respiratory cycle with the compliance curves of the lung and the chest wall.
Especially, the interrelation of hyperinflated lungs with the heart has gained particular clinical relevance over the past years (Alter et al., 2018; Hohlfeld et al., 2018). The effects of induced DH on the heart were elaborated by Cheyne and co‐workers. In a recent publication, they were able to reduce stroke volume of the left ventricle via hyperinflation of healthy participants and counted direct ventricular interdependence as a key mechanisms for this cardiopulmonary interaction (Cheyne et al., 2016; Cheyne, Gelinas, & Eves, 2018). In short, there is a plethora of clinically important consequences of DH, which emphasizes the relevance of appropriate models to study DH under controlled conditions.
4.4. Strengths and limitations of this study
A strength of the present study is the application of an oesophageal balloon during the induction of DH. Our method of ERB represents the first model for DH validated via invasive quantification of PEEPi. In the course of the study, we faced some technical problems with the flow transducer of the pneumotachograph, which led to the exclusion of IC values from two participants. However, the remaining data had sufficient power to show significant DH and the corresponding PEEPi values underline this interpretation. The detailed investigation of ventilatory parameters (e.g. respiratory rate, inspiratory and expiratory time) as listed in Table 2 indicated that participants were able to accurately reproduce the scheduled breathing pattern during ERB. IC measurements were conducted at the end of each 60 s cycle with the preceding EELV as the anchor. The anticipation of an upcoming IC manoeuvre might confound the participant's tidal breathing. However, the instruction for IC manoeuvres was given immediately when inspiration was scheduled to minimize a potential confounder by participant anticipation. The evaluation of the within‐subject trial‐to‐trial variability would have been expedient in terms of the validation of ERB. However, the scheduled comparison between MPT and ERB required in six different cycles of hyperinflation per participant and the repeated conduct of each cycle would not have been intolerable in a single study visit. Similarly, we did not test ERB in different postures, which represents an important task for future studies on ERB. A potential static hyperinflation in our study participants was not evaluated via plethysmography prior to enrolment. However, participants were apparently healthy and airflow limitation was ruled out via spirometry. The external validity and applicability of our findings in patients with airflow limitation might be limited. Hence, subsequent studies to investigate the use of ERB in patients with COPD are required. Moreover, we did not test potential interventions to reduce DH induced by ERB, like, for example, helium breathing. Based on our findings, ERB might be a suitable model for interventional studies to test the reversibility of induced DH in healthy subjects. We enrolled only male participants in this study. First, women were shown to perceive more dyspnoea and less exercise tolerance at comparable amounts of airflow limitation (Martinez et al., 2007). Second, men are more prone to emphysema‐related hyperinflation compared to women (Halbert et al., 2006). We did not measure respiratory sensation by Borg scale or visual analogue scale during the application of ERB. However, our novel approach to inducing DH could be applied to investigate the association of respiratory mechanics to the perception of dyspnoea. For practical reasons we decided against monitoring of vital functions other than respiration during the study procedure. Therefore, changes in haemodynamics and gas exchange cannot be excluded.
5. CONCLUSION
We established ERB as a safe and efficacious model for the simulation of DH in healthy subjects. We observed significant increases in PEEPi and corresponding decreases in IC. DH by ERB was significantly higher than by MPT. ERB is a tool to study DH in healthy lungs isolated from confounding factors as present in COPD. No adverse events were observed during ERB. A potential application of ERB to safely investigate the effects of DH on cardiopulmonary interaction in healthy subjects as well as the safety and efficacy of ERB in patients with COPD should be tested in subsequent studies.
COMPETING INTERESTS
M.U. received grants from Nycomed Pharma as well as personal fees from Astra‐Zeneca and Böhringer Ingelheim. I.S. received personal fees for lectures from Astra‐Zeneca, AOP, Orphan, Böhringer‐Ingelheim and Chiesi. A.K.M., E.M. and E.G.S. have no conflicts of interest to declare. G.C.F. reports grants from Nycomed Pharma and personal fees from Astra‐Zeneca, Böhringer‐Ingelheim and Chiesi. O.C.B. received unrestricted research grants from public governmental federal institutions and from pharma industry (Menarini, Böhringer‐Ingelheim, Chiesi, GSK, Pfizer, TEVA, Astra‐Zeneca Air Liquide, MSD) as a member of the Ludwig Boltzmann Institute for COPD and Respiratory Epidemiology for the Austrian LEAD Study. He received personal fees for lecture and as member of advisory boards from Roche, Takeda, Nycomed and Astra‐Zeneca.
AUTHOR CONTRIBUTIONS
The experiments of this study were conducted at the lung function laboratory of the Department for Respiratory and Critical Care Medicine, Otto Wagner Hospital, Vienna.G.C.F., M.H.U., A.K.M. and I.S. designed the study. G.C.F., M.H.U., A.K.M., E.G.S. and E.M. conducted the experiments and collected the data. G.C.F., M.H.U., A.K.M., I.S., E.M., E.G.S. and O.C.B. analysed and interpreted the data. G.C.F., M.H.U., A.K.M. and I.S. drafted the work. G.C.F., M.H.U., A.K.M., I.S., E.M., E.G.S. and O.C.B. revised the manuscript for intellectual content. All authors have read and approved the final version of this manuscript and agree to be accountable for all aspects of the work in ensuring that questions related to the accuracy or integrity of any part of the work are appropriately investigated and resolved. All persons designated as authors qualify for authorship, and all those who qualify for authorship are listed.
ACKNOWLEDGEMENTS
The authors like to thank the staff of the Otto Wagner hospital outpatient clinic for their support during the conduction of the study. This study was supported by the ‘Verein zur Forschung in der Pneumologie und Intensivmedizin’, Vienna, Austria.
Urban MH, Mayr AK, Schmidt I, et al. Induction of dynamic hyperinflation by expiratory resistance breathing in healthy subjects – an efficacy and safety study. Experimental Physiology. 2021;106:532–543. 10.1113/EP088439
Edited by: Andrew Sheel
Funding information
No grants or material support was obtained for the conduct of this study.
DATA AVAILABILITY STATEMENT
The data that support the findings of this study are available from the corresponding author upon reasonable request.
REFERENCES
- Aalstad, L. T. , Hardie, J. A. , Espehaug, B. , Thorsen, E. , Bakke, P. S. , Eagan, T. M. L. , & Frisk, B. (2018). Lung hyperinflation and functional exercise capacity in patients with COPD – a three‐year longitudinal study. BMC Pulmonary Medicine, 18, 187. [DOI] [PMC free article] [PubMed] [Google Scholar]
- Akoumianaki, E. , Maggiore, S. M. , Valenza, F. , Bellani, G. , Jubran, A. , Loring, S. H. , & Group, P. W. (2014). The application of esophageal pressure measurement in patients with respiratory failure. American Journal of Respiratory and Critical Care Medicine, 189, 520–531. [DOI] [PubMed] [Google Scholar]
- Aliverti, A. , Dellaca, R. L. , Lotti, P. , Bertini, S. , Duranti, R. , Scano, G. , & Macklem, P. T. (2005). Influence of expiratory flow‐limitation during exercise on systemic oxygen delivery in humans. European Journal of Applied Physiology, 95, 229–242. [DOI] [PubMed] [Google Scholar]
- Aliverti, A. , Iandelli, I. , Duranti, R. , Cala, S. J. , Kayser, B. , Kelly, S. , & Macklem, P. T. (2002). Respiratory muscle dynamics and control during exercise with externally imposed expiratory flow limitation. Journal of Applied Physiology, 92, 1953–1963. [DOI] [PubMed] [Google Scholar]
- Alter, P. , Jorres, R. A. , Watz, H. , Welte, T. , Glaser, S. , Schulz, H. , & Vogelmeier, C. F. (2018). Left ventricular volume and wall stress are linked to lung function impairment in COPD. International Journal of Cardiology, 261, 172–178. [DOI] [PubMed] [Google Scholar]
- Barbera, J. A. , & Blanco, I. (2009). Pulmonary hypertension in patients with chronic obstructive pulmonary disease: Advances in pathophysiology and management. Drugs, 69, 1153–1171. [DOI] [PubMed] [Google Scholar]
- Barr, R. G. , Bluemke, D. A. , Ahmed, F. S. , Carr, J. J. , Enright, P. L. , Hoffman, E. A. , & Watson, K. E. (2010). Percent emphysema, airflow obstruction, and impaired left ventricular filling. New England Journal of Medicine, 362, 217–227. [DOI] [PMC free article] [PubMed] [Google Scholar]
- Benditt, J. O. (2005). Esophageal and gastric pressure measurements. Respiratory Care, 50, 68–75; discussion 75–77. [PubMed] [Google Scholar]
- Brochard, L. (2002). Intrinsic (or auto‐) PEEP during controlled mechanical ventilation. Intensive Care Medicine, 28, 1376–1378. [DOI] [PubMed] [Google Scholar]
- Campbell, E. J. M. (1958). The Respiratory Muscles and the Mechanics of Breathing. London: Lloyd‐Luke Ltd. [Google Scholar]
- Casanova, C. , Cote, C. , de Torres, J. P. , Aguirre‐Jaime, A. , Marin, J. M. , Pinto‐Plata, V. , & Celli, B. R. (2005). Inspiratory‐to‐total lung capacity ratio predicts mortality in patients with chronic obstructive pulmonary disease. American Journal of Respiratory and Critical Care Medicine, 171, 591–597. [DOI] [PubMed] [Google Scholar]
- Chen, S. , Li, Y. , Zheng, Z. , Luo, Q. , & Chen, R. (2016). The analysis of components that lead to increased work of breathing in chronic obstructive pulmonary disease patients. Journal of Thoracic Disease, 8, 2212–2218. [DOI] [PMC free article] [PubMed] [Google Scholar]
- Cheyne, W. S. , Gelinas, J. C. , & Eves, N. D. (2018). Hemodynamic effects of incremental lung hyperinflation. American Journal of Physiology. Heart and Circulatory Physiology, 315, H474–H481. [DOI] [PubMed] [Google Scholar]
- Cheyne, W. S. , Williams, A. M. , Harper, M. I. , & Eves, N. D. (2016). Heart‐lung interaction in a model of COPD: Importance of lung volume and direct ventricular interaction. American Journal of Physiology. Heart and Circulatory Physiology, 311, H1367–H1374. [DOI] [PMC free article] [PubMed] [Google Scholar]
- Cheyne, W. S. , Williams, A. M. , Harper, M. I. , & Eves, N. D. (2017). Acute volume loading exacerbates direct ventricular interaction in a model of COPD. Journal of Applied Physiology, 123, 1110–1117. [DOI] [PMC free article] [PubMed] [Google Scholar]
- Cooper, C. B. (2006). The connection between chronic obstructive pulmonary disease symptoms and hyperinflation and its impact on exercise and function. American Journal of Medicine, 119, 21–31. [DOI] [PubMed] [Google Scholar]
- Cooper, C. B. , Calligaro, G. L. , Quinn, M. M. , Eshaghian, P. , Coskun, F. , Abrazado, M. , & Raine, R. I. (2014). Determinants of dynamic hyperinflation during metronome‐paced tachypnea in COPD and normal subjects. Respiratory Physiology & Neurobiology, 190, 76–80. [DOI] [PubMed] [Google Scholar]
- Gagnon, P. , Guenette, J. A. , Langer, D. , Laviolette, L. , Mainguy, V. , Maltais, F. , & Saey, D. (2014). Pathogenesis of hyperinflation in chronic obstructive pulmonary disease. International Journal of Chronic Obstructive Pulmonary Disease, 9, 187–201. [DOI] [PMC free article] [PubMed] [Google Scholar]
- Gelb, A. F. , Gutierrez, C. A. , Weisman, I. M. , Newsom, R. , Taylor, C. F. , & Zamel, N. (2004). Simplified detection of dynamic hyperinflation. Chest, 126, 1855–1860. [DOI] [PubMed] [Google Scholar]
- Halbert, R. J. , Natoli, J. L. , Gano, A. , Badamgarav, E. , Buist, A. S. , & Mannino, D. M. (2006). Global burden of COPD: Systematic review and meta‐analysis. European Respiratory Journal, 28, 523–532. [DOI] [PubMed] [Google Scholar]
- Henke, K. G. , Sharratt, M. , Pegelow, D. , & Dempsey, J. A. (1988). Regulation of end‐expiratory lung volume during exercise. Journal of Applied Physiology, 64, 135–146. [DOI] [PubMed] [Google Scholar]
- Hohlfeld, J. M. , Vogel‐Claussen, J. , Biller, H. , Berliner, D. , Berschneider, K. , Tillmann, H. C. , & Welte, T. (2018). Effect of lung deflation with indacaterol plus glycopyrronium on ventricular filling in patients with hyperinflation and COPD (CLAIM): A double‐blind, randomised, crossover, placebo‐controlled, single‐centre trial. The Lancet. Respiratory Medicine, 6, 368–378. [DOI] [PubMed] [Google Scholar]
- Hueper, K. , Vogel‐Claussen, J. , Parikh, M. A. , Austin, J. H. , Bluemke, D. A. , Carr, J. , & Barr, R. G. (2015). Pulmonary microvascular blood flow in mild chronic obstructive pulmonary disease and emphysema. The MESA COPD study. American Journal of Respiratory and Critical Care Medicine, 192, 570–580. [DOI] [PMC free article] [PubMed] [Google Scholar]
- Iandelli, I. , Aliverti, A. , Kayser, B. , Dellaca, R. , Cala, S. J. , Duranti, R. , & Pedotti, A. (2002). Determinants of exercise performance in normal men with externally imposed expiratory flow limitation. Journal of Applied Physiology, 92, 1943–1952. [DOI] [PubMed] [Google Scholar]
- Jan, D. L. , Kamm, R. D. , & Shapiro, A. H. (1983). Filling of partially collapsed compliant tubes. Journal of Biomechanical Engineering, 105, 12–19. [DOI] [PubMed] [Google Scholar]
- Jordanoglou, J. , & Pride, N. B. (1968). Factors determining maximum inspiratory flow and maximum expiratory flow of the lung. Thorax, 23, 33–37. [DOI] [PMC free article] [PubMed] [Google Scholar]
- Kayser, B. , Sliwinski, P. , Yan, S. , Tobiasz, M. , & Macklem, P. T. (1997). Respiratory effort sensation during exercise with induced expiratory‐flow limitation in healthy humans. Journal of Applied Physiology, 83, 936–947. [DOI] [PubMed] [Google Scholar]
- Klooster, K. , ten Hacken, N. H. , Hartman, J. E. , Sciurba, F. C. , Kerstjens, H. A. , & Slebos, D. J. (2015). Determining the role of dynamic hyperinflation in patients with severe chronic obstructive pulmonary disease. Respiration, 90, 306–313. [DOI] [PubMed] [Google Scholar]
- Laveneziana, P. , Webb, K. A. , Wadell, K. , Neder, J. A. , & O'Donnell, D. E. (2014). Does expiratory muscle activity influence dynamic hyperinflation and exertional dyspnea in COPD? Respiratory Physiology & Neurobiology, 199, 24–33. [DOI] [PubMed] [Google Scholar]
- Liebow, A. A. (1959). Pulmonary emphysema with special reference to vascular changes. American Review of Respiratory Disease, 80, 67–93. [DOI] [PubMed] [Google Scholar]
- Lopez‐Sanchez, M. , Munoz‐Esquerre, M. , Huertas, D. , Gonzalez‐Costello, J. , Ribas, J. , Manresa, F. , & Santos, S. (2013). High prevalence of left ventricle diastolic dysfunction in severe COPD associated with a low exercise capacity: A cross‐sectional study. PLoS One, 8, e68034. [DOI] [PMC free article] [PubMed] [Google Scholar]
- Loring, S. H. , Garcia‐Jacques, M. , & Malhotra, A. (2009). Pulmonary characteristics in COPD and mechanisms of increased work of breathing. Journal of Applied Physiology, 107, 309–314. [DOI] [PMC free article] [PubMed] [Google Scholar]
- Maltais, F. , Reissmann, H. , Navalesi, P. , Hernandez, P. , Gursahaney, A. , Ranieri, V. M. , & Gottfried, S. B. (1994). Comparison of static and dynamic measurements of intrinsic PEEP in mechanically ventilated patients. American Journal of Respiratory and Critical Care Medicine, 150, 1318–1324. [DOI] [PubMed] [Google Scholar]
- Martinez, F. J. , Curtis, J. L. , Sciurba, F. , Mumford, J. , Giardino, N. D. , Weinmann, G. , … Wise, R. ; National Emphysema Treatment Trial Research Group (2007) Sex differences in severe pulmonary emphysema. American Journal of Respiratory and Critical Care Medicine, 176, 243–252. [DOI] [PMC free article] [PubMed] [Google Scholar]
- Mead, J. , Turner, J. M. , Macklem, P. T. , & Little, J. B. (1967). Significance of the relationship between lung recoil and maximum expiratory flow. Journal of Applied Physiology, 22, 95–108. [DOI] [PubMed] [Google Scholar]
- Milic‐Emili, J. , Mead, J. , Turner, J. M. , & Glauser, E. M. (1964). Improved technique for estimating pleural pressure from esophageal balloons. Journal of Applied Physiology, 19, 207–211. [DOI] [PubMed] [Google Scholar]
- Miller, M. R. , Hankinson, J. , Brusasco, V. , Burgos, F. , Casaburi, R. , Coates, A. , & Force, A. E. T. (2005). Standardisation of spirometry. European Respiratory Journal, 26, 319–338. [DOI] [PubMed] [Google Scholar]
- Nakagawa, M. , Hattori, N. , Haruta, Y. , Sugiyama, A. , Iwamoto, H. , Ishikawa, N. , & Kohno, N. (2015). Effect of increasing respiratory rate on airway resistance and reactance in COPD patients. Respirology, 20, 87–94. [DOI] [PubMed] [Google Scholar]
- Ninane, V. , Rypens, F. , Yernault, J. C. , & De Troyer, A. (1992). Abdominal muscle use during breathing in patients with chronic airflow obstruction. American Review of Respiratory Disease, 146, 16–21. [DOI] [PubMed] [Google Scholar]
- O'Donnell, D. E. , Guenette, J. A. , Maltais, F. , & Webb, K. A. (2012). Decline of resting inspiratory capacity in COPD: The impact on breathing pattern, dyspnea, and ventilatory capacity during exercise. Chest, 141, 753–762. [DOI] [PubMed] [Google Scholar]
- Perchiazzi, G. , Rylander, C. , Pellegrini, M. , Larsson, A. , & Hedenstierna, G. (2017). Monitoring of total positive end‐expiratory pressure during mechanical ventilation by artificial neural networks. Journal of Clinical Monitoring and Computing, 31, 551–559. [DOI] [PubMed] [Google Scholar]
- Petrof, B. J. , Legare, M. , Goldberg, P. , Milic‐Emili, J. , & Gottfried, S. B. (1990). Continuous positive airway pressure reduces work of breathing and dyspnea during weaning from mechanical ventilation in severe chronic obstructive pulmonary disease. American Review of Respiratory Disease, 141, 281–289. [DOI] [PubMed] [Google Scholar]
- Quanjer, P. H. , Tammeling, G. J. , Cotes, J. E. , Pedersen, O. F. , Peslin, R. , & Yernault, J. C. (1993). Lung volumes and forced ventilatory flows. European Respiratory Journal, 6(Suppl 16), 5–40. [DOI] [PubMed] [Google Scholar]
- Ranieri, V. M. , Dambrosio, M. , & Brienza, N. (1996). Intrinsic PEEP and cardiopulmonary interaction in patients with COPD and acute ventilatory failure. European Respiratory Journal, 9, 1283–1292. [DOI] [PubMed] [Google Scholar]
- Rolland‐Debord, C. , Morelot‐Panzini, C. , Similowski, T. , Duranti, R. , & Laveneziana, P. (2017). Effects of non‐fatiguing respiratory muscle loading induced by expiratory flow limitation during strenuous incremental cycle exercise on metabolic stress and circulating natural killer cells. Pflugers Archiv. European Journal of Physiology, 469, 1533–1544. [DOI] [PubMed] [Google Scholar]
- Rossi, A. , Aisanov, Z. , Avdeev, S. , Di Maria, G. , Donner, C. F. , Izquierdo, J. L. , & Miravitlles, M. (2015). Mechanisms, assessment and therapeutic implications of lung hyperinflation in COPD. Respiratory Medicine, 109, 785–802. [DOI] [PubMed] [Google Scholar]
- Sliwinski, P. , Kaminski, D. , Zielinski, J. , & Yan, S. (1998). Partitioning of the elastic work of inspiration in patients with COPD during exercise. European Respiratory Journal, 11, 416–421. [DOI] [PubMed] [Google Scholar]
- Sode, B. F. , Dahl, M. , & Nordestgaard, B. G. (2011). Myocardial infarction and other co‐morbidities in patients with chronic obstructive pulmonary disease: A Danish nationwide study of 7.4 million individuals. European Heart Journal, 32, 2365–2375. [DOI] [PubMed] [Google Scholar]
- Tobin, M. J. (1998). Principles and Practice of Intensive Care Monitoring. New York: McGraw‐Hill. [Google Scholar]
- Tschernko, E. M. , Wisser, W. , Wanke, T. , Rajek, M. A. , Kritzinger, M. , Lahrmann, H. , & Klepetko, W. (1997). Changes in ventilatory mechanics and diaphragmatic function after lung volume reduction surgery in patients with COPD. Thorax, 52, 545–550. [DOI] [PMC free article] [PubMed] [Google Scholar]
- van Leuteren, R. W. , Dijkhuis, S. , de Jongh, F. H. C. , van der Valk, P. , Tabak, M. , & Brusse‐Keizer, M. G. J. (2018). The Mozart study: A relation between dynamic hyperinflation and physical activity in patients with chronic obstructive pulmonary disease? Clinical Physiology and Functional Imaging, 38, 409–415. [DOI] [PubMed] [Google Scholar]
- Vanfleteren, L. E. , Spruit, M. A. , Groenen, M. , Gaffron, S. , van Empel, V. P. , Bruijnzeel, P. L. , & Franssen, F. M. (2013). Clusters of comorbidities based on validated objective measurements and systemic inflammation in patients with chronic obstructive pulmonary disease. American Journal of Respiratory and Critical Care Medicine, 187, 728–735. [DOI] [PubMed] [Google Scholar]
- Vassilakopoulos, T. (2008). Understanding wasted/ineffective efforts in mechanically ventilated COPD patients using the Campbell diagram. Intensive Care Medicine, 34, 1336–1339. [DOI] [PubMed] [Google Scholar]
- Weigt, S. S. , Abrazado, M. , Kleerup, E. C. , Tashkin, D. P. , & Cooper, C. B. (2008). Time course and degree of hyperinflation with metronome‐paced tachypnea in COPD patients. COPD, 5, 298–304. [DOI] [PubMed] [Google Scholar]
- Yan, S. , & Kayser, B. (1997). Differential inspiratory muscle pressure contributions to breathing during dynamic hyperinflation. American Journal of Respiratory and Critical Care Medicine, 156, 497–503. [DOI] [PubMed] [Google Scholar]
- Zakynthinos, S. G. , Vassilakopoulos, T. , Zakynthinos, E. , Mavrommatis, A. , & Roussos, C. (2000). Contribution of expiratory muscle pressure to dynamic intrinsic positive end‐expiratory pressure: Validation using the Campbell diagram. American Journal of Respiratory and Critical Care Medicine, 162, 1633–1640. [DOI] [PubMed] [Google Scholar]
Associated Data
This section collects any data citations, data availability statements, or supplementary materials included in this article.
Data Availability Statement
The data that support the findings of this study are available from the corresponding author upon reasonable request.