

Abstract
Objective:
To examine whether differences in eating disorder symptoms exist between women who are varsity athletes, club athletes, independent exercisers, and nonexercisers and to determine whether sports anxiety moderates any observed between-group effects.
Method:
Two hundred seventy four female undergraduates completed the eating disorders inventory and the physical activity and sport anxiety scale and reported their exercise habits.
Results:
Women who participated in sports tended to have higher levels of eating disorder symptomatology than those who did not. Higher levels of sports anxiety were predictive of higher levels of bulimic symptoms and drive for thinness. Finally, the interaction of sports anxiety and level of athletic participation significantly predicted body dissatisfaction and bulimic symptoms.
Conclusion:
Coaches and clinicians should be aware that athletes experience higher rates of eating disorder symptoms than nonathletes. Moreover, sports anxiety should be considered as a possible target of therapy among athletes.
Keywords: eating disorder, althetes, exercise, bulimia, drive for thinness, body dissatisfaction
Introduction
Women’s participation in sports has substantially grown over the past 30 years.1 This growth has been accompanied by concerns about health risks, such as eating disorders symptoms, among female athletes. It is clear that women, whether they participate in sports or not, are at greater risk for disordered eating than men.2 It is less clear whether that risk is heightened by sports participation. Some data suggest that sports participation protects women from eating disorders,3 but a meta-analysis indicates that, overall, athletic participation among women is associated with an increased risk for disordered eating.4 Moreover, collegiate athletes tend to exhibit higher rates of anorexic and bulimic symptoms5 and disordered eating behaviors6 when compared with controls.
Available data does not clearly speak to the causal relationship between sports participation and eating disorder symptoms among women. It is possible that women with subthreshold eating disorder symptoms experience an increase in symptom severity upon participation in competitive sports. Sundgot-Borgen7 reported that as an athlete’s competitive level increases, her risk of developing symptoms increases, whereas Fulkerson et al.8 proposed that some female athletes may not engage in disordered eating behaviors until they have focused specifically on one sport at an intense level. Thus, it is possible that athletic participation at lower levels of competition (i.e., those exercise independently for reasons of recreation and/or maintaining good health) may be at lower risk for the development of eating disorder symptoms compared to those who compete at elite levels. In support of this, some have suggested that the risk for eating disorders among competitive female athletes may be due to unique pressures associated with sport participation, comments made by coaches, and the social pressures in athletic environments.2,9,10
The pressures faced by competitive female athletes may create sports-specific anxiety in those vulnerable to the development of anxiety symptoms. Research has demonstrated that generalized social anxiety and social evaluative fears in athletic situations are positively correlated, especially among women.11,12 Accordingly, Norton et al.13 hypothesized that high levels of sports and physical activity anxiety would predict avoidance of exercise among nonathletes, whereas Martens et al.14 demonstrated that as one’s anxiety level increases, her sports’ performance typically decreases. To our knowledge, however, no one has directly explored whether sports anxiety elevates risk for eating disorder symptoms.
This study examined two potential risk factors for eating disorder symptoms among female athletes: level of competition in athletic participation (i.e., collegiate varsity athlete, club athlete, independent exerciser, or nonexerciser) and level of sports anxiety (i.e., anxiety about physical activity and/or sports). Specifically, we predicted that varsity athletes, who participate in activities with the highest level of competition, would display the highest levels of eating disorder symptoms compared to all other exercise groups. We predicted that club athletes would display higher levels of eating disorder symptoms than independent exercisers and nonexercisers, and that independent exercisers would display more symptoms than nonexercisers. We hypothesized that women athletes, who have high sports anxiety, would be more likely to exhibit disordered eating symptoms than those with relatively low sports anxiety, perhaps because they may engage in maladaptive behaviors in an effort to cope with their anxiety. Finally, we predicted that sports anxiety and level of competition (i.e., exercise group) would interact such that athletes who participate in relatively competitive sports and who have relatively high levels of sports anxiety would have the highest level of eating disorder symptoms.
Method
Participants
Female undergraduate participants (N = 274) were recruited from a large, southeastern university. Each participant was classified as being a member of one of four nonoverlapping groups: Varsity athletes, club athletes, independent exercisers, and nonexercisers. Varsity athletes (n = 43; 15.7%) were those who participated on a Division I sport team, and who practiced an average of 2 h minimum per day at the time of data collection. They came from the following varsity teams: swimming, softball, basketball, or soccer. Club athletes (n = 60; 21.9%) were those who actively participated in a university-sanctioned club sport and practiced an average of four times a week minimum. They were recruited from the following club teams: swimming, water polo, volleyball, lacrosse, basketball, field hockey, and rugby. Independent exercisers (n = 90; 32.8%) were people who exercised on their own at least three times per week on average.a Nonexercisers (n = 81; 29.6%) were individuals who said that they exercised zero to two times per week on average. The average age of the sample was 19.0 (SD = 1.4). The majority of participants were Caucasian (n = 160; 58.4%); however, many participants were from ethnic and racial minority groups: African American n = 58 (21.2%), Hispanic/Latina n = 42 (15.3%), Asian/Asian American n = 6 (2.2%), and “Other” n = 8 (3.0%). The average body mass index (BMI) of the sample was 24.2 (SD = 4.9), and BMI did not differ between any of the groups [F(3,274) = 1.95, p = ns].
Procedure
Coaches and presidents of female varsity and club teams at the university were invited to participate in the study, and all who were approached agreed to participate except for the track team (the coach declined). All athletes who were eligible to participate chose to do so, suggesting that our recruiting strategy did not introduce bias into the sample. Independent exercisers and nonexercisers were recruited through the general psychology participant pool and compensated with class credit. The research protocol was approved by the University’s Institutional Review Board.
Measures
Eating Disorders Inventory.
The EDI15 is a 64-item self-report measure of eating-related behaviors and attitudes. This study primarily used the following well-validated subscales: drive for thinness (DFT; α in this sample = 0.86), bulimia (BUL; α in this sample = 0.85), and body dissatisfaction (BD; α in this sample = 0.80) subscales. The coefficient alpha for each used scale was comparable to the previous estimates of internal reliability.16
Rosenberg Self Esteem Scale.
The RSE17 is a 10-item measure that asks statements such as “I take a positive attitude toward myself” on a four-point scale. Higher scores indicate higher self-esteem. Adequate reliability and validity of this measure have been reported.18 In this study, the RSE had an internal consistency coefficient of 0.88.
The Physical Activity and Sport Anxiety Scale.
The PASAS13 is a 16-item self-report questionnaire that assesses social fear and avoidance of physical activity or athletic situations. Higher scores indicate a higher amount of social anxiety associated with physical activity and sports participation. The questionnaire has demonstrated good internal consistency, temporal stability, convergent validity, and divergent validity.13 In this study, the PASAS had an α of 0.91.
Results
We first examined whether athletes involved in relatively more competitive sports would be most likely to display eating disorder symptoms; mean scores are displayed in Table 1. A multivariate analysis of variance indicated a significant overall multivariate effect for exercise group [F(9,625) = 6.06, p < .001] on eating-disordered symptomatology (i.e., EDI-DFT, BD, and BUL subscales) that accounted for 7% of the variance. Follow-up university analyses indicated a significant effect of exercise group on DFT [F(3,260) = 4.74, p = .003, = .052]b with independent exercisers reporting significantly higher EDI-DFT scores than nonexercisers [t(159) = −3.74, p < .001]c and club athletes [t(144) = 2.26, p = .03]. Univariate analyses also indicated a significant group effect on BD [F(3,260) = 5.65, p <.001, = .061] with both club [t(133) = −3.30, p < .001] and varsity [t(115) = 21.95, p = .04] athletes reporting more BD than nonexercisers and club athletes reporting higher EDI-BD scores than independent exercisers [t(145) = 23.72, p < .001]. Finally, univariate analyses revealed a significant effect of exercise group on bulimic symptomatology [F(3,260) = 3.46, p = .02, = .038], with nonexercisers reporting significantly lower EDI-BUL scores than all other groups [when compared with independent exercisers, t(160) = −2.57, p = .01, club athletes, t(133) = −2.71, p = .01, and varsity athletes, t(115) = −2.41, p = .02)].
TABLE 1.
Descriptive statistics by exercise group: mean (standard deviation)
| Group | Body Diss | Bulimia | DFT | PASAS |
|---|---|---|---|---|
| Nonexercisers | 26.22 (7.76) | 11.64 (5.07) | 18.04 (7.15) | 35.99 (13.28) |
| Independent Exercisers | 26.66 (5.12) | 13.85 (5.77) | 22.29 (7.24) | 36.06 (11.51) |
| Club Athletes | 30.93 (8.79) | 13.82 (4.01) | 19.58 (6.98) | 33.07 (10.45) |
| Varsity Athletes | 29.21 (9.37) | 13.95 (4.79) | 20.02 (7.78) | 33.81 (10.72) |
EDI, eating disorder inventory; Body Diss, EDI-body dissatisfaction subscale; Bulimia, EDI-bulimia subscale; DFT, EDI-drive for thinness subscale; PASAS, physical activity and sport anxiety scale. PASAS scores did not vary as a function of exercise group, F(3,256) = 1.08, p = 0.36.
Next, we examined our prediction that sports anxiety would predict eating disorder symptoms, and that an interaction between exercise group and sports anxiety level would occur.d Results indicated a significant main effect of sports anxiety on drive for thinness, such that relatively higher sports anxiety were correlated to higher EDI-DFT scores than those with relatively lower PASAS scores (t = 2.30, p < .05). No additional variance was accounted for when the interaction term was included in the model. For BD, a significant effect of sports anxiety was not found, but a model containing the interaction between exercise group and sports anxiety predicted EDI-BD scores at a trend level [F(8,249) = 7.54, p = .05] and accounted for an additional 2.5% of the variance (see Table 2). Finally, results indicated a significant main effect of sports anxiety on bulimic symptoms, such that those with relatively higher sports anxiety had higher levels of bulimic symptoms than those with relatively lower sports anxiety scores (t = 2.02, p < .05). In addition, a model containing the interaction between exercise group and sports anxiety significantly predicted bulimic symptoms [F(8,249) = 15.28, p < .001] and accounted for an additional 2.5% of the variance (see Table 3).
TABLE 2.
Prediction of EDI-body dissatisfaction scores
| Order of Entry Set | Predictors in Set | B for Predictors | F Change for Set | t for Predictors | df | Partial Correlation |
|---|---|---|---|---|---|---|
| Reference group: nonexercisers | ||||||
| 1 | Control variable | 27.03a | 1,256 | |||
| Rosenberg self-esteem | −0.31 | −2.98b | −0.17 | |||
| 2 | Predictor variables | 5.63a | 4,252 | |||
| PASAS | 0.09 | 1.29 | 0.07 | |||
| Independent | 0.42 | 0.38 | 0.02 | |||
| Club athletes | 4.85 | 3.90a | 0.22 | |||
| Varsity athletes | 2.31 | 1.67 | 0.10 | |||
| 3 | Interaction | 2.60d | 8,249 | |||
| PASAS × Group 2 | −0.05 | −0.52 | −0.03 | |||
| PASAS × Group 3 | 0.20 | 1.90d | 0.11 | |||
| PASAS × Group 4 | 0.19 | 1.58 | 0.09 | |||
| Reference group: independent exercisers | ||||||
| 1 | Control variable | 27.03a | 1,256 | |||
| Rosenberg self-esteem | −0.31 | −2.98b | −0.17 | |||
| 2 | Predictor variables | 5.63a | 4,252 | |||
| PASAS | 0.04 | 0.56 | 0.03 | |||
| Nonexercisers | −0.42 | −0.38 | −0.02 | |||
| Club athletes | 4.43 | 3.70a | 0.21 | |||
| Varsity athletes | 1.88 | 1.41 | 0.08 | |||
| 3 | Interaction | 2.60d | 8,249 | |||
| PASAS × Group 1 | 0.05 | 0.52 | 0.03 | |||
| PASAS × Group 3 | 0.25 | 2.30c | 0.13 | |||
| PASAS × Group 4 | 0.24 | 1.93d | 0.11 | |||
| Reference group: club athletes | ||||||
| 1 | Control variable | 27.03a | 1,256 | |||
| Rosenberg self-esteem | −0.36 | −2.98b | −0.17 | |||
| 2 | Predictor variables | 5.63a | 4,252 | |||
| PASAS | 0.29 | 3.27b | 0.19 | |||
| Nonexercisers | −4.85 | −3.90a | −0.22 | |||
| Independent | −4.43 | −3.70a | −0.21 | |||
| Varsity athletes | −2.55 | −1.78d | −0.10 | |||
| 3 | Interaction | 2.60d | 8,249 | |||
| PASAS × Group 1 | −0.20 | −1.90d | −0.11 | |||
| PASAS × Group 2 | −0.25 | −2.30c | −0.13 | |||
| PASAS × Group 4 | −0.02 | −0.12 | −0.01 | |||
Group 1, nonexercisers; Group 2, independent exercisers; Group 3, club athletes; Group 4, varsity athletes;
p < 0.001.
p < 0.01.
p < 0.05.
0.05 < p < 0.09.
TABLE 3.
Prediction of EDI-bulimia scores
| Order of Entry Set | Predictors in Set | B for Predictors | F Change for Set | t for Predictors | df | Partial Correlation |
|---|---|---|---|---|---|---|
| Reference group: nonexercisers | ||||||
| 1 | Control variable | 71.44a | 1,256 | |||
| Rosenberg self-esteem | −0.36 | −5.44a | −0.28 | |||
| 2 | Predictor variables | 7.80a | 4,252 | |||
| PASAS | 0.08 | 2.02b | 0.11 | |||
| Independent | 2.04 | 2.98b | 0.16 | |||
| Club athletes | 1.72 | 2.24b | 0.12 | |||
| Varsity athletes | 1.92 | 2.25b | 0.12 | |||
| 3 | Interaction | 3.10b | 8,249 | |||
| PASAS × Group 2 | 0.11 | 1.96c | 0.10 | |||
| PASAS × Group 3 | −0.06 | −0.89 | −0.05 | |||
| PASAS × Group 4 | 0.13 | 1.74 | 0.09 | |||
| Reference group: independent exercisers | ||||||
| 1 | Control variable | 71.44a | 1,256 | |||
| Rosenberg self-esteem | −0.36 | −5.44a | −0.28 | |||
| 2 | Predictor variables | 7.80a | 4,252 | |||
| PASAS | 0.19 | 4.60a | 0.24 | |||
| Nonexercisers | −2.04 | −2.98b | −0.16 | |||
| Club athletes | −0.32 | −0.43 | −0.02 | |||
| Varsity athletes | −0.12 | −0.15 | −0.01 | |||
| 3 | Interaction | 3.10b | 8,249 | |||
| PASAS × Group 1 | −0.11 | −1.96c | −0.10 | |||
| PASAS × Group 3 | −0.17 | −2.49b | −0.13 | |||
| PASAS × Group 4 | 0.02 | 0.26 | 0.02 | |||
| Reference group: club athletes | ||||||
| 1 | Control variable | 71.44a | 1,256 | |||
| Rosenberg self-esteem | −0.36 | −5.44a | −0.28 | |||
| 2 | Predictor variables | 7.80a | 4,252 | |||
| PASAS | 0.08 | 0.42 | 0.02 | |||
| Nonexercisers | −1.72 | −2.24b | −0.12 | |||
| Independent | 0.32 | 0.43 | 0.02 | |||
| Varsity athletes | 0.19 | 0.22 | 0.01 | |||
| 3 | Interaction | 3.10b | 8,249 | |||
| PASAS × Group 1 | 0.06 | 0.89 | 0.05 | |||
| PASAS × Group 2 | 0.17 | 2.49b | 0.13 | |||
| PASAS × Group 4 | 0.19 | 2.23b | 0.12 | |||
Group 1, Nonexercisers; Group 2, independent exercisers; Group 3, club athletes; Group 4, varsity athletes.
p < 0.001.
p < 0.05.
0.05 < p < 0.09.
Finally, we plotted BD scores as a function of group membership and level of sports anxiety (i.e., 25th and 75th percentile scores; see Fig. 1) to examine the form of the interaction. Results indicated that the relationship between sports anxiety and BD differed between the nonexercisers and club athletes [t(249) = 1.90, p = .05].d The positive relationship between sports anxiety and bulimic symptoms was stronger for club athletes when compared with nonexercisers. The relationship between sports anxiety and BD was also stronger for club athletes when compared with independent exercisers [t(249) = 2.30, p = .02] and for varsity athletes when compared with independent exercisers [t(249) = 1.93, p = .06].e Next, we plotted bulimic symptoms as a function of group membership and level of sports anxiety (see Fig. 1). The relationship between sports anxiety and bulimic symptoms differed between nonexercisers and independent exercisers [t(249) = 1.96, p = .05]d and between nonexercisers and varsity athletes [t(249) = 1.74, p = .08].d The positive relationship between sports anxiety and bulimic symptoms was stronger for independent exercisers than nonexercisers and for varsity athletes than nonexercisers. The results also indicated that the relationship between sports anxiety and bulimic symptoms was significantly stronger for independent exercisers than club athletes [t(249) = −2.49, p = .01]. Finally, the relationship between sports anxiety and EDI-BUL scores was stronger among varsity athletes than club athletes [t(249) = 2.23, p = .03].
FIGURE 1.
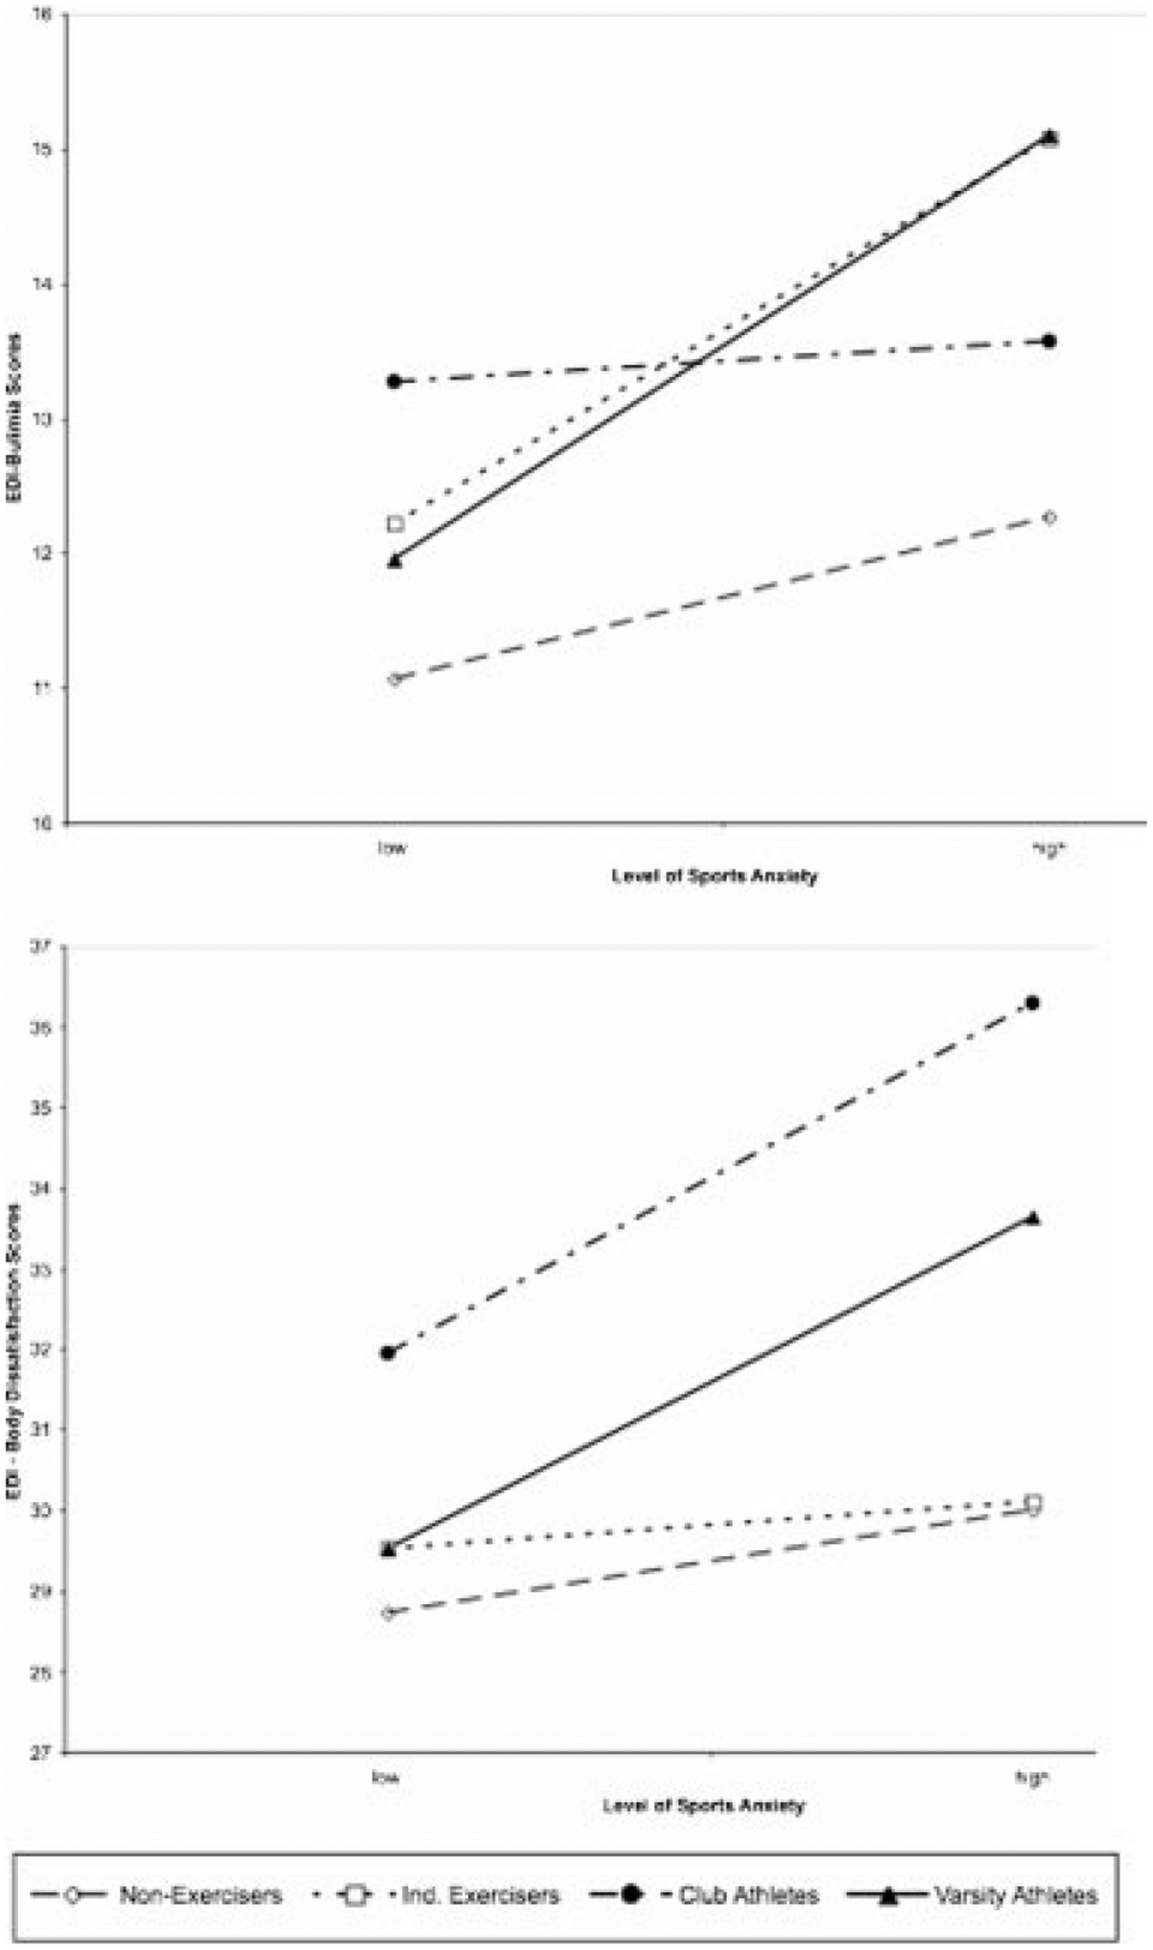
EDI-bulimia scores and EDI-body dissatisfaction scores as a function of sports anxiety and exercise group.
Conclusion
The purpose of this study was twofold. First, we evaluated the relationship between the level of competition in athletic participation and eating disorder symptoms. Consistent with the findings of Smolak et al.,4 we found that women who participated in sports or engaged in regular exercise tended to have higher rates of eating disorder symptomatology than those who did not exercise. Specifically, nonexercisers had lower levels of DFT (compared to independent exercisers), lower rates of BD (compared to club and varsity athletes), and lower levels of bulimic symptoms (compared to independent exercisers, club, and varsity athletes). Despite the trend for women who participated in higher levels of athletic competition to have higher levels of eating disorders, our data do not suggest a clear dimension ranging from nonexercisers to varsity athletes. In some cases, for instance, independent exercisers appear to have similar traits to varsity athletes (e.g., see Fig. 1). Thus, some independent exercisers may engage in exercise as frequently and/or intensely as women who participate in competitive athletics.
We also examined whether the level of sports anxiety and/or its interaction with exercise group would significantly predict eating disorder symptoms. Our prediction that there would be a main effect of sports anxiety was largely supported. Specifically, higher levels of sports anxiety were predictive of higher levels of bulimic symptoms and drive for thinness. Our prediction that relatively high levels of sports anxiety would be particularly predictive of disordered eating symptoms among women who compete in sports with relatively high levels of competitiveness was also largely supported: the interaction of sports anxiety and level of athletic participation significantly predicted BD (at a trend level) and bulimic symptoms. The pattern of results suggests that women who competed at high levels of athletic competition and had high levels of sports anxiety experienced the most eating disorder symptoms (i.e., higher levels of BD and bulimic symptoms).
The current data suggest that coaches and athletic departments of competitive athletes need to know that athletes may be at a higher risk for eating disorder symptoms than women who are not involved in competitive athletics. The nature of this relationship is unclear. On one hand, women may develop eating disorder symptoms as a result of participating in athletic events and experiencing the associated pressures of competition. Alternatively, women who are at a high risk for developing eating disorders may elect to become involved in athletics, perhaps in an effort to manage their weight. Research examining these hypotheses and others may advance the understanding of this relationship and inform effective prevention and intervention methods.
This is one of the first studies to document that increased rates of sports anxiety are linked to eating disorder symptoms. Two other studies examining sports anxiety demonstrated its relationship to social phobia, especially among women.11,12 Given the frequent comorbidity between social anxiety and eating disorders20 and the link between sports participation and eating disorder symptoms,4 it is not a surprise that sports anxiety, a construct hypothesized to be a specific form of social anxiety that primarily effects women, is linked to high rates of bulimic symptoms and a strong drive for thinness. Thus, clinicians should consider the need for targeting symptoms of social phobia and sports anxiety when treating athletes with eating disorder symptoms.
The results must be considered in light of the study’s limitations. The varsity and club athletes did not represent both “lean” and “nonlean” sports equally well, primarily because the university at which the research was conducted does not have varsity or club gymnastics or figure-skating teams. Given that some other researchers have reported that certain types of sports may be associated with higher levels of eating disorders than others (e.g., Ref. 7; cf. Ref. 21), future research should include more “lean” sports. In addition, this study did not examine many potential variables (e.g., pressure from a coach to be thin, the ethnicity of athlete, and the intensity of the independent exercisers’ athletic activity) that could further illuminate the relationship between levels of sports participation and eating disorder symptoms. Future studies may benefit from the inclusion of these variables.
In sum, this study replicated and extended previous research by demonstrating that, in general, women who participate in relatively more competitive athletic domains have higher rates of eating disorder symptoms than those who participate in relatively less competitive physical activity. Furthermore, women who are involved in relatively higher levels of athletic competition and who experience relatively high levels of sports anxiety have higher rates of BD and bulimic symptoms than women who participate in less competitive physical activities and who report lower levels of sports anxiety. Future research should aim to elucidate the specific mechanisms that account for the links between athletic participation, sports anxiety, and eating disorder symptoms.
Footnotes
Regular independent exercisers were defined as those who engage in exercise at least three times per week on average, because the Center for Disease Control’s Healthy People 2010 guidelines encourage adults to exercise vigorously for 20 or more minutes at least three times per week. http://www.healthypeople.gov/Document/HTML/Volume2/22Physical.htm#_Toc490380801
Partial η2 indicates effect size. and is analogous to a squared partial correlation from multiple-regression models.
No corrections for Type I error were made, given that this is a relatively new area of study, and in an exploratory fashion, we decided to examine all contrasts in the event of a significant omnibus test. Throughout this part of the Results section, exact p values are reported whenever possible. Providing exact p values will allow readers to make any error corrections that they see fit.
To examine our hypotheses about sports anxiety, we followed procedures described by Cohen et al.19 to create dummy-coded variables to represent group membership. We then conducted a series of regression analyses to determine if the interaction between group and level of sports anxiety was a statistically significant predictor of eating-disordered symptoms. For each dependent variable, in the first step of each regression analysis, we controlled for self-esteem. In the second step, we entered exercise group and sports anxiety scores. In the final step, we entered the interaction variable (sports anxiety × group).
It should be noted that using α of .05, this effect is considered a statistical trend. Our sample was relatively small and resulted in unequal numbers of participants across exercise groups, thereby possibly reducing the statistical significance of our results. Because of the need to also guard against Type II error given the potential clinical significance of these results, we discuss these findings and acknowledge that replication of these data is needed.
References
- 1.NCAA Title IX seminar (2003). Accessed online February 28, 2008: http://www.ncaa.org/gender_equity/general_info/20030428speech.html.
- 2.Engel S, Johnson C, Powers P, Crosby R, Wonderlich S, Wittrock D, et al. Predictors of disordered eating in a sample of elite Division I college athletes. Eat Behav 2003;4:333–343. [DOI] [PubMed] [Google Scholar]
- 3.Wilkins J, Boland F, Albinson J. A comparison of male and female university athlete non-athletes on eating disorder indices: Are athletes protected? J Sport Behav 1991;14:129–143. [Google Scholar]
- 4.Smolak L, Murnen S, Ruble A. Female athletes and eating problems: A meta-analysis. Int J Eat Disord 2000;27:371–380. [DOI] [PubMed] [Google Scholar]
- 5.Hausenblas H, Carron A. Eating disorder indices and athletes: An integration. J Sport Exerc Psychol 1999;21:230–258. [Google Scholar]
- 6.Johnson C, Powers P, Dick R. Athletes and eating disorders: The national collegiate athletic association study. Int J Eat Disord 1999;26:179–188. [DOI] [PubMed] [Google Scholar]
- 7.Sundgot-Borgen J Eating disorders in female athletes. Sports Med 1994;17:176–188. [DOI] [PubMed] [Google Scholar]
- 8.Fulkerson J, Keel P, Leon G, Dorr T. Eating-disordered behaviors and personality characteristics of high school athletes and non-athletes. Int J Eat Disord 1997;26:73–79. [DOI] [PubMed] [Google Scholar]
- 9.Etzel E, Ferrante A, Pickney J. Counseling College Student-Athletes: Issues and Interventions. Morgantown: W.V. Fitness Information Technology, 1996. [Google Scholar]
- 10.Berry T, Howe H. Risk factors for disordered eating in female university athletes. J Sport Behav 2000;23:207–218. [Google Scholar]
- 11.Norton P, Burns J, Hope D, Bauer B. Generalization of social anxiety to sporting and athletic situations: Gender, sports involvement, and parental pressure. Depress Anxiety 2000;12:193–202. [DOI] [PubMed] [Google Scholar]
- 12.Storch E, Barlas M, Dent H, Masia C. Generalization of social anxiety to sport: An investigation of elementary-aged Hispanic children. Child Study J 2002;32:81–88. [Google Scholar]
- 13.Norton P, Hope D, Weeks J. The physical activity and sport anxiety scale: Scale development and psychometric analysis. Anxiety Stress Coping 2004;17:363–382. [Google Scholar]
- 14.Martens R, Vealey R, Burton D (1990). Competitive Anxiety in Sport. Champaign, IL: Human Kinetics. [Google Scholar]
- 15.Garner D, Olmsted M, Polivy J. Development and validation of a multi-dimensional eating disorder inventory for anorexia nervosa and bulimia. Int J Eat Disord 1983;2:15–34. [Google Scholar]
- 16.Ebernez K, Gleaves D. An examination of the internal consistency and factor structure of the eating disorder inventory-2 in a clinical sample. Int J Eat Disord 1994;16:371–379. [DOI] [PubMed] [Google Scholar]
- 17.Rosenberg M. Society and the Adolescent Self-Image. Princeton, NJ: Princeton University Press, 1965. [Google Scholar]
- 18.Blascovich J, Tomaka J. Measures of self-esteem In: Robinson J, Sharer P, Wrightsman L, editors. Measuring of Personality and Social Psychological Attitudes, Vol. 1 San Diego, CA: Academic Press, 1991, pp. 115–160. [Google Scholar]
- 19.Cohen J, Cohen J, West S, Aiken L. Applied Multiple Regression/Correlation Analysis for the Behavioral Sciences, 3rd ed. Mahwah, NJ: Lawrence Erlbaum Associates, 2003. [Google Scholar]
- 20.Brewerton T, Lydiard R, Ballenger J, Herzog D. Eating disorders and social phobia. Arch Gen Psychiatr 1993;50:70. [DOI] [PubMed] [Google Scholar]
- 21.Sanford-Martens T, Davidson M, Yakushko O, Martens M, Hinton P, Beck N. Clinical and subclinical eating disorders: An examination of collegiate athletes. J Appl Sport Psychol 2005; 17:79–86. [Google Scholar]