
Fig. 6.
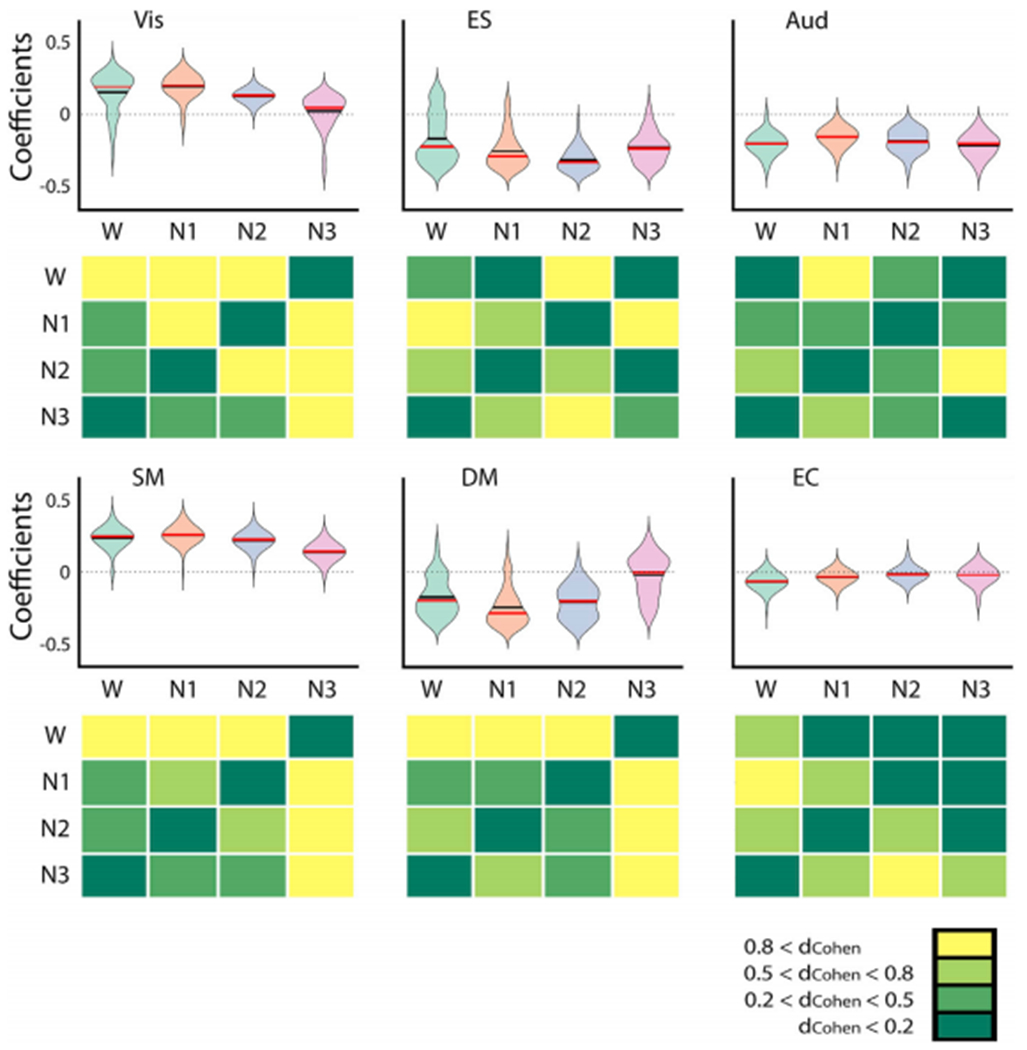
The coefficient distributions corresponding to the six RSNs, estimated from the optimal fit to the empirical FC data recorded during wakefulness (W), N1, N2 and N3 sleep. The bottom panels on each row show Cohen’s d (dCohen) for all pairwise comparisons. Primary visual (Vis) and sensorimotor (SM) nodes contributed towards oscillatory dynamics during wakefulness, but this contribution progressively approached zero as the subjects transitioned towards N3 sleep. The opposite result was observed for default mode (DM) nodes. In Fig S8, the coefficient distributions corresponding to the six RSNs were obtained for 100 runs of the optimization procedure with 20 individuals per generations.