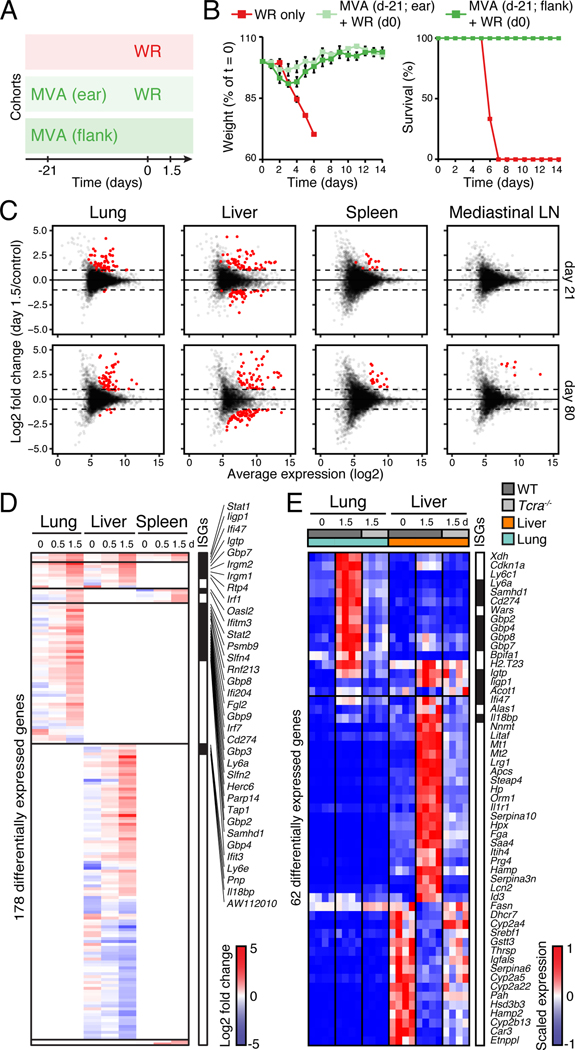
Figure 4. Protective memory responses to a respiratory viral challenge induce expression changes in lung, liver and spleen.
(A-B) Cohorts of mice used to track memory protective responses using MVA immunization at skin (ear or flank) followed by intranasal WR challenge at day 21 (A), and matching weight and survival measurements (B). Error bars, SEM (n = 4).
(C) Dot plots showing log2 fold-change in gene expression (Y axis) in tissues collected at 1.5 day post-WR challenge (on day 21 or 80 after MVA) relative to uninfected controls against log2 average expression (X axis) (n = 4). Red dots, genes with FDR < 0.05 and absolute log2 fold change > 1.
(D-E) Heatmaps showing differentially expressed genes in lung, liver, and spleen at indicated days (d) after intranasal WR challenge of wild-type (D-E) and/or Tcra−/− (E) mice immunized with MVA at flank skin 21 days earlier (FDR-adjusted p-value < 0.05 and absolute fold change > 2, n = 4). Shown are log2 fold-change values relative to matching, uninfected tissues (D), and normalized read counts scaled per row (4 replicates/condition; E). Day 0, mice immunized only. Interferon-stimulated genes (ISGs) are indicated in black on the right.

