Abstract
Background:
Endoscopic ultrasound-guided fine-needle aspiration is associated with the accurate determination of tumor grade. However, because it is an invasive procedure there is a need to explore alternative noninvasive procedures.
Purpose:
To develop and validate a noncontrast radiomics model for the preoperative prediction of nonfunctional pancreatic neuroendocrine tumor (NF-pNET) grade (G).
Study Type:
Retrospective, single-center study.
Subjects:
Patients with pathologically confirmed PNETs (139) were included.
Field Strength/Sequence:
3T/breath-hold single-shot fast-spin echo T2-weighted sequence and unenhanced and dynamic contrast-enhanced T1-weighted fat-suppressed sequences.
Assessment:
Tumor features on contrast MR images were evaluated by three board-certified abdominal radiologists.
Statistical Tests:
Multivariable logistic regression analysis was used to develop the clinical model. The least absolute shrinkage and selection operator method and linear discriminative analysis (LDA) were used to select the features and to construct a radiomics model. The performance of the models was assessed using the training cohort (97 patients) and the validation cohort (42 patients), and decision curve analysis (DCA) was applied for clinical use.
Results:
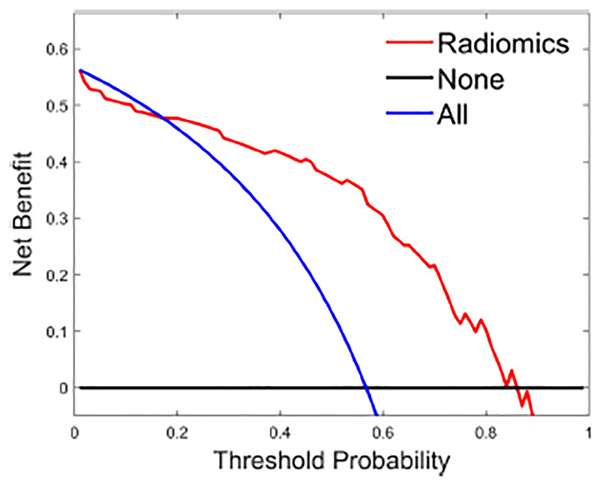
The clinical model included 14 imaging features, and the corresponding area under the curve (AUC) was 0.769 (95% confidence interval [CI], 0.675–0.863) in the training cohort and 0.729 (95% CI, 0.568–0.890) in the validation cohort. The LDA included 14 selected radiomics features that showed good discrimination—in the training cohort (AUC, 0.851; 95% CI, 0.758–0.916) and the validation cohort (AUC, 0.736; 95% CI, 0.518–0.874). In the decision curves, if the threshold probability was 0.17–0.84, using the radiomics score to distinguish NF-pNET G1 and G2/3, offered more benefit than did the use of a treat-all-patients or treat-none scheme.
Data Conclusion:
The developed radiomics model using noncontrast MRI could help differentiate G1 and G2/3 tumors, to make the clinical decision, and screen pNETs grade.
Level of Evidence:
4
Technical Efficacy Stage:
2
PANCREATIC NEUROENDOCRINE TUMORS (pNETs) are rare and account for only 3% of pancreatic tumors.1–3 However, the number of incidentally discovered pNETs has increased because of advances in diagnostic imaging.1,2 A classification system developed by the World Health Organization (WHO) in 2010 categorized pNETs as low-grade (G1), intermediate-grade (G2), or high-grade (G3) tumors on the basis of the mitotic rate and Ki-67 index.4
However, over the past several years there have been reports that G3 pNET is more heterogeneous than expected and that there are differences in survival outcomes according to the tumor morphology and Ki-67 index among patients with pNET G3.5–7 The WHO classification was revised recently based on these studies. Revised 2017 WHO classification divides previous G3 neuroendocrine carcinomas into well-differentiated NET (NET G3) and poorly-differentiated NET (neuroendocrine carcinoma G3); the latter was subdivided into small cell type and large cell type according to the cell size.8
Studies have shown that the risk of tumor progression increases by 2% for each 1% increase in Ki-67 index.9 G2 and G3 tumors need a more aggressive surgical treatment than G1 tumors. Therefore, it is important to differentiate G1 tumors from G2 and G3 tumors.
Accurate prediction of pNET grade before surgery is of great significance for clinical treatment selection and prognosis evaluation. To date, endoscopic ultrasound-guided fine-needle aspiration (EUS-FNA) has been associated with high accuracy of tumor grading before surgery.10 However, the main drawbacks of EUS-FNA, in this regard, are invasiveness and potential puncture failure, collection of limited tissue volume, and difficulty in reflecting tumor heterogeneity.11,12 Multislice spiral computed tomography (MSCT) and magnetic resonance imaging (MRI) have become the most commonly used tools for pNET diagnosis. These techniques are noninvasive, highly efficient, and can provide a comprehensive assessment regarding the tumor location, size, shape, margin, calcification, invasion to the adjacent vessels and organs, and metastasis. Many studies explored the correlation between the findings of, and tumor grades determined by, MSCT and MRI. These studies were based on the quantification of imaging findings, but the overall value with respect to tumor grade was limited.13–17
Radiomics is an emerging field that converts imaging data into a high-dimensional feature space using a large number of automatically extracted data-characterization algorithms.18,19 Machine learning is the scientific discipline that focuses on how computers learn from data,20 and provides a noninvasive method for the prediction of tumor grade. So far, most of the prior studies have used CT radiomics features,21–24 and development of a radiomics model based on noncontrast MRI has been rarely reported.25 Therefore, in this study we used noncontrast MRI radiomics features of pNETs to establish a linear discriminant analysis (LDA) classifier that employed the sigmoid function to generate the output and to achieve accurate preoperative prediction of pNET grade.
Materials and Methods
Patients
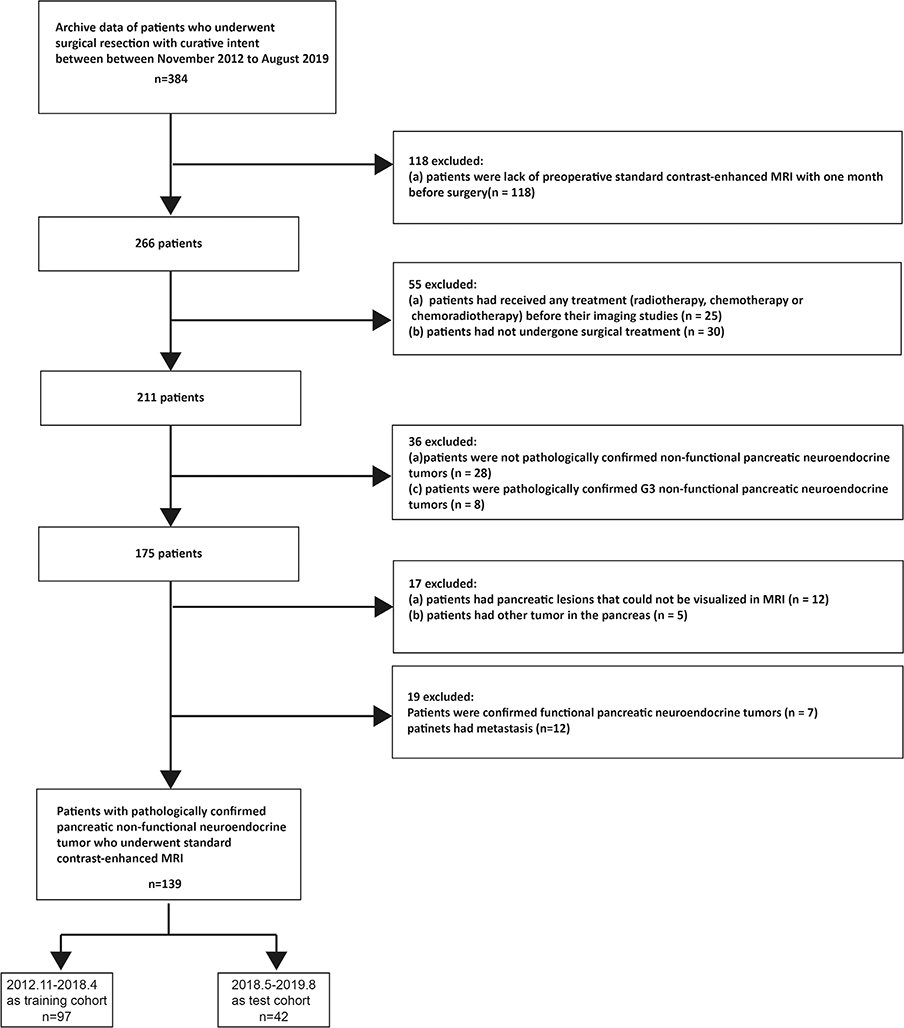
This retrospective single-center study design was reviewed and approved by the Biomedical Research Ethics Committee of our institution. The requirement for patient consent was waived. We screened the institutional database for medical records of patients with histologically confirmed pNETs who underwent surgical resection with curative intent from November 2012 to August 2019. Patients were excluded if they met one of the following criteria: 1) had not undergone preoperative standard contrast-enhanced MRI during the month before surgery; 2) had received any treatment (radiotherapy, chemotherapy, or chemoradiotherapy) before undergoing imaging studies; 3) had not undergone surgery; 4) had pancreatic lesions that could not be visualized using MRI; 5) had other tumors in the pancreas; 6) had confirmed functional pNETs; and patients with 7) pathologically unconfirmed NF-pNETs; and 8) metastasis. The complete patient selection process is shown in Fig. 1. Consequently, a total of 139 consecutive patients with NF-pNETs were included in this cross-sectional study. Patients with G1, G2, and G3 tumors accounted for 43.3% (42), 48.5% (47), and 8.2% (8) of the training cohort, respectively, and 42.85% (18), 42.85% (18), and 14.1% (6) of the validation cohort, respectively.
FIGURE 1:
Flow chart depicting the patient selection process.
MRI
All patients included in this study underwent dynamic contrast-enhanced MRI of the pancreas performed with 3.0T systems (Signa HDxt MR750 3.0T, GE Healthcare, Milwaukee, WI; Skyra 3.0T, Siemens, Erlangen, Germany). All patients were positioned supine with a phased array receiver coil covering the upper abdomen, and breath-hold single-shot fast-spin echo-coronal T2-weighted sequence (repetition time [TR] / echo time [TE] = 6316/87 msec; field of view [FOV] = 360 × 420 mm2; matrix = 224 × 270; slice thickness = 5 mm; flip angle = 90; slice gap = 1 mm) and unenhanced and dynamic contrast-enhanced T1-weighted fat-suppressed sequences (TR/TE = 2.58/1.18 msec; FOV = 440 × 440 mm2; matrix = 224 × 270; slice thickness = 5 mm; flip angle = 12; no slice gap) were used. Dynamic contrast-enhanced images, including arterial phase (15 sec), pancreatic parenchymal phase (20 sec), and portal venous phase (40 sec) images were obtained with gadopentetate dimeglumine (Magnevist and Gadovist, Bayer Schering Pharma, Berlin, Germany). The contrast agent was administered intravenously at a rate of 2 mL/s and a dose of 0.2 mL/kg, followed by 20 mL of normal saline (to flush the tube).
MRI Analysis
All MR images were analyzed by three board-certified abdominal radiologists (Y.B., K.C., and J.L., with experience of 20, 20, and 18 years, respectively), who were aware that the study population had pNET but were blinded to the tumor grade and stage. If there was any inconsistency, we chose the two consistent results.
All tumors were evaluated for the following features: 1) tumor location—head (uncinate and nonuncinate), body, or tail of the pancreas or multiple locations in the pancreas; 2) size—the maximum diameter of the tumor in cross-section26; 3) shape—regular or irregular; 4) margin—well-delineated (tumor margin smooth and clearly visible) or ill-delineated (with spiculation or infiltration on >90° of tumor perimeter); 5) parenchymal atrophy; 6) cystic changes within the tumor—nonenhancing areas of circular or ovoidal shape or well-defined margin and high T2-weighted image (T2WI) signal intensity; 7) dilation—pancreatic duct dilation (>3 mm) and common bile duct dilation (>10 mm); 8) tumor intensity in T1-weighted imaging (T1WI) and T2WI—low-, iso-, and high-intensity tumors; 9) the phase of peak enhanced value; 10) enhanced mode—homogeneity and heterogeneity; and 11) organ invasion—invasion of the liver, spleen, intestine, or stomach. The criterion for cases involving tumors that could not be separated from organs was: l) vascular invasion—invasion of the common hepatic artery, splenic artery and vein, gastroduodenal artery, superior mesenteric artery and vein, and portal venous vein. The criteria were vessel occlusion, stenosis, or more than half of the perimeter being in contact with the tumor.
Radiomics Workflow
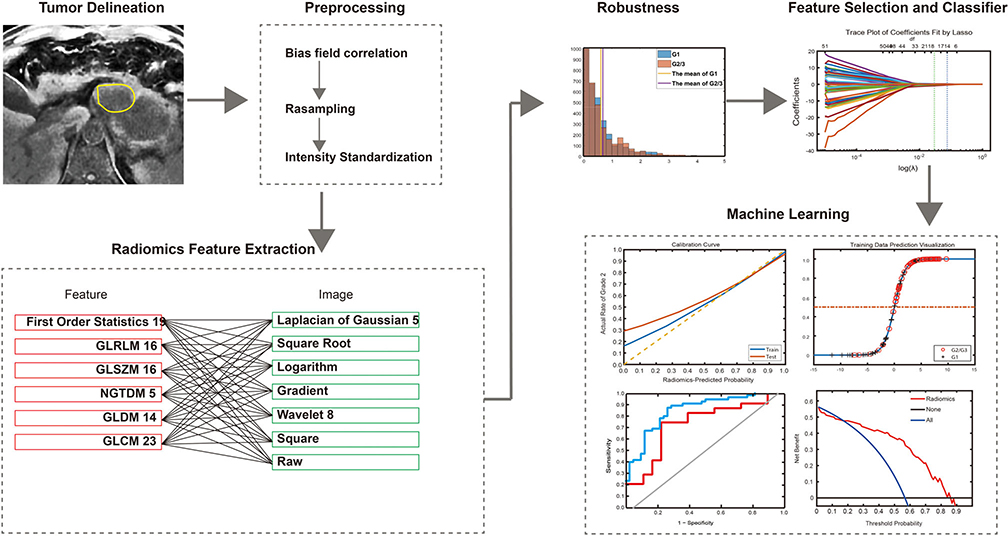
The radiomics workflow included 1) image segmentation and preprocessing; 2) feature extraction; and 3) machine learning (Fig. 2).
FIGURE 2:
Radiomics workflow.
IMAGE SEGMENTATION AND PREPROCESSING.
The draw tool available in the Editor module of the 3D Slicer v. 4.8.1 (open source software; https://www.slicer.org/) was used to delineate the tumors in multiple slices. In this study the volume of interest (VOI) was extracted by stacking the corresponding regions of interest (ROIs) delineated slice-by-slice for each patient. Areas showing calcification and cystic changes in the tumor were excluded when drawing. To eliminate the differences resulting from the use of different scanners and to normalize the images, all data were processed in the three steps described below.
Step 1: Bias field correction: A B1 bias field is a low-frequency smooth undesirable signal that corrupts MR images because of the inhomogeneities in the magnetic field of the MRI machine.27 This was corrected to compensate for inhomogeneity artifacts across the MRI volume using low-pass bias filtering.28
Step 2: Resampling: All sets were resampled in all three dimensions via linear interpolation to ensure consistent voxel sizes and resolutions across all the machines and patients; MatLab (v. R2018b; MathWorks, Natick, MA; https://www.mathworks.com/ ). As a result, the voxel dimensions of each case were 0.66 × 0.66 × 0.66 mm3. This step of processing was performed on all annotation masks, as well to ensure that the masks remained in correspondence with the volumes.
Step 3: Intensity standardization: Landmark-based histogram transformation was used to align MRI signal intensity distributions across all patient sets.29 Two patients were selected at random to generate a template distribution on T1 and T2, respectively. Distributions for all patient volumes scanned from all machines were nonlinearly mapped to the template distribution, using deciles as landmarks on both target and template distributions; MatLab (v. R2018b; MathWorks). As a result, distributions for all patient sets were brought into alignment, thus ensuring that the signal intensities were in tissue-specific correspondence.
FEATURE EXTRACTION.
Gray level co-occurrence matrix (GLCM), gray level run length matrix (GLRLM), gray level size zone matrix (GLSZM), gray level dependence matrix (GLDM), and neighboring gray tone difference matrix (NGTDM) were applied to all imaging data, which consisted of raw images and images processed using square, square root, logarithm, gradient, Laplacian of Gaussian, and wavelet filters. Details of the procedures for the radiomics feature extraction are described in the Supplementary 1 data.
To assess interobserver reliability, ROI segmentation was performed in a blinded fashion by two radiologists. To evaluate intraobserver reliability, reader 1 extracted the features three times, with an interval of 7 days between extractions. Reader 1 completed the remaining image segmentation; readout sessions were conducted over a period of 1 month. Reliability was calculated using the intraclass correlation coefficient (ICC). Radiomics features with both intraobserver and interobserver ICC values greater than 0.75 (indicating excellent stability) were selected for subsequent investigation.
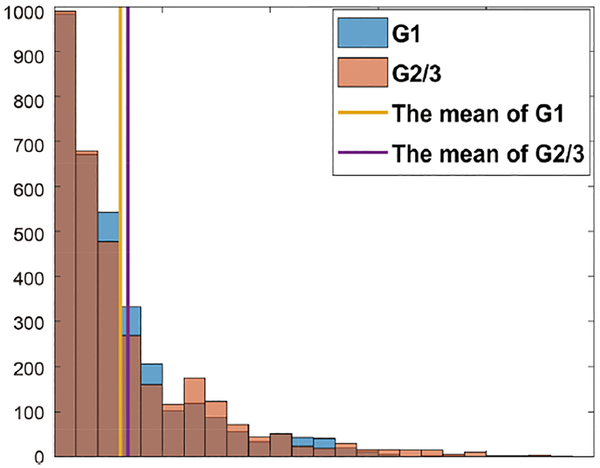
Multivariate coefficient of variation (CV) was used to evaluate the overall spread of radiomics features. Details of CV are described in the Supplementary 2 data. The CV values less than the mean CV values were picked in all data. Finally, 2126 of 3328 radiomics features were picked (Fig. 3).
FIGURE 3:
Measurement of robustness and reproducibility. Among G1 MR images, 29 were acquired using GE scanners and 13 using Siemens scanners, and among G2/3 MR images, 31 were acquired using GE scanners and 24 using Siemens scanners.
MACHINE LEARNING.
To normalize different scales of different features, the mean value of each feature was subtracted from individual features in the training cohort, and subsequently the differences of these values were divided by their respective standard deviation values. The same normalization method was then applied to the testing cohort using the mean values and standard deviation values derived from the training cohort.
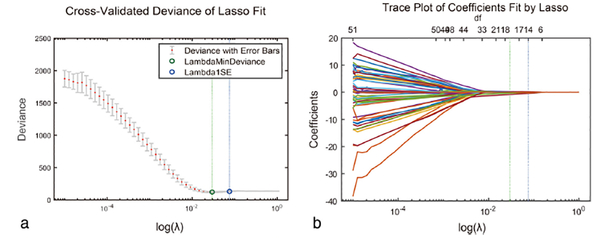
Feature selection comprised three steps: variance analysis, Wilcoxon rank-sum test, minimum redundancy and maximum relevance (mRMR), and the least absolute shrinkage and selection operator (LASSO) binary logistic regression. mRMR was used to select candidate feature sets, where the features with P < 0.01 were selected, and then the top 50% features were selected using mRMR. LASSO regression was used for further feature reduction. Among these 2126 features, 1916 were excluded because of low intragroup variance (P > 0.01). Among the remaining 105 features, the top 50% were picked according to the mRMR algorithm. Lastly, 14 features with nonzero coefficients were selected from the 105 features through the LASSO regression method (Figs. 4 and 5). Details of mRMR and LASSO are presented in the Supplementary 3 data.
FIGURE 4:
Radiomic feature selection by using a parametric method, the least absolute shrinkage and selection operator (LASSO). (a) Selection of the tuning parameter (λ) in the LASSO model via 10-fold cross-validation based on minimum criteria. Binomial deviances from the LASSO regression cross-validation procedure are plotted as a function of log (λ). y-axis indicates binomial deviances. Lower x-axis indicates the log (λ). Numbers along the upper x-axis represent the average number of predictors. Red dots indicate average deviance values for each model with a given λ, and vertical bars through the red dots show the upper and lower values of the deviances. The vertical black lines define the optimal values of λ, where the model provides its best fit to the data. The optimal λ value of 1.1147 with log (λ) =0.0471 was selected. (b) LASSO coefficient profiles of the 105 radiomics features. The dotted vertical line was plotted at the value selected using 10-fold cross-validation in a. The 14 resulting features with nonzero coefficients are indicated in the plot.
FIGURE 5:
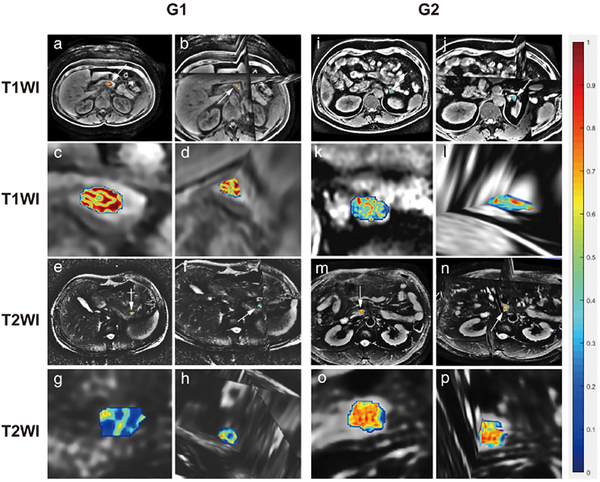
Feature map showing comparison of G1 and G2/3 using T1 and T2. The value of radiomics feature is transferred color bar. The value gradually increases from blue to red. (a) is the 2D transverse plane of the raw T1WI in G1; (b) is the 3D version of a; while (c) and (d) are zoomed tumors in a and b, respectively; (e) is the 2D transverse plane of the raw T2WI in G1; (f) is the 3D version of e; while (g) and (h) are zoomed tumors in e and f, respectively; (i) is the 2D transverse plane of the raw T1WI in G2; (j) is the 3D version of I; while (k) and (l) are zoomed tumors in i and j, respectively; (m) is the 2D transverse plane of the raw T2WI in G2; (n) is the 3D version of m; while (o) and (p) are zoomed tumors in m and n, respectively. (a–d) and (i–l) represent Log_sigma-0.5mm_GLCM_MaximumProbability feature in T1WI. Obviously, the feature of G1 is more violent than G2/3, while the (e–h), (m–p) represents Wavelet_LLH_GLCM_Lmc2 feature in T2WI; conversely, the feature of G2/3 is stronger than that of G1.
The prediction model was developed for a primary cohort that consisted of 97 patients treated from October 2012 to April 2018. Forty-two consecutive patients treated from May 2018 to August 2019 constituted an independent validation cohort. First, we developed a clinical model using 14 imaging features including tumor location, size, shape, margin, cystic changes, pancreatic and bile duct dilation, parenchymal atrophy, tumor intensity in T1WI and T2WI, the phase of peak enhanced value, enhanced mode, organ invasion, and vascular invasion. Subsequently, we applied the LDA classifier to obtain a pNET grade-predictor radiomics model. Finally, the mixed model combining the radiomics signature and 14 imaging features was developed.
Pathological Image Analysis
All specimens were analyzed by two pathologists (J.M.Z. and H.J.) with 30 and 20 years of experience in pancreatic pathology, respectively. The formalin-fixed specimens were processed into paraffin according to routine methods30; 5-μm thick sections were obtained and stained with hematoxylin and eosin (H&E) for conventional histological examination and were assessed according to the WHO 2017 guidelines.8 Immunohistochemistry was performed according to standard routine methods. We used monoclonal mouse antihuman antibodies against Ki-67 (Dako, Glostrup, Denmark). Grades were recorded.
Statistical Analysis
All analyses were performed using R (v. 3.3.3; R Foundation for Statistical Computing; http://www.r-project.org) and EmpowerStats (X&Y Solutions, Boston, MA). Normal distribution and variance homogeneity of all continuous variables were evaluated. Continuous variables that were normally distributed were expressed as mean values ± SD; the remaining continuous variables were expressed as medians with ranges. G1 and G2/3 pNETs were compared using the rank sum test (continuous variables) and the chi-squared test (categorical variables). The clinical model was constructed using the multivariable logistic regression analysis, which included all 14 imaging characteristics. The discrimination of the models was evaluated using the receiver operating characteristic (ROC) curve, and the area under the curve (AUC) was also calculated. ROC curves were compared using the DeLong test. The calibration of the models was assessed using the calibration curves and Hosmer–Lemeshow test, whereas the clinical usefulness of the models was assessed using decision curve analysis (DCA). Details of DCA method are described in the Supplementary 4 data. A two-tailed P < 0.05 was considered statistically significant.
Results
Clinical, Pathologic, and MRI Characteristics
Significant differences were observed in MRI-reported tumor size and phase of peak enhancement values of the training and validation cohorts and in the vascular invasion of the validation cohort between patients with G1 and G2/3 tumors (P < 0.05). However, no significant differences in other characteristics (P > 0.05) were observed between the groups. The characteristics of all patients are summarized in Tables 1 and 2.
TABLE 1.
Clinical and Pathological Characteristics of pNETs G1 and G2/3
| Training cohort |
Validation cohort |
|||||
|---|---|---|---|---|---|---|
| Characteristics | G1 (n= 42) | G2/3 (n= 55) | P - value | G1 (n= 18) | G2/3 (n= 24) | P - value |
| Age (years, mean±SD) | 54±10 | 50±14 | 0.32 | 55±9 | 58±11 | 0.39 |
| Sex n (%) | 0.93 | 0.76 | ||||
| Male | 21 (50.00) | 28 (50.91) | 9 (50.00) | 14 (58.33) | ||
| Female | 21 (50.00) | 27 (49.09) | 9 (50.00) | 10 (41.67) | ||
| BMI (kg/m2, mean±SD) | 22.88±2.62 | 22.23±2.70 | 0.39 | 22.54±2.26 | 22.59±2.56 | 0.83 |
| Surgery n (%) | 0.74 | 0.25 | ||||
| Pancreatoduodenectomy | 15 (35.71) | 19 (34.55) | 8 (44.44) | 7 (29.17) | ||
| Distal pancreatectomy | 25 (59.52) | 35 (63.64) | 9 (50.00) | 17 (70.83) | ||
| Enucleation | 2 (4.76) | 1 (1.82) | 1 (5.56) | 0 | ||
| Lymph node metastasis n (%) | 0.11 | 0.06 | ||||
| No | 40 (95.24) | 46 (83.64) | 18 (100.00) | 19 (79.17) | ||
| Yes | 2 (4.76) | 9 (16.36) | 0 | 5 (20.83) | ||
pNETs, pancreatic neuroendocrine tumors; G1, low-grade; G2, intermediate-grade; BMI, body mass index.
TABLE 2.
MRI Characteristics of NF-pNETs G1 and G2/3
| Training cohort |
Validation cohort |
|||||
|---|---|---|---|---|---|---|
| Characteristics | G1 (n = 42) | G2/3 (n = 55) | P - value | G1 (n = 18) | G2/3 (n = 24) | P - value |
| Size (median, range) | 24.41 (8.40–87.00) | 35.00 (6.84–114.00) | 0.01 | 19.00 (7.80–90.00) | 28.00 (15.00–117.87) | 0.002 |
| Location n (%) | 0.86 | 0.35 | ||||
| Head of pancreas | 16 (38.10) | 20 (36.36) | 8 (44.44) | 7 (29.17) | ||
| Pancreatic body and tail | 26 (61.90) | 35 (63.64) | 10 (55.56) | 17 (70.83) | ||
| T1 signal intensity n (%) | 0.51 | 1.000 | ||||
| Low | 39 (92.86) | 48 (87.27) | 15 (83.33) | 19 (79.17) | ||
| Iso | 3 (7.14) | 7 (12.73) | 3 (16.67) | 5 (20.83) | ||
| T2 signal intensity n (%) | 0.59 | 1.000 | ||||
| Iso | 8 (19.05) | 8 (14.55) | 8 (44.44) | 10 (41.67) | ||
| High | 34 (80.95) | 47 (85.45) | 10 (55.56) | 14 (58.33) | ||
| Shape n (%) | 0.07 | 1.000 | ||||
| Regular | 41 (97.62) | 47 (85.45) | 17 (94.44) | 22 (91.67) | ||
| Irregular | 1 (2.38) | 8 (14.55) | 1 (5.56) | 2 (8.33) | ||
| Margin n (%) | 1.000 | 1.000 | ||||
| Well-defined | 39 (92.86) | 50 (90.91) | 18 (100.00) | 23 (95.83) | ||
| Ill-defined | 3 (7.14) | 5 (9.09) | 0 | 1 (4.17) | ||
| Cystic change n (%) | 0.50 | 1.000 | ||||
| No | 32 (76.19) | 45 (81.82) | 16 (88.89) | 21 (87.50) | ||
| Yes | 10 (23.81) | 10 (18.18) | 2 (11.11) | 3 (12.50) | ||
| Pancreatic duct dilation n (%) | 0.26 | 0.44 | ||||
| Nondilated | 38 (90.48) | 45 (81.82) | 14 (77.78) | 21 (87.50) | ||
| Dilated | 4 (9.52) | 10 (18.18) | 4 (22.22) | 3 (12.50) | ||
| Bile duct dilation n (%) | 0.39 | 0.62 | ||||
| Nondilated | 41 (97.62) | 51 (92.73) | 17 (94.44) | 21 (87.50) | ||
| Dilated | 1 (2.38) | 4 (7.27) | 1 (5.56) | 3 (12.50) | ||
| Parenchymal atrophy n (%) | 0.26 | 0.64 | ||||
| No | 38 (90.48) | 44 (80.00) | 15 (83.33) | 22 (91.67) | ||
| Yes | 4 (9.52) | 11 (20.00) | 3 (16.67) | 2 (8.33) | ||
| Phase of peak enhancement value n (%) | 0.04 | 0.03 | ||||
| Arterial phase | 30 (71.43) | 26 (47.27) | 11 (61.11) | 6 (25.00) | ||
| Portal venous phase | 9 (21.43) | 17 (30.91) | 6 (33.33) | 10 (41.67) | ||
| Delayed phase | 3 (7.14) | 12 (21.82) | 1 (5.56) | 8 (33.33) | ||
| Enhanced mode n (%) | 0.13 | 0.18 | ||||
| Homogeneity | 32 (76.19) | 34 (61.82) | 15 (83.33) | 15 (62.50) | ||
| Heterogeneity | 10 (23.81) | 21 (38.18) | 3 (16.67) | 9 (37.50) | ||
| Organs invasion n (%) | 0.11 | 0.12 | ||||
| No | 40 (95.24) | 46 (83.64) | 18 (100.00) | 20 (83.33) | ||
| Yes | 2 (4.76) | 9 (16.36) | 0 | 4 (16.67) | ||
| Vascular invasion n (%) | 0.05 | 0.01 | ||||
| No | 39 (92.86) | 43 (78.18) | 18 (100.00) | 17 (70.83) | ||
| Yes | 3 (7.14) | 12 (21.82) | 0 | 7 (29.17) | ||
MRI, magnetic resonance imaging; NF-pNETs, nonfunctional pancreatic neuroendocrine tumors; G1, low-grade; G2, intermediate-grade.
Clinical Model
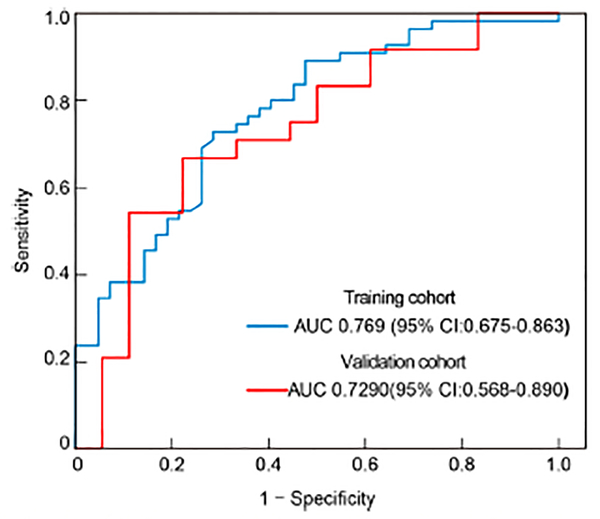
The clinical model yielded AUCs of 0.769 (95% confidence interval [CI], 0.675–0.863) and 0.729 (95% CI, 0.568–0.890) in the training and validation cohorts, respectively (Fig. 6). The sensitivity, specificity, and accuracy of the model for the training cohort were 71.4%, 72.7%, and 0.722, respectively, whereas those of the validation cohort were 77.8%, 66.7%, and 0.714, respectively.
FIGURE 6:
ROC curves of the clinical model. ROC, receiver operating characteristic; AUC, area under the curve.
Development, Performance, and Validation of the Prediction Model
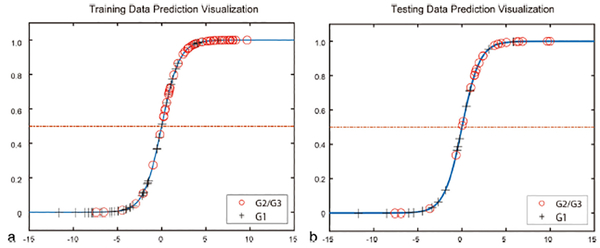
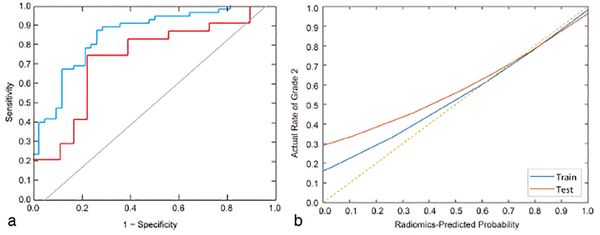
The interobserver and intraobserver ICCs were 0.776–0.923 and 0.815–0.971, respectively (Table 3). Subsequently, the LDA model was built using the 14 radiomics features selected. The visualization of the radiomics model is shown in Fig. 7. The AUC values were 0.851 (95% CI: 0.758–0.916) and 0.736 (95% CI: 0.548–0.874) for the training cohort and validation cohort, respectively (Fig. 8a). The sensitivity, specificity, and accuracy for the training cohort were 87.3%, 80.0%, and 0.804, respectively, whereas those for the validation cohort were 83.3%, 74.1%, and 0.738, respectively. The calibration curve (Fig. 8b) showed good calibration in the training (P = 0.93) and validation cohorts (P = 0.82).
TABLE 3.
Fourteen Radiomics Features Selected by Lasso Regression
| Phase | Radiomics name |
|---|---|
| T1 | Original_Shape_Sphericity |
| Log_sigma-0.5mm_GLCM_MaximumProbability | |
| Log_sigma-0.5mm_ FirstOrder _Maximum | |
| Log_sigma-2.0mm_FirstOrder_Kurtosis | |
| Log-sigma-3.0mm_GLSZM_SmallAreaHighGrayLevelEmphasis | |
| Log_sigma-4.0mm_GLCM_Lmc1 | |
| Wavelet_HLL_FirstOrder_90pencentile | |
| Wavelet_LLH_GLCM_ClusterProminence | |
| Wavelet_LLH_GLCM_Idm | |
| Wavelet-LHH _ GLCM _DifferenceAverage | |
| T2 | Wavelet_ LLH _ GLCM _Lmc2 |
| Log_sigma-2.0mm_ GLSZM _ SmallAreaEmphasis | |
| Log_sigma-3.0mm_GLCM_Idn | |
| Log-sigma-4.0mm_ GLCM _ MaximumProbability |
FIGURE 7:
Visualization of the radiomics model.
FIGURE 8:
ROC curves and calibration curve of the radiomics score. (a) ROC curves; (b) Calibration curves. ROC, receiver operating characteristic; AUC, area under the curve.
The mixed model, which combined the radiomics signature and 14 imaging features, yielded AUC values of 0.870 (95% CI: 0.783–0.930) and 0.701 (95% CI: 0.517–0.852). There was no significant deference between the radiomics model and the mixed model (P = 0.521).
Clinical Utility
The DCA showed that if the threshold probability is 0.17–0.84, using LDA in the current study to distinguish NF-pNET grade is more beneficial than the treat-all-patients scheme or the treat-none scheme (Fig. 9).
FIGURE 9:
DCA for the radiomics score. y-axis represents the net benefit. The red line represents the radiomics score. The blue line represents the hypothesis that all patients had G2/3 NF-pNETs. The black line represents the hypothesis that all patients had G1 NF-pNETs. The x-axis represents the threshold probability, which is where the expected benefit of treatment is equal to the expected benefit of avoiding treatment. The decision curves in the validation cohort show that if the threshold probability is 0.17–0.84, the radiomics score developed in the current study to predict the grade of NF-pNETs adds more benefit than the treat-all or treat-none scheme. DCA, decision curve analysis; NF-pNETs, nonfunctioning pancreatic neuroendocrine tumors.
Discussion
We successfully predicted the tumor grade using the LDA classifier established by the analysis of pNETs radiomics features obtained from noncontrast T1WI and T2WI. The individualized prediction model showed good discrimination in the training cohort and validation cohort in addition to showing good calibration. DCA indicated the clinical usefulness of LDA.
Many researchers have studied the correlation between the imaging features and tumor grade. A study by Yamada et al,17 which included 37 patients with pNETs, showed that the CT enhancement in the pancreatic phase, irregularity, vessel involvement, and cystic degeneration/necrosis were strong predictors of G2 pNETs. However, Yamada et al’s study was a small-scale study and aimed to diagnose G1 and G2 tumors but not G3 tumors. Kim et al16,31 performed a multivariate analysis of the MSCT features of 161 patients with pNETs; they reported that the largest diameter (>3 cm), portal venous enhancement rate (≤1.1), and liver metastasis were more suggestive of poor prognosis and that the portal enhancement ratio showed high sensitivity and specificity (92.3% and 80.5%, respectively) in differentiating G3 from G1/2 pNETs. Toshima et al32 performed a study regarding the correlation between CT and MRI features and tumor grade; using univariate analysis, the study showed that the maximum diameter of the tumor, tumor shape, enhancement pattern, cystic degeneration, and apparent diffusion coefficient (ADC) were helpful in the determination of G1/2 and G3 tumors, and using a multivariate regression analysis they showed that a lower ADC ratio (ADC value of the lesion/ADC value of the parenchyma < 0.94), nonuniform enhancement, lobulated mass, and high signal intensity on T2WI suggest a diagnosis of G3 tumor. Kim et al’s and Toshima et al’s studies focused on differentiating of G1/2 and G3 tumors, but they reported that G2 and G3 pNETs showed a poorer prognosis than G1 pNETs. A study by Kulali et al,33 which included 30 patients with pNETs, showed that 1) all high- and intermediate-grade pNETs tended to show low to intermediate signal intensity on T2WI; 2) low-grade pNETs showed statistically higher arterial enhancement than intermediate- and high-grade pNETs; and 3) ADC values in high-grade pNETs were significantly lower than those of low- and intermediate-grade pNETs. Kim et al34 found that ill-defined borders and hypointense signals on venous and delayed-phase imaging were common findings of higher-grade pNETs and that the ADC value was helpful for differentiating G1 pNETs from G2 pNETs. However, Kulali et al’s and Kim et al’s studies were small-scale studies that included 30 and 39 patients, respectively.
Our current study showed that the tumor size, phase of peak enhancement value, and vascular invasion were significantly different between G1 and G1/2 pNETs, and these results are consistent with the above results. However, there was no significant difference in T2 signal intensity and margin between G1 and G1/2 pNETs. Furthermore, our study developed a multivariable logistic regression model, which included all 14 MRI characteristics and yielded an AUC of 0.769 in the training cohort and 0.729 in the validation cohort. Compared with previous studies, we hypothesized that the distribution of grades, the numbers of the patients, research purpose, and different WHO guidelines may have been responsible for the differences between the current study and the published studies.
Few previous studies have used radiomics for pNET grading. Canellas et al21 established a logistic regression model to predict tumor grade by combining the imaging features of pNET with the texture features of cross-sectional CT images in the portal venous phase. The features included in the model were tumor diameter, vascular invasion, pancreatic duct dilation, lymphatic metastasis, and entropy. The accuracy of the model in predicting G1 and G2/3 tumors was 79.3%. Choi et al22 summarized the imaging features of 66 patients with pNET (45 patients with G1 tumors and 21 patients with G2/3 tumors) and extracted the texture features of the cross-sectional images of the arterial and portal venous phases to establish logistic regression models. The model suggested that ill-defined tumor borders, lower values of 2D-sphericity, 3D-skewness, 3D-sphericity in the arterial phase, a lower 2D-kurtosis value, a larger 2D-sphericity value, and lower values of 3D-surface area and 3D-sphericity in the portal venous phase were more likely to be suggestive of G2/3 tumors. Choi et al’s model is better at determining tumor grade (AUC = 0.77) than is the method using simple imaging features (AUC = 0.68). Gu et al23 developed nomograms incorporating tumor margin and the fusion CT radiomics signature to discriminate G1 and G2/G3 tumors; this model yielded AUCs of 0.974 and 0.902 in the training and validation cohorts, respectively. Another similar study included 137 patients from two hospitals and developed a combined nomogram including clinical characteristics and CT radiomics signatures to differentiate G1 and G2/3 tumors; it showed the best performance (training set: AUC = 0.907; validation set: AUC = 0.891).24 However, radiomics features were extracted from MSCT in the above studies, and the studies on MRI-based radiomics features are very rare. Gao and Wang25 used MR-T1WI radiomics features of 96 patients with pNETs to develop the convolutional neural network (CNN) model and to predict pNET grade; the average accuracy and AUC were 85.13% and 0.9117, respectively, in the cross-validation. The current study constructed the LDA classifier, which consisted of 14 selected radiomics approaches of noncontrast T1WI and T2WI and showed good discrimination in the training cohort (AUC = 0.851) and in the validation cohort (AUC = 0.736). The LDA classifier was superior to the clinical model. This LDA-based radiomics of noncontrast T1WI and T2WI could provide a convenient way for the rapid preoperative pNET grade screening.
To assess the models beyond the purely mathematical perspective provided by performance measures such as the AUC, DCA was used to estimate the predicted net benefit of the model across all possible risk thresholds and to thereby evaluate the effects of various risk thresholds.35,36 DCA showed that if the threshold probability was 0.17–0.84, the use of the radiomics score for grading NF-pNETs provided more benefit than the treat-all-patients or the treat-none schemes.
Limitations
The current study has some limitations. First, the current study was a retrospective study. In future studies, we need to increase the number of patients to verify the stability of the model. Second, the number of patients with G3 pNET was relatively small (only eight patients). However, considering that pNET is a relatively rare type of pancreatic tumor, according to published data in the literature, the number of patients in the current study was acceptable. Lastly, our study included only surgically proven patients with pNET; those with pNET confirmed by EUS-FNA were excluded, because postoperative pathology is more accurate than EUS-FNA.
Conclusion
We have developed a machine-learning prediction model to improve diagnostic accuracy and help in clinical decisions. The noncontrast MRI can provide more convenient grade screening.
Supplementary Material
Acknowledgments
Contract grant sponsor: National Natural Science Foundation of China; Contract grant numbers: U1809205, 61771249, 81871352, 91959207; Contract grant sponsor: National Science Foundation for Young Scientists of China; Contract grant numbers: 81701689, 81601468; Contract grant sponsor: 63-class General Financial Grant from the China Postdoctoral Science Foundation; Contract grant number: 2018M633714; Contract grant sponsor: Key Junior College of National Clinical of China, Shanghai Technology Innovation Project 2017 on Clinical Medicine; Contract grant number: 17411952200; Contract grant sponsor: Project of Precision Medical Transformation Application of NMMU; Contract grant number: 2017JZ42; Contract grant sponsor: Top Project of the Military Medical Science and Technology Youth Training Program; Contract grant number: 17QNP017; Contract grant sponsor: Natural Science Foundation of Jiangsu Province of China; Contract grant number: BK20181411; Contract grant sponsor: National Cancer Institute of the National Institutes of Health; Contract grant numbers: 1U24CA199374-01, R01CA202752-01A1, R01CA208236-01A1, R01 CA216579-01A1, R01 CA220581-01A1, 1U01 CA239055-01; Contract grant sponsor: National Institute for Biomedical Imaging and Bioengineering; Contract grant number: 1R43EB028736-01; Contract grant sponsor: National Center for Research Resources; Contract grant number: 1C06 RR12463-01; Contract grant sponsor: VA Merit Review Award, Contract grant number: IBX004121A, from the United States Department of Veterans Affairs Biomedical Laboratory Research and Development Service; Contract grant sponsor: DoD Breast Cancer Research Program Breakthrough Level 1 Award; Contract grant number: W81XWH-19-1-0668; Contract grant sponsor: DOD Prostate Cancer Idea Development Award; Contract grant number: W81XWH-15-1-0558; Contract grant sponsor: DOD Lung Cancer Investigator-Initiated Translational Research Award; Contract grant number: W81XWH-18-1-0440; Contract grant sponsor: DOD Peer Reviewed Cancer Research Program; Contract grant number: W81XWH-16-1-0329; Contract grant sponsor: Ohio Third Frontier Technology Validation Fund; Contract grant sponsor: Wallace H. Coulter Foundation Program in the Department of Biomedical Engineering; Contract grant sponsor: Clinical and Translational Science Award Program (CTSA) at Case Western Reserve University.
Footnotes
Additional supporting information may be found in the online version of this article
REFERENCES
- 1.Fraenkel M, Kim MK, Faggiano A, Valk GD. Epidemiology of gastroenteropancreatic neuroendocrine tumours. Best Pract Res Clin Gastroenterol 2012;26(6):691–703. [DOI] [PubMed] [Google Scholar]
- 2.Lawrence B, Gustafsson BI, Chan A, Svejda B, Kidd M, Modlin IM. The epidemiology of gastroenteropancreatic neuroendocrine tumors. Endocrinol Metab Clin North Am 2011;40(1):1–18. vii. [DOI] [PubMed] [Google Scholar]
- 3.Zhou J, Enewold L, Stojadinovic A, et al. Incidence rates of exocrine and endocrine pancreatic cancers in the United States. Cancer Causes Control 2010;21(6):853–861. [DOI] [PubMed] [Google Scholar]
- 4.Sumiyoshi H, Matsushita A, Nakamura Y, Yamahatsu K, Katsuno A, Uchida E. Radical resection of a locally advanced pancreatic tail adenosquamous carcinoma treated with S-1 and gemcitabine as neoadjuvant chemotherapy — A case report. Gan To Kagaku Ryoho 2014; 41(5):669–672. [PubMed] [Google Scholar]
- 5.Milione M, Maisonneuve P, Spada F, et al. The clinicopathologic heterogeneity of grade 3 gastroenteropancreatic neuroendocrine neoplasms: Morphological differentiation and proliferation identify different prognostic categories. Neuroendocrinology 2017;104(1): 85–93. [DOI] [PubMed] [Google Scholar]
- 6.Basturk O, Yang Z, Tang LH, et al. The high-grade (WHO G3) pancreatic neuroendocrine tumor category is morphologically and biologically heterogenous and includes both well differentiated and poorly differentiated neoplasms. Am J Surg Pathol 2015;39(5):683–690. [DOI] [PMC free article] [PubMed] [Google Scholar]
- 7.Sorbye H, Welin S, Langer SW, et al. Predictive and prognostic factors for treatment and survival in 305 patients with advanced gastrointestinal neuroendocrine carcinoma (WHO G3): The NORDIC NEC study. Ann Oncol 2013;24(1):152–160. [DOI] [PubMed] [Google Scholar]
- 8.Ricardo V Lloyd RYO, Günter Klöppel, Juan Rosai. WHO Classification of Tumours of Endocrine Organs. Lyon, France: International Agency for Research on Cancer; 2017. [Google Scholar]
- 9.Panzuto F, Boninsegna L, Fazio N, et al. Metastatic and locally advanced pancreatic endocrine carcinomas: Analysis of factors associated with disease progression. J Clin Oncol 2011;29(17):2372–2377. [DOI] [PubMed] [Google Scholar]
- 10.Boutsen L, Jouret-Mourin A, Borbath I, van Maanen A, Weynand B. Accuracy of pancreatic neuroendocrine tumour grading by endoscopic ultrasound-guided fine needle aspiration: Analysis of a large cohort and perspectives for improvement. Neuroendocrinology 2018;106(2): 158–166. [DOI] [PubMed] [Google Scholar]
- 11.Larghi A, Capurso G, Carnuccio A, et al. Ki-67 grading of nonfunctioning pancreatic neuroendocrine tumors on histologic samples obtained by EUS-guided fine-needle tissue acquisition: A prospective study. Gastrointest Endosc 2012;76(3):570–577. [DOI] [PubMed] [Google Scholar]
- 12.Strobel O, Hinz U, Gluth A, et al. Pancreatic adenocarcinoma: Number of positive nodes allows to distinguish several N categories. Ann Surg 2015;261(5):961–969. [DOI] [PubMed] [Google Scholar]
- 13.Kang J, Ryu JK, Son JH, et al. Association between pathologic grade and multiphase computed tomography enhancement in pancreatic neuroendocrine neoplasm. J Gastroenterol Hepatol 2018;33(9):1677–1682. [DOI] [PubMed] [Google Scholar]
- 14.Belousova E, Karmazanovsky G, Kriger A, et al. Contrast-enhanced MDCT in patients with pancreatic neuroendocrine tumours: Correlation with histological findings and diagnostic performance in differentiation between tumour grades. Clin Radiol 2017;72(2):150–158. [DOI] [PMC free article] [PubMed] [Google Scholar]
- 15.Cappelli C, Boggi U, Mazzeo S, et al. Contrast enhancement pattern on multidetector CT predicts malignancy in pancreatic endocrine tumours. Eur Radiol 2015;25(3):751–759. [DOI] [PubMed] [Google Scholar]
- 16.Kim DW, Kim HJ, Kim KW, et al. Neuroendocrine neoplasms of the pancreas at dynamic enhanced CT: Comparison between grade 3 neuroendocrine carcinoma and grade 1/2 neuroendocrine tumour. Eur Radiol 2015;25(5):1375–1383. [DOI] [PubMed] [Google Scholar]
- 17.Yamada S, Fujii T, Suzuki K, et al. Preoperative identification of a prognostic factor for pancreatic neuroendocrine tumors using multiphase contrast-enhanced computed tomography. Pancreas 2016;45(2): 198–203. [DOI] [PubMed] [Google Scholar]
- 18.Lambin P, Rios-Velazquez E, Leijenaar R, et al. Radiomics: Extracting more information from medical images using advanced feature analysis. Eur J Cancer 2012;48(4):441–446. [DOI] [PMC free article] [PubMed] [Google Scholar]
- 19.Kumar V, Gu Y, Basu S, et al. Radiomics: The process and the challenges. Magn Reson Imaging 2012;30(9):1234–1248. [DOI] [PMC free article] [PubMed] [Google Scholar]
- 20.Hastie T, Friedman J. The elements of statistical learning: Data mining, inference, and prediction. New York: Springer; 2009. [Google Scholar]
- 21.Canellas R, Burk KS, Parakh A, Sahani DV. Prediction of pancreatic neuroendocrine tumor grade based on CT features and texture analysis. AJR Am J Roentgenol 2018;210(2):341–346. [DOI] [PubMed] [Google Scholar]
- 22.Choi TW, Kim JH, Yu MH, Park SJ, Han JK. Pancreatic neuroendocrine tumor: Prediction of the tumor grade using CT findings and computerized texture analysis. Acta Radiol 2018;59(4):383–392. [DOI] [PubMed] [Google Scholar]
- 23.Gu D, Hu Y, Ding H, et al. CT radiomics may predict the grade of pancreatic neuroendocrine tumors: A multicenter study. Eur Radiol 2019; 29(12):6680–6890. [DOI] [PubMed] [Google Scholar]
- 24.Liang W, Yang P, Huang R, et al. A combined nomogram model to preoperatively predict histologic grade in pancreatic neuroendocrine tumors. Clin Cancer Res 2019;25(2):584–594. [DOI] [PubMed] [Google Scholar]
- 25.Gao X, Wang X. Deep learning for World Health Organization grades of pancreatic neuroendocrine tumors on contrast-enhanced magnetic resonance images: A preliminary study. Int J Comput Assist Radiol Surg 2019;14(11):1981–1991. [DOI] [PubMed] [Google Scholar]
- 26.Watanabe H, Okada M, Kaji Y, et al. New response evaluation criteria in solid tumours-revised RECIST guideline (version 1.1). Gan To Kagaku Ryoho 2009;36(13):2495–2501. [PubMed] [Google Scholar]
- 27.Gielen JJSVD. Bias field correction for MRI images. Berlin: Springer, 2005. p 543–551. [Google Scholar]
- 28.Cohen M, Dubois R, Zeineh MM. Rapid and effective correction of RF inhomogeneity for high field magnetic resonance imaging. Hum Brain Mapp 2015;10(4):204–211. [DOI] [PMC free article] [PubMed] [Google Scholar]
- 29.Madabhushi A, Udupa JK. New methods of MR image intensity standardization via generalized scale. Med Phys 2006;33(9):3426–3434. [DOI] [PubMed] [Google Scholar]
- 30.Campbell F, Verbeke CS. Pathology of the pancreas: A practical approach. London: Springer; 2013. p 27–43. [Google Scholar]
- 31.Kim DW, Kim HJ, Kim KW, et al. Prognostic value of CT findings to predict survival outcomes in patients with pancreatic neuroendocrine neoplasms: A single institutional study of 161 patients. Eur Radiol 2016;26 (5):1320–1329. [DOI] [PubMed] [Google Scholar]
- 32.Toshima F, Inoue D, Komori T, et al. Is the combination of MR and CT findings useful in determining the tumor grade of pancreatic neuroendocrine tumors? Jpn J Radiol 2017;35(5):242–253. [DOI] [PubMed] [Google Scholar]
- 33.Kulali F, Semiz-Oysu A, Demir M, Segmen-Yilmaz M, Bukte Y. Role of diffusion-weighted MR imaging in predicting the grade of nonfunctional pancreatic neuroendocrine tumors. Diagn Interv Imaging 2018;99(5):301–309. [DOI] [PubMed] [Google Scholar]
- 34.Kim JH, Eun HW, Kim YJ, Han JK, Choi BI. Staging accuracy of MR for pancreatic neuroendocrine tumor and imaging findings according to the tumor grade. Abdom Imaging 2013;38(5):1106–1114. [DOI] [PubMed] [Google Scholar]
- 35.Collins GS, Reitsma JB, Altman DG, Moons KG. Transparent reporting of a multivariable prediction model for individual prognosis or diagnosis (TRIPOD): The TRIPOD statement. BJOG 2015;122(3):434–443. [DOI] [PubMed] [Google Scholar]
- 36.Vickers AJ, Elkin EB. Decision curve analysis: A novel method for evaluating prediction models. Med Decis Making 2006;26(6):565–574. [DOI] [PMC free article] [PubMed] [Google Scholar]
Associated Data
This section collects any data citations, data availability statements, or supplementary materials included in this article.


