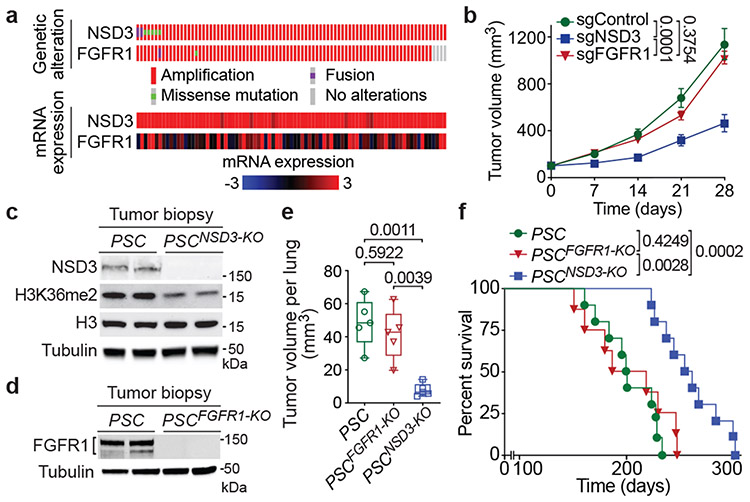
Figure 1. Deletion of NSD3, but not FGFR1, inhibits LUSC tumorigenesis in vivo.
a, Analysis of 8p11-12 amplified LUSC datasets from TCGA indicates increased NSD3, but not FGFR1, mRNA expression correlates with gene amplification (n = 85 patients). b, Depletion of NSD3, not FGFR1, attenuates xenograft growth of the 8p11AMP LUSC cell line H520. Tumor volume quantification of H520 xenografts in immunocompromised mice (n = 5 mice for each group). c, d, Western blots with the indicated antibodies of LUSC tumor lysates from PSC (control), PSCNSD3-KO (c) and PSCFGFR1-KO (d) mutant mice. Two independent and representative samples are shown for each genotype. Tubulin used as a loading control. e, Micro-computed tomography (μCT) analysis of tumor volume of the indicated mouse models (n = 5 mice for each group). In this and subsequent box plots, the line indicates the median, the box marks the 75th and 25th percentiles, and the whiskers minimum and maximum values. All data points are shown. P values determined by two-way ANOVA with Tukey’s post hoc test (b, e). f, Kaplan-Meier survival curves of PSC (n = 10, median survival = 200.5 days), PSCFGFR1-KO (n = 8, median survival = 202.5 days) and PSCNSD3-KO (n = 10, median survival = 257 days) mice, P value determined by log-rank test.

