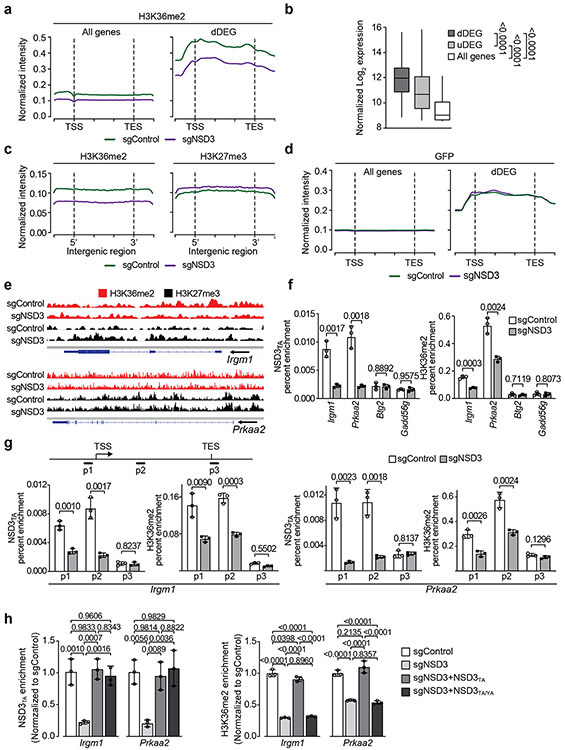
Extended Figure 6. NSD3T1242A-mediated H3K36me2 in LUSC oncogenic reprogramming.
a, Independent CUT&RUN replicate for H3K36me2 as in Figure 3i. b, Normalized gene expression levels from the indicated groups from PSCN cell line RNA-seq datasets. dDEG (downregulated DEGs) and uDEG (upregulated DEGs) from Extended Data Fig. 5j, and all genes. P values indicated determined by two-tailed robust t-test (detailed statistics description in Methods). dDEG n = 234, uDEG n = 229, all genes n = 16091. Boxes: 25th to 75th percentile, whiskers: min. to max., center: median. c, CUT&RUN profile for H3K36me2 and H3K27me3 in PSCN cells ± sgNSD3 over average of intergenic regions on a genome-wide scale. d, CUT&RUN profile for a monoclonal IgG (against GFP) as in Figure 3i for all genes and dDEG as indicated in PSCN cells ±sgNSD3 is shown as a negative control. e, Genome browser view of CUT&RUN signals for H3K36me2 and H3K27me3 on the indicated genes and conditions. Arrow indicates the direction of gene transcription. f, Loss of occupancy of NSD3T1242A and H3K36me2 at the indicated NSD3-target genes (Irgm1 and Prkaa2) upon NSD3 depletion. Btg2 and Gadd45g are not NSD3-target genes and shown as control regions that do not change in response to NSD3 depletion. ChIP-qPCR analysis of V5-NSD3T1242A (top panel) and H3K36me2 (bottom panel) in the body of the indicated genes. The data were plotted as percent enrichment relative to input. Error bars represent mean ± s.d. from three independent experiments. P values indicated determined by two-tailed unpaired t-test. g, NSD3T1242A and H3K36me2 occupy the promoter and gene body regions of target genes Irgm1 and Prkaa2. Top panel, schematic of general gene structure and site of primers for Irgm1 (left panel) and Prkaa2 (right panel) gene loci. ChIP-qPCR analysis of V5-NSD3T1242A (left panel) and H3K36me2 (right panel) in promoter (p1), gene body (p2) and transcription end site (TES; p3) regions of target genes. TSS: transcription start site. The data were plotted as percent enrichment relative to input. Error bars represent mean ± s.d. from three independent experiments. P values indicated determined by two-tailed unpaired t-test. h, ChIP-qPCR analysis of NSD3T1242A (left panel) and H3K36me2 (right panel) occupancy at the gene body regions of Irgm1 and Prkaa2 gene loci in reconstituted cells as described in Extended Data Fig. 5l. The enrichment was normalized to the sgControl sample and presented as fold change relative to the sgControl sample. Error bars represent mean ± s.d. from three independent experiments. P values indicated determined by one-way ANOVA with Tukey’s post hoc test.

