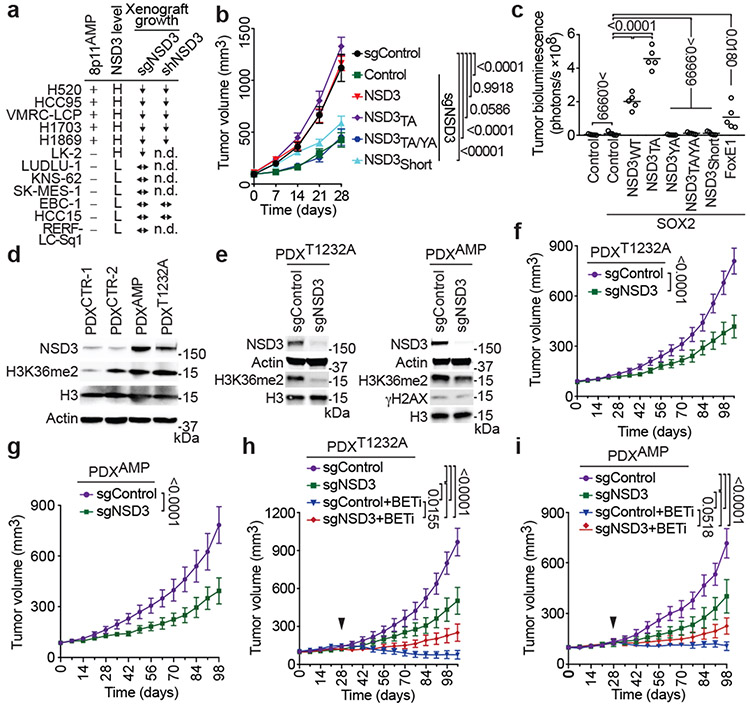
Figure 4. NSD3 promotes human lung cell transformation and xenograft tumor growth of LUSC cells and PDXs and renders PDXs hyper-susceptible to BETi.
a, NSD3 depletion attenuates xenograft tumor growth of 8p11AMP and NSD3-overexpressing LUSC cell lines. Summary of xenograft tumor growth for the indicated cell lines treated with sgNSD3 or shNSD3 as indicated. NSD3 levels: H, high mRNA (Z-score > 1.0); L, low mRNA (Z-score < 1.0), scoring was consistent with relative protein levels (see Extended Data Figs 7a-b); xenograft tumor growth: ↓: reduced; ↔: no change (see Extended Data Figs. 7b-c); n.d., not determined. b, NSD3 catalytic activity required for full H520 xenograft tumor growth. Tumor volume change of H520 xenografts reconstituted with the indicated V5-tagged CRISPR-resistant NSD3 derivatives in immunocompromised mice (n = 5 mice, for each group). c, NSD3WT and NSD3TA transform SOX2-expressing AALE cells in vivo. Quantification of tumor size determined by bioluminescence of AALE cells grafted under the renal capsule and expressing the indicated plasmids plus the AkaLuc reporter (n=5 mice for each group; see Methods). FOXE1 is a positive control, NSD3WT and NSD3TA vs. FOXE1 P < 0.0001. Lines denote median. d, Western blots of lysates from the indicated LUSC PDX samples and using the indicated antibodies. H3 and Actin are loading controls. e, Western blots as in (d) of lysates from PDXT1232A (left) and PDXAMP (right) ±sgNSD3 treatment. f, g, PDX tumor volume quantification of f, PDXT1232A and g, PDXAMP ±sgNSD3 in immunocompromised mice (n = 5 for each group). h, i, Tumor volume quantification of h, PDXT1232A and i, PDXAMP ±sgNSD3 and ±BETi (AZD5153 2.5mg/kg, i.p.) treatments as indicated (n = 5 mice for each group). Control animals received vehicle (placebo) treatment. Arrowhead indicates start of the treatment. P values determined by two-way ANOVA with Tukey’s post hoc test (b, c, h, i) or two-tailed unpaired t-test. (f, g). Data are represented as mean ± s.e.m. (b, f-i).

