


Abstract
Inhibitory control over thoughts, emotions, and actions is challenging for people with Post-Traumatic Stress Disorder (PTSD). Whether specific aspects of inhibitory control are differentially affected in PTSD remains an open question. Here we examined performance on two popular response inhibition tasks in 28 combat Veterans with PTSD and 27 control Veterans. We used a Hybrid variant that intermixed 75% Go trials, 12.5% NoGo trials, and 12.5% Stop trials. Parameters from an ex-Gaussian race model (Matzke, Love, & Heathcote, 2017) provided estimates of stopping speed (μ Stop) and stopping variability (τ Stop). Participants with PTSD had higher error rates on NoGo trials, replicating previous results. The estimated probability of “trigger failures” (failures to launch inhibitory control) on Stop trials was also higher in PTSD patients, suggesting that sustained attention was a common deficit in the two tasks. Stopping variability was also increased in participants with PTSD, which supports a difficulty with maintaining task goals. Conversely, stopping speed did not differ between patients and controls, suggesting that core inhibitory processes were intact. These results demonstrate a dissociation between the speed and reliability of motor response inhibition in PTSD, and suggest that top-down inhibitory control was deployed less consistently in participants with PTSD.
Keywords: Go/NoGo, Stop-Signal, PTSD, Cognitive Control, Executive Control, Response Inhibition
1. Introduction
The inability to inhibit fear responses is a cardinal feature of post-traumatic stress disorder (PTSD), highlighting the importance of emotional control in the etiology and maintenance of this condition (Rauch et al., 2006; van Rooij & Jovanovic, 2018). Many studies have shown that deficits in inhibitory control also extend to neutral environments, affecting highly specific cognitive functions (Vasterling et al., 1998; Falconer et al. 2008; Wu et al., 2010; Swick et al., 2012; DeGutis et al., 2015). Difficulties with both emotional and cognitive control could potentially interfere with routine daily activities and successful treatment response (Aupperle et al., 2012; Crocker et al., 2018; van Rooij & Jovanovic, 2018). Elucidating the precise elements of inhibitory control that are most affected in PTSD may be helpful for refining current therapies. In addition to stopping or refraining from unwanted responses, crucial elements for response inhibition include sustaining attention and maintaining task goals (Matzke et al., 2017a; Esterman et al., 2019). In this study, we investigated whether the component processes of response inhibition are differentially affected by PTSD. We also examined the speed, variability, and reliability of inhibition.
Two major tasks have been used to assess motor response inhibition: the Go/NoGo (GNG) task and the Stop-Signal Task (SST). In the GNG, a motor response is made to one stimulus class and withheld to another. The probability of trial types can be manipulated to set the prepotency of responding, so that withholding a response on NoGo trials is more difficult when Go trials are frequent (Petrides, 1986; Wessel, 2018a). In the SST, responses are made on every trial unless a Stop Signal (e.g., a tone) is presented (Logan et al., 1997). The interval between the Go stimulus and the Stop stimulus (the stop-signal delay) is varied using an adaptive procedure (Verbruggen and Logan, 2008), with a goal of obtaining 50% correct and 50% incorrect responses. Performance is modeled as a “race” between independent Go and Stop “runners” (processes), and the stop-signal reaction time (SSRT) is calculated as a measure of stopping speed.
PTSD has been associated with inhibitory control deficits in a number of studies, but this depends on which task was used and how it was implemented. There is a broad consensus that participants with PTSD find it difficult to withhold responses in the GNG task (Vasterling et al., 1998; Falconer et al. 2008; Wu et al., 2010; Swick et al., 2012; DeGutis et al., 2015; Adams et al., 2017). Studies that did not observe a deficit in PTSD typically used versions of the task that placed low inhibitory demands on the participants, such as a high proportion of NoGo trials and a slower presentation rate (e.g., Carrion et al., 2007; Jovanovic et al., 2013).
Fewer experiments have examined SST performance in participants with PTSD, and the results have been mixed. Veterans with blast-related mild traumatic brain injury (mTBI) + PTSD did not show longer SSRTs than Veterans without either of these conditions (Fischer et al., 2014); nor did the groups show significant differences on any other performance measure. Shu et al. (2014) did not observe a difference in Stop error rates when comparing Veterans with mTBI + PTSD to Veterans with mTBI only. Their adaptation of the task used four short fixed stop-signal delays, which does not permit calculation of SSRT. In a civilian population, Olff et al. (2014) reported slower RTs, fewer errors, and longer SSRTs in PTSD patients than in trauma-exposed controls. Although a standard tracking procedure was used, the PTSD group showed a speed-accuracy trade-off: they were more conservative (40% errors, which deviated from the optimal 50% in controls). Another study used a cued version of the task and found no difference in SSRT (van Rooij et al., 2014). However, the authors did see a reduction in proactive control, the ability to use the contextual cues that predicted the probability of stopping.
Schachar et al. (2007; 2011) conceptualized the two tasks as measures of restraint (GNG), the inhibition of a motor response before the response has been initiated; and cancellation (SST), the inhibition of an already-initiated motor response. These authors found that children with ADHD showed impairments in both restraint and cancellation (Schachar et al., 2007). However, the two task versions were administered in separate blocks, a format that introduces additional strategic and proactive influences into the cancellation task (Raud et al., 2020). In subsequent work, Schachar and colleagues (2011) developed a Hybrid task that intersperses both NoGo trials and Stop trials together with Go trials. This version is advantageous because it is likely to reduce strategic slowing to wait for the stop signal. To our knowledge, no studies have tested the same group of PTSD patients in both Go/NoGo and Stop-Signal tasks.
Further, the current study incorporated a new SSRT model that includes separate parameters for stopping speed and stopping variability (Matzke et al., 2013). The Bayesian ex-Gaussian estimation of stop-signal RT distributions (BEESTS) method (Matzke et al., 2013; Matzke et al., 2017b) considers the entire distribution of Stop RTs (not only the means). This distribution is assumed to have an ex-Gaussian shape (Fig. 1), much like Go RTs for overt responses (Whelan, 2008). RT distributions generally consist of two components: the Gaussian (normal) distribution and an exponential component, the rightward skew or tail consisting of long RTs (Heathcote et al., 1991). The standard ex-Gaussian model uses three parameters to describe the distribution of response times in a given task: mu (μ = mean of normal distribution), sigma (σ = SD of normal distribution), and tau (τ = mean and SD of the exponential tail). In contrast to Go RTs, the latency of “not responding” has no directly measured equivalent. The BEESTS model uses three parameters to describe the distribution of estimated SSRTs: mean (μ Stop) and standard deviation (σ Stop) of the Gaussian component, and a rightward tail (τ Stop) comprising the ex-Gaussian component (see Fig. 1). An increase in μ Stop indicates a slower reaction to the stop signal (resulting in slower initiation of stopping), while increases in σ Stop or τ Stop suggest greater variability in recruiting the stop process (Weigard et al., 2019).
Fig. 1.
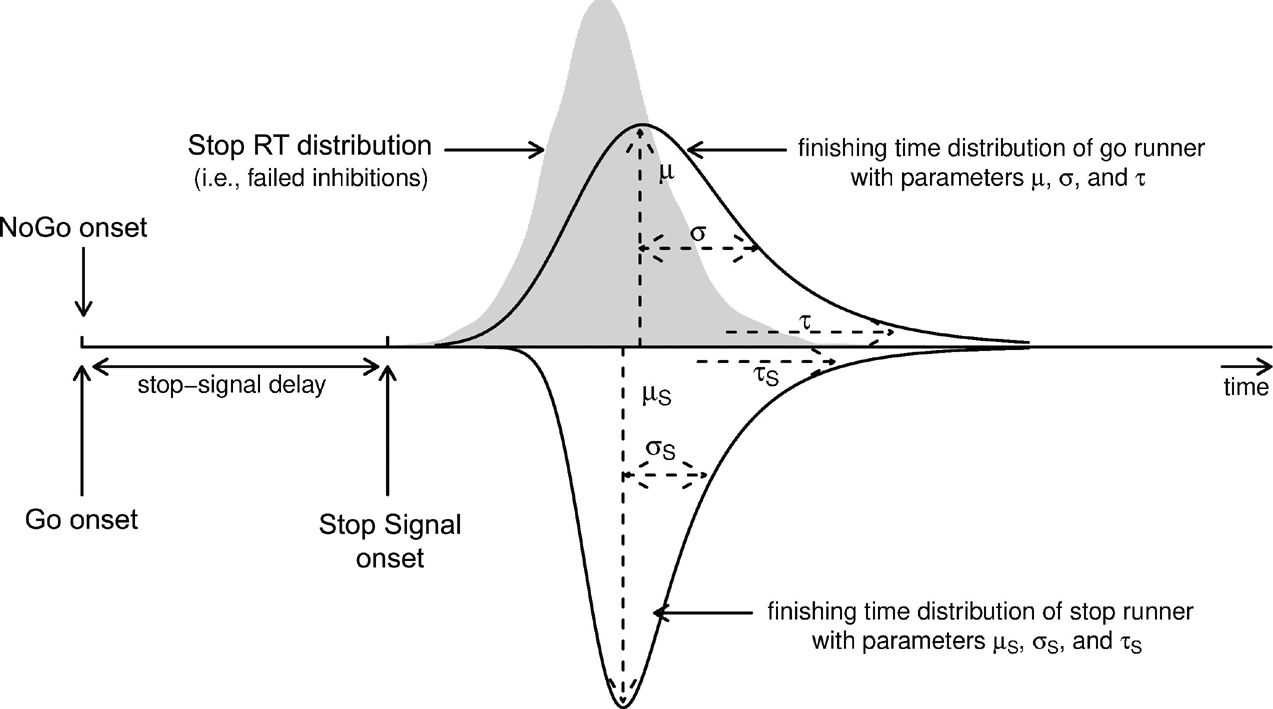
Bayesian ex-Gaussian race model with a go runner and a stop runner (triggered by Go stimuli and Stop stimuli, respectively). NoGo trials are not included in the model. Adapted from Figure 1 of Matzke, Curley, Gong, and Heathcote (2019). Original available at https://www.flickr.com/photos/156287181@N04/28061794878/in/dateposted-public/ under CC BY 2.0 license, https://creativecommons.org/licenses/by/2.0/
The Bayesian ex-Gaussian model has provided novel insights into response inhibition deficits in other patient populations (Matzke et al., 2017a; Weigard et al., 2019). Using this approach, Matzke et al. (2017a) observed that μ Stop was longer in participants with schizophrenia, suggesting they were slower to initiate stopping compared to controls. Children with ADHD showed a different pattern: μ Stop did not differ from controls, but τ Stop was longer (as was τ Go), which may be suggestive of attentional lapses (Weigard et al., 2019).
In addition, standard methods of calculating SSRT do not consider Stop trials where the stopping process is never initiated (“trigger failures”). The existence of these trigger failures (TFs) is inferred by the revised BEESTS-WTF (“with trigger failures”) model (Matzke et al., 2017b). The estimated probability of TF can be compared to the observed probability of NoGo errors of commission. Thus, one advantage of intermixing Stop trials and NoGo trials in our Hybrid design is that errors on the latter can complement the evidence provided by TF, an “unobserved” parameter (Verbruggen et al., 2019). Both types of error speak to the reliability of enacting inhibitory motor control.
We implemented a modified version of the Hybrid task (Schachar et al., 2011) where left and right arrows were presented on a monitor, each requiring a left or right key press unless a tone was also presented (25% of the trials). We predicted that participants with PTSD would show a greater number of NoGo errors compared to controls, replicating previous results. We also expected a greater number of TFs, which would identify a common deficit observed in both tasks. Stopping speed was inconsistently affected in previous studies (Fischer et al., 2014; Olff et al., 2014; van Rooij et al., 2014), and incorporating TFs into the model – which corrects overestimates of SSRT – would make a group difference less likely here. We also examined the relationships between task performance and self-rated PTSD symptoms, and between performance and self-rated cognitive failures (Broadbent et al., 1982). We predicted a correlation between symptom severity and NoGo errors, as in earlier work (Swick et al., 2013), and a possible correlation between symptoms and trigger failures. We had no a priori predictions for the ex-Gaussian parameters, as these were an exploratory avenue of investigation.
2. Methods
2.1. Participants
The participants were 31 combat Veterans with a clinical diagnosis of PTSD, and 29 age-matched control Veterans. The data from two participants with PTSD were excluded because of excessive errors on the stop-signal task (90% errors, 100% errors). A third patient was excluded for excessive slowing that prevented calculation of an accurate SSRT. One control was excluded after a past mTBI came to light, and another was excluded for pressing the wrong keys mid-way through. Thus, the reported results include 28 in the PTSD group (26 male) and 27 in the control group (24 male).
PTSD diagnosis was based on the Clinician-Administered PTSD Scale (CAPS) or semi-structured clinical interview using DSM-5 criteria (APA, 2013). In all cases, PTSD was due to combat exposure in Iraq and/or Afghanistan. Common psychiatric comorbidities (e.g., depression, generalized anxiety) were allowed. A history of mild TBI was also allowed, because many PTSD patients in this population also have mTBI(s) due to blast exposure (Carlson et al., 2011). Mild TBI was diagnosed based on standard criteria: loss of consciousness (LOC) ≤30 min or altered mental status; post-traumatic amnesia <24 hrs (Management of Concussion/mTBI Working Group, 2009). Among the PTSD patients, 17 had experienced one or more incidents of probable mTBI and 11 reported no mTBI history. PTSD patients with and without mTBI showed no significant differences in performance (p’s ranged from 0.370 to 0.933).
The exclusion criteria included severe cognitive dysfunction or dementia; history of neurodevelopmental disorders; severe psychiatric problems (schizophrenia, bipolar disorder, schizoaffective disorder); ongoing illicit drug or alcohol abuse; history of other (non-TBI) neurological disorders; current medical illnesses that may alter mental status or disrupt participation in the study; central motor or visual deficits. The exclusion criteria above also applied to control participants. Other exclusionary conditions for controls included a history of TBI or PTSD, and current depression or anxiety.
The controls tended to be older [t(50.31)= 1.885, p=0.065] and to have more years of education [t(46.62)= 2.449, p=0.018]. The latter is due to the fact that many Veterans with PTSD are unable to return to school after their military service, and is typical of studies on this population (e.g., Mac Donald et al., 2017). However, the major performance indices were not significantly associated with years of education, as indicated by Spearman correlations (rho ranged from −0.016 to −0.181). One measure of performance variability was positively correlated with education, although not significantly (rho=0.226). See Table 1 for details on demographic data.
Table 1.
Demographic information and symptom severity scores for participants with PTSD and Controls.
| PTSD (n=28) | Controls (n=27) | |
|---|---|---|
| Age (yrs) | 34.46 (7.08) n.s | 38.48 (8.62) |
| Education (yrs) | 14.18 (1.47)* | 15.37 (2.08) |
| Handedness | 25 R, 2 L, 1 amb | 21 R, 6 L |
| PCL-5 | 48.75 (16.49) *** | 8.33 (7.36) |
| • intrusion | 12.11 (4.88)*** | 2.15 (2.21) |
| • avoidance | 5.18 (2.55)*** | 0.96 (1.56) |
| • negative cognitions | 15.46 (7.32)*** | 2.33 (2.63) |
| • increased arousal | 16.00 (5.11)*** | 2.89 (3.29) |
| BDI | 21.14 (11.67)*** | 5.41 (3.47) |
| CFQ | 60.04 (15.86)*** | 31.70 (10.35) |
Note: The means (standard deviations) are shown for age, education, PCL-5, and BDI.
n.s. = not significantly different from controls;
significantly different from controls at p<.05;
p<.001. R = right, L = left; amb = ambidextrous; PCL-5 = PTSD checklist for DSM-5; BDI = Beck Depression Inventory; CFQ = Cognitive Failures Questionnaire.
The Institutional Review Board of the VA Northern California Health Care System approved the protocol. Participants completed informed consent documents before starting the experiment. They were paid $20/hour for their participation plus transportation expenses. All procedures were conducted in accordance with the Declaration of Helsinki.
2.2. Task
The response inhibition task was a mixed-trial or “Hybrid” variant that incorporated both Stop and NoGo trials, adapted from the Hybrid Stop Task of Schachar et al. (2011). Key differences between the original version and our modification are outlined in the Discussion. There were three types of trials: 75% Go, 12.5% Stop, and 12.5% NoGo, randomly intermixed. For the Stop trials, we used an adaptive staircase procedure and computed the stop signal reaction time (SSRT) for each subject, as described below. Each trial started with a fixation cross in the center of the display (exposure duration = 250 ms), which served as a warning, followed 500 ms later by an arrow (target stimulus, exposure duration = 200 ms) positioned above the fixation and pointing either to the left or to the right with 50% probability. The participant’s task was to respond to the arrow by pressing either the Ins (left) or Del (right) keys on the numberpad of a keyboard with the index and middle fingers of the preferred hand. Subjects were told to respond with a key press as fast as they could, but that if they heard a tone, to stop, and that stopping and going were equally important. On Stop trials, a 1000 Hz tone (the stop signal, duration = 200 ms) indicated that the response should be withheld on that trial. The stop signal followed the stimulus with a delay that varied according to performance accuracy. The stop-signal delay (SSD) was determined by a staircase that started at 250 ms (Schachar et al., 2011). If the participant stopped the response, the delay was increased by 50 ms and the trial was considered correct. If the participant did not stop, the delay was decreased by 50 ms, and the trial was considered a Stop error. In the NoGo condition, the stop signal always occurred at the same time as the arrow. Responses on NoGo trials were considered NoGo errors. On Go trials, no tone occurred. Go trials with no response were considered “misses” and responses to the wrong direction were Go errors. A fixed interval of 2026.8 ms occurred between the onset of one trial to the onset of the next. The total number of trials was 640, with 480 Go, 80 Stop, and 80 NoGo trials, with self-paced rest periods occurring every 80 trials. The main task was preceded by a practice block of 32 trials.
2.3. Self-Report Questionnaires
All participants completed behavioral questionnaires after the session. The PTSD Checklist for DSM-5 (PCL-5) is a 20-item self-report measure that assesses the 20 DSM-5 symptoms of PTSD and may be used for screening, provisionally diagnosing, or monitoring symptom change of PTSD (Weathers, et al., 2013). It has four clusters or subsets: intrusion, avoidance, negative alterations in cognition, and alterations in arousal. Symptoms are rated on a 0 to 4 scale. Validation studies suggest that PTSD is present at a cut-point of 33 or greater on the PCL-5 (Weathers, et al., 2013). The Beck Depression Inventory (BDI) is a commonly used self-report screen for major depressive disorder and has been validated with well-established psychometric properties (Beck et al., 1988). The Cognitive Failures Questionnaire (CFQ) is a 25-item Likert-type scale used to assess the frequency with which people experience cognitive failures in everyday life (Broadbent et al., 1982). Subjects rate how often such experiences have happened to them in the last 6 months on a scale of 0 (“Never”) to 4 (“Very often”) for items such as, “Do you forget where you put something like a newspaper or a book?” As expected, the two groups showed highly divergent scores on these questionnaires (Table 1), indicating higher levels of PTSD, depression, and cognitive failures in the patients.
2.4. Data Analysis
Mean reaction times (RTs) on Go trials were determined using correct responses only; RTs below 100 ms and above 1250 ms were omitted. This resulted in an average of 2.4 Go trials (out of 480) removed in patients and 0.9 Go trials removed in controls. RT variability on Go trials was measured using the intra-individual coefficient of variation (ICV = SD/mean RT) for each participant, which corrects for any baseline differences in RTs.
SSRTs were initially estimated using the integration method (Band et al., 2003; Boehler et al., 2012): Go RTs were rank-ordered, and the RT value (percentile) closest to the percentage of failed inhibitions was identified. Then the mean Stop-Signal Distribution (SSD) was subtracted from this value to determine the “classic” SSRT. For example, the RT at the 45th percentile for a participant with 45% Stop errors would be identified. Although the SSD tracking procedure aims for 50% errors, this ideal isn’t always attained. The integration method accounts for Stop error rates that deviate from 50%, which can be the case for extremely impulsive responders or for participants who strategically slow down to wait for the stop signal.
2.5. Hierarchical Bayesian Model of SSRT
The Bayesian Estimation of ex-Gaussian Stop-Signal Reaction Time Distribution With Trigger Failures (BEESTS-WTF) model was applied to each group separately (see Matzke et al., 2017b for details). The program is freely available at http://dora.erbe-matzke.com/software.html. In brief, the BEESTS model considers Go RTs and Stop-Signal RTs as random variables (Matzke et al., 2013). If the incipient Go RT is slower than SSD + SSRT on a given Stop trial, the response is inhibited. If the Go RT is faster than SSD + SSRT on a Stop trial, the Go response cannot be inhibited and a Stop error occurs (Fig. 1). BEESTS treats the distribution of RTs on failed Stop trials as a “censored” Go RT distribution. The censoring point is randomly drawn from the SSRT distribution on each Stop-Signal trial. Estimation of the SSRT distribution involves simultaneously estimating the Go RT distribution and its censoring distribution. The model assumes that both Go RTs and SSRTs follow an ex-Gaussian distribution, as described earlier. The ex-Gaussian model was augmented by a parameter which estimated the probability that the stopping process was not triggered at all (TF).
In the hierarchical Bayesian approach, the between-subject variability of the parameters is explicitly modeled with group-level distributions (rather than estimating parameters separately for each participant). The group-level distributions act as priors (i.e., existing knowledge of parameters) to adjust extreme estimates to more moderate values (Matzke et al., 2017b). The hierarchical approach allows estimation of both group-level and individual-level parameters, and provides more accurate estimates for individuals. We used the default program settings of weakly informative priors, with limits set to avoid the estimation of impossible values. The resulting posterior distributions quantified knowledge about the parameters after the data have been observed (Matzke et al., 2019). The central tendency of the posterior (here the mean) was used as a point estimate for a given parameter in each individual. Simulation studies using comparable numbers of trials and participants to the present study found that parameter recovery and posterior predictive model checks were adequate (Matzke et al., 2017b). This approach has been applied successfully to other clinical populations, namely groups with schizophrenia (Matzke et al., 2017a) and ADHD (Weigard et al., 2019).
2.6. Statistical Analysis
Statistical tests were performed using JASP statistical software version 0.8.6 (JASP Team, 2020). Between-group comparisons for the major performance measures were conducted using Welch’s independent samples t-tests. The adjusted degrees of freedom are reported. Correlations between the performance measures and PTSD symptom severity (PCL-5 scores), and between performance and self-rated cognitive failures (CFQ), were conducted using Spearman’s rank order correlations. To control for type I error due to multiple comparisons, the Benjamini and Hochberg (1995) false discovery rate (FDR) method was used, and corrected α = 0.05 was considered significant and noted in the Tables. The uncorrected p-values are reported in the text.
2.7. Bayesian Statistical Analysis
We also quantified the strength of evidence for group differences using Bayesian hypothesis tests. Bayes Factors (BF10) were calculated using JASP. BF10 < 1 provides evidence in favor of the null hypothesis (H0), while BF10 > 1 favors the alternate hypothesis (H1). For convenience, we include the qualitative descriptors of Wagenmakers et al. (2018).
3. Results
3.1. Go Trials
RTs on correct Go trials (hits) did not show a significant difference between groups, t(52.86)= −0.665, p=0.509 (see Table 2 for group means and standard deviations (SD), as well as Cohen’s d and 99% confidence intervals). Nor did response variability (ICV) differ between groups, t(46.97)= 1.115, p=0.271. In general, errors on Go trials were quite low (1.06% for controls, 2.56% for patients). For completeness, we report group comparisons for Go errors (pressing the wrong arrow key), t(31.49)=1.810, p=0.080, d=0.481, and Go misses (no response), t(36.07)=2.020, p=0.051, d=0.538 (1.41% for controls, 3.52% for patients). Although misses (omission errors) are often used to assess deficits in sustained attention, floor effects prevent any meaningful conclusions here. Notably, ten controls and nine patients had two or less omission errors.
3.2. Stop Trials
The classic measure of SSRT suggested that Veterans with PTSD required a greater amount of time to stop a prepared response in comparison to control Veterans, t(51.19)= 2.336, p=0.023 (Table 2a). Likewise, PTSD patients made more errors on Stop trials than controls, t(34.14)= 2.079, p=0.045. The 99% confidence interval contained zero for both comparisons, however (and neither test reached the corrected level of significance). Most importantly, the posterior probability of Stop trials with trigger failures was significantly higher in the PTSD group t(37.96)= 2.928, p=0.006 (Table 2b).
Table 2a.
Means and Standard Deviations (SD) for Standard Performance Measures in Post-Traumatic Stress Disorder (PTSD) and Control Groups, along with effect sizes (Cohen’s d), Confidence Intervals (for mean differences), and Bayes Factors (BF10).
| PTSD | Controls | Cohen’s d | Lower | Upper | BF10 | |
|---|---|---|---|---|---|---|
| Go correct RT | 452.17 (98.54) | 469.09 (90.12) | −0.179 | −84.922 | 51.078 | 0.327 |
| Go ICV | 0.259 (0.049) | 0.242 (0.068) | 0.301 | −0.025 | 0.061 | 0.458 |
| NoGo errors | 15.65 (16.87) | 6.08 (6.81) | 0.744 * | 0.196 | 18.945 | 5.504+ |
| Stop errors | 52.66 (7.77) | 49.41 (2.80) | 0.557 | −1.015 | 7.516 | 1.508 |
| SSRT | 203.86 (54.37) | 172.96 (43.29) | 0.629 | −4.487 | 66.296 | 2.437 |
Note. Means are in milliseconds for RT (reaction time) measures and in percentages for error rates. An equation (ICV = SD/mean RT) was used to determine ICV (intra-individual coefficient of variation). Stop-signal reaction time (SSRT) was estimated using the integration method. Welch’s t-tests were used, and variables that survived False Discovery Rate (FDR) correction for multiple comparisons are noted:
p<0.05.
BF10 > 1 favors H1 and < 1 favors H0.
Mild evidence in favor of H1.
Table 2b.
Means and Standard Deviations (SD) for the Bayesian Ex-Gaussian Estimation of Stop-Signal RT distributions with Trigger Failures in PTSD and Control Groups, along with effect sizes (Cohen’s d), Confidence Intervals, and Bayes Factors (BF10).
| PTSD | Controls | Cohen’s d | Lower | Upper | BF10 | |
|---|---|---|---|---|---|---|
| μ Stop | 141.51 (22.82) | 141.32 (22.30) | 0.008 | −17.420 | 15.23 | 0.272# |
| σ Stop | 25.11 (2.87) | 30.57 (14.18) | −0.534 | −12.681 | 2.21 | 1.390 |
| τ Stop | 36.16 (9.87) | 25.04 (6.32) | 1.341*** | 6.515 | 18.75 | 2063++++ |
| TF | 18.81 (14.26) | 10.12 (6.47) | 0.785* | 0.005 | 0.166 | 7.641++ |
| SSRTB | 177.67 (31.26) | 166.36 (27.39) | 0.385 | −9.711 | 32.786 | 0.628 |
Note. Means are in milliseconds for RT (reaction time) measures and probabilities for Trigger Failures (TF). Bayesian Stop-signal reaction time (SSRTB = μ Stop + τ Stop) estimated using BEESTS-WTF 2.0 (Matze et al., 2017b). Welch’s t-tests were used, and variables that survived FDR correction for multiple comparisons are noted:
p<0.05,
p≤0.005.
BF10 > 1 favors H1 and < 1 favors H0.
Moderate evidence in favor of H1,
Extreme evidence in favor of H1,
Mild evidence in favor of H0.
3.3. NoGo Trials
Veterans with PTSD also made significantly more errors on NoGo trials than controls, t(35.84)= 2.777, p=0.009. To compare failures to initiate the stopping process on NoGo vs. Stop trials, a repeated measures ANOVA was conducted with factors of Error Type and Group (see Fig. 2). The main effect of Error Type revealed that the estimated probability of TFs was higher than the observed probability of NoGo errors in the PTSD and control participants alike [F(1,53)=16.192, p=0.0002, η2p = 0.234]. There was also a main effect of Group [F(1,53)= 8.497, p=0.005, η2p = 0.138], but no Error Type × Group interaction [F(1,53)= 0.242, p=0.625, η2p = 0.625]. Furthermore, TFs and NoGo errors were so highly correlated (r = 0.877, p<0.0001) that it’s likely they reflect a slip-up (lapse) in the same cognitive process.
Fig. 2.

Errors Involving a Failure to Activate the Stopping Process in Participants with PTSD and Controls. Errors of commission on NoGo trials, compared to estimated Trigger Failures on Stop trials.
3.4. ex-Gaussian Stop Parameters
Three parameters described the estimated distribution of Stop Signal RTs (Table 2b). The means of the Gaussian component, μ Stop, were comparable in PTSD patients and controls, t(52.99)= 0.031, p=0.975. The SD of the Gaussian component (σ Stop) tended to be smaller in participants with PTSD, but not significantly so, t(28.06)= −1.965, p=0.059. Finally, the mean values of τ Stop (the rightward exponential tail) were significantly greater in PTSD patients, t(46.18)= 4.989, p< .0001.
Although not a focus of the current study, it was notable that the RT distributions on Go trials did not differ between groups (Table S1, Supplementary Materials).
3.5. Bayesian Statistics
Results from Bayesian independent samples t-tests (Bayes factors) are shown in Tables 2a and 2b. BF10 was 5.504 for NoGo errors (i.e., the observed outcome was 5.504 times more likely than H0) and less than half that (BF10 = 2.437) for the classic SSRT (Table 2a). Qualitatively, this can be considered “mild” evidence in favor of a Group effect for NoGo errors, but only weak or “anecdotal” evidence for SSRT (Wagenmakers et al., 2018). Variables from the BEESTS-WTF model told a more fine-grained story (Table 2b). The inclusion of TFs in the estimation of stopping times resulted in BF10 = 0.628 for SSRTB, while BF10 was 7.641 for TFs (moderate evidence in favor of H1). Also informative were BF10 = 0.272 for μ Stop (mild evidence in favor of a null effect) and BF10 = 2063.890 for τ Stop, the latter providing extreme evidence supporting an impairment in participants with PTSD.
3.6. Correlation with Questionnaires
Bayesian correlations (Kendall’s Tau-B) examined the relationships between behavioral performance measures and the severity of PTSD symptoms on the PCL-5, and cognitive symptoms on the CFQ (Table 3). The evidence in favor of a correlation between NoGo errors and PCL-5 was “strong”, and for NoGo errors and CFQ it was “very strong”. However, this was not the case for TFs, with only “mild” or “anecdotal” evidence for correlations with PCL-5 and CFQ, respectively. Instead, the correlations between τ Stop and self-report scores were “strong” for PCL-5 and “very strong” for CFQ. Conversely, there was mild evidence against correlations between symptom severity and Go RT, μ Stop, and σ Stop. The latter results suggest that the null effect was more likely in each case (e.g., mean RT on Go trials was not related to PTSD symptom severity). Spearman correlations support these findings, as shown in Table S2 (Supplementary Materials).
Table 3.
Bayes Factors (BF10) for correlations (Kendall’s Tau-B) between self-report questionnaires and standard performance measures (Top), and between questionnaires and the hierarchical Bayesian model parameters of stopping performance (Bottom).
| Go RT | Go ICV | NoGo err | Stop err | SSRT | |
|---|---|---|---|---|---|
| PCL-5 | 0.188# | 2.977 | 21.906 ++ | 0.469 | 0.981 |
| CFQ | 0.388 | 4.868+ | 41.310+++ | 0.953 | 0.835 |
| μ Stop | σ Stop | τ Stop | TF | SSRTB | |
| PCL-5 | 0.182# | 0.276# | 27.545++ | 3.192 + | 0.284# |
| CFQ | 0.181# | 0.316# | 37.086+++ | 1.639 | 0.418 |
Note. BF10 > 1 favors H1 and < 1 favors H0.
Mild,
Strong, and
Very Strong evidence in favor of H1.
Mild evidence in favor of H0 (Wagenmakers et al., 2017). For example, evidence in favor of a correlation between PCL-5 scores and NoGo errors was 21.906 more likely than H0. Conversely, evidence in favor of a correlation between PCL-5 and Go RT was (1/.188) = 5.319 times less likely than H0.
4. Discussion
Persons with PTSD frequently struggle to exert control over key emotional and cognitive processes (Aupperle et al., 2012; van Rooij & Jovanovic, 2018). Previous results have suggested that response inhibition is more impacted by PTSD symptoms than other measures of executive function (DeGutis et al. 2015; Vasterling & Hall, 2018). However, commonly used tasks do not distinguish between the latency to inhibit a response (stopping speed), and the reliability of deploying inhibitory control when needed. The present study used a Hybrid response inhibition task that combined NoGo and Stop trials (adapted from Schachar et al., 2011). Combat Veterans with PTSD found it more difficult to inhibit prepotent responses on NoGo trials in comparison to controls, replicating previous studies (Vasterling et al., 1998; Falconer et al. 2008; Wu et al., 2010; Swick et al., 2012). Failures to launch the inhibitory process (“trigger failures”) can be estimated on Stop trials as well (Matzke et al. 2017b), an aspect of performance that has not been investigated in PTSD. Participants with PTSD showed a parallel increase in trigger failures (TFs) on NoGo and Stop trials, a novel finding that suggests difficulties with recruitment of top-down attentional control, which may be a common deficit in both tasks.
The current study also extends earlier findings by demonstrating a dissociation between the speed and reliability of motor response inhibition in PTSD. Specifically, the mean latency of the stopping process was unaffected in PTSD patients, but their stopping times were more variable compared to controls. Parameters from the ex-Gaussian race model (Matzke, Love, & Heathcote, 2017) provided estimates of stopping latency (μ Stop) and stopping variability (τ Stop). The estimated means of μ Stop did not differ between patients and controls, suggesting that core inhibitory processes were intact. Conversely, an increase in τ Stop was observed (without an increase in σ Stop). This pattern indicates that greater variability on successful Stop trials was the result of unusually long SSRTs in the rightward tail of the distribution. In concert with the increase in TFs and NoGo errors, this supports a difficulty with maintaining focus on the task goals. Taken together, the results suggest that the recruitment of inhibitory control was less reliable in the PTSD group, which reflects a problem with sustained attention, rather than a core deficit in motor inhibition.
This view was further supported by the relationship between clinical symptoms and specific aspects of task performance. Stopping speed was not correlated with the severity of PTSD symptoms. Instead, parameters measuring the implementation of response inhibition (stopping variability, trigger failures, and NoGo errors) were associated with higher PCL-5 scores. These results favor the idea that PTSD symptoms interfere with the ability to deploy inhibitory control when needed.
Esterman and colleagues (2019) recently came to a similar conclusion. A continuous performance task with infrequent, gradually changing stimuli (gradCPT) was administered to a group of 123 Veterans. Increased errors of commission (NoGo errors) were found in a subgroup of Veterans with PTSD/mood disorders, and in another subgroup with substance use disorders (Esterman et al., 2019). This was attributed to impairments in sustained inhibitory control. Stopping speed was not evaluated in that experiment.
Interestingly, an increase in τ on Go trials was not observed in participants with PTSD. One explanation could be that relatively greater attentional resources were directed to executing Go responses than to response inhibition on infrequent Stop trials. Other possibilities may be related to task factors, as mentioned below.
4.1. Importance of Task Parameters
The present study illustrates that stimulus presentation parameters and response requirements are critical when assessing response inhibition. For example, the PTSD group did not show increased response variability on Go trials in the Hybrid task, which stands in contrast to what has been observed in prior studies in this population using tasks such as the Letter GNG and gradCPT (Swick et al., 2013; Esterman et al., 2019). More variable responses are seen as indicators of inhibitory inefficiency and excessive mental noise (Chuah et al., 2006; Ode et al., 2011). One possible explanation is that the Letter GNG (Swick et al., 2013) is a simple RT task (“if a non-X is presented, then respond”), while the Hybrid is a choice RT task (“press left or right according to the direction of the arrows unless you hear a tone”). The Letter GNG is similar to the Sustained Attention to Response Task (SART), which is designed to assess cognitive failures and the inability to maintain attention (Robertson et al., 1997). Despite these differences, the present study found very strong evidence for a correlation between CFQ scores and NoGo errors, replicating previous results (Robertson et al., 1997; Smilek et al., 2010). In addition, we found very strong evidence for a correlation between CFQ and stopping variability (τ Stop), which is consistent with the notion that lapses of attention contribute to inhibitory control problems in PTSD. Conversely, the parameter most closely related to stopping speed (μ Stop) was not correlated with cognitive failures, again suggesting this core inhibitory process was relatively unaffected by variations in top-down attentional control.
Other differences in experimental design include the stimulus presentation rate (every 1.5 sec for Letter GNG vs. every 2 sec for Hybrid), the absence/presence of a fixation cross, and the percentage of NoGo trials (10% for Letter GNG vs. 12.5% Hybrid task, with another 12.5% Stop trials). These factors resulted in greater inhibitory demands in the Letter GNG than in the Hybrid task (Wessel, 2018a), which was reflected in higher error rates in the former (26.16% vs. 6.08% for controls, and 47.94% vs. 15.65% for patients, respectively). Despite these differences, the GNG error finding replicated here. One strength of the current study design is that NoGo and Stop trials were included in the same task (Schachar et al., 2011), allowing a direct comparison of the two types of stopping. Our adaptation of the Hybrid task (cutting the percentage of inhibitory trials in half) increased the number of NoGo errors, as expected, relative to other experiments that used the original version (Deleuze et al., 2017a,b).
Studies that did not observe a deficit in PTSD patients often used variants of the GNG task that placed low inhibitory demands on the participants (Carrion et al., 2007; Jovanovic et al., 2013; Shucard et al., 2008). For example, in the AX-CPT (continuous performance task), NoGo stimuli are presented on only a minority of trials (Shucard et al., 2008). Likewise, response inhibition is less challenging if Go and NoGo trials are equiprobable (Carrion et al., 2007), compared to when Go trials are predominant.
Variations in how the Stop-Signal Task is administered (e.g., percentage of Stop trials, implementation of a staircase procedure or not, criteria used for excluding participants, and how SSRT is calculated) could explain some of the discrepancies in the PTSD literature. A recent paper recommended best practices in methodology, data analysis, and reporting of results in the SST (Verbruggen et al., 2019). When estimated using the integration method, the patients’ classic SSRTs in the current study were indeed slower, but affected to a lesser degree than their NoGo error rates. A notable distinction in the literature at large is that task performance is measured differently: estimations of stopping latency vs. commission errors. The ex-Gaussian Bayesian model (Matzke et al., 2017a) added two critical elements to our findings by accounting for failures to deploy inhibitory control, and by considering the entire distribution of stop-signal RTs. The resultant SSRTB (μ Stop + τ Stop) provided a more fine-grained estimate of stopping times, revealing that the mean latency of inhibition was unaffected in this group of patients, but its variability was associated with more severe PTSD symptoms and with self-reported cognitive failures.
4.2. Evolving Views of Response Inhibition
SST was initially touted as a more cognitively pure and sensitive measure of motor stopping abilities than GNG (e.g., Aron & Poldrack, 2005), but SST is subject to strategic and motivational influences (Leotti & Wager, 2010). Thus, it is not a “pure” measure of inhibitory control abilities, as proactive (anticipatory) control is another important process recruited by this task (Chikazoe et al., 2009; Raud et al., 2020). Evolving views of GNG and SST have recognized that neither task is “process pure”; rather, they engage other cognitive components such as monitoring for task-relevant signals, reacting to rare or surprising stimuli (“attentional capture”), response selection, and response execution (Mostofsky & Simmonds, 2008; Sharp et al., 2010; Munakata et al., 2011; Chatham et al., 2012; Wessel, 2018b). In line with this view, meta-analyses of the neuroimaging literature indicate that GNG and SST have both overlapping and distinct neural substrates (Swick et al., 2011; Zhang et al., 2017).
A failure to activate the stopping process may reflect a problem with context-monitoring, e.g., a slip in maintaining the task goals (Chatham et al., 2012). NoGo errors are another manifestation of “trigger failure” (Verbruggen et al., 2019), which could reflect a common cognitive process that is impacted by PTSD symptoms in both tasks. The ex-Gaussian Bayesian model has raised questions about the cognitive processes affected in other clinical disorders, such as schizophrenia (Matzke et al., 2017b) and ADHD (Weigard et al., 2019). Both populations showed an increase in TFs relative to controls, emphasizing the role of attention deficits rather than impulsivity. In fact, SSRT no longer correlated with behavioral and self-report measures of impulsivity in a community sample once TFs were taken into account (Skippen et al., 2019).
When assessed as separate tasks using traditional measures, the distinction between restraint and cancellation becomes apparent. Task manipulations, such as presenting negatively valenced pictures before the imperative stimuli, have resulted in differential effects on GNG and SST performance (Littman & Takacs, 2017). Raud et al. (2020) recently reported striking differences in the timing of event-related potentials, suppression of muscle activity, and behavioral responses in the two tasks and suggested they rely on different mechanisms. The Hybrid intermixed trial design used in our study may highlight commonalities to a greater extent. Proactive control and top-down biasing of the sensorimotor system are more prominent in SST (Raud et al., 2020), so assessing “restraint” and “cancellation” in separate blocks may be informative. An important caveat is that tasks are not proxies for cognitive processes. Computational advances such as the ex-Gaussian Bayesian model help to clarify the latter.
4.3. Limitations
This study had several limitations, including a relatively small number of participants. The evidence in favor of a group difference in NoGo errors was only “mild” (or “moderate” according to JASP Team, 2020), but this finding is bolstered by the fact that it replicates previous results in PTSD patients (Vasterling et al., 1998; Falconer et al. 2008; Wu et al., 2010; Swick et al., 2012; DeGutis et al., 2015; Adams et al., 2017). Overall, a preponderance of evidence suggests that individuals with PTSD have an especially difficult time with recruiting inhibitory control when needed, which is also reflected in higher TF on Stop trials. Another limitation is that participants with PTSD had fewer years of education than control participants, which may have influenced the results. However, the major dependent measures were not correlated with years of education, indicating the latter could not account for the group differences. Finally, these results in combat Veterans may not generlize to PTSD in civilian populations.
5. Conclusions
Combat Veterans with PTSD had difficulties suppressing prepotent responses on NoGo trials in a hybrid response inhibition task. Failures to launch the stopping process, or “trigger failures” (TFs) can be estimated on Stop trials as well. Participants with PTSD showed a parallel increase in TFs and NoGo errors, suggesting impairment in similar cognitive processes on Stop and NoGo trials (e.g., sustained attention to task goals and top-down deployment of inhibition). The ex-Gaussian race model of SSRT revealed that stopping speed in PTSD patients did not differ from that of controls. However, stopping variability was greater in the patients, and highly correlated with the severity of PTSD symptoms. These new findings contribute to a greater understanding of the component processes of inhibitory control impacted by PTSD. A core element of response inhibition was preserved (stopping speed), but sustained attention to task stimuli and task goals was impaired.
Supplementary Material
Fig. 3.
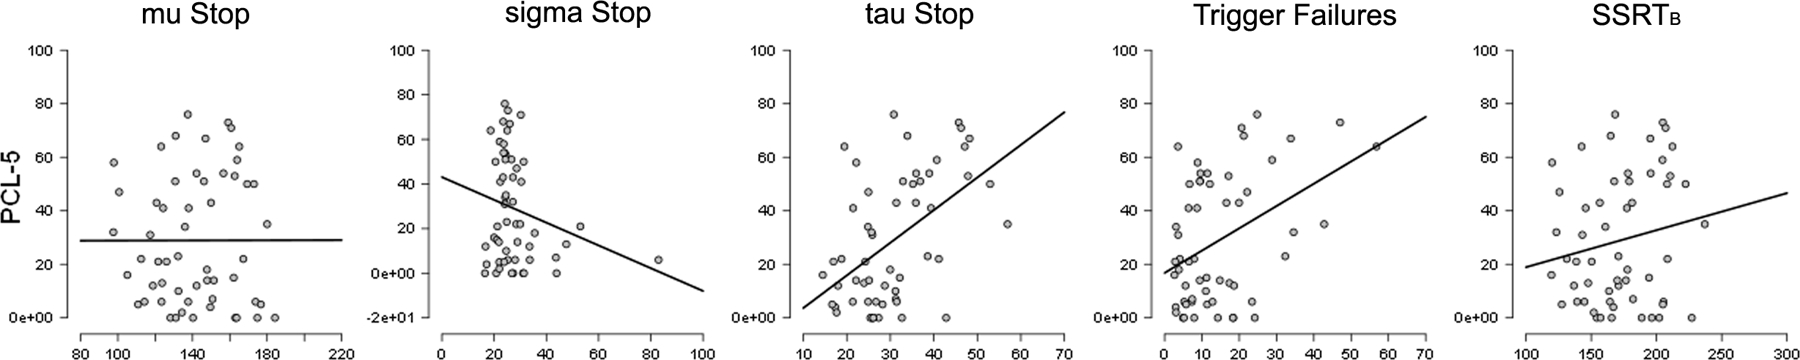
Correlations between PTSD Symptom Severity and Parameters from the Bayesian Ex-Gaussian Model. The outlier in the sigma Stop panel depicts data from a control; removing this person did not affect the outcome.
Acknowledgments:
We thank Dr. Nikki Honzel and Dr. Jary Larsen for their assistance in various aspects of the study. The project was supported by a VA Merit Review grant (I01CX000566) from Clinical Science Research and Development. The contents reported within do not represent the views of the Department of Veterans Affairs or the United States Government. The authors declare that they have no conflicts of interest.
Footnotes
Declarations of interest: none
References
- Adams ZW, Meinzer M, Mandel H, Voltin J, Caughron B, Sallee FR, Hamner M … Wang Z (2017). Cue-dependent inhibition in posttraumatic stress disorder and attention-deficit/hyperactivity disorder. Journal of Anxiety Disorders, 51, 1–6. [DOI] [PubMed] [Google Scholar]
- American Psychiatric Association. (2013). Diagnostic and statistical manual of mental disorders (DSM-5®). American Psychiatric Association Publishing. [Google Scholar]
- Aron AR, & Poldrack RA (2005). The cognitive neuroscience of response inhibition: relevance for genetic research in attention-deficit/hyperactivity disorder. Biological Psychiatry, 57, 1285–1292. [DOI] [PubMed] [Google Scholar]
- Aupperle RL, Melrose AJ, Stein MB, & Paulus MP (2012). Executive function and PTSD: Disengaging from trauma. Neuropharmacology, 62, 686–694. [DOI] [PMC free article] [PubMed] [Google Scholar]
- Band G, Van Der Molen M, & Logan G (2003). Horse-race model simulations of the stop-signal procedure. Acta Psychologica, 112, 105–142. [DOI] [PubMed] [Google Scholar]
- Beck AT, Steer R, & Gabin M (1988). Psychometric properties of the BDI: Twenty-five years of evaluation. Clinical Psychological Review, 8, 77–100. [Google Scholar]
- Benjamini Y, & Hochberg Y (1995). Controlling the false discovery rate: a practical and powerful approach to multiple testing. Journal of the Royal Statistical Society: Series B (Methodological), 57, 289–300. [Google Scholar]
- Boehler CN, Appelbaum LG, Krebs RM, Hopf JM, & Woldorff MG (2012). The influence of different Stop-signal response time estimation procedures on behavior–behavior and brain–behavior correlations. Behavioural Brain Research, 229, 123–130. [DOI] [PMC free article] [PubMed] [Google Scholar]
- Broadbent DE, Cooper PF, FitzGerald P, & Parkes KR (1982). The cognitive failures questionnaire (CFQ) and its correlates. British Journal of Clinical Psychology, 21, 1–16. [DOI] [PubMed] [Google Scholar]
- Carlson KF, Kehle SM, Meis LA, Greer N, MacDonald R, Rutks I, Sayer NA, … & Wilt TJ (2011). Prevalence, assessment, and treatment of mild traumatic brain injury and posttraumatic stress disorder: A systematic review of the evidence. The Journal of Head Trauma Rehabilitation, 26, 103–115. [DOI] [PubMed] [Google Scholar]
- Carrion VG, Garrett A, Menon V, Weems CF, & Reiss AL (2007). Posttraumatic stress symptoms and brain function during a response-inhibition task: An fMRI study in youth. Depression and Anxiety, 25, 514–526. [DOI] [PubMed] [Google Scholar]
- Chatham CH, Claus ED, Kim A, Curran T, Banich MT, & Munakata Y (2012). Cognitive control reflects context monitoring, not motoric stopping, in response inhibition. PloS One, 7, e31546. [DOI] [PMC free article] [PubMed] [Google Scholar]
- Chikazoe J, Jimura K, Hirose S, Yamashita KI, Miyashita Y, & Konishi S (2009). Preparation to inhibit a response complements response inhibition during performance of a stop-signal task. Journal of Neuroscience, 29, 15870–15877. [DOI] [PMC free article] [PubMed] [Google Scholar]
- Chuah YL, Venkatraman V, Dinges DF, & Chee MW (2006). The neural basis of interindividual variability in inhibitory efficiency after sleep deprivation. Journal of Neuroscience, 26, 7156–7162. [DOI] [PMC free article] [PubMed] [Google Scholar]
- Crocker LD, Jurick SM, Thomas KR, Keller AV, Sanderson-Cimino M, Boyd B, Rodgers C, … Jak AJ (2018). Worse baseline executive functioning is associated with dropout and poorer response to trauma-focused treatment for veterans with PTSD and comorbid traumatic brain injury. Behaviour Research and Therapy, 108, 68–77. [DOI] [PubMed] [Google Scholar]
- DeGutis J, Esterman M, McCulloch B, Rosenblatt A, Milberg W, & McGlinchey R (2015). Posttraumatic psychological symptoms are associated with reduced inhibitory control, not general executive dysfunction. Journal of the International Neuropsychological Society, 21, 342–352. [DOI] [PubMed] [Google Scholar]
- Deleuze J, Christiaens M, Nuyens F, & Billieux J (2017a). Shoot at first sight! First person shooter players display reduced reaction time and compromised inhibitory control in comparison to other video game players. Computers in Human Behavior, 72, 570–576. [Google Scholar]
- Deleuze J, Nuyens F, Rochat L, Rothen S, Maurage P, & Billieux J (2017b). Established risk factors for addiction fail to discriminate between healthy gamers and gamers endorsing DSM-5 Internet gaming disorder. Journal of Behavioral Addictions, 6, 516–524. [DOI] [PMC free article] [PubMed] [Google Scholar]
- Ehlers A, & Clark DM (2000). A cognitive model of posttraumatic stress disorder. Behaviour Research and Therapy, 38, 319–345. [DOI] [PubMed] [Google Scholar]
- Esterman M, Fortenbaugh FC, Pierce ME, Fonda JR, DeGutis J, Milberg W, & McGlinchey R (2019). Trauma-related psychiatric and behavioral conditions are uniquely associated with sustained attention dysfunction. Neuropsychology, 33, 711–724. [DOI] [PMC free article] [PubMed] [Google Scholar]
- Falconer E, Bryant R, Felmingham KL, Kemp AH, Gordon E, Peduto A, Olivieri G, … & Williams LM (2008). The neural networks of inhibitory control in posttraumatic stress disorder. Journal of Psychiatry & Neuroscience: JPN, 33, 413. [PMC free article] [PubMed] [Google Scholar]
- Fischer BL, Parsons M, Durgerian S, Reece C, Mourany L, Lowe MJ, Beall EB, … & Scheibel RS (2014). Neural activation during response inhibition differentiates blast from mechanical causes of mild to moderate traumatic brain injury. Journal of Neurotrauma, 31, 169–179. [DOI] [PMC free article] [PubMed] [Google Scholar]
- Heathcote A, Popiel SJ, & Mewhort DJK (1991). Analysis of response time distributions: An example using the Stroop task. Psychological Bulletin, 109, 340–347. [Google Scholar]
- JASP Team (2020). JASP (Version 0.8.6) [Computer software].
- Jovanovic T, Ely T, Fani N, Glover EM, Gutman D, Tone EB, Norrholm SD, … & Ressler KJ (2013). Reduced neural activation during an inhibition task is associated with impaired fear inhibition in a traumatized civilian sample. Cortex, 49, 1884–1891. [DOI] [PMC free article] [PubMed] [Google Scholar]
- Leotti LA, & Wager TD (2010). Motivational influences on response inhibition measures. Journal of Experimental Psychology: Human Perception and Performance, 36, 430. [DOI] [PMC free article] [PubMed] [Google Scholar]
- Littman R, & Takács Á (2017). Do all inhibitions act alike? A study of go/no-go and stop-signal paradigms. PloS One, 12, e0186774. [DOI] [PMC free article] [PubMed] [Google Scholar]
- Logan GD, Schachar RJ, & Tannock R (1997). Impulsivity and inhibitory control. Psychological Science, 8, 60–64. [Google Scholar]
- Mac Donald CL, Barber J, Jordan M, Johnson AM, Dikmen S, Fann JR, & Temkin N (2017). Early clinical predictors of 5-year outcome after concussive blast traumatic brain injury. JAMA Neurology, 74, 821–829. [DOI] [PMC free article] [PubMed] [Google Scholar]
- Matzke D, Curley S, Gong CQ, & Heathcote A (2019). Inhibiting responses to difficult choices. Journal of Experimental Psychology: General, 148, 124–142. [DOI] [PubMed] [Google Scholar]
- Matzke D, Hughes M, Badcock JC, Michie P, & Heathcote A (2017a). Failures of cognitive control or attention? The case of stop-signal deficits in schizophrenia. Attention, Perception, & Psychophysics, 79, 1078–1086. [DOI] [PMC free article] [PubMed] [Google Scholar]
- Matzke D, Love J, & Heathcote A (2017b). A Bayesian approach for estimating the probability of trigger failures in the stop-signal paradigm. Behavior Research Methods, 49, 267–281. [DOI] [PMC free article] [PubMed] [Google Scholar]
- Matzke D, Love J, Wiecki TV, Brown SD, Logan GD, & Wagenmakers E-J (2013). Release the BEESTS: Bayesian estimation of ex-Gaussian stop-signal reaction time distributions. Frontiers in Quantitative Psychology and Measurement, 4:918. [DOI] [PMC free article] [PubMed] [Google Scholar]
- Mostofsky SH, & Simmonds DJ (2008). Response inhibition and response selection: Two sides of the same coin. Journal of Cognitive Neuroscience, 20, 751–761. [DOI] [PubMed] [Google Scholar]
- Munakata Y, Herd SA, Chatham CH, Depue BE, Banich MT, & O’Reilly RC (2011). A unified framework for inhibitory control. Trends in Cognitive Science, 15, 453–459. [DOI] [PMC free article] [PubMed] [Google Scholar]
- Ode S, Robinson MD, & Hanson DM (2011). Cognitive-emotional dysfunction among noisy minds: Predictions from individual differences in reaction time variability. Cognition and Emotion, 25, 307–327. [DOI] [PubMed] [Google Scholar]
- Olff M, Polak AR, Witteveen AB, & Denys D (2014). Executive function in posttraumatic stress disorder (PTSD) and the influence of comorbid depression. Neurobiology of Learning and Memory, 112, 114–121. [DOI] [PubMed] [Google Scholar]
- Petrides M (1986). The effect of periarcuate lesions in the monkey on the performance of symmetrically and asymmetrically reinforced visual and auditory go, no-go tasks. Journal of Neuroscience, 6, 2054–2063. [DOI] [PMC free article] [PubMed] [Google Scholar]
- Raud L, Westerhausen R, Dooley N, & Huster RJ (2020). Differences in unity: The go/no-go and stop signal tasks rely on different mechanisms. NeuroImage, 210, 116582. [DOI] [PubMed] [Google Scholar]
- Rauch SL, Shin LM, & Phelps EA (2006). Neurocircuitry models of posttraumatic stress disorder and extinction: human neuroimaging research—past, present, and future. Biological Psychiatry, 60, 376–382. [DOI] [PubMed] [Google Scholar]
- Robertson IH, Manly T, Andrade J, Baddeley BT, & Yiend J (1997). ‘Oops!’: Performance correlates of everyday attentional failures in traumatic brain injured and normal subjects. Neuropsychologia, 35, 747–758. [DOI] [PubMed] [Google Scholar]
- Schachar RJ, Forget-Dubois N, Dionne G, Boivin M, & Robaey P (2011). Heritability of response inhibition in children. Journal of the International Neuropsychological Society, 17, 238–247. [DOI] [PubMed] [Google Scholar]
- Schachar R, Logan GD, Robaey P, Chen S, Ickowicz A, & Barr C (2007). Restraint and cancellation: multiple inhibition deficits in attention deficit hyperactivity disorder. Journal of Abnormal Child Psychology, 35, 229–238. [DOI] [PubMed] [Google Scholar]
- Sharp DJ, Bonnelle V, De Boissezon X, Beckmann CF, James SG, Patel MC, & Mehta MA (2010). Distinct frontal systems for response inhibition, attentional capture, and error processing. Proceedings of the National Academy of Sciences, 107, 6106–6111. [DOI] [PMC free article] [PubMed] [Google Scholar]
- Skippen P, Matzke D, Heathcote A, Fulham WR, Michie P, & Karayanidis F (2019). Reliability of triggering inhibitory process is a better predictor of impulsivity than SSRT. Acta Psychologica, 192, 104–117. [DOI] [PubMed] [Google Scholar]
- Shu IW, Onton JA, O’Connell RM, Simmons AN, & Matthews SC (2014). Combat veterans with comorbid PTSD and mild TBI exhibit a greater inhibitory processing ERP from the dorsal anterior cingulate cortex. Psychiatry Research: Neuroimaging, 224, 58–66. [DOI] [PubMed] [Google Scholar]
- Shucard JL, McCabe DC, & Szymanski H (2008). An event-related potential study of attention deficits in posttraumatic stress disorder during auditory and visual Go/NoGo continuous performance tasks. Biological Psychology, 79, 223–233. [DOI] [PMC free article] [PubMed] [Google Scholar]
- Smilek D, Carriere JS, & Cheyne JA (2010). Failures of sustained attention in life, lab, and brain: ecological validity of the SART. Neuropsychologia, 48, 2564–2570. [DOI] [PubMed] [Google Scholar]
- Swick D, Ashley V, & Turken U (2011). Are the neural correlates of stopping and not going identical? Quantitative meta-analysis of two response inhibition tasks. Neuroimage, 56, 1655–1665. [DOI] [PubMed] [Google Scholar]
- Swick D, Honzel N, Larsen J, Ashley V, & Justus T (2012). Impaired response inhibition in veterans with post-traumatic stress disorder and mild traumatic brain injury. Journal of the International Neuropsychological Society, 18, 1–10. [DOI] [PubMed] [Google Scholar]
- Swick D, Honzel N, Larsen J, & Ashley V (2013). Increased response variability as a marker of executive dysfunction in veterans with post-traumatic stress disorder. Neuropsychologia 51, 3033–3040. [DOI] [PMC free article] [PubMed] [Google Scholar]
- The Management of Concussion/mTBI Working Group (2009). VA/DOD clinical practice guideline for management of concussion/mild traumatic brain injury (mTBI). Journal of Rehabilitation Research Development, 46, CP1–CP68. [PubMed] [Google Scholar]
- van Rooij SJ, Rademaker AR, Kennis M, Vink M, Kahn RS, & Geuze E (2014). Impaired right inferior frontal gyrus response to contextual cues in male veterans with PTSD during response inhibition. Journal of Psychiatry & Neuroscience: JPN, 39, 330. [DOI] [PMC free article] [PubMed] [Google Scholar]
- van Rooij SJ, & Jovanovic T (2018). Impaired inhibition as an intermediate phenotype for PTSD risk and treatment response. Progress in Neuro-Psychopharmacology and Biological Psychiatry, 89, 435–445. [DOI] [PMC free article] [PubMed] [Google Scholar]
- Vasterling JJ, Brailey K, Constans JI, & Sutker PB (1998). Attention and memory dysfunction in posttraumatic stress disorder. Neuropsychology, 12, 125–133. [DOI] [PubMed] [Google Scholar]
- Vasterling JJ, & Hall KAA (2018). Neurocognitive and information processing biases in posttraumatic stress disorder. Current Psychiatry Reports, 20, 99. [DOI] [PubMed] [Google Scholar]
- Verbruggen F, Aron AR, Band GP, Beste C, Bissett PG, Brockett AT, Brown JW, … & Colzato LS (2019). A consensus guide to capturing the ability to inhibit actions and impulsive behaviors in the stop-signal task. Elife, 8, e46323. [DOI] [PMC free article] [PubMed] [Google Scholar]
- Verbruggen F, & Logan GD (2008). Response inhibition in the stop-signal paradigm. Trends in Cognitive Sciences, 12, 418–424. [DOI] [PMC free article] [PubMed] [Google Scholar]
- Wagenmakers EJ, Love J, Marsman M, Jamil T, Ly A, Verhagen J, Selker R, … & Meerhoff F (2018). Bayesian inference for psychology. Part II: Example applications with JASP. Psychonomic Bulletin & Review, 25, 58–76. [DOI] [PMC free article] [PubMed] [Google Scholar]
- Weigard A, Heathcote A, Matzke D, & Huang-Pollock C (2019). Cognitive modeling suggests that attentional failures drive longer stop-signal reaction time estimates in attention deficit/hyperactivity disorder. Clinical Psychological Science, 7, 856–872. [DOI] [PMC free article] [PubMed] [Google Scholar]
- Weathers FW, Litz BT, Keane TM, Palmieri PA, Marx BP, & Schnurr PP (2013). The PTSD checklist for DSM-5 (PCL-5). Scale available from the National Center for PTSD at www.ptsd.va.gov.
- Wessel JR (2018a). Prepotent motor activity and inhibitory control demands in different variants of the go/no-go paradigm. Psychophysiology, 55, e12871. [DOI] [PubMed] [Google Scholar]
- Wessel JR (2018b). Surprise: A more realistic framework for studying action stopping? Trends in Cognitive Science, 22, 741–744. [DOI] [PMC free article] [PubMed] [Google Scholar]
- Whelan R (2008). Effective analysis of reaction time data. The Psychological Record, 58, 475–482. [Google Scholar]
- Wu J, Ge Y, Shi Z, Duan X, Wang L, Sun X, & Zhang K (2010). Response inhibition in adolescent earthquake survivors with and without posttraumatic stress disorder: a combined behavioral and ERP study. Neuroscience Letters, 486, 117–121. [DOI] [PubMed] [Google Scholar]
- Zhang R, Geng X, & Lee TMC (2017). Large-scale functional neural network correlates of response inhibition: An fMRI meta-analysis. Brain Structure and Function, 222, 3973–3990. [DOI] [PMC free article] [PubMed] [Google Scholar]
Associated Data
This section collects any data citations, data availability statements, or supplementary materials included in this article.