Abstract
Cellular coenzymes including coenzyme A (CoA), acetyl coenzyme A (acetyl-CoA), coenzymes of redox reactions and of energy, and antioxidants mediate biochemical reactions fundamental to the functioning of all living cells. The redox coenzymes include NAD+ (oxidized nicotinamide adenine dinucleotide), NADH (reduced nicotinamide adenine dinucleotide), NADP+ (oxidized nicotinamide adenine dinucleotide phosphate), and NADPH (reduced nicotinamide adenine dinucleotide phosphate); the energy coenzymes include ATP (adenosine triphosphate), ADP (adenosine diphosphate), and AMP (adenosine monophosphate); and the antioxidants include GSSG (oxidized glutathione) and GSH (reduced glutathione). Their measurement is important to better understand cellular metabolism. Recent advances have pushed the limit of metabolite quantitation using NMR methods to an unprecedented level, which offer a new avenue for analysis of the coenzymes and antioxidants. Unlike the conventional enzyme assays, which need separate protocols for analysis, a simple 1D 1H NMR experiment enables analysis of all these molecular species in one step. In this chapter, we describe protocols for their identification and quantitation in tissue and whole blood using NMR spectroscopy.
Keywords: 1D NMR, Quantitation, Tissue, Blood, Coenzymes, Antioxidants, CoA, Acetyl-CoA, NAD+, NADH, NADP+, NADPH, ATP, ADP, AMP, GSH, GSSG
1. Introduction
Cellular coenzymes including coenzyme A (CoA), acetyl coenzyme A (acetyl-CoA), coenzymes of redox reactions and coenzymes of energy, and antioxidants mediate biochemical reactions fundamental to the functioning of all living cells. Major cellular redox coenzymes include NAD+ (oxidized nicotinamide adenine dinucleotide), NADH (reduced nicotinamide adenine dinucleotide), NADP+ (oxidized nicotinamide adenine dinucleotide phosphate), and NADPH (reduced nicotinamide adenine dinucleotide phosphate); major energy coenzymes include ATP (adenosine triphosphate), ADP (adenosine diphosphate), and AMP (adenosine monophosphate); and major antioxidants include GSSG (oxidized glutathione) and GSH (reduced glutathione). The concentration ratio between reduced and oxidized forms of redox coenzymes indicates important cellular functions including the overall redox status and regulation of ion channels, cell signaling, cell survival, and death [1–4]. The redox balance also indicates pathological conditions of major diseases including heart disease, diabetes, and cancer. Cellular levels of the antioxidants GSH and GSSH report on the measure of oxidative stress as well as redox signaling and are involved in the regulation of critical metabolic functions [5]. The coenzyme ATP represents the energy currency of living cells; ADP and AMP are closely associated with ATP as its precursors and products. Reliable and high-throughput quantitative measurements of these molecules is therefore important for investigations focused on the mechanistic understanding of cellular functions in health and disease [6].
Conventional methods currently used for the analysis of coenzymes typically involve enzymatic assays. Enzymatic methods are suboptimal as separate protocols are used for analysis of each coenzyme or their ratios [7–12]. In addition, these assays are challenged by the interference from sample matrix and the finite linear range of the assays, which necessitates repeated recalibrations of the solution concentration to match to standard curves. The deleterious effect of the separate analysis of these molecules is that errors associated with such analysis potentially outweigh biological changes. A number of efforts have focused on developing methods for simultaneous analysis of the coenzymes based on chromatographic separation and detection using UV-vis absorption [13] or mass spectrometry (MS) [14, 15]. Mass spectrometry is most promising owing to its ability to analyze the coenzymes in one step and with high sensitivity. Its challenges, however, are ion suppression and interference due to the unit mass difference for many coenzymes, as well as similar retention times in chromatography. For example, NAD+ and NADH have very similar structures and differ by a unit mass, and the same is true for NADP+ and NADPH. In addition, ATP and ADP can undergo in-source fragmentation to AMP, before detection, which can lead to inaccurate values. Owing to such challenges, the analysis methods have so far been far from optimal.
NMR spectroscopy represents a simple method for analysis of the coenzymes and antioxidants owing to its unique characteristics. However, the challenges for their analysis by NMR are numerous, including the (1) relatively low sensitivity of NMR, (2) complexity of biological mixtures, (3) virtually identical structures for many coenzymes, (4) very low concentration for some of the coenzymes (≤1 μM), and (5) unstable nature of many coenzymes due to enzyme activity and oxidation. These challenges have so far prevented analysis of these molecules by NMR. The instability of many coenzymes evades their detection partly or wholly and hence NMR spectra under such conditions were not reproducible. Until recently, the inability to obtain reproducible NMR spectra posed a major challenge for unambiguous identification of the coenzymes. It may be noted, however, that the unstable nature of the coenzymes is a challenge not only for NMR analysis but also for other methods including mass spectrometry, UV-vis, and the conventional enzymatic assays.
Recent advances in NMR spectroscopy have enabled routine quantification of metabolites down to sub-micromolar concentrations using a single internal reference [16] and opened new avenues for quantitative analysis of major coenzymes and antioxidants in one step using a single internal standard [17–19]. An important outcome is a realization of the importance of optimal sample harvesting and extraction for the detection of all the coenzymes by NMR. As an example, Fig. 1 shows spectra for the same type of tissue (mouse heart) obtained using different harvesting and extraction methods. It can be seen that depending on the method used, ATP is converted into ADP and AMP, and the NADH and NADPH peaks are missing altogether. The method described in Fig. 1a retains the integrity of the coenzymes. Utilizing such new methods, in this chapter, we provide protocols for analysis of major coenzymes and antioxidants in tissue and whole blood specimens using simple 1D NMR spectroscopy methods. The ability to visualize important molecules fundamental to cellular functions in one step represents an important avenue to interrogate the mechanistic details of cellular function in health and disease.
Fig. 1.
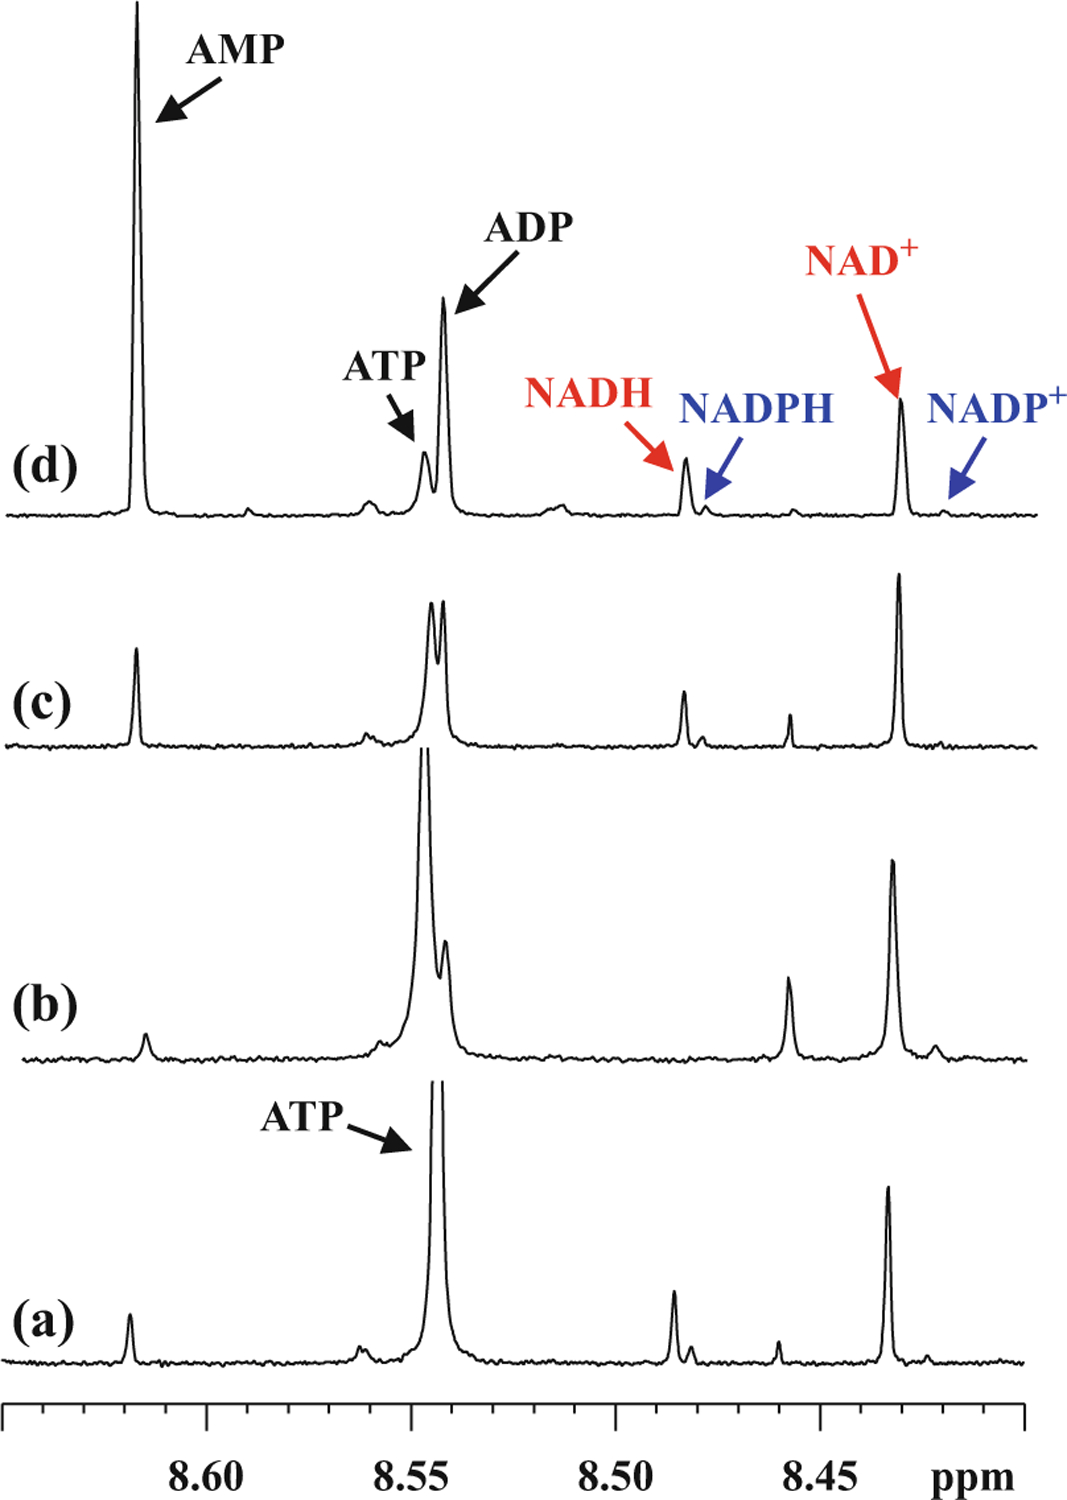
Portions of 800-MHz 1H NMR spectra obtained using 3-mm sample tubes highlighting the sensitivity of coenzyme levels to tissue harvesting/extraction protocols: (a) mouse heart harvested, washed with glucose/pyruvate solution, and freeze clamped, followed by extraction using methanol-chloroform mixture; (b) mouse heart harvested, perfused with glucose/pyruvate solution, and freeze clamped, followed by extraction using methanol-chloroform mixture; (c) mouse heart freeze clamped in vivo, followed by extraction using methanol-chloroform mixture; and (d) mouse heart harvested, washed with PBS, and freeze clamped, followed by extraction using methanol-water mixture. The most prominent changes are the missing NADH/NADPH peaks in (b) and diminished ATP and enhanced ADP/AMP in (b–d) (reproduced with permission from ref. 17)
2. Materials
2.1. Samples
Mouse tissue used for analysis: heart, kidney, brain, liver, and skeletal muscle tissues (see Note 1).
Whole human blood.
2.2. Chemicals and Solvents
Chemicals: monosodium phosphate (NaH2PO4), disodium phosphate (Na2HPO4), sodium salt of 3-(trimethylsilyl) propionic acid-2,2,3,3-d4 (TSP).
Solvents: methanol, chloroform, deionized (DI) water, deuterium oxide (D2O).
Phosphate buffer: buffer solution (100 mM; pH = 7.4) made by dissolving 1124.0 mg anhydrous Na2HPO4 and 249.9 mg anhydrous NaH2PO4 in 100 g D2O. Add a solution of TSP to achieve a final concentration of 25 μM (see Note 2).
2.3. Lab Supplies and Equipment
Pipette (1 mL, 200 μL).
Eppendorf tubes (1.5 or 2 mL).
Ice bucket and ice.
Tissue blender.
Vortex mixer.
−20 °C refrigerator, −80 °C freezer.
Vacuum concentrator/freeze drier.
Ultrasound sonicator.
2.4. NMR Instrument and Accessories
3. Methods
3.1. Sample Collection
Mouse tissue harvesting: Anesthetize mice and separate heart, kidney, brain, liver, and skeletal muscle tissues, rinse in glucose/pyruvate solution, and snap freeze in liquid nitrogen (see Note 6). The resulting tissue can then be used for metabolite extraction or stored at −80 °C until used for analyses.
Whole blood: collect human blood (~4 mL) in a heparin tube (see Notes 7 and 8).
3.2. Coenzyme and Antioxidant Extraction from Tissue (See Note 9)
Weigh tissue specimen (~5 to 80 mg).
Mix with a 1-mL mixture of cold methanol and chloroform (1:2 v/v; 4 °C) in 2-mL Eppendorf vials.
Homogenize using tissue blender.
Sonicate for 20 s.
Add 800-μL cold chloroform/DI water mixture (1:1 v/v).
Vortex the sample and set aside for 30 min on ice to separate the solvent layers.
After centrifugation at 13,400 rcf for 30 min, collect the aqueous (top) layer, and freeze dry.
Mix dried samples with 200 or 600 μL phosphate buffer containing 25 μM TSP.
Spin to sediment any residue.
Transfer the supernatants to NMR tubes for analysis (see Notes 10 and 11 and Fig. 2).
Fig. 2.
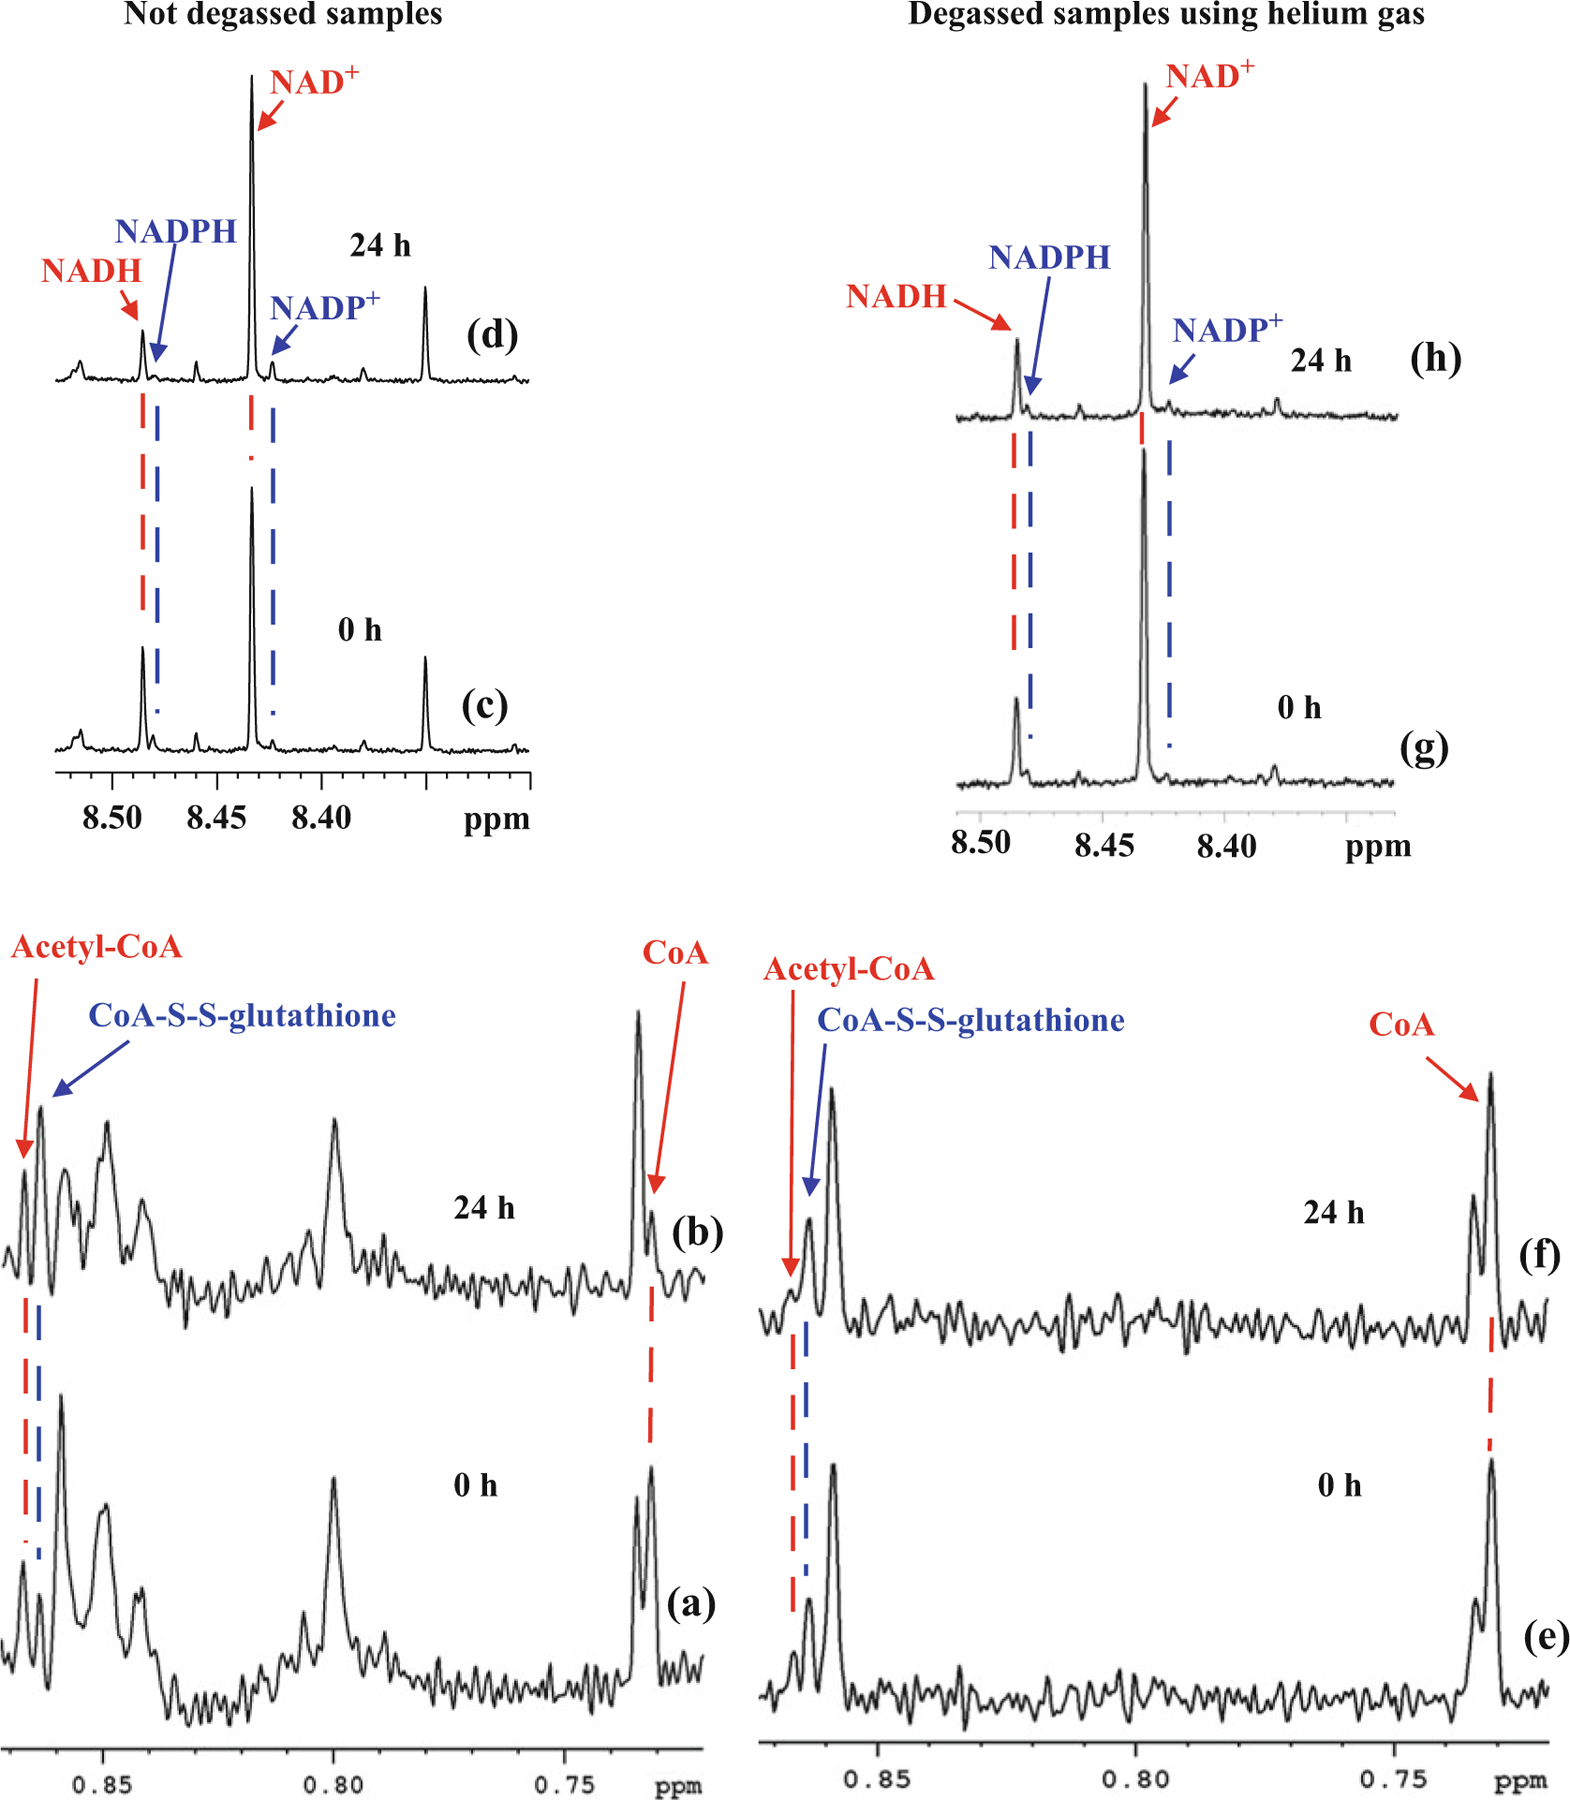
Portions of 800-MHz 1H NMR spectra of mouse heart tissue extracts obtained without degassing, immediately after sample preparation (Figs. 2a and 2c) and 24 h after preparation (Figs. 2b and 2d). Note, that while the acetyl-CoA level is unaltered, the CoA, NADH, and NADPH levels are reduced drastically with a concomitant increase of the CoA-S-S-glutathione, NAD+, and NADP+ levels, respectively, 24 h after sample preparation. Portions of spectra of mouse heart tissue extracts with degassing of both the NMR tubes and D2O buffer using helium gas obtained immediately after sample preparation (Figs. 2e and 2g) and 24 h after preparation (Figs. 2f and 2h). Note that the levels of the CoA, acetyl-CoA, and CoA-S-S-glutathione, NADH, NADPH, NAD+, and NADP+ are all unaltered even 24 h after sample preparation, which indicates no oxidation of CoA, NADH, and NADPH
3.3. Coenzyme and Antioxidant Extraction from Whole Blood (See Note 12)
Mix 200–400 μL whole blood with cold methanol and chloroform in a 1:2:2 sample:methanol:chloroform (v/v/v) ratio.
Vortex for 30 s.
Sonicate for 2 min at 4 °C.
Incubate at −20 °C for 20 min.
Centrifuge the mixture at 13,400 rcf for 30 min to pellet proteins and cell debris.
Transfer the clear aqueous solution to a fresh vial (see Note 13).
Dry using a vacuum concentrator for 5 h.
Mix dried samples with 200 or 600 μL phosphate buffer containing 25 μM TSP.
Spin to sediment any residue.
Transfer the supernatants to 3- or 5-mm NMR tubes for analysis (see Notes 10 and 11).
3.4. NMR Experiments: Shimming Using Standard Sample
Set NMR probe temperature to 298 K.
Insert a standard sample consisting of a mixture of H2O and D2O (90:10 v/v).
Tune the probe.
Read most recent shim file for the current probe.
Perform field-frequency locking using D2O signal.
Perform 1D gradient shimming (see Note 14).
Perform automated 3D gradient shimming first and then 1D gradient shimming.
Save shims as the most recent shim values.
Remove sample from the magnet.
3.5. NMR Experiment for Tissue and Whole Blood Extracts
Set pulse sequence: one-pulse or 1D NOESY pulse sequence with residual water suppression using presaturation (see Note 15).
Set parameters: temperature, 298 K; spectral width, 10,000 Hz; recycle delay, 6 s; number of transients, 128 transients; time domain points (TD), 32 or 64 K (see Note 16).
Tune the probe, perform locking and shimming.
Calibrate 90-degree pulse.
Acquire data.
Perform Fourier transformation after multiplying the FID (free induction decay) by exponential multiplication with a line broadening of 0.3 or 0.5 Hz.
Perform phase correction and baseline correction and set the reference (TSP) signal to 0 ppm.
3.6. Coenzyme and Antioxidant Identification and Quantitation
Identify the characteristic peaks for coenzymes and antioxidants based on the chemical shifts (see Table 1) and spectral features as shown in Fig. 3 (see Note 17) and Fig. 4 (see Note 18) for tissue and whole blood, respectively.
Determine area for the characteristic peaks of coenzymes and antioxidants relative to the area of the reference (TSP) peak (see Note 19 and Fig. 5).
- Using the peak areas and the following equation, obtain coenzyme concentration:
where Cm and Cr are concentrations of the metabolite and reference compound (TSP) in solution, Im and Ir are integrated peak areas of the coenzyme/antioxidant and reference (TSP), and nm and nr are number of protons that the peaks from coenzyme/antioxidant and reference represent, respectively (see Note 20).
Table 1.
1H NMR chemical shifts (in ppm with reference to TSP) and J couplings (in Hz) for the coenzymes/ metabolites of redox reaction and cellular energy. Chemical shifts for characteristic peaks of metabolites that may be used for identification and quantification using 1D 1H NMR are shown in bold (modified with permission from ref. 17)
| Coenzyme/metabolite | Mouse heart/kidney/brain/liver/skeletal muscle | Authentic compoundsa |
|---|---|---|
| Coenzyme A (CoA) | 8.5641 (1H, s); 2.6089 (2H, t); 0.7314 (3H, s); 0.8594 (3H, s) | 8.5641 (s); 8.2796 (s); 6.1795 (d, 3JH,H = 7.17); 4.8517 (m); 4.7648 (m); 4.5771 (m); 4.2331 (m); 4.0036 (s); 3.5352 (dd, 2JH,H = 9.62, 3JH,31P = 4.82); 3.8055 (dd, 3JH,31P = 4.69); 3.4658 (t, 3JH,H = 6.58); 3.3161 (t,3JH,H = 6.65); 2.4653 (t, 3JH,H = 6.58); 2.6089 (t, 3JH,H = 6.65); 0.7315(s); 0.8594 (s) |
| Acetyl-coenzyme A (acetyl-CoA) | 8.5626 (1H, s); 0.7340 (3H, s); 0.8674 (3H, s) | 8.5626 (s); 8.2729 (s); 6.1755 (d, 3JH,H = 7.16); 4.8519 (m); 4.7632 (m); 4.5758 (m); 4.2328 (m); 4.0107 (s); 3.5408 (dd,2JH,H = 9.77, 3JH,31P = 4.82); 3.8173 (dd,3JH,31P = 4.78); 3.4589 (m, 3JH,H = 6.59); 3.4413 (m,2JH,H = 13.42, 3JH,H = 6.59); 3.3190 (t,3JH,H = 6.40); 2.9642 (t, 3JH,H = 6.40); 2.4273 (t, 3JH,H = 6.59); 2.3495 (s); 0.7340 (s); 0.8674 (s) |
| Nicotinamide adenine dinucleotide, oxidized (NAD+) | 4.371 (m); 4.387 (m); 4.429 (m); 4.487 (t, J = 5.213); 4.515 (m); 4.545 (m); 6.041 (1H, d, J = 6.042); 6.093 (1H, d, J = 5.482); 8.174 (1H, s); 8.193 (1H, dd); 8.434 (1H, s); 8.832 (1H, d, J = 7.992); 9.147 (1H, d, J = 6.158); 9.344 (1H, s) | 4.191–4.291 (m); 4.369 (m); 4.386 (m); 4.430 (m); 4.488 (t; J = 5.196); 4.514 (m); 4.546 (m); 6.042 (d, J = 6.089); 6.092 (d, J = 5.510); 8.176 (s); 8.193 (dd); 8.435 (s); 8.833 (d; J = 8.032); 9.148 (d; J = 6.138); 9.344 (s) |
| Nicotinamide adenine dinucleotide phosphate, oxidized (NADP+) | 6.101 (d); 8.146 (1H, s), 8.424 (1H, s); 9.104 (1H, d); 9.300 (1H, s) | 4.181–4.236 (m); 4.284–4.342 (m); 4.377 (m); 4.411 (m); 4.461 (t; J = 5.286); 4.503 (m); 4.617 (t, J = 4.990); 4.968 (m); 6.037 (d; J = 5.560); 6.101 (d, J = 4.969); 8.146 (s); 8.168–8.199 (m); 8.423 (s); 8.818 (d, J = 8.008); 9.106 (d; J = 6.259); 9.299 (s) |
| Nicotinamide adenine dinucleotide, reduced (NADH) | 6.137 (d); 6.942 (1H, s); 8.247 (1H, s); 8.486 (1H, s) | 2.669 (br. d, J = 17.976); 2.793 (br. d, J = 17.976); 4.082 (br. m); 4.097 (br. m) 4.169–4.289 (br. m); 4.389 (br. m); 4.512 (t, J = 4.448); 4.709 (t, J = 5.272); 5.980 (d, J = 8.424); 6.138 (d, J = 5.479); 6.943 (s); 8.248 (s); 8.487 (s) |
| Nicotinamide adenine dinucleotide phosphate, reduced (NADPH) | 6.216 (d); 6.936 (1H, s); 8.481 (1H, s) | 2.737 (br. d, J = 18.093); 2.838 (br. d, J = 18.093); 4.044 (br. m); 4.066 (br. m); 4.154–4.236 (m); 4.285–4.325 (br. m); 4.390 (br. m); 4.597 (t, J = 5.049); 4.950 (m); 5.963 (d, J = 8.363); 6.216 (d, J = 4.597); 6.935 (s); 8.246 (s); 8.481 (s) |
| Adenine triphosphate (ATP) | 4.410 (m); 4.621(m); 6.155 (d); 8.274 (s); 8.549 (1H, s) | 4.192–4.233 (m); 4.278–4.318 (m); 4.392–4.421 (br. m); 4.620–4.648 (m); 6.153 (d, J = 5.974); 8.274 (s); 8.557 (s) |
| Adenine diphosphate (ADP) | 4.387 (m); 4.621(m); 6.155 (d); 8.273 (s); 8.544 (1H, s) | 4.187–4.219 (m); 4.244–4.283 (m); 4.377–4.398 (br. m); 4.611–4.634 (m); 6.156 (d, J = 5.383); 8.273 (s); 8.547 (s) |
| Adenine monophosphate (AMP) | 4.014 (m); 4.372 (m); 4.515 (m); 6.147 (d); 8.271 9(s); 8.619 (1H, s) | 3.995–4.026 (m); 4.359–4.383 (br. m); 4.501–4.526 (m); 6.148 (d, J = 5.965); 8.272 (s); 8.620 (s) |
| Glutathione, reduced (GSH) | 4.5713 (dd); 2.9551 (2H, abx); 2.170 (m); 2.554 (m) | 4.5707 (dd, 3JHH = 5.02, 3JHH = 7.13); 3.783 (m); 2.9551 (abx, 2JHH = 14.20, 3JHH = 7.28 3JHH = 5.05); 2.5616 (m); 2.1707 (m) |
| Glutathione, oxidized (GSSG) | 2.9763 (1H, dd); 2.554 (m); 2.170 (m) | 4.7657 (dd, 3JHH = 4.26, 3JHH = 9.58); 3.7813 (m); 3.3148 (dd, 3JHH = 4.40, 2JHH = 14.21); 2.9763 (dd, 3JHH = 9.57, 2JHH = 14.21); 2.5438 (m); 2.1684 (m) |
Chemical shifts for authentic compounds are shown for comparison
br. broad, s singlet, d doublet, dd doublet of doublets, t triplet, m multiplet, abx AB part of ABX pattern
Spectra for the authentic compounds were obtained near their physiological concentrations (100 μM) in D2O buffer at pH 7.45 at 298 K
Fig. 3.
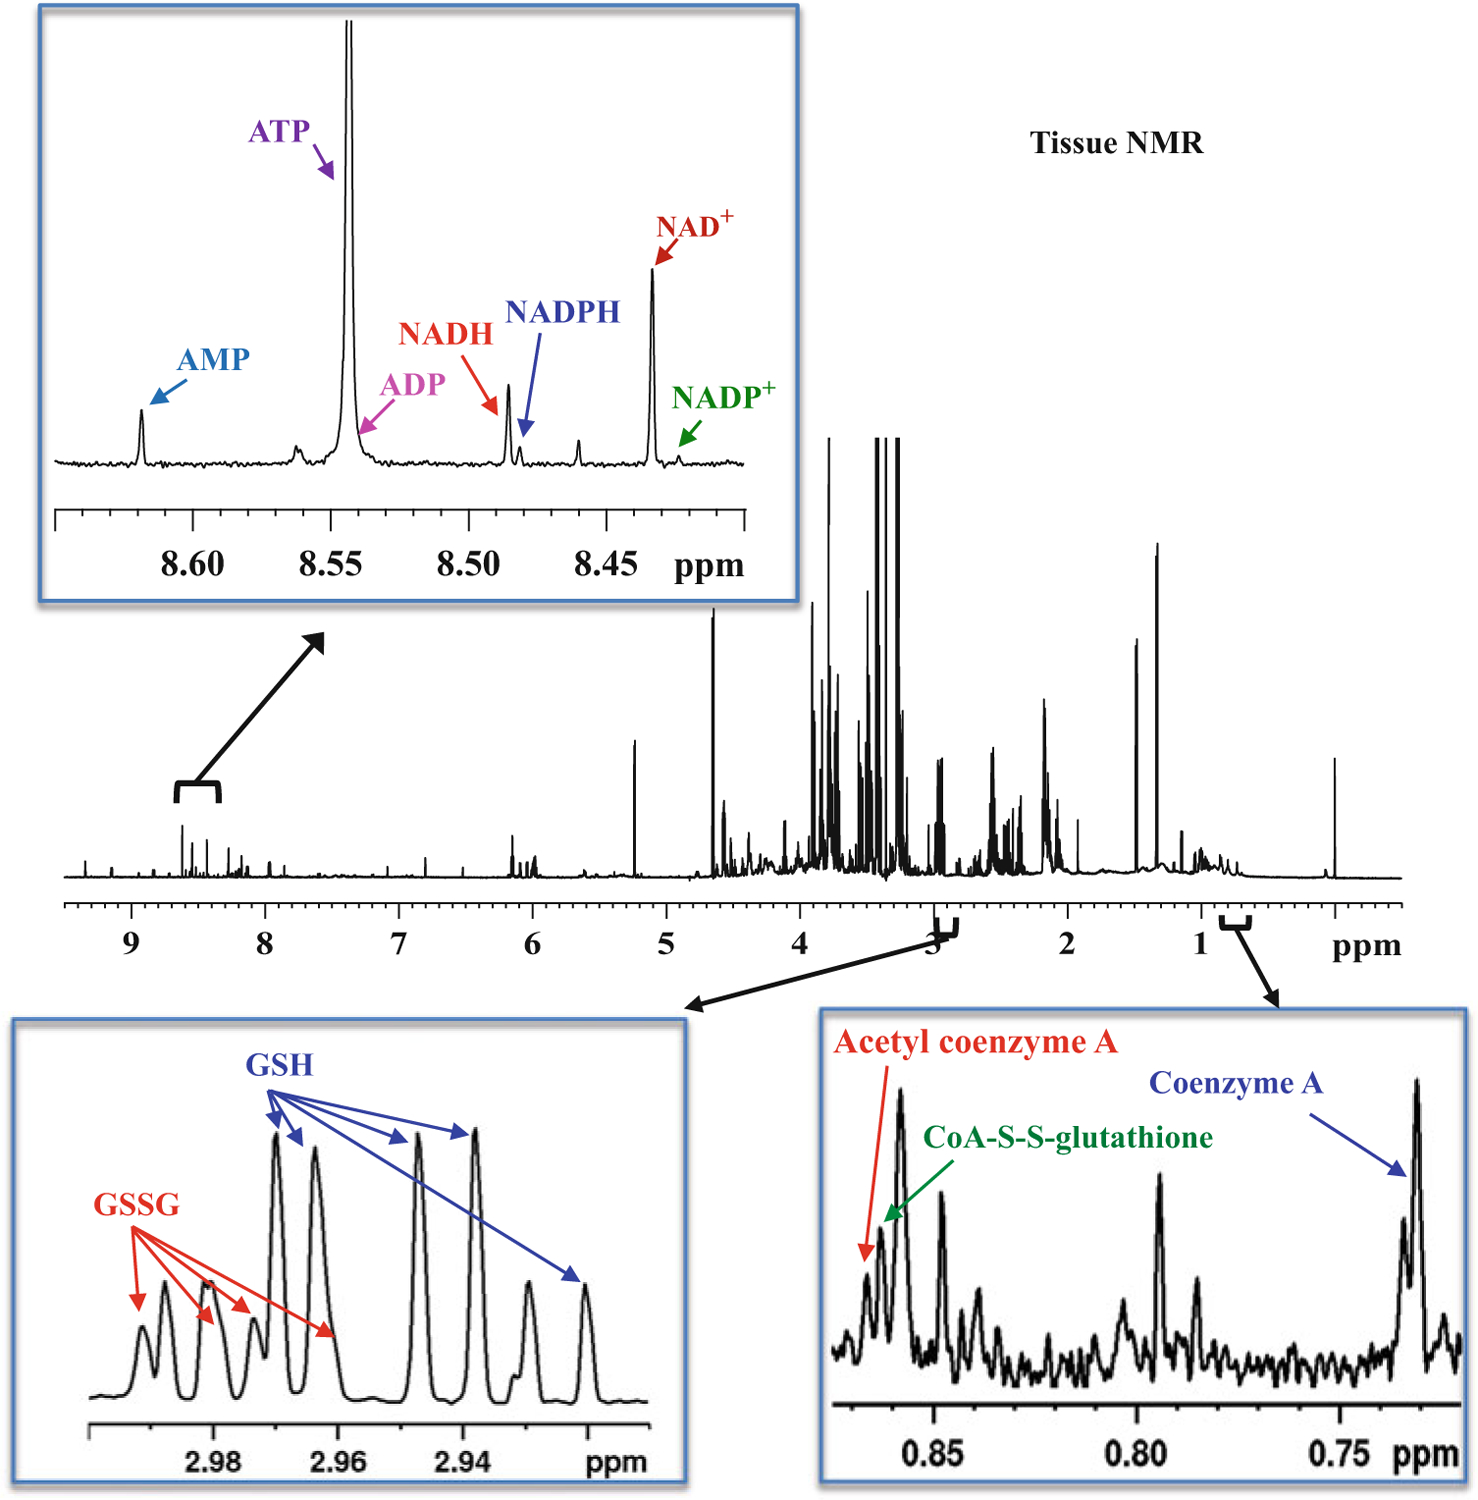
Typical 800-MHz 1H NMR spectrum of a mouse heart tissue extract with expanded regions labeled with characteristic peaks of coenzymes: coenzyme A (CoA), acetyl coenzyme A (acetyl-CoA), coenzyme A glutathione disulfide (CoA-S-S-glutathione), oxidized nicotinamide adenine dinucleotide (NAD+), oxidized nicotinamide adenine dinucleotide phosphate (NADP+), reduced nicotinamide adenine dinucleotide (NADH), reduced nicotinamide adenine dinucleotide phosphate (NADPH), adenosine triphosphate (ATP), adenosine diphosphate (ADP) and adenosine monophosphate (AMP), and antioxidants: reduced glutathione (GSH) and oxidized glutathione (GSSG). Note: ADP peak is too small to be distinguished from ATP peak
Fig. 4.
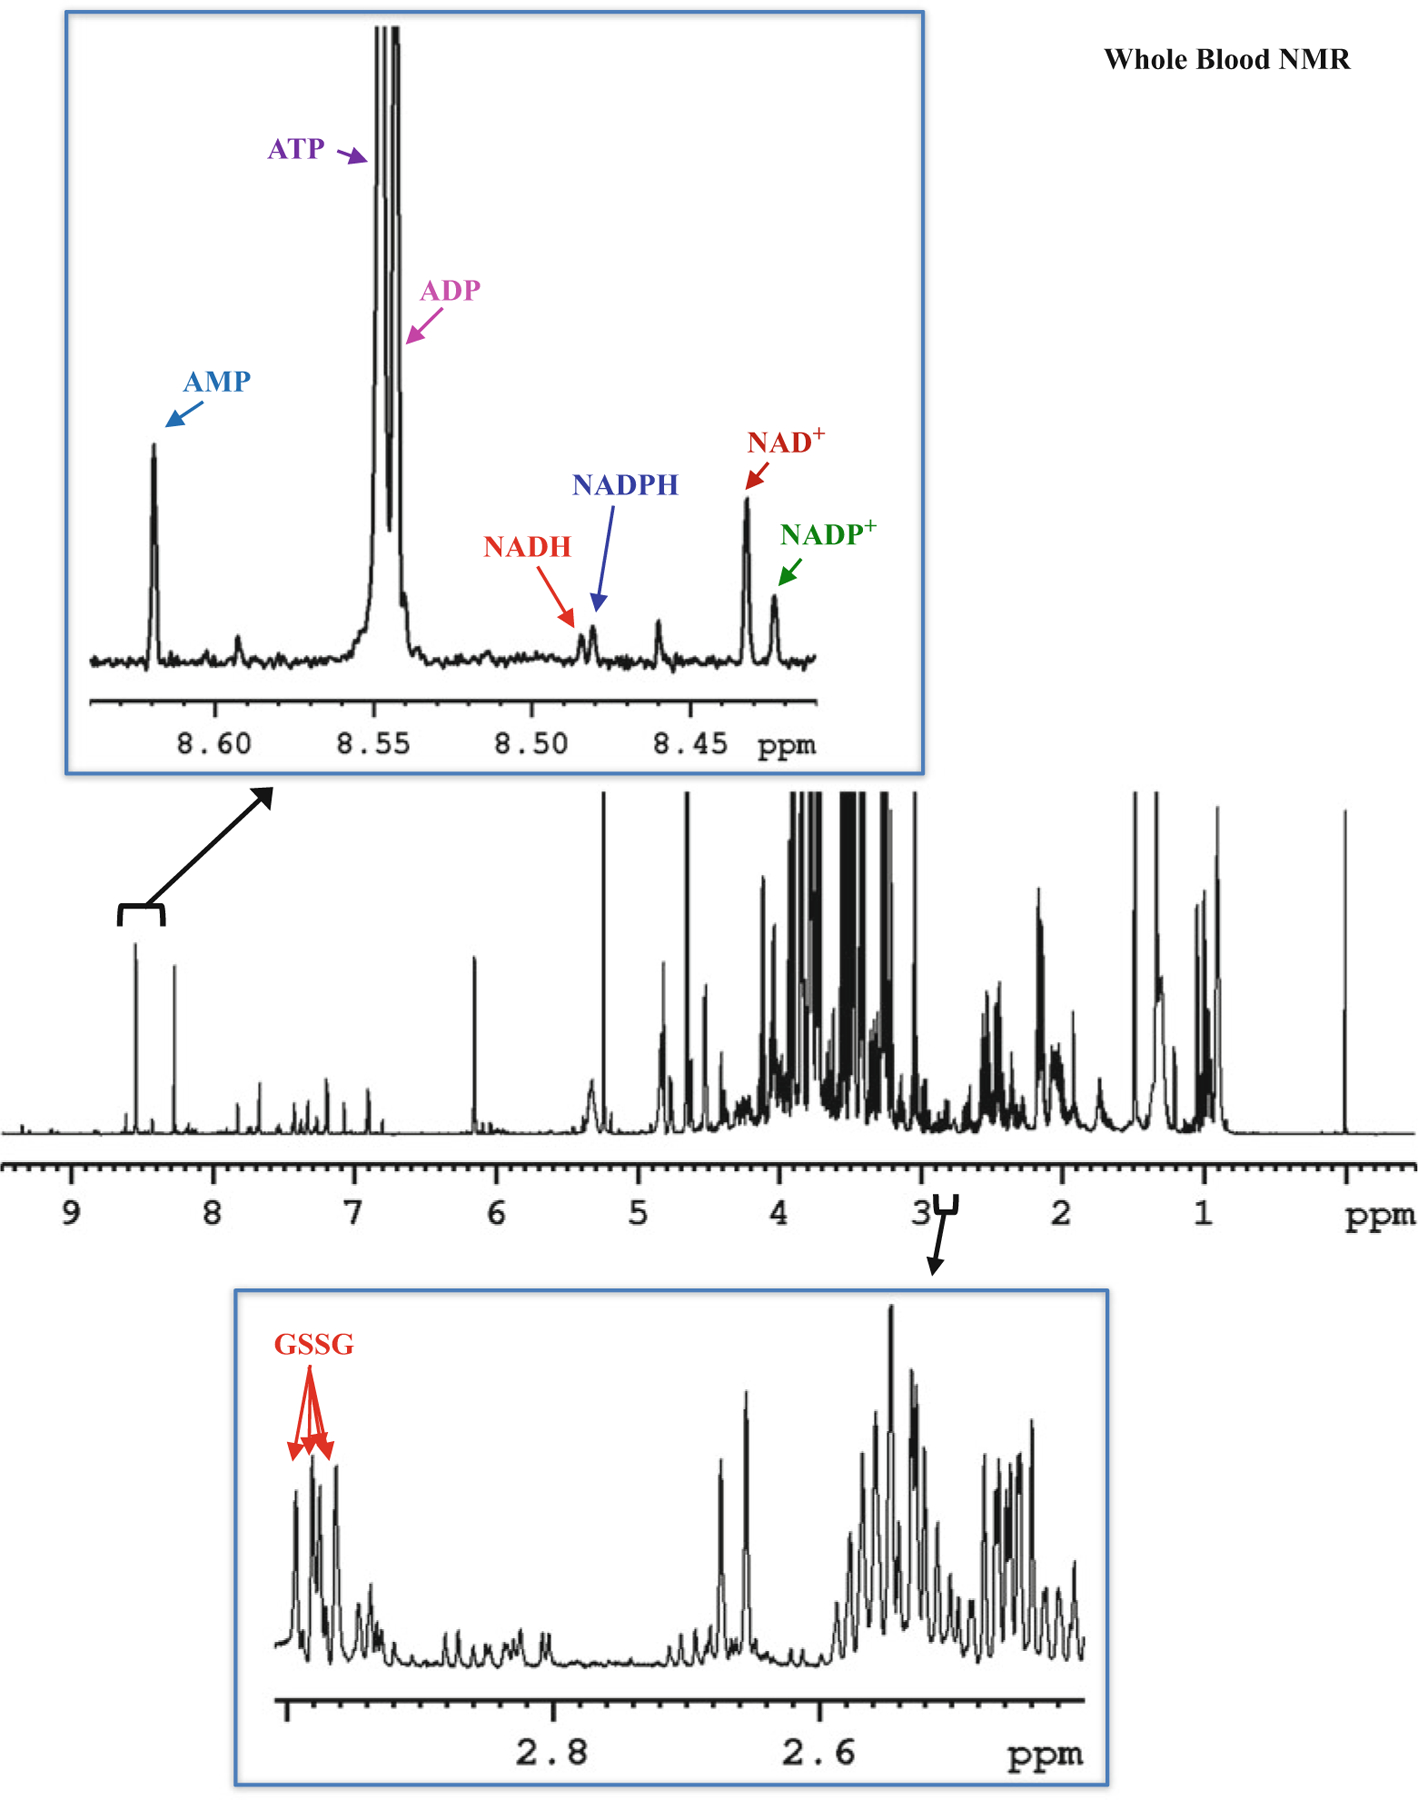
Typical 800-MHz 1H NMR spectrum of human whole blood extract with expanded regions labeled with characteristic peaks of coenzymes: oxidized nicotinamide adenine dinucleotide (NAD+), oxidized nicotinamide adenine dinucleotide phosphate (NADP+), reduced nicotinamide adenine dinucleotide (NADH), reduced nicotinamide adenine dinucleotide phosphate (NADPH), adenosine triphosphate (ATP), adenosine diphosphate (ADP) and adenosine monophosphate (AMP), and antioxidant: oxidized glutathione (GSSG)
Fig. 5.
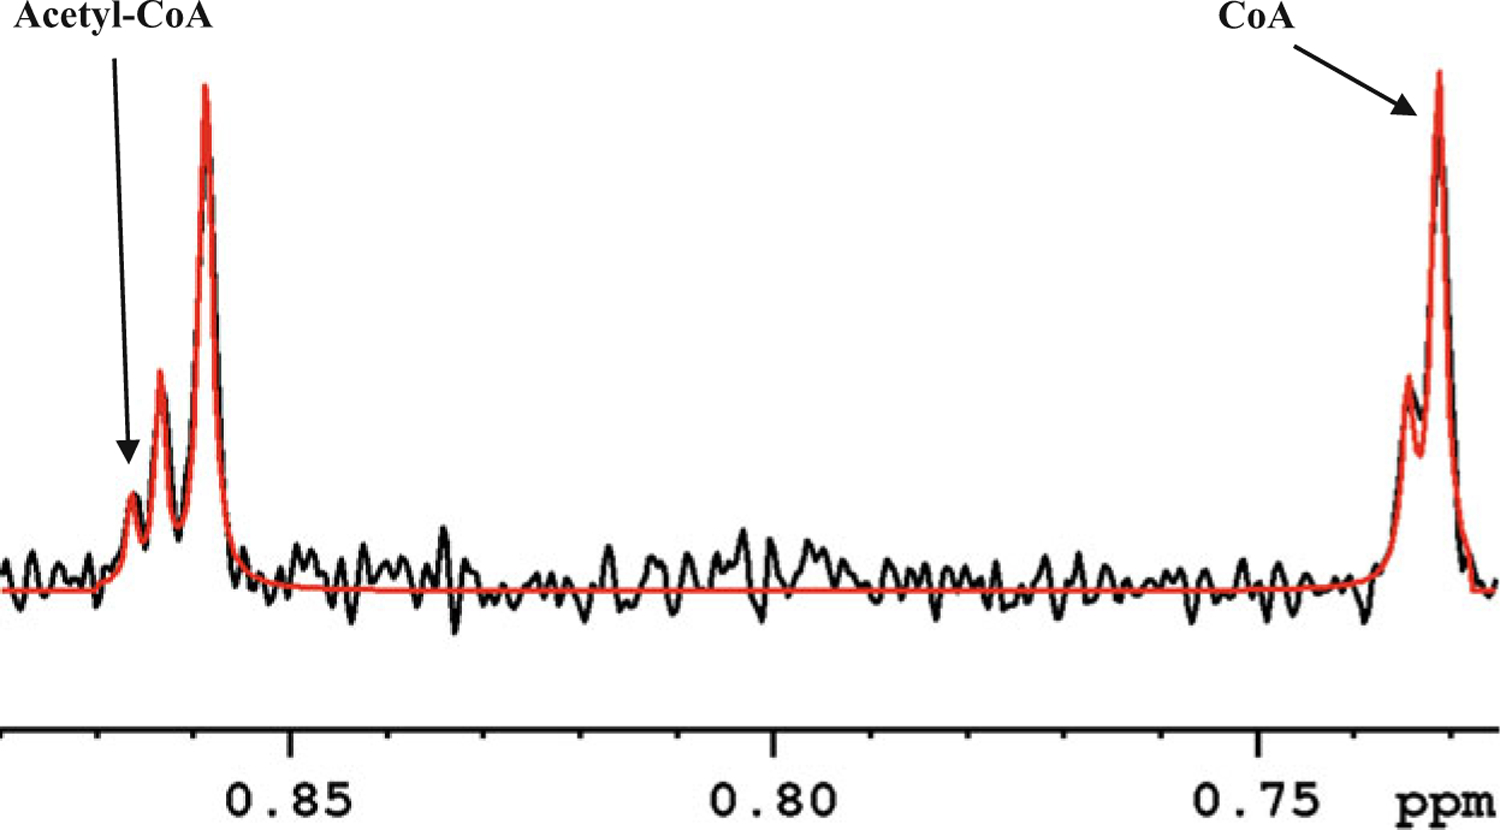
A portion of the 800-MHz 1H NMR spectrum of a typical mouse heart tissue extract highlighting deconvolution of the characteristic peaks of CoA and acetyl-CoA for peak integration: black, experimental spectrum; red, deconvoluted spectrum using Bruker TopSpin software
Acknowledgements
We acknowledge financial support from the NIH (National Institute of General Medical Sciences 2R01GM085291).
4 Notes
We describe analysis of coenzymes using mouse tissue; however, a similar procedure can be extended to other types of tissue.
The pH of the buffer solution should be 7.4. A variation of pH by about 0.1 from 7.4, however, does not alter the chemical shifts appreciably and hence such solutions may be used without further pH correction.
A spectrometer frequency of 600 MHz or higher is preferred owing to the closely spaced chemical shifts for many coenzymes.
NMR instrument vendor, Bruker, provides TopSpin NMR data processing software free of cost for academic use.
5-mm tubes are generally used for metabolite analysis; however, the use of 3-mm NMR tubes helps improve both resolution and sensitivity significantly even with 5-mm NMR probes.
It is important to note that the coenzymes such as CoA, NADH, NADPH, and ATP and the antioxidant GSH are extremely labile and they can evade detection wholly or partly depending on the procedure used for tissue harvesting/extraction (see Fig. 1). Quickly washing the harvested tissue with a solution containing glucose and pyruvate, freeze clamping using tweezers precooled with liquid nitrogen, followed by extraction, or storing at −80 °C until analysis retains the integrity of the coenzymes.
Use heparinized plasma tubes for blood collection since heparin does not interfere with the analysis of whole blood or plasma metabolites. Avoid citrate and EDTA plasma tubes for blood collection as citrate and EDTA interfere with the analysis of whole blood or plasma metabolites.
Whole blood can be used to analyze other metabolites apart from the coenzymes. Red blood cells constitute more than 99% of the blood cells and are metabolically active even at 4 °C. Glycolysis is the major metabolic pathway in RBC and under hypoxic conditions RBCs exhibit accelerated glucose consumption leading to accumulation of lactate [20, 21]. Hence, to avoid metabolic activity, it is important to analyze the samples as soon as the blood is obtained or store immediately at −80 °C until analysis.
This procedure is optimized for mouse heart tissue extraction. Further standardization may be required for other types of tissue to optimize the extraction of the coenzymes.
If the sample is dissolved in 200 μL buffer, use a 3-mm NMR tube. However, if the sample is dissolved in 600 μL buffer, transfer the solution to a 5-mm NMR tube. Use of a 3-mm NMR tube is recommended, since it provides significantly higher sensitivity as well as better resolution.
In solution, the coenzymes CoA, NADH, and NADPH decrease with time and the levels of their oxidized forms, CoA-S-S-glutathione, NAD+, and NADP+, increase proportionately. However, degassing the NMR solvent and flushing the sample tube with helium gas followed by sealing the tube with parafilm prevented such changes (see Fig. 2). Therefore, either the solutions should be analyzed as soon as they are made or the solvent and the sample tube should be degassed using an inert gas such as helium.
This procedure is optimized for human whole blood. However, the protocol can be extended for blood from other sources.
Cell debris and precipitated protein lie in between the top aqueous layer and bottom chloroform layer.
If the result of 1D gradient shimming is good (final standard deviation of Bo of typically ~0.2 Hz), there is no need for 3D shimming (skip Subheading 3.4, step 7) from the magnet and proceed to the next section.
We recommend using the 1D NOESY pulse sequence with presaturation of the signal from residual water.
These are typical parameters. The parameters can be altered depending on the sample amount and the requirement of specific resolution and quantitation accuracy. For accurate quantitation, use a recycle delay 5 times T1 of the signal with the longest relaxation time or perform relaxation correction to compensate for a shorter recycle delay [22].
Chemical shifts of the characteristic peaks that can be used for quantitation are given in Table 1.
CoA and acetyl-CoA are not detected in whole blood.
Due to weak and closely spaced coenzyme peaks, we recommend peak deconvolution as shown in Fig. 5 to obtain accurate peak areas.
The number of protons in the characteristic peaks are represented as follows: 9 for the reference TSP (0 ppm), 3 for CoA (0.7315 ppm) and acetyl-CoA (0.8674 ppm), 2 for GSH (2.955 ppm), and 1 for NAD+ (8.434 ppm), NADP+ (8.424 ppm), NADH (8.486 ppm), NADPH (8.481 ppm), ATP (8.549 ppm), ADP (8.544 ppm), AMP (8.619 ppm), and GSSG (2.976 ppm) (see Table 1).
References
- 1.Kilfoil PJ, Tipparaju SM, Barski OA, Bhatnagar A (2013) Regulation of ion channels by pyridine nucleotides. Circ Res 112(4):721–741 [DOI] [PMC free article] [PubMed] [Google Scholar]
- 2.Koch-Nolte F, Haag F, Guse AH, Lund F, Ziegler M (2009) Emerging roles of NAD+ and its metabolites in cell signaling. Sci Signal 2(57):mr1 10.1126/scisignal.257mr1 [DOI] [PubMed] [Google Scholar]
- 3.Ying W (2008) NAD+/NADH and NADP+/NADPH in cellular functions and cell death: regulation and biological consequences. Antioxid Redox Signal 10(2):179–206 [DOI] [PubMed] [Google Scholar]
- 4.Engel PC (2014) Glutamate dehydrogenases: the why and how of coenzyme specificity. Neurochem Res 39(3):426–432 [DOI] [PubMed] [Google Scholar]
- 5.Aquilano K, Baldelli S, Ciriolo MR (2014) Glutathione: new roles in redox signaling for an old antioxidant. Front Pharmacol 5:196 10.3389/fphar.2014.00196 [DOI] [PMC free article] [PubMed] [Google Scholar]
- 6.Bar-Or D, Bar-Or R, Rael LT, Brody EN (2015) Oxidative stress in severe acute illness. Redox Biol 4:340–345 [DOI] [PMC free article] [PubMed] [Google Scholar]
- 7.Du J, Cleghorn W, Contreras L, Linton JD, Chan GC, Chertov AO et al. (2013) Cytosolic reducing power preserves glutamate in retina. Proc Natl Acad Sci U S A 110 (46):18501–18506 [DOI] [PMC free article] [PubMed] [Google Scholar]
- 8.Smith JS, Brachmann CB, Celic I, Kenna MA, Muhammad S, Starai VJ et al. (2000) A phylogenetically conserved NAD+-dependent protein deacetylase activity in the Sir2 protein family. Proc Natl Acad Sci U S A 97:6658–6663 [DOI] [PMC free article] [PubMed] [Google Scholar]
- 9.Allred JB, Guy DG (1969) Determination of coenzyme A and acetyl CoA in tissue extracts. Anal Biochem 29:293–299 [DOI] [PubMed] [Google Scholar]
- 10.Kato T (1975) CoA cycling: an enzymatic amplification method for determination of CoASH and acetyl CoA. Anal Biochem 66:373–392 [DOI] [PubMed] [Google Scholar]
- 11.Szutowicz A, Bielarczyk H (1987) Elimination of CoASH interference from acetyl-CoA cycling assay by maleic anhydride. Anal Biochem 164:292–296 [DOI] [PubMed] [Google Scholar]
- 12.Takamura Y, Kitayama Y, Arakawa A, Yamanaka S, Tosaki M, Ogawa Y (1985) Malonyl-CoA: acetyl-CoA cycling. A new micromethod for determination of acyl-CoAs with malonate decarboxylase. Biochim Biophys Acta 834:1–7 [DOI] [PubMed] [Google Scholar]
- 13.Sporty JL, Kabir MM, Turteltaub KW, Ognibene T, Lin SJ, Bench G (2008) Single sample extraction protocol for the quantification of NAD and NADH redox states in Saccharomyces cerevisiae. J Sep Sci 31 (18):3202–3211 [DOI] [PMC free article] [PubMed] [Google Scholar]
- 14.Evans C, Bogan KL, Song P, Burant CF, Kennedy RT, Brenner C (2010) NAD+ metabolite levels as a function of vitamins and calorie restriction: evidence for different mechanisms of longevity. BMC Chem Biol 10:2 10.1186/1472-6769-10-2 [DOI] [PMC free article] [PubMed] [Google Scholar]
- 15.Trammell SA, Brennera C (2013) Targeted, LCMS-based metabolomics for quantitative measurement of NAD(+) metabolites. Comput Struct Biotechnol J 4:e201301012 10.5936/csbj.201301012 [DOI] [PMC free article] [PubMed] [Google Scholar]
- 16.Nagana Gowda GA, Gowda YN, Raftery D (2015) Expanding the limits of human blood metabolite quantitation using NMR spectroscopy. Anal Chem 87(1):706–715 [DOI] [PMC free article] [PubMed] [Google Scholar]
- 17.Nagana Gowda GA, Abell L, Lee CF, Tian R, Raftery D (2016) Simultaneous analysis of major coenzymes of cellular redox reactions and energy using ex vivo (1)H NMR spectroscopy. Anal Chem 88(9):4817–4824 [DOI] [PMC free article] [PubMed] [Google Scholar]
- 18.Nagana Gowda GA, Raftery D (2017) Whole blood metabolomics by 1H NMR spectroscopy provides a new opportunity to evaluate coenzymes and antioxidants. Anal Chem 89 (8):4620–4627 [DOI] [PMC free article] [PubMed] [Google Scholar]
- 19.Nagana Gowda GA, Abell L, Tian R (2019) Extending the scope of 1H NMR spectroscopy for the analysis of cellular coenzyme A and acetyl coenzyme A. Anal Chem 91:2464–2471. 10.1021/acs.analchem.8b05286 [DOI] [PMC free article] [PubMed] [Google Scholar]
- 20.Murphy JR (1960) Erythrocyte metabolism. II. Glucose metabolism and pathways. J Lab Clin Med 55:286–302 [PubMed] [Google Scholar]
- 21.Hamasaki N, Asakura T, Minakami SJ (1970) Effect of oxygen tension on glycolysis in human erythrocytes. Biochemist 68 (2):157–161 [DOI] [PubMed] [Google Scholar]
- 22.Lane AN (2012) NMR applications in metabolomics In: Fan TW-M, Lane AN, Higashi RM (eds) Handbook of metabolomics. Humana [Google Scholar]


