Abstract
Increasing evidence has shown that noncoding RNAs play significant roles in the initiation, progression, and metastasis of tumours via participating in competing endogenous RNA (ceRNA) networks. However, the survival-associated ceRNA in lung adenocarcinoma (LUAD) remains poorly understood. In this study, we aimed to investigate the regulatory mechanisms underlying ceRNA in LUAD to identify novel prognostic factors. mRNA, lncRNA, and miRNA sequencing data obtained from the GDC data portal were utilized to identify differentially expressed (DE) RNAs. Survival-related RNAs were recognized using univariate Kaplan-Meier survival analysis. We performed functional enrichment analysis of survival-related mRNAs using the clusterProfiler package of R and STRING. lncRNA-miRNA and miRNA-mRNA interactions were predicted based on miRcode, Starbase, and miRanda. Subsequently, the survival-associated ceRNA network was constructed for LUAD. Multivariate Cox regression analysis was used to identify prognostic factors. Finally, we acquired 15 DE miRNAs, 49 DE lncRNAs, and 843 DE mRNAs associated with significant overall survival. Functional enrichment analysis indicated that survival-related DE mRNAs were enriched in cell cycle. The survival-associated lncRNA-miRNA-mRNA ceRNA network was constructed using five miRNAs, 49 mRNAs, and 21 lncRNAs. Furthermore, seven hub RNAs (LINC01936, miR-20a-5p, miR-31-5p, TNS1, TGFBR2, SMAD7, and NEDD4L) were identified based on the ceRNA network. LINC01936 and miR-31-5p were found to be significant using the multifactorial Cox regression model. In conclusion, we successfully constructed a survival-related lncRNA-miRNA-mRNA ceRNA regulatory network in LUAD and identified seven hub RNAs, which provide novel insights into the regulatory molecular mechanisms associated with survival of LUAD, and identified two independent prognostic predictors for LUAD.
1. Introduction
Lung cancer is the most commonly diagnosed and lethal malignancy worldwide [1]. Lung adenocarcinoma (LUAD) is a common subtype of lung cancer [2]. Despite the recent advances in targeted therapeutic strategies, the outcomes of the available treatment strategies for LUAD remain unsatisfactory owing to the drug resistance and relapse, and the five-year overall survival is less than 20% [3]. Therefore, there is an urgent need to understand the molecular mechanisms underlying the pathogenesis of LUAD and identify novel potential prognostic biomarkers to improve prognosis of the disease.
Genetic mutations and dysregulation that can contribute to the pathogenesis of cancer are served as biomarkers. Mutations in epidermal growth factor receptor (EGFR) occur in approximately 20% cases of lung cancer [4], and epidermal growth factor receptor-tyrosine kinase inhibitors (EGFR-TKIs) are indispensable in the treatment of EGFR-mutant advanced LUAD. Next-generation sequencing technology has been used to study the role of various RNAs in greater depth. Long noncoding RNAs (lncRNAs) have been considered as potential biomarkers and therapeutic targets due to their unique expression in various cells [5]. Several studies have indicated that dysregulation of lncRNAs, such as MIR31HG [6] and LINC01512 [7], promotes the progression and proliferation of tumour cells in LUAD. microRNAs (miRNAs) play a crucial role in the regulation of protein expression and therefore are considered potential biomarkers in cancer diagnosis. Wang et al. [8] identified a four-miRNA signature comprising miR-142-5p, miR-409-3p, miR-223-3p, and miR-146a-5p, for an early detection of LUAD. Xu et al. [9] reported that miRNA-21, miRNA-125b, and miRNA-224 are associated with chemotherapy sensitivity in patients with LUAD. However, the RNA biomarkers require a critical review before their application for clinical decision-making.
The competing endogenous RNA (ceRNA) network hypothesis, which states that noncoding RNAs (ncRNAs), miRNAs, and mRNAs communicate with each other through microRNA response elements (MREs), has been implicated in posttranscriptional regulation [10, 11]. miRNAs repress the translation of target mRNAs by partial or complete complementary binding to MREs on their target RNA transcripts [12, 13]. ncRNAs can act as endogenous miRNA sponges to competitively bind miRNAs through shared MREs to regulate the expression levels of mRNAs, thereby forming specific ceRNA regulatory network comprising ncRNA-miRNA-mRNA interactions [14]. In the past decade, the study of ceRNAs has gained increased attention and several studies have reported their involvement in tumorigenesis [15], migration [16], and prognosis [17]. For example, lncRNA MAFG-AS1 regulates the expression of MAFG to facilitate proliferation of LUAD cells via miR-744-5p [18]. The ceRNA hypothesis provides novel insights into tumorigenesis [19] and biomarker identification [11] at the system biology level.
Bioinformatics techniques are used to integrate and analyse large-scale genomic data, such as RNA-Seq and microarray, to discover potential molecular mechanisms and identify biomarkers, and to guide further experiments. Kumar et al. identified hub genes as potential biomarkers from a large number of differentially expressed (DE) genes by protein-protein interaction (PPI) network [20] and enrichment analysis [21, 22], providing valuable ideas for further study. Wan et al. [23] identified a prognosis-associated ceRNA axes in prostate cancer based on RNA sequencing data using bioinformatics approaches, and validated their regulatory mechanisms by cell proliferation and dual luciferase reporter assay.
In this study, we aimed to construct a ceRNA network associated with survival in DE genes to reveal the molecular mechanisms underlying LUAD and initially identify prognostic factors, thereby to provide new ideas for further biological experiments. In addition to identifying the relationship among various RNAs based on the RNA interaction database, we also performed three statistical tests on lncRNA-mRNA pairs to screen for significant ceRNA interactions based on the ceRNA network hypothesis. The concise LUAD ceRNA network proposed by us would provide accurate and reliable results for subsequent studies.
2. Materials and Methods
2.1. Data Source and Preprocessing
The GDC data portal (https://portal.gdc.cancer.gov/) [24] is an accessible high-quality cancer genome data-sharing platform that provides primary processed genomic data (level 3 data). We acquired level 3 RNA-Seq (including mRNA and lncRNA) and miRNA-Seq RNA expression data (HTSeq-counts), and clinical information of LUAD patients, who were part of TCGA project from GDC on October 15, 2019. After excluding duplicate samples and other tissue samples, mRNA and lncRNA dataset included 524 cancer samples and 59 adjacent nontumour tissue samples and isoform quantification data from miRNA-Seq included 516 cancer samples and 46 adjacent nontumour tissue samples.
The RNA-Seq and miRNA-Seq data were processed using the R package GDCRNATools [25]. The raw RNA counts were normalised using the trimmed mean of M value (TMM) method [26] and transformed via the voom method [27], wherein the RNAs with lower expression, where the log CPM was found to be lower than 1 in more than half of the samples, were filtered out. The procedure followed in this study is demonstrated in Figure 1.
Figure 1.
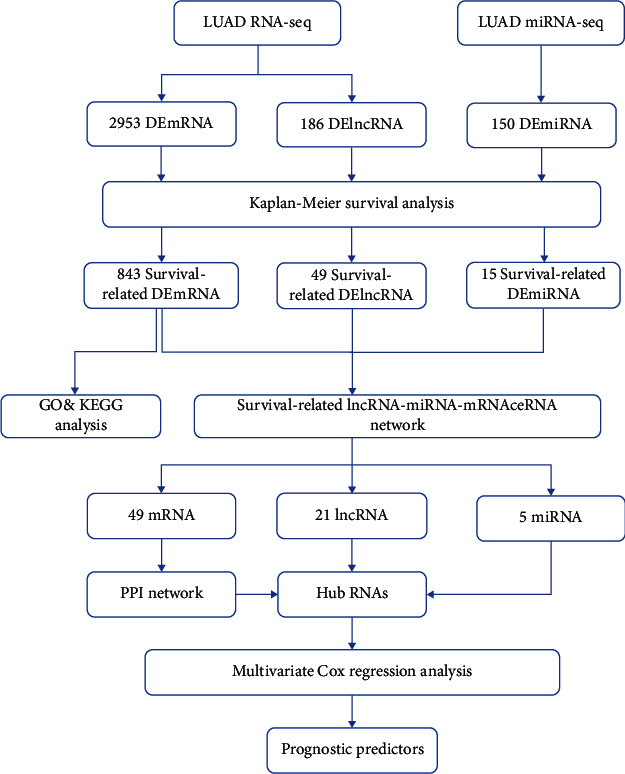
Flow chart of ceRNA network construction.
2.2. Differential Expression Analysis
The limma [28] method was used to identify DE RNAs. Fold change (FC) refers to the differences in RNA expression within samples, and the ∣FC | >2 as the threshold value was set based on previous studies on the ceRNA network [29, 30]. ∣FC | >2 and false discovery rate (FDR) < 0.01 were considered statistically significant. Compared to adjacent nontumour tissue samples, RNAs with a higher expression level (FC > 2) in tumour tissue samples were considered upregulated DE RNAs, whereas RNAs with lower expression level (FC < −2) were considered downregulated DE RNAs.
2.3. Survival Analysis of DE RNAs
Univariate Kaplan-Meier survival analysis was performed to determine the correlation between the expression level of each DE RNA and the survival time of patients with LUAD. LUAD patients were categorised into high- and low-expression groups based on the median expression of certain DE RNAs. The hazard ratio (HR) of the two groups was evaluated using the Kaplan-Meier plot, and their difference was assessed by performing the log-rank test using the survival package of R [31]. Results with p < 0.05 were considered statistically significant.
2.4. Functional Enrichment Analysis
The clusterProfiler package [32] of R software is a widely used method for functional enrichment analysis. This package performs overrepresentation and hypergeometric tests to identify DE mRNAs enriched in biological functions or processes. Several enrichment methods ignore the numerical information of DE mRNAs. However, the STRING database (https://string-db.org/) [33] provides another platform to analyse the numerical data via the two-sided Kolmogorov-Smirnov test and aggregate fold change test that perform well in various settings [33, 34]. We used aforementioned two tools to perform functional enrichment analysis on survival-related DE mRNAs and their FC value (for STRING). The cut-off value was set as p adjusted < 0.01 for clusterProfiler and FDR < 0.01 for STRING.
2.5. Construction of Survival-Associated ceRNA Networks and Identification of Prognostic Predictors
We used miRcode (http://www.mircode.org/) [35] to predict the potential interactions between survival-related miRNAs and lncRNAs. Starbase (http://starbase.sysu.edu.cn/) [36] and miRanda (http://www.microrna.org/microrna/home.do) [37] were used to predict target genes of survival-related miRNAs. Starbase uses multiple algorithms and Ago-binding sites to predict miRNA target sites and their target genes. miRanda predicts the miRNA-mRNA interactions with optimal sequence complementarity using a weighted dynamic programming algorithm and thermodynamic analysis. Therefore, we chose these two databases to improve the reliability of the prediction outcomes.
The ceRNA hypothesis proposed that lncRNAs and their target mRNAs had a positive correlation and they shared miRNAs. Therefore, the competing endogenous interactions between lncRNA and mRNA were evaluated by performing three different statistical tests using GDCRNATools package to select ceRNA pairs matching the ceRNA hypothesis. First, a hypergeometric test was performed to test whether lncRNA and mRNA significantly share a number of miRNAs. Second, Pearson correlation analysis was performed to test the positive correlation between lncRNA and mRNA expressions. Third, regulation pattern analysis [38] was used to measure the regulatory role of miRNAs on lncRNAs and mRNAs. The test criteria were p < 0.05, and regulation similarity was not equal to 0.
The lncRNA-miRNA-mRNA ceRNA regulatory network associated with the survival of LUAD was constructed using Cytoscape 3.7.1 [39]. Hub nodes of the ceRNA network were identified using Cytoscape plugin cytoHubba [40]. We imported the mRNAs from the ceRNA network into the STRING database [33] and selected “Homo sapiens” in organism and medium confidence in the minimum required interaction score to obtain a PPI network. The hub RNAs were subjected to multivariate Cox regression analysis to identify independent prognostic predictors.
3. Results and Discussion
3.1. Survival-Related DE RNAs
Differential expression analysis identified 1097 (37.15%) upregulated and 1856 (62.85%) downregulated DE mRNAs (Figure 2(a)), 104 (55.91%) upregulated and 82 (44.09%) downregulated DE lncRNAs (Figure 2(b)), and 93 (62.00%) upregulated and 57 (38.00%) downregulated DE miRNAs (Figure 2(c)) between tissue samples and adjacent nontumour tissue samples. Heat maps of the three DE RNAs are shown in Figures S1–S3 in the Supplementary Materials. We further analysed the associations between these DE RNAs and survival time using univariate Kaplan-Meier survival analysis. In total, we identified 15 DE miRNAs, 49 DE lncRNAs, and 843 DE mRNAs with significant overall survival in 511 patients with LUAD for subsequent analysis.
Figure 2.
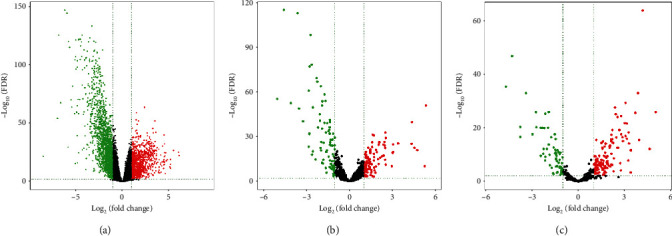
Volcano plots of the DE RNAs: (a) DE mRNAs, (b) DE lncRNAs, and (c) DE miRNAs. The green dots indicated downregulated DE RNAs and the red indicated upregulated DE RNAs in tumour samples. The black dots indicated excluded RNAs.
3.2. Functional Enrichment Analysis of Survival-Related mRNAs
The 843 mRNAs with significant overall survival were analysed using clusterProfiler and STRING for Gene Ontology (GO) enrichment analysis and identified the first 10 terms with p values among three different categories. GO included three different aspects: biological process (BP), cellular component (CC), and molecular function (MF). Figure 3 shows that 36 upregulated mRNAs with high log2FC values were enriched in six terms associated with BP and four cellular components as identified via clusterProfiler. The four terms associated with BP (sister chromatid segregation, nuclear chromosome segregation, mitotic nuclear division, and mitotic sister chromatid segregation) were involved in cell cycle. The four terms associated with CC were involved in chromosome. Figure 4 shows 60 mRNAs enriched in eight terms associated with BP and the two terms associated with CC as identified by STRING. Similar to the clusterProfiler results, three terms associated with BP involved in cell cycle (mitotic cell cycle, cell cycle process, and mitotic cell cycle process) and two terms associated with CC involved in chromosome. For the MF ontology, the catalytic activity acting on DNA was identified using two different methods.
Figure 3.
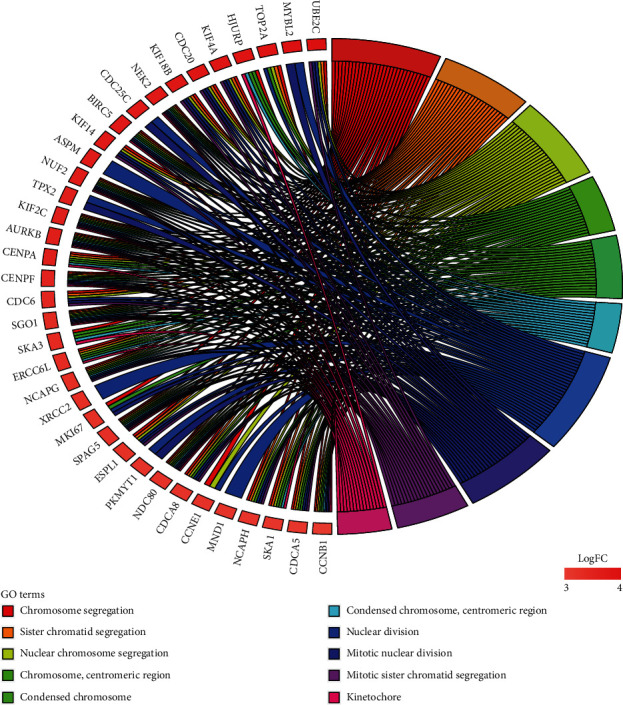
The first 10 GO terms of survival-related DE mRNAs in LUAD from clusterProfiler.
Figure 4.
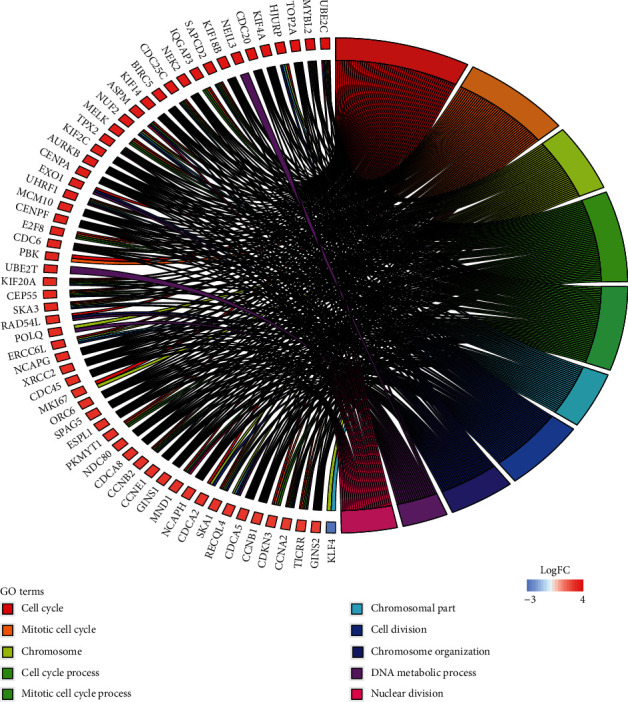
The first 10 terms of survival-related DE mRNAs from STRING.
The clusterProfiler Kyoto Encyclopedia of Genes and Genomes (KEGG) pathway results (Figure 5) indicated that mRNAs were mainly enriched in cell cycle, human T cell leukaemia virus 1 infection, and cell adhesion molecules (CAMs). STRING identified two different pathways, namely, cell cycle and oocyte meiosis.
Figure 5.
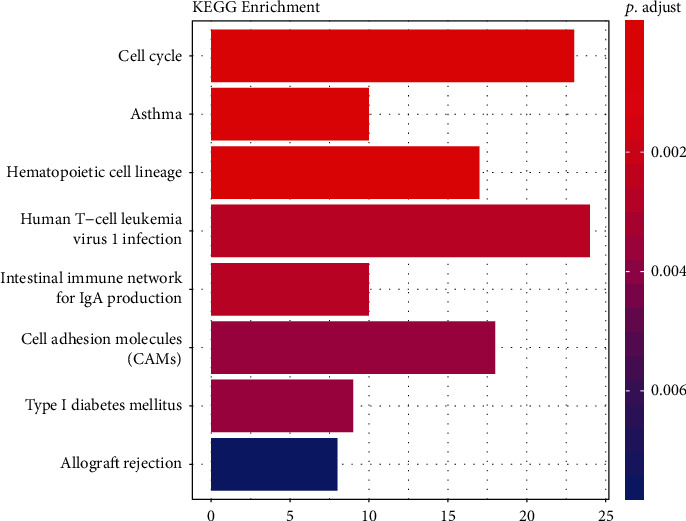
The KEGG pathways of survival-related DE mRNAs in LUAD. The x-axis indicates the number of mRNAs participated in the pathway.
The two methods revealed that DE mRNAs were enriched in the cell cycle process and downstream terms. Cell cycle involves progression of cell and nuclear replication and dysregulation of cell replication and division contributes to tumorigenesis. Several studies have reported that overexpression of cell division cycle-associated genes is associated with tumour cell proliferation indicating poor survival in lung cancer patients [41–43]. Rac3 induces apoptosis of LUAD cells via cell cycle pathway and is associated with longer survival [44]. Other KEGG pathways have rarely been mentioned in earlier studies on LUAD. A previous study indicated that human T cell leukaemia virus type I infection induces gene expression of CAMs in lung epithelial cells [45]. However, the association between these pathways and LUAD has not been reported previously.
3.3. Survival-Related lncRNA-miRNA-mRNA ceRNA Network in LUAD
To investigate the regulatory interaction in survival-related RNAs, we acquired information on lncRNA-miRNA interactions from miRcode and miRNA-mRNA pairs from Starbase and miRanda. Three statistical tests were performed on lncRNA-mRNA pairs to confirm significant ceRNA pairs. The aforementioned results intersected with survival-significant RNAs. Finally, we considered five miRNAs, 49 mRNAs, and 21 lncRNAs (Table 1) to construct a survival-related ceRNA network (Figure 6) comprising 37 pairs of miRNA-lncRNA interaction and 61 pairs of miRNA-mRNA interaction. This network suggests a potential regulatory relationship between lncRNA-miRNA-mRNA in LUAD prognosis. Several RNAs in the ceRNA network have been verified for their regulatory role in lung cancer or other cancers. LINC00857 regulates cell growth, glycolysis, and apoptosis in LUAD [46]. lncRNA MNX1-AS1 regulates the progression of oesophageal squamous cell carcinoma by targeting the miR-34a/SIRT1 axis [47]. However, most of these interactions have not been previously reported to be associated with LUAD.
Table 1.
The characteristic of RNAs in the survival-related ceRNA network.
| Symbol | Differential expression analysis | Kaplan-Meier survival analysis | ||||
|---|---|---|---|---|---|---|
| Log2FC | FDR | HR | Lower 95 | Upper 95 | p value | |
| miRNA | ||||||
| miR-31-5p | 3.0390 | 9.65E − 12 | 1.4150 | 1.0581 | 1.8923 | 0.0200 |
| miR-21-5p | 2.5664 | 2.29E − 47 | 1.4347 | 1.0713 | 1.9214 | 0.0133 |
| miR-148a-3p | 1.4222 | 5.86E − 19 | 0.6238 | 0.4659 | 0.8352 | 0.0014 |
| miR-20a-5p | 1.1251 | 2.26E − 11 | 1.4703 | 1.0965 | 1.9715 | 0.0084 |
| miR-133a-3p | -2.5516 | 1.71E − 28 | 0.7333 | 0.5484 | 0.9806 | 0.0380 |
| lncRNA | ||||||
| MNX1-AS1 | 4.3590 | 2.83E − 40 | 1.3367 | 1.0005 | 1.7858 | 0.0483 |
| VPS9D1-AS1 | 2.4968 | 4.97E − 23 | 1.3603 | 1.0185 | 1.8169 | 0.0364 |
| LINC00857 | 2.0358 | 4.28E − 25 | 1.4144 | 1.0594 | 1.8883 | 0.0196 |
| AP004608.1 | 1.7026 | 9.91E − 04 | 0.7047 | 0.5278 | 0.9410 | 0.0176 |
| AC012236.1 | 1.4183 | 4.53E − 10 | 0.6475 | 0.4847 | 0.8650 | 0.0032 |
| MELTF-AS1 | 1.2753 | 4.49E − 13 | 1.3454 | 1.0073 | 1.7968 | 0.0438 |
| SNHG12 | 1.0474 | 1.98E − 10 | 0.6847 | 0.5128 | 0.9143 | 0.0106 |
| CYP1B1-AS1 | -1.0387 | 8.08E − 10 | 0.7464 | 0.5586 | 0.9975 | 0.0464 |
| HAGLR | -1.1145 | 1.09E − 05 | 0.7330 | 0.5490 | 0.9787 | 0.0358 |
| AC105942.1 | -1.3081 | 1.45E − 28 | 0.7063 | 0.5288 | 0.9433 | 0.0183 |
| LINC01852 | -1.3648 | 8.65E − 37 | 0.7109 | 0.5319 | 0.9500 | 0.0202 |
| AC021016.2 | -1.7220 | 5.30E − 59 | 0.6566 | 0.4915 | 0.8772 | 0.0043 |
| MIR99AHG | -1.7972 | 2.33E − 26 | 0.5727 | 0.4283 | 0.7658 | 0.0002 |
| COLCA1 | -1.8073 | 4.92E − 15 | 0.5809 | 0.4351 | 0.7757 | 0.0003 |
| AC090559.1 | -1.8911 | 4.83E − 36 | 0.6959 | 0.5213 | 0.9292 | 0.0152 |
| AC093278.2 | -1.9808 | 1.96E − 64 | 0.7336 | 0.5495 | 0.9794 | 0.0366 |
| AC125807.2 | -2.2745 | 6.44E − 70 | 1.4521 | 1.0867 | 1.9403 | 0.0111 |
| LINC00261 | -2.6041 | 1.66E − 18 | 0.6957 | 0.5208 | 0.9293 | 0.0138 |
| C8orf34-AS1 | -2.8281 | 8.13E − 24 | 0.7072 | 0.5293 | 0.9450 | 0.0184 |
| LINC01936 | -2.8318 | 1.24E − 61 | 0.6948 | 0.5204 | 0.9277 | 0.0141 |
| LHFPL3-AS2 | -4.0809 | 4.86E − 53 | 0.6555 | 0.4908 | 0.8754 | 0.0044 |
| mRNA | ||||||
| ZFPM2-AS1 | 4.3412 | 8.62E − 26 | 1.3374 | 1.0018 | 1.7855 | 0.0497 |
| COL1A1 | 2.7177 | 1.04E − 39 | 1.4556 | 1.0893 | 1.9450 | 0.0104 |
| CCNA2 | 2.5589 | 2.64E − 22 | 1.7494 | 1.3091 | 2.3379 | 0.0002 |
| E2F7 | 2.2124 | 1.04E − 18 | 1.6952 | 1.2665 | 2.2690 | 0.0003 |
| RALGPS2 | 1.5246 | 1.15E − 20 | 1.5304 | 1.1441 | 2.0470 | 0.0036 |
| PTGFRN | 1.0363 | 2.55E − 18 | 1.4189 | 1.0623 | 1.8951 | 0.0173 |
| PSRC1 | 1.0255 | 7.85E − 11 | 1.4873 | 1.1138 | 1.9860 | 0.0075 |
| PDE4B | -1.0152 | 2.67E − 14 | 0.6564 | 0.4916 | 0.8764 | 0.0046 |
| TMEM64 | -1.0200 | 3.00E − 14 | 1.3977 | 1.0460 | 1.8678 | 0.0225 |
| SH2B3 | -1.0734 | 2.01E − 27 | 0.7333 | 0.5493 | 0.9791 | 0.0371 |
| AKAP13 | -1.1136 | 1.52E − 19 | 0.7233 | 0.5418 | 0.9657 | 0.0294 |
| SATB1 | -1.1413 | 6.49E − 18 | 0.6896 | 0.5162 | 0.9212 | 0.0117 |
| MAP3K8 | -1.1418 | 6.74E − 26 | 0.7273 | 0.5447 | 0.9711 | 0.0313 |
| ZC3H12C | -1.1441 | 5.24E − 22 | 1.5090 | 1.1294 | 2.0163 | 0.0051 |
| SMAD7 | -1.1465 | 6.02E − 34 | 0.7137 | 0.5345 | 0.9529 | 0.0227 |
| PIK3R1 | -1.1601 | 9.04E − 28 | 0.6737 | 0.5044 | 0.8996 | 0.0076 |
| ZNF704 | -1.1669 | 6.09E − 13 | 0.6219 | 0.4645 | 0.8326 | 0.0011 |
| ACSL4 | -1.1765 | 3.70E − 18 | 1.3909 | 1.0409 | 1.8586 | 0.0246 |
| HLA-DQB1 | -1.1923 | 3.72E − 08 | 0.7161 | 0.5362 | 0.9564 | 0.0237 |
| DHCR24 | -1.2171 | 5.25E − 22 | 0.7368 | 0.5511 | 0.9851 | 0.0370 |
| NEDD4L | -1.2227 | 1.94E − 20 | 0.6713 | 0.5026 | 0.8964 | 0.0070 |
| PRDM6 | -1.2377 | 3.06E − 16 | 0.7396 | 0.5539 | 0.9876 | 0.0413 |
| LATS2 | -1.2416 | 4.69E − 46 | 1.3726 | 1.0268 | 1.8348 | 0.0307 |
| VAMP2 | -1.2608 | 9.82E − 36 | 0.7439 | 0.5571 | 0.9933 | 0.0445 |
| ELMO1 | -1.2697 | 3.39E − 24 | 0.6072 | 0.4544 | 0.8115 | 0.0007 |
| CRY2 | -1.2811 | 1.89E − 34 | 0.6354 | 0.4759 | 0.8485 | 0.0023 |
| KAT2B | -1.3000 | 5.49E − 38 | 0.6358 | 0.4760 | 0.8491 | 0.0022 |
| PREX1 | -1.3328 | 1.98E − 27 | 0.7411 | 0.5550 | 0.9896 | 0.0446 |
| DNAJB4 | -1.4016 | 1.31E − 32 | 1.5998 | 1.1981 | 2.1362 | 0.0016 |
| ST6GALNAC6 | -1.4423 | 1.71E − 46 | 0.6509 | 0.4873 | 0.8693 | 0.0037 |
| SYNE1 | -1.4435 | 3.67E − 17 | 0.6758 | 0.5062 | 0.9023 | 0.0088 |
| BTG2 | -1.4892 | 1.34E − 18 | 0.6489 | 0.4858 | 0.8666 | 0.0034 |
| SH3BP5 | -1.5820 | 1.04E − 40 | 0.7327 | 0.5487 | 0.9784 | 0.0351 |
| APBB1 | -1.5852 | 8.53E − 39 | 0.7027 | 0.5262 | 0.9385 | 0.0169 |
| DOCK4 | -1.7393 | 7.68E − 50 | 0.7297 | 0.5466 | 0.9743 | 0.0338 |
| DPYSL2 | -1.7951 | 2.05E − 35 | 0.6223 | 0.4659 | 0.8311 | 0.0014 |
| FAM184A | -1.8098 | 1.53E − 25 | 0.6544 | 0.4898 | 0.8742 | 0.0040 |
| TGFBR2 | -1.8527 | 8.59E − 44 | 0.7118 | 0.5331 | 0.9505 | 0.0214 |
| EGR2 | -1.9011 | 5.23E − 38 | 0.7471 | 0.5596 | 0.9974 | 0.0490 |
| CADM1 | -1.9784 | 1.95E − 21 | 0.6975 | 0.5223 | 0.9316 | 0.0145 |
| ADGRD1 | -2.1115 | 3.18E − 21 | 0.5809 | 0.4348 | 0.7762 | 0.0002 |
| ERG | -2.2631 | 3.57E − 83 | 0.6820 | 0.5108 | 0.9106 | 0.0099 |
| TNS1 | -2.3744 | 2.53E − 47 | 0.6708 | 0.5024 | 0.8957 | 0.0071 |
| WWC2 | -2.4801 | 2.28E − 84 | 1.4189 | 1.0609 | 1.8976 | 0.0168 |
| KLF4 | -2.6071 | 1.81E − 45 | 1.3800 | 1.0334 | 1.8428 | 0.0290 |
| SEMA6D | -2.6946 | 9.92E − 61 | 0.6391 | 0.4784 | 0.8536 | 0.0025 |
| ANKRD29 | -3.0374 | 6.21E − 50 | 0.6755 | 0.5052 | 0.9031 | 0.0074 |
| LAMP3 | -3.4411 | 1.33E − 42 | 0.7487 | 0.5607 | 0.9997 | 0.0496 |
| NCKAP5 | -4.4780 | 1.21E − 116 | 0.6821 | 0.5109 | 0.9106 | 0.0101 |
FC: fold change; HR: hazard ratio; FDR: false discovery rate.
Figure 6.
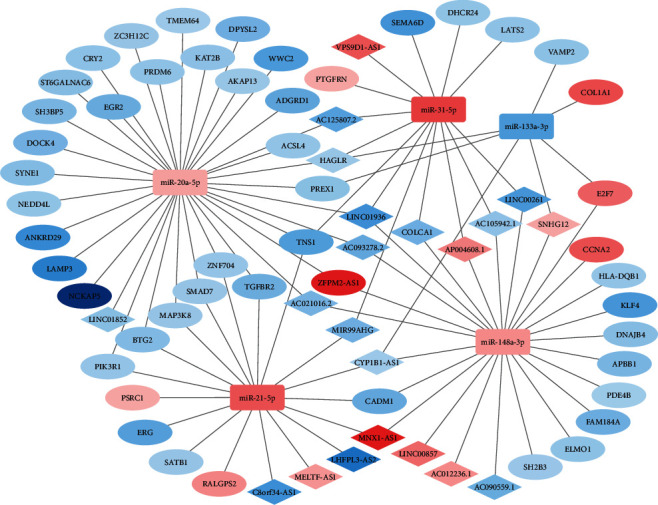
Survival-related lncRNA-miRNA-mRNA ceRNA network of LUAD. The diamonds represent lncRNAs, ellipse mRNAs, and square miRNAs. The red represents upregulated genes, and the blue represents downregulated genes. The shade of the colour represents the magnitude of the value.
The number of mRNAs in the ceRNA network was insignificant to perform functional enrichment analysis via clusterProfiler or STRING. Therefore, we used the PANTHER classification system [48] available on the GO website (http://geneontology.org/). The cellular components and KEGG pathways showed no significant results. All 48 genes, except ZFPM2-AS1, were identified and enriched in 38 terms associated with BP and three terms associated with MF. The results were sorted based on hierarchical relation of terms via PANTHER, with the parent term indented below the subclass (Table 2). Major genes were enriched in the regulation of cellular process (GO:0051244), response to stimulus (GO:0050896), signalling (GO:0023052), and their subclass. The regulation of cellular process involves the regulation of the rate, frequency, and extent of cellular processes. The signalling is a process that transmits information in biological systems. Moreover, the end of signal transduction (GO:0007165) regulates the initiation of transcription [49, 50]. In general, genes in the ceRNA network regulate the activity of various enzymes, participate in signal transduction, and indirectly regulate the initiation of transcription.
Table 2.
GO enrichment analysis of mRNAs in survival-related ceRNA network.
| GO terms | Count | FDR |
|---|---|---|
| Biological process | ||
| Regulation of cyclin-dependent protein serine/threonine kinase activity | 4 | 4.42E − 02 |
| Regulation of cyclin-dependent protein kinase activity | 4 | 4.57E − 02 |
| Regulation of cellular process | 40 | 3.16E − 02 |
| Biological regulation | 42 | 3.99E − 02 |
| Regulation of protein kinase activity | 9 | 4.20E − 02 |
| Regulation of kinase activity | 11 | 6.06E − 03 |
| Regulation of transferase activity | 12 | 3.64E − 03 |
| Regulation of catalytic activity | 19 | 3.22E − 03 |
| Regulation of molecular function | 22 | 4.67E − 03 |
| Regulation of protein metabolic process | 17 | 4.94E − 02 |
| Regulation of developmental growth | 7 | 1.11E − 02 |
| Regulation of developmental process | 17 | 3.08E − 02 |
| Regulation of growth | 10 | 3.67E − 03 |
| Response to peptide hormone | 8 | 4.51E − 03 |
| Response to peptide | 9 | 2.89E − 03 |
| Response to chemical | 26 | 4.58E − 03 |
| Response to stimulus | 36 | 3.70E − 03 |
| Response to organonitrogen compound | 11 | 1.12E − 02 |
| Response to organic substance | 21 | 2.89E − 03 |
| Response to nitrogen compound | 11 | 2.17E − 02 |
| Response to hormone | 11 | 3.42E − 03 |
| Response to endogenous stimulus | 14 | 3.83E − 03 |
| Regulation of cell growth | 7 | 3.11E − 02 |
| Negative regulation of catalytic activity | 9 | 4.37E − 02 |
| Negative regulation of transcription by RNA polymerase II | 10 | 3.35E − 02 |
| Negative regulation of nitrogen compound metabolic process | 16 | 4.36E − 02 |
| Negative regulation of protein metabolic process | 11 | 2.51E − 02 |
| Intracellular signal transduction | 16 | 2.70E − 03 |
| Signal transduction | 28 | 2.62E − 03 |
| Signalling | 29 | 2.70E − 03 |
| Cell communication | 29 | 2.93E − 03 |
| Cellular response to stimulus | 30 | 2.19E − 02 |
| Negative regulation of multicellular organismal process | 11 | 4.31E − 02 |
| Regulation of multicellular organismal process | 20 | 1.06E − 02 |
| Regulation of cell differentiation | 15 | 1.14E − 02 |
| Cell differentiation | 22 | 9.65E − 03 |
| Cellular developmental process | 22 | 1.17E − 02 |
| Positive regulation of biological process | 29 | 1.61E − 02 |
| Molecular function | ||
| Guanyl-nucleotide exchange factor activity | 6 | 2.16E − 02 |
| Enzyme binding | 21 | 4.54E − 05 |
| Kinase binding | 10 | 2.18E − 02 |
FDR: false discovery rate.
3.4. Hub RNAs of ceRNA Network and Prognostic Predictor
A subnetwork with 15 hub nodes (Figure 7, Table 3) was identified using maximal clique centrality (MCC) in cytoHubba plug-ins. There were a total of six ceRNA pairs in the subnetwork, among which LINC01936-TNS1 exhibited the highest correlation coefficient (Figure 8) indicating they might have the same expression patterns. LINC01936 and TNS1 were the highest scoring nodes in their respective categories. The ceRNA network suggested LINC01936 and TNS1 interacted with miR-20a-5p and miR-31-5p. Our study demonstrated that lower expression of LINC01936 was associated with longer overall survival (Figure 9(a)). However, the role of LINC01936 in LUAD remains unclear. miR-20a-5p exhibited highest topological parameters, indicating that it plays a crucial role in the ceRNA network. Overexpression of miR-20a-5p promotes the migration and invasion of tumour cells [51] and correlates with a shorter survival [52], which is consistent with the findings of our study (Figure 9(c)). The low expression group of miR-31-5p showed better survival (Figure 9(b)). Wei et al. reported that miR31-5p was upregulated in LUAD patients with lymph node metastasis, and low expression of miR-31 was associated with good prognosis in patients with T2N0 stage [53]. TNS1 participates in fibrillar adhesion formation and cell migration [54] and is involved in signal transduction [55]. However, the role of TNS1 in tumours remains controversial. TNS1 negatively regulates tumour migration and invasion, and its high expression is associated with longer metastasis-free survival in breast cancer [56]. Moreover, higher expression of TNS1 is associated with worse prognosis in colon adenocarcinoma [57]. In this study, we observed that TNS1 was downregulated in LUAD tissues and that higher expression was associated with better prognosis (Figure 9(d)). Based on our analysis, we predicted that LINC01936 regulates TNS1 via miR-20a-5p and miR31-5p. However, the role of TNS1 and its regulatory interaction in LUAD remains unclear and warrants further in vitro and in vivo studies.
Figure 7.
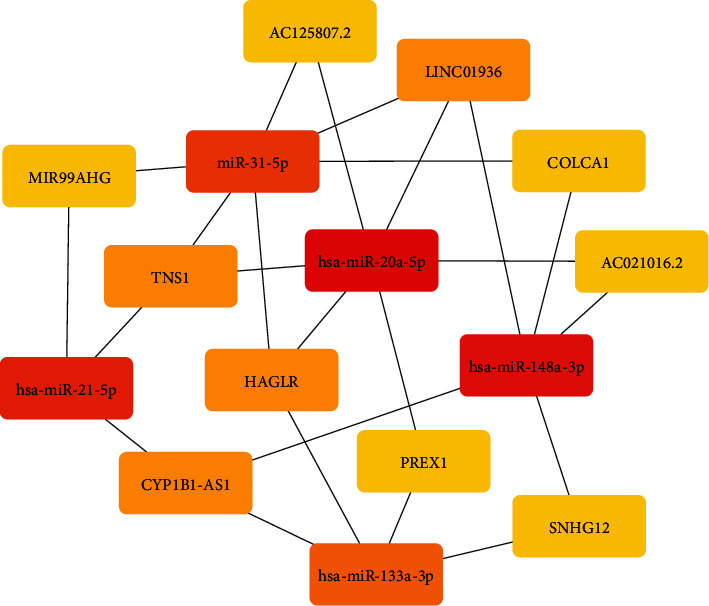
The subnetwork of survival-related ceRNA network. The shade of the colour represents the magnitude of MCC score.
Table 3.
10 hub RNAs in the ceRNA network ranked by the MCC method.
| Rank | Hub RNAs | MCC score | Betweenness centrality | Closeness centrality | Degree |
|---|---|---|---|---|---|
| 1 | miR-20a-5p | 34 | 0.5705 | 0.4933 | 34 |
| 2 | miR-148a-3p | 25 | 0.4053 | 0.4405 | 25 |
| 3 | miR-21-5p | 18 | 0.2492 | 0.4066 | 18 |
| 4 | miR-31-5p | 14 | 0.1858 | 0.3895 | 14 |
| 5 | miR-133a-3p | 7 | 0.0727 | 0.3627 | 7 |
| 6 | LINC01936 | 3 | 0.0724 | 0.4485 | 3 |
| 6 | HAGLR | 3 | 0.0507 | 0.3915 | 3 |
| 6 | CYP1B1-AS1 | 3 | 0.0482 | 0.3719 | 3 |
| 6 | TNS1 | 3 | 0.0506 | 0.4134 | 3 |
| 10 | PREX1 | 2 | 0.0191 | 0.3507 | 2 |
| 10 | MIR99AHG | 2 | 0.016 | 0.3231 | 2 |
| 10 | COLCA1 | 2 | 0.0104 | 0.3348 | 2 |
| 10 | AC021016.2 | 2 | 0.0414 | 0.4134 | 2 |
| 10 | SNHG12 | 2 | 0.0086 | 0.3203 | 2 |
| 10 | AC125807.2 | 2 | 0.0206 | 0.3682 | 2 |
MCC: maximal clique centrality.
Figure 8.
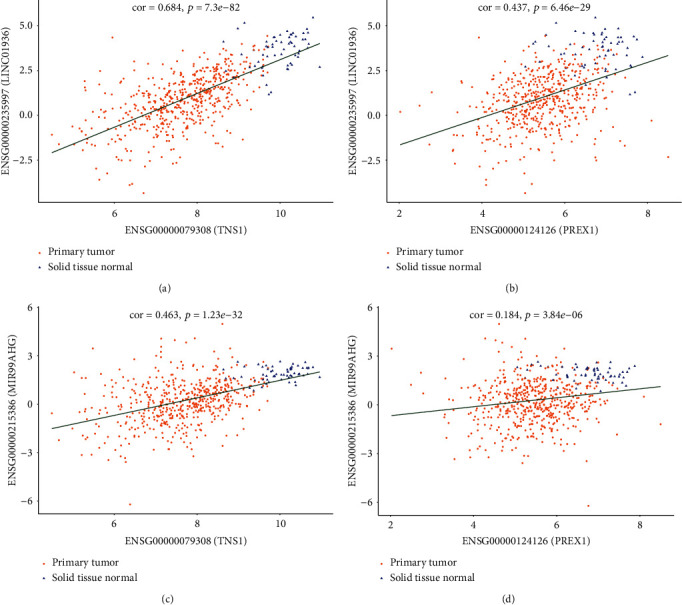
Correlation analysis between lncRNAs and mRNAs of subnetwork: (a) LINC01936 and TNS1, (b) LINC01936 and PREX1, (c) MIR99HG and TNS1, and (d) MIR99HG and PREX1.
Figure 9.

Kaplan-Meier curves of 7 hub RNAs: (a) LINC01936, (b) miR-31-5p, (c) miR-20a-5p, (d) TNS1, (e) TGFBR2, (f) SMAD7, and (g) NEDD4L.
The scale of the ceRNA network constructed in this study was small. Some information may have been lost during the identification of hub genes using network topological parameters alone. Therefore, we included genes from the ceRNA network into the STRING to analyse protein interactions to identify hub genes. The PPI network (Figure 10) demonstrated the protein interactions of the ceRNA network. TGFBR2, SMAD7, and NEDD4L with the highest degree were identified as hub genes in the PPI network. TGFBR2 is the crucial receptor for transforming growth factor-β 1 (TGF-β1). The TGF-β1 ligand binding to TGFBR2 depends on the serine and threonine residues of the receptor, which in turn binds to the TGF-β receptor I to initiate downstream signalling such as Smad and non-Smad signalling pathways to regulate cell proliferation, migration, and apoptosis [58, 59]. TGFBR2 is downregulated in various cancers [60]. Borczuk et al. reported that low expression of TGFBR2 associated with lymph node metastasis in patients with LUAD and increased risk of death [61]. Smad complexes translocate to the nucleus to initiate gene transcription. SMAD7 is an inhibitory Smad molecule that inhibits the formation of Smad complex [62]. Inhibition of miR-21 leads to SMAD7 upregulation, which inhibits cell invasion via TGF-β receptor signalling in non-small-cell lung cancer [63]. A previous study demonstrated that NEDD4L can limit TGF-β signalling by activating SMAD2/3 [64]. Downregulated NEDD4L enhances tumour metastasis and results in poor prognosis [65].
Figure 10.
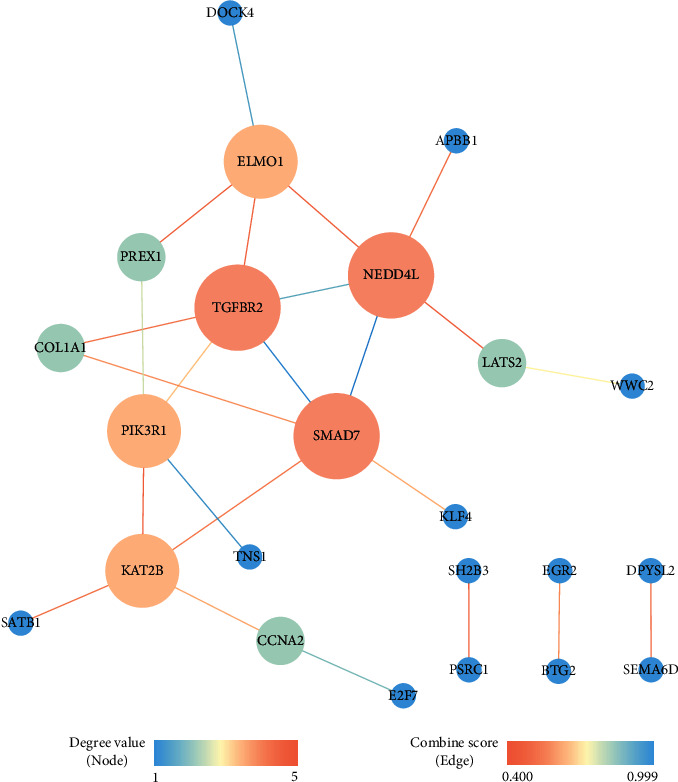
Protein-protein interaction network of survival-related mRNAs in ceRNA network. Size of node represents degree value of mRNA. Line thickness represents the strength of data support (combine score).
The three hub genes were downregulated in LUAD, and their high expression levels indicated a longer survival (Figures 9(e)–9(g)). Moreover, the ceRNA network showed that LINC01936 is a ceRNA of the three hub genes and mediated through its interaction with miR-20a-5p. In conclusion, several interactions regulate the three hub genes by competitive binding of LINC01936 to miR-20a-5p, which in turn regulate TGF-β signalling and downstream signalling pathways. This affects LUAD progression and patient prognosis. To the best of our knowledge, these interactions have not been reported earlier. Thus, our study outcomes lay a strong foundation for future research studies in this field. Moreover, further studies are required to confirm whether silencing or overexpression of LINC01936 affects the expression of hub genes.
Multifactorial Cox regression analysis was performed to identify independent prognostic factors from the abovementioned seven hub RNAs. Our results (Table 4), based on the multifactorial Cox regression model, indicate that LINC01936 and miR-31-5p are independent prognostic predictors of LUAD. LINC01936 was identified as a protective predictor for LUAD, while miR-31-5p was identified as a risk factor. The potential of miR-31-5p as a biomarker has been reported in oral carcinoma [66], colorectal cancer [67], and lung cancer [68]. This study is the first to demonstrate the prognostic potential of LINC01936 in LUAD.
Table 4.
Multifactorial Cox regression analysis in hub RNAs.
| RNA | β | HR | 95% CI of HR | p value |
|---|---|---|---|---|
| TNS1 | -0.02459 | 0.9757 | 0.8082-1.1779 | 0.79806 |
| LINC01936 | -0.20487 | 0.8148 | 0.7171-0.9257 | 0.00165 |
| TGFBR2 | 0.15514 | 1.1678 | 0.9465-1.4409 | 0.14790 |
| SMAD7 | 0.10976 | 1.116 | 0.8812-1.4134 | 0.36253 |
| NEDD4L | -0.09742 | 0.9072 | 0.7643-1.0768 | 0.26538 |
| miR-20a-5p | 0.12756 | 1.1361 | 0.9683-1.3329 | 0.11761 |
| miR-31-5p | 0.07502 | 1.0779 | 1.0136-1.1462 | 0.01675 |
HR: hazard ratio; CI: confidence interval.
Our study has several limitations. The three RNA expression data and clinical data for this study were based on TCGA database, and our findings lack biological validation. Computational prediction is only a preliminary step in ceRNA research. Therefore, these results need to be verified by studies involving large-scale clinical samples and laboratory methods such as qRT-PCR, luciferase reporter assay, and western blotting. The regulatory mechanism of the ceRNA network needs to be validated by further in vivo and in vitro research.
4. Conclusions
In summary, our study constructed a survival-associated lncRNA-miRNA-mRNA ceRNA network in LUAD using bioinformatics approaches and identified seven hub RNAs (LINC01936, miR-20a-5p, miR-31-5p, TNS1, TGFBR2, SMAD7, and NEDD4L). LINC01936 and miR-31-5p were identified as independent prognostic predictors of LUAD. The ceRNA network identified in this study provides novel insights into the molecular regulatory mechanisms associated with LUAD progression. Further studies are required to explore the biological mechanisms of ceRNAs in LUAD and validate the prognostic value of LINC01936 and miR-31-5p in other cohorts.
Acknowledgments
We would like to thank Editage (http://www.editage.com) for the English-language editing. This study is supported by the project sponsored by SRF for ROCS, SEM and supported by the Scientific Research Starting Foundation for Returned Overseas Chinese Scholars, Ministry of Education, China, and the Guangdong Province Innovative Strong School Project of Guangdong Pharmaceutical University, China (No. 2020KZDZX1126). The results published or shown here are in whole or part based upon data generated by TCGA Research Network: https://www.cancer.gov/tcga.
Data Availability
The RNA-Seq and miRNA-Seq data used to support the findings of this study have been deposited in the GDC data portal (https://portal.gdc.cancer.gov/).
Conflicts of Interest
The authors declare that there is no conflict of interest regarding the publication of this paper.
Supplementary Materials
Figure S1: heat map of differentially expressed mRNAs. Figure S2: heat map of differentially expressed lncRNAs. Figure S3: heat map of differentially expressed miRNAs.
References
- 1.Bray F., Ferlay J., Soerjomataram I., Siegel R. L., Torre L. A., Jemal A. Global cancer statistics 2018: GLOBOCAN estimates of incidence and mortality worldwide for 36 cancers in 185 countries. CA: a Cancer Journal for Clinicians. 2018;68(6):394–424. doi: 10.3322/caac.21492. [DOI] [PubMed] [Google Scholar]
- 2.Zhang L., Li M., Wu N., Chen Y. Time trends in epidemiologic characteristics and imaging features of lung adenocarcinoma: a population study of 21,113 cases in China. PLoS One. 2015;10(8, article e0136727) doi: 10.1371/journal.pone.0136727. [DOI] [PMC free article] [PubMed] [Google Scholar]
- 3.Lin J. J., Cardarella S., Lydon C. A., et al. Five-Year Survival in _EGFR_ -Mutant Metastatic Lung Adenocarcinoma Treated with EGFR-TKIs. Journal of Thoracic Oncology. 2016;11(4):556–565. doi: 10.1016/j.jtho.2015.12.103. [DOI] [PMC free article] [PubMed] [Google Scholar]
- 4.Tsao M.-S., Sakurada A., Cutz J.-C., et al. Erlotinib in lung cancer - molecular and clinical predictors of outcome. New England Journal of Medicine. 2005;353(2):133–144. doi: 10.1056/NEJMoa050736. [DOI] [PubMed] [Google Scholar]
- 5.Hanna N., Ohana P., Konikoff F., et al. Phase 1/2a, dose-escalation, safety, pharmacokinetic and preliminary efficacy study of intratumoral administration of BC-819 in patients with unresectable pancreatic cancer. Cancer Gene Therapy. 2012;19(6):374–381. doi: 10.1038/cgt.2012.10. [DOI] [PubMed] [Google Scholar]
- 6.Qin J., Ning H., Zhou Y., Hu Y., Yang L., Huang R. lncRNA MIR31HG overexpression serves as poor prognostic biomarker and promotes cells proliferation in lung adenocarcinoma. Biomedicine & Pharmacotherapy. 2018;99:363–368. doi: 10.1016/j.biopha.2018.01.037. [DOI] [PubMed] [Google Scholar]
- 7.Chen J., Zhang F., Wang J., et al. lncRNA LINC01512 promotes the progression and enhances oncogenic ability of lung adenocarcinoma. Journal of Cellular Biochemistry. 2017;118(10):3102–3110. doi: 10.1002/jcb.26178. [DOI] [PMC free article] [PubMed] [Google Scholar]
- 8.Wang J., Zhang C., Peng X., et al. A combination of four serum miRNAs for screening of lung adenocarcinoma. Human Cell. 2020;33(3):830–838. doi: 10.1007/s13577-020-00346-6. [DOI] [PubMed] [Google Scholar]
- 9.Xu X., Yu S., Sun W., et al. miRNA signature predicts the response of patients with advanced lung adenocarcinoma to platinum-based treatment. Journal of Cancer Research and Clinical Oncology. 2018;144(3):431–438. doi: 10.1007/s00432-017-2562-8. [DOI] [PubMed] [Google Scholar]
- 10.Salmena L., Poliseno L., Tay Y., Kats L., Pandolfi P. P. A ceRNA Hypothesis: The Rosetta Stone of a Hidden RNA Language? Cell. 2011;146(3):353–358. doi: 10.1016/j.cell.2011.07.014. [DOI] [PMC free article] [PubMed] [Google Scholar]
- 11.Qi X., Lin Y., Chen J., Shen B. Decoding competing endogenous RNA networks for cancer biomarker discovery. Briefings in Bioinformatics. 2020;21(2):441–457. doi: 10.1093/bib/bbz006. [DOI] [PubMed] [Google Scholar]
- 12.Stella di Stadio C., Faraonio R., Federico A., Altieri F., Rippa E., Arcari P. GKN1 expression in gastric cancer cells is negatively regulated by miR-544a. Biochimie. 2019;167:42–48. doi: 10.1016/j.biochi.2019.09.005. [DOI] [PubMed] [Google Scholar]
- 13.Seok H., Ham J., Jang E. S., Chi S. W. MicroRNA target recognition: insights from transcriptome-wide non-canonical interactions. Molecules and Cells. 2016;39(5):375–381. doi: 10.14348/molcells.2016.0013. [DOI] [PMC free article] [PubMed] [Google Scholar]
- 14.Liu K., Zhang Q., Pan F., Wang X. D., Wenjing H., Tong H. Expression of circular RNAs in gynecological tumors: a systematic review. Medicine. 2019;98(20, article e15736) doi: 10.1097/MD.0000000000015736. [DOI] [PMC free article] [PubMed] [Google Scholar]
- 15.Liu M. L., Zhang Q., Yuan X., et al. Long noncoding RNA RP4 functions as a competing endogenous RNA through miR-7-5p sponge activity in colorectal cancer. World Journal of Gastroenterology. 2018;24(9):1004–1012. doi: 10.3748/wjg.v24.i9.1004. [DOI] [PMC free article] [PubMed] [Google Scholar]
- 16.Liu L., Yang J., Zhu X., Li D., Lv Z., Zhang X. Long noncoding RNA H19 competitively binds miR-17-5p to regulate YES1 expression in thyroid cancer. The FEBS Journal. 2016;283(12):2326–2339. doi: 10.1111/febs.13741. [DOI] [PubMed] [Google Scholar]
- 17.Liang M., Pan Z., Yu F., Chen C. Long noncoding RNA SNHG12 suppresses esophageal squamous cell carcinoma progression through competing endogenous RNA networks. Clinical and Translational Oncology. 2020;22(10):1786–1795. doi: 10.1007/s12094-020-02317-7. [DOI] [PubMed] [Google Scholar]
- 18.Sui Y., Lin G., Zheng Y., Huang W. LncRNA MAFG-AS1 boosts the proliferation of lung adenocarcinoma cells via regulating miR-744-5p/MAFG axis. European Journal of Pharmacology. 2019;859, article 172465 doi: 10.1016/j.ejphar.2019.172465. [DOI] [PubMed] [Google Scholar]
- 19.Zhang T., Huang W. Progress in competing endogenous RNA and cancer. Journal of Cancer Therapy. 2015;6(7):622–630. doi: 10.4236/jct.2015.67068. [DOI] [Google Scholar]
- 20.Udhaya Kumar S., Thirumal Kumar D., Bithia R., et al. Analysis of differentially expressed genes and molecular pathways in familial hypercholesterolemia involved in atherosclerosis: a systematic and bioinformatics approach. Frontiers in Genetics. 2020;11 doi: 10.3389/fgene.2020.00734. [DOI] [PMC free article] [PubMed] [Google Scholar]
- 21.Kumar U., Kumar T., Siva R., Doss C. G. P., Zayed H. Integrative bioinformatics approaches to map potential novel genes and pathways involved in ovarian cancer. Frontiers in Bioengineering and Biotechnology. 2019;7(391):1–15. doi: 10.3389/fbioe.2019.00391. [DOI] [PMC free article] [PubMed] [Google Scholar]
- 22.Udhaya Kumar S., Thirumal Kumar D., Siva R., et al. Dysregulation of signaling pathways due to differentially expressed genes from the B-cell transcriptomes of systemic lupus erythematosus patients - a bioinformatics approach. Frontiers in Bioengineering and Biotechnology. 2020;8 doi: 10.3389/fbioe.2020.00276. [DOI] [PMC free article] [PubMed] [Google Scholar]
- 23.Wan J., Jiang S., Jiang Y., et al. Data mining and expression analysis of differential lncRNA ADAMTS9-AS1 in prostate cancer. Frontiers in Genetics. 2020;10 doi: 10.3389/fgene.2019.01377. [DOI] [PMC free article] [PubMed] [Google Scholar]
- 24.Grossman R. L., Heath A. P., Ferretti V., et al. Toward a shared vision for cancer genomic data. New England Journal of Medicine. 2016;375(12):1109–1112. doi: 10.1056/NEJMp1607591. [DOI] [PMC free article] [PubMed] [Google Scholar]
- 25.Li R., Qu H., Wang S., et al. GDCRNATools: an R/Bioconductor package for integrative analysis of lncRNA, miRNA and mRNA data in GDC. Bioinformatics. 2018;34(14):2515–2517. doi: 10.1093/bioinformatics/bty124. [DOI] [PubMed] [Google Scholar]
- 26.Robinson M. D., Oshlack A. A scaling normalization method for differential expression analysis of RNA-seq data. Genome Biology. 2010;11(3) doi: 10.1186/gb-2010-11-3-r25. [DOI] [PMC free article] [PubMed] [Google Scholar]
- 27.Law C. W., Chen Y., Shi W., Smyth G. K. Voom: precision weights unlock linear model analysis tools for RNA-seq read counts. Genome Biology. 2014;15(2) doi: 10.1186/gb-2014-15-2-r29. [DOI] [PMC free article] [PubMed] [Google Scholar]
- 28.Ritchie M. E., Phipson B., Wu D., et al. limma powers differential expression analyses for RNA-sequencing and microarray studies. Nucleic Acids Research. 2015;43(7, article e47) doi: 10.1093/nar/gkv007. [DOI] [PMC free article] [PubMed] [Google Scholar]
- 29.Wang Y., Huang T., Sun X., Wang Y. Identification of a potential prognostic lncRNA-miRNA-mRNA signature in endometrial cancer based on the competing endogenous RNA network. Journal of Cellular Biochemistry. 2019;120(11):18845–18853. doi: 10.1002/jcb.29200. [DOI] [PMC free article] [PubMed] [Google Scholar]
- 30.Huang Q.-R., Pan X.-B. Prognostic lncRNAs, miRNAs, and mRNAs form a competing endogenous RNA network in colon cancer. Frontiers in Oncology. 2019;9 doi: 10.3389/fonc.2019.00712. [DOI] [PMC free article] [PubMed] [Google Scholar]
- 31.Therneau T. M., Grambsch P. M. Modeling Survival Data: Extending the Cox Model. New York: Springer; 2000. [Google Scholar]
- 32.Yu G., Wang L.-G., Han Y., He Q.-Y. clusterProfiler: an R package for comparing biological themes among gene clusters. Omics: a Journal of Integrative Biology. 2012;16(5):284–287. doi: 10.1089/omi.2011.0118. [DOI] [PMC free article] [PubMed] [Google Scholar]
- 33.Szklarczyk D., Gable A. L., Lyon D., et al. STRING v11: protein-protein association networks with increased coverage, supporting functional discovery in genome-wide experimental datasets. Nucleic Acids Research. 2019;47(D1):D607–D613. doi: 10.1093/nar/gky1131. [DOI] [PMC free article] [PubMed] [Google Scholar]
- 34.Yu C., Woo H. J., Yu X., Oyama T., Wallqvist A., Reifman J. A strategy for evaluating pathway analysis methods. BMC Bioinformatics. 2017;18(1):p. 453. doi: 10.1186/s12859-017-1866-7. [DOI] [PMC free article] [PubMed] [Google Scholar]
- 35.Jeggari A., Marks D. S., Larsson E. miRcode: a map of putative microRNA target sites in the long non-coding transcriptome. Bioinformatics. 2012;28(15):2062–2063. doi: 10.1093/bioinformatics/bts344. [DOI] [PMC free article] [PubMed] [Google Scholar]
- 36.Li J.-H., Liu S., Zhou H., Qu L.-H., Yang J.-H. Starbase v2.0: decoding miRNA-ceRNA, miRNA-ncRNA and protein–RNA interaction networks from large-scale CLIP-Seq data. Nucleic Acids Research. 2013;42:D92–D97. doi: 10.1093/nar/gkt1248. [DOI] [PMC free article] [PubMed] [Google Scholar]
- 37.Betel D., Wilson M., Gabow A., Marks D. S., Sander C. The microRNA.org resource: targets and expression. Nucleic Acids Research. 2008;36(supplement_1):D149–D153. doi: 10.1093/nar/gkm995. [DOI] [PMC free article] [PubMed] [Google Scholar]
- 38.Paci P., Colombo T., Farina L. Computational analysis identifies a sponge interaction network between long non-coding RNAs and messenger RNAs in human breast cancer. BMC Systems Biology. 2014;8(1):p. 83. doi: 10.1186/1752-0509-8-83. [DOI] [PMC free article] [PubMed] [Google Scholar]
- 39.Shannon P., Markiel A., Ozier O., et al. Cytoscape: a software environment for integrated models of biomolecular interaction networks. Genome Research. 2003;13(11):2498–2504. doi: 10.1101/gr.1239303. [DOI] [PMC free article] [PubMed] [Google Scholar]
- 40.Chin C.-H., Chen S.-H., Wu H.-H., Ho C.-W., Ko M.-T., Lin C.-Y. cytoHubba: identifying hub objects and sub-networks from complex interactome. BMC Systems Biology. 2014;8(Supplement 4) doi: 10.1186/1752-0509-8-s4-s11. [DOI] [PMC free article] [PubMed] [Google Scholar]
- 41.Shi R., Zhang C., Wu Y., et al. CDCA2 promotes lung adenocarcinoma cell proliferation and predicts poor survival in lung adenocarcinoma patients. Oncotarget. 2017;8(12):19768–19779. doi: 10.18632/oncotarget.15519. [DOI] [PMC free article] [PubMed] [Google Scholar]
- 42.Kato T., Daigo Y., Aragaki M., Ishikawa K., Sato M., Kaji M. Overexpression of CDC20 predicts poor prognosis in primary non-small cell lung cancer patients. Journal of Surgical Oncology. 2012;106(4):423–430. doi: 10.1002/jso.23109. [DOI] [PubMed] [Google Scholar]
- 43.Daigo Y., Hayama S., Hirata D., Tsuchiya E., Nakamura Y. Phosphorylation and activation of CDCA8 by aurora kinase B plays a significant role in human lung carcinogenesis: a new pathway of oncogenesis as a molecular therapeutic target. Cancer Research. 2008;68:4238–4238. [Google Scholar]
- 44.Wang G., Wang H., Zhang C., et al. Rac3 regulates cell proliferation through cell cycle pathway and predicts prognosis in lung adenocarcinoma. Tumour Biology. 2016;37(9):12597–12607. doi: 10.1007/s13277-016-5126-7. [DOI] [PubMed] [Google Scholar]
- 45.Teruya H., Tomita M., Senba M., et al. Human T-cell leukemia virus type I infects human lung epithelial cells and induces gene expression of cytokines, chemokines and cell adhesion molecules. Retrovirology. 2008;5(1) doi: 10.1186/1742-4690-5-86. [DOI] [PMC free article] [PubMed] [Google Scholar]
- 46.Wang L., Cao L., Wen C., Li J., Yu G., Liu C. Lncrna LINC00857 regulates lung adenocarcinoma progression, apoptosis and glycolysis by targeting miR-1179/SPAG5 axis. Human Cell. 2020;33(1):195–204. doi: 10.1007/s13577-019-00296-8. [DOI] [PubMed] [Google Scholar]
- 47.Chu J., Li H., Xing Y., et al. LncRNA MNX1-AS1 promotes progression of esophageal squamous cell carcinoma by regulating miR-34a/SIRT1 axis. Biomedicine & Pharmacotherapy. 2019;116, article 109029 doi: 10.1016/j.biopha.2019.109029. [DOI] [PubMed] [Google Scholar]
- 48.Mi H., Muruganujan A., Casagrande J. T., Thomas P. D. Large-scale gene function analysis with the PANTHER classification system. Nature Protocols. 2013;8(8):1551–1566. doi: 10.1038/nprot.2013.092. [DOI] [PMC free article] [PubMed] [Google Scholar]
- 49.McCubrey J. A., May W. S., Duronio V., Mufson A. Serine/threonine phosphorylation in cytokine signal transduction. Leukemia. 2000;14(1):9–21. doi: 10.1038/sj.leu.2401657. [DOI] [PubMed] [Google Scholar]
- 50.Yordy J. S., Muise-Helmericks R. C. Signal transduction and the Ets family of transcription factors. Oncogene. 2000;19(55):6503–6513. doi: 10.1038/sj.onc.1204036. [DOI] [PubMed] [Google Scholar]
- 51.Bai X., Han G., Liu Y., Jiang H., He Q. Mirna-20a-5p promotes the growth of triple-negative breast cancer cells through targeting RUNX3. Biomedicine & Pharmacotherapy. 2018;103:1482–1489. doi: 10.1016/j.biopha.2018.04.165. [DOI] [PubMed] [Google Scholar]
- 52.Xu X., Zhu S., Tao Z., Ye S. High circulating miR-18a, miR-20a, and miR-92a expression correlates with poor prognosis in patients with non-small cell lung cancer. Cancer Medicine. 2018;7(1):21–31. doi: 10.1002/cam4.1238. [DOI] [PMC free article] [PubMed] [Google Scholar]
- 53.Meng W., Ye Z., Cui R., et al. MicroRNA-31 predicts the presence of lymph node metastases and survival in patients with lung adenocarcinoma. Clinical Cancer Research. 2013;19(19):5423–5433. doi: 10.1158/1078-0432.ccr-13-0320. [DOI] [PMC free article] [PubMed] [Google Scholar]
- 54.Brunner M., Millon-Frémillon A., Chevalier G., et al. Osteoblast mineralization requires beta1 integrin/ICAP-1-dependent fibronectin deposition. The Journal of Cell Biology. 2011;194(2):307–322. doi: 10.1083/jcb.201007108. [DOI] [PMC free article] [PubMed] [Google Scholar]
- 55.Schwartz M. A. Integrin signaling revisited. Trends in Cell Biology. 2001;11(12):466–470. doi: 10.1016/s0962-8924(01)02152-3. [DOI] [PubMed] [Google Scholar]
- 56.Zhan Y., Liang X., Li L., et al. MicroRNA-548j functions as a metastasis promoter in human breast cancer by targeting Tensin1. Molecular Oncology. 2016;10(6):838–849. doi: 10.1016/j.molonc.2016.02.002. [DOI] [PMC free article] [PubMed] [Google Scholar]
- 57.Zhang W.-w., Ming X.-l., Rong Y., et al. Diagnostic value investigation and bioinformatics analysis of miR-31 in patients with lymph node metastasis of colorectal cancer. Analytical Cellular Pathology. 2019;2019:10. doi: 10.1155/2019/9740475.9740475 [DOI] [PMC free article] [PubMed] [Google Scholar]
- 58.Batlle E., Massagué J. Transforming growth factor-β signaling in immunity and cancer. Immunity. 2019;50(4):924–940. doi: 10.1016/j.immuni.2019.03.024. [DOI] [PMC free article] [PubMed] [Google Scholar]
- 59.Tirado-Rodriguez B., Ortega E., Segura-Medina P., Huerta-Yepez S. TGF-β: an important mediator of allergic disease and a molecule with dual activity in cancer development. Journal of Immunology Research. 2014;2014:15. doi: 10.1155/2014/318481.318481 [DOI] [PMC free article] [PubMed] [Google Scholar]
- 60.Ma Y., He S., Gao A., et al. Methylation silencing of TGF-β receptor type II is involved in malignant transformation of esophageal squamous cell carcinoma. Clinical Epigenetics. 2020;12(1) doi: 10.1186/s13148-020-0819-6. [DOI] [PMC free article] [PubMed] [Google Scholar]
- 61.Borczuk A. C., Sole M., Lu P., et al. Progression of human bronchioloalveolar carcinoma to invasive adenocarcinoma is modeled in a transgenic mouse model of K-ras–induced lung cancer by loss of the TGF-β type II receptor. Cancer Research. 2011;71(21):6665–6675. doi: 10.1158/0008-5472.CAN-11-1590. [DOI] [PMC free article] [PubMed] [Google Scholar]
- 62.Kamato D., Burch M. L., Piva T. J., et al. Transforming growth factor-β signalling: role and consequences of Smad linker region phosphorylation. Cellular Signalling. 2013;25(10):2017–2024. doi: 10.1016/j.cellsig.2013.06.001. [DOI] [PubMed] [Google Scholar]
- 63.Li X., Wu X. miR-21-5p promotes the progression of non-small-cell lung cancer by regulating the expression of SMAD7. OncoTargets and Therapy. 2018;11:8445–8454. doi: 10.2147/OTT.S172393. [DOI] [PMC free article] [PubMed] [Google Scholar]
- 64.Gao S., Alarcón C., Sapkota G., et al. Ubiquitin ligase Nedd4L targets activated Smad2/3 to limit TGF-β signaling. Molecular Cell. 2009;36(3):457–468. doi: 10.1016/j.molcel.2009.09.043. [DOI] [PMC free article] [PubMed] [Google Scholar]
- 65.Wang X., Duan J., Fu W., et al. Decreased expression of NEDD4L contributes to NSCLC progression and metastasis. Biochemical and Biophysical Research Communications. 2019;513(2):398–404. doi: 10.1016/j.bbrc.2019.04.001. [DOI] [PubMed] [Google Scholar]
- 66.Liu C. J., Lin S. C., Yang C. C., Cheng H. W., Chang K. W. Exploiting salivary miR-31 as a clinical biomarker of oral squamous cell carcinoma. Head & Neck. 2012;34(2):219–224. doi: 10.1002/hed.21713. [DOI] [PubMed] [Google Scholar]
- 67.Cui Q. Significance of miR-27a and miR-31 in early diagnosis and prognosis of colorectal cancer. Oncology Letters. 2019;18(3):3092–3096. doi: 10.3892/ol.2019.10621. [DOI] [PMC free article] [PubMed] [Google Scholar]
- 68.Gao W., Liu L., Xu J., et al. A systematic analysis of predicted miR-31-targets identifies a diagnostic and prognostic signature for lung cancer. Biomedicine & Pharmacotherapy. 2014;68(4):419–427. doi: 10.1016/j.biopha.2014.03.009. [DOI] [PubMed] [Google Scholar]
Associated Data
This section collects any data citations, data availability statements, or supplementary materials included in this article.
Supplementary Materials
Figure S1: heat map of differentially expressed mRNAs. Figure S2: heat map of differentially expressed lncRNAs. Figure S3: heat map of differentially expressed miRNAs.
Data Availability Statement
The RNA-Seq and miRNA-Seq data used to support the findings of this study have been deposited in the GDC data portal (https://portal.gdc.cancer.gov/).


