Abstract
Mice and mouse platelets are major experimental models for hemostasis and thrombosis; however, important physiological data from this model has received little to no quantitative, 3D ultrastructural analysis. We used state-of-the-art, serial block imaging scanning electron microscopy (SBF-SEM, nominal Z-step size was 35 nm) to image resting platelets from C57BL/6 mice. α-Granules were identified morphologically and rendered in 3D space. The quantitative analysis revealed that mouse α-granules typically had a variable, elongated, rod shape, different from the round/ovoid shape of human α--granules. This variation in length was confirmed qualitatively by higher-resolution, focused ion beam (FIB) SEM at a nominal 5 nm Z-step size. The unexpected α-granule shape raises novel questions regarding α-granule biogenesis and dynamics. Does the variation arise at the level of the megakaryocyte and α-granule biogenesis or from differences in α-granule dynamics and organelle fusion/fission events within circulating platelets? Further quantitative analysis revealed that the two major organelles in circulating platelets, α-granules and mitochondria, displayed a stronger linear relationship between organelle number/volume and platelet size, i.e., a scaling in number and volume to platelet size, than found in human platelets suggestive of a tighter mechanistic regulation of their inclusion during platelet biogenesis. In conclusion, the overall spatial arrangement of organelles within mouse platelets was similar to that of resting human platelets, with mouse α-granules clustered closely together with little space for interdigitation of other organelles.
Keywords: platelets, mouse, electron microscopy, organelles, α-granules, 3D SBF-SEM
Introduction
Structural studies have long recognized platelets and their granules as major players in hemostasis and thrombosis [1–4]. They act as sensors of vascular damage by becoming adherent and releasing granule content in response to damage. Recent 3D ultrastructural studies of resting, human platelets suggest that their granules are arranged spatially in a manner that supports rapid dense granule but slower α-granule secretion [5,6]. Dense granules are preferentially located close to the plasma membrane [5], consistent with their rapid secretion kinetics [see, 6,7 and references therein], while the great majority of platelet α-granules are grouped more to the platelet interior with little distance separating one α-granule from another, presumably a distribution that favors compound fusion [5,6]. Ultrastructural analysis and quantitation of human α-granule dimensions, over almost 1,500 examples from multiple donors, reveals a granule population displaying a narrow, normal distribution of sizes and round to ovoid shapes [5]. In the same study, super-resolution immunofluorescence and serial cryosection immunogold labeling revealed a close correspondence between α-granule number determined by fluorescence or electron microscopy and showed most human α-granules to be positive for the same set of major granule proteins [5]. However, whether individual α-granules differ in content or secretion kinetics remains controversial [5,7–12]. More information regarding α-granule biology, especially across species, is critical for understanding platelet function.
Despite the detailed analyses of human platelets, a comparative, physiology-driven, 3D ultrastructural determination of organelle arrangement in mouse platelets has not been undertaken, in part because the needed tools for 3D analysis have only recently emerged [5,6,13–17]. Here we applied the same 3D serial block face-SEM (SBF-SEM) techniques, used previously to quantify spatial features of human platelets [5], to resting, immediately fixed mouse platelets. Moreover, α-granule properties were compared qualitatively using SBF-SEM and a higher Z-resolution FIB-SEM image set [6], which showed good correspondence between the two methods. In sum, many of the morphological features found in human platelets [5] did generalize across species, particularly, concerning the overall spatial organization. However, there were unexpected and significant differences in organelle size and shape. Mouse α-granules were more heterogeneous in shape due to variations in major axis length, with comparatively little heterogeneity in minor axis dimensions. This heterogeneity was apparent when the parametric results from the 3D analysis were plotted as a histogram; the resulting outcomes indicated that mouse α-granules partition into distinctive length classes. This difference raises new questions regarding α-granules in the mouse. Does the elongated rod like shape arise in the megakaryocyte during α-granule biogenesis or because of differences in the balance between organelle fission/fusion dynamics in mouse versus human platelets? Finally, the number of α-granules and mitochondria per platelet exhibited a tighter linear relationship to platelet volume than was seen in human platelets. Thus, the volume fraction of each of these organelles was comparatively constant across the range of mouse platelets quantified. We conclude that although there are many shared ultrastructural properties between human and mouse platelet organelles that there are significant and unexpected variations, particularly with respect to α-granules, that will require further experimentation to reveal their origins.
Methods
As described previously [6], blood from wild type C57BL/6 mice was drawn by cardiac puncture into a syringe containing 3.8% sodium citrate and 2x fixative (6% paraformaldehyde with 0.2% glutaraldehyde) in phosphate buffered saline. Blood was incubated for a 30 min fixation period at room temperature before PRP preparation. The fixed blood from six C57BL/6 mice (males and females) were pooled for each preparation, be it SBF- or FIB-SEM. We have shown previously that males and females have identical hemostatic properties in a tail bleeding or occlusive thrombus formation assay [18], suggestive of similar functional platelet organization. Platelets were isolated by centrifugation, further fixed with glutaraldehyde following isolation, and processed for block face SEM imaging as previously described [5,6,16,19]. SBF-SEM imaging was with a Gatan 3View system mounted inside a Zeiss Sigma SEM; pixel size was 6.7 nm in XY and Z-step size was 35 nm. FIB-SEM was with a Zeiss Crossbeam 550 SEM; pixel size was a nominal 5 nm in XYZ. We thank Carl Zeiss, Inc. for their generosity in providing FIB-SEM images. Organelle segmentation and data analysis using Amira software (Thermo Fisher FEI) were performed as previously described [5,18]. As before [5,6,18], volumes were computed from summating voxels within the segmented objects. Major and minor α-granule axis lengths were determined using Amira software [5].
Results
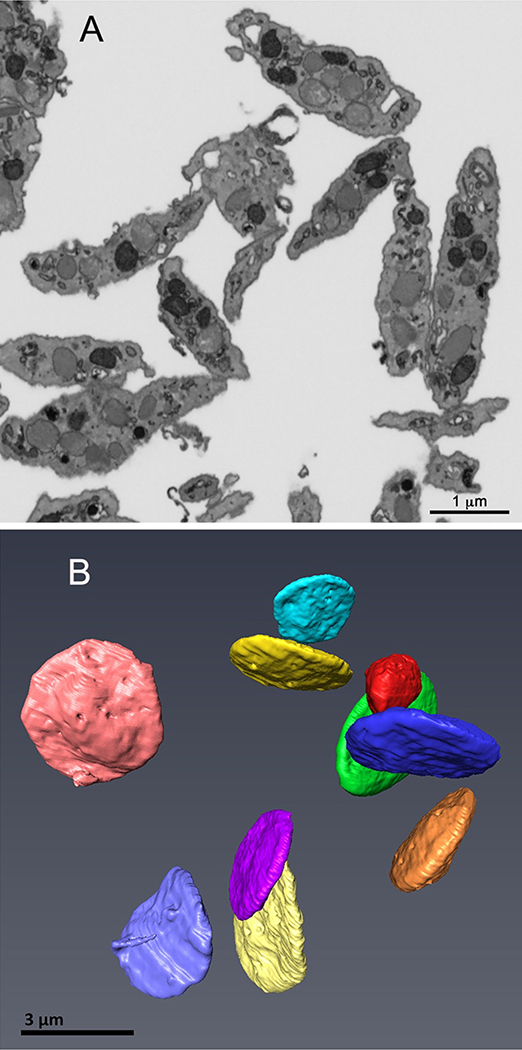
3D spatial arrangement of organelles in resting mouse platelets. Our previous analysis of human platelets showed that 3D characterization of as few as 10 platelets is sufficient to define organelle morphologies in platelets [5]. We showed that when 10 platelets were examined from each of 3 donors (30 total platelets), there was little if any statistically significant variation in the quantitative ultrastructural metrics examined, among donors or between sexes. In previously published experiments with C57BL/6 mice, we found that sex is of no functional consequence in influencing tail bleeding time or occlusive thrombi formation, both platelet-dependent processes. Given the apparent robustness of our approach, we undertook a similar analysis of mouse platelets from sex-pooled mouse blood. A single sample consisted of full cardiac puncture draws from the hearts of 6 mice with each individually fixed immediately during the blood draw into sodium citrate and fixative [6]. Pooled blood draws were necessary to give adequate sample size. As shown in Figure 1A, a representative sample of immediately fixed, mouse platelets in a serial block SEM image slice displayed an elongate morphology suggestive of discoid platelets intermixed with examples of a more ovoid morphology, marked by short pseudopods. As platelet shape in individual image slices depends on where the section passes through the cell, we randomly selected 10 platelets for further 3D analysis. As expected [5],when rendered in 3D space at full platelet volume, these platelets proved to be almost uniformly discoid in shape with minimal pseudopods (Figure1B), i.e., these immediate-fixed, mouse platelets displayed the morphology expected of resting platelets circulating within the bloodstream. Compared to similarly prepared, resting, human platelets, mouse platelets were smaller in both minor and major axes dimensions with an overall volume that was about 40% of that of human platelets (see, Table 1). It should be noted that previously published values for mouse platelet diameters (~0.5 μm), were measured from partially rounded platelets and no account was taken of major or minor axes dimensions [20].
FIGURE 1. Serial block-face example image slice (A) and resulting 3D rendering of immediately fixed, resting mouse platelets (B), C57BL/6 strain.
Individual platelets were randomly chosen from image slices (A), validated for full platelet volume inclusion in the image stack and then 3D rendered (B) using Amira software as described in Methods. The 10 platelets in (B) are shown surface rendered and pseudocolored with shadowing to give a sense of 3D depth.
Table 1.
Comparative 3D Ultrastructural Parameters for Resting Mouse and Human Platelet Parameters as Determined by SBF-SEM
| Mouse |
n |
Human [5] |
n | |
|---|---|---|---|---|
| Platelet Minor and Major Axes (μm) | 0.87 ± 0.07 2.70 ± 0.15 |
10 |
1.47 ± 0.16 3.83 ± 0.78 |
30 |
| Platelet Volume (μm3) | 2.9 ± 0.34 | 10 | 7.6 ± 0.48 | 30 |
| Alpha Granule Number/Platelet | 19 ± 4.3 | 10 | 50 ± 5.3 | 30 |
| Alpha Granule Short and Long Axis (μm) | 0.288 ± 0.006 0.537 ± 0.018 |
190 |
0.254 ± 0.006 0.301 ± 0.008 |
1488 |
| Volume/Alpha Granule (μm3) | 0.013 ± 0.00076 | 190 | 0.014 ± 0.001 | 1488 |
| Alpha Granule Volume Fraction/Platelet | 0.088 ± 0.0070 | 10 | 0.083 ± 0.0058 | 30 |
| Mitochondria/Platelet | 12 ± 1.8 | 10 | 11 ± 0.86 | 30 |
| Volume/Mitochondrion (μm3) | 0.0072 ± 0.00015 | 118 | 0.013 ± 0.00034 | 318 |
| Mitochondrion Volume Fraction/Platelet | 0.029 ± 0.0017 | 10 | 0.018 ± 0.0012 | 30 |
| Dense Granule Number/Platelet | 2.1 ± 0.55 | 10 | 5.5 ± 0.46 | 30 |
| Volume/Dense Granule (μm3) | 0.0037 ± 0.00035 | 21 | 0.0096 ± 0.00073 | 165 |
| Dense Granule Volume Fraction/Platelet | 0.0027± 0.00066 | 10 | 0.0070 ± 0.00089 | 30 |
| Open Canalicular System Volume Fraction | 0.015 ± 0.0027 | 10 | 0.023 ± 0.0046 | 30 |
| Closed Canalicular System Volume Fraction | 0.011 ± 0.0035 | 10 | 0.026 ± 0.0025 | 30 |
Please see [5] for human platelet data details.
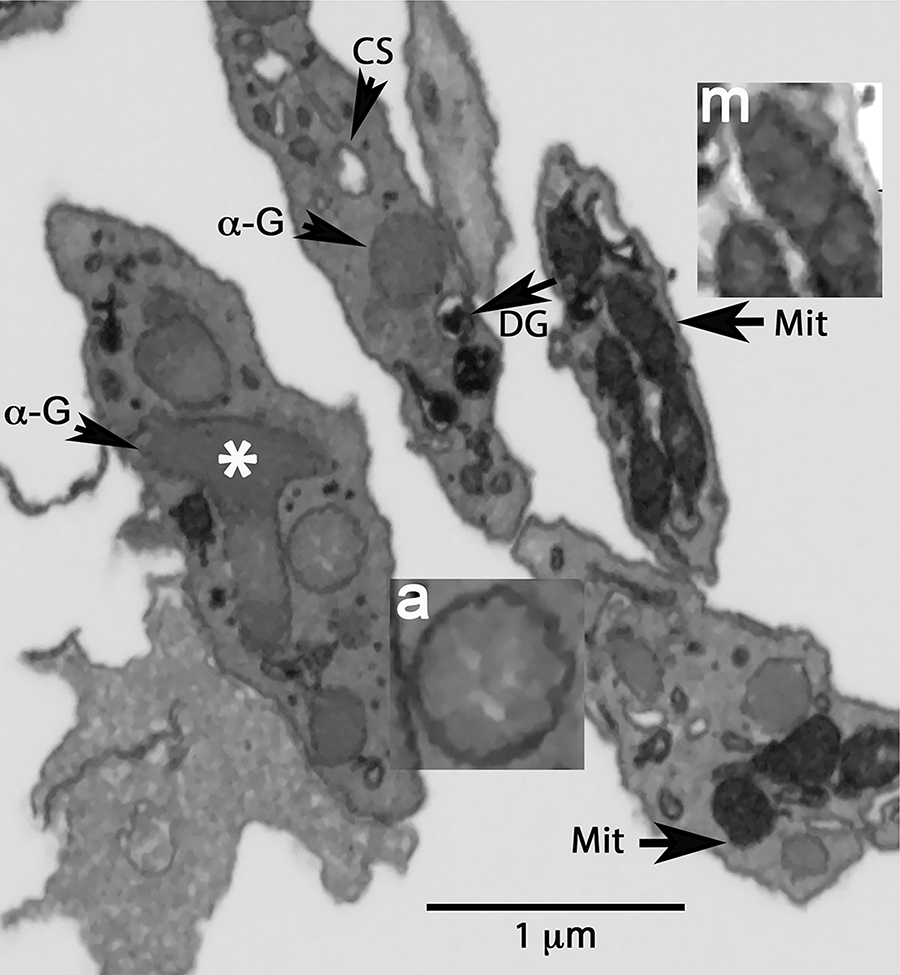
Platelet organelles were identified morphologically [5] from a series of XY images encompassing the full organelle volume (as illustrated in Figure 1A and Figure 2). α-Granules were defined as structures delimited by a single membrane enclosing a matrix devoid of any other enfolded membranes. They had variable shapes: round, ovoid or elongated in cross-section. In some cases, what appeared to be putative examples of granule-granule fusion were observed (white asterisk, Figure 2). The α-granule lumen was devoid of nucleoids, which have frequently been reported in α-granule [see 14 and references therein]. Our samples were conventionally dehydrated and prepared for serial block imaging by incubation with high concentrations of contrast-enhancing, heavy metals before dehydration and plastic embedding [for details, see 5]. In the absence of this heavy metal staining, we do find nucleoids to be a frequent feature of non-freeze substituted dehydrated preparations [14]. As shown in Figure 2, inset “a”, the α-granule matrix exhibited staining intensity variations with round, lightly-stained inclusions that could be microvesicles or exosomes. Dense granules were identified as a round, single membrane limited organelle with a bullet-shaped, high-density core that was typically surrounded by a stain-free rim. The CS was defined in sequential XY planes as a tubular, single membrane limited organelle with a stain-free interior. We grouped the CS into two morphological classes based on whether the membrane element was connected to the cell surface/PM, i.e., open CS, or unconnected, i.e., closed CS [5,14,15,18]. No effort was made to distinguish CS from endosomes. Morphologically, both closed CS and endosomes are membrane-limited vesicles devoid of an electron dense matrix and in the absence of other information are indistinguishable by morphology. Closed CS elements appeared more dilated than open CS, a result consistent with the possibility that as a closed organelle inward water flux could affect organelle volume. Mitochondria were defined in sequential XY planes as organelles containing membrane infoldings (cristae, Figure 2, inset “m”) and a darkly stained interior/matrix. Additionally, elements of the dense tubular system (DTS) marked by an electron-dense lumen were present in the block-face images (Figure 2). In practice, we found DTS extremely difficult to segment in a semi-automated manner using conventional algorithms, thus we concentrated further segmentation-driven analysis on α-granules, dense granules, CS, and mitochondria.
FIGURE 2. Example single plane markup of intracellular organelles in resting mouse platelets.
Arrows point to individual organelles: α-G, α-granule; DG, dense granule; CS, canalicular system element; Mit, mitochondrion. Asterisk indicates an example of an apparent granule-granule fusion event.
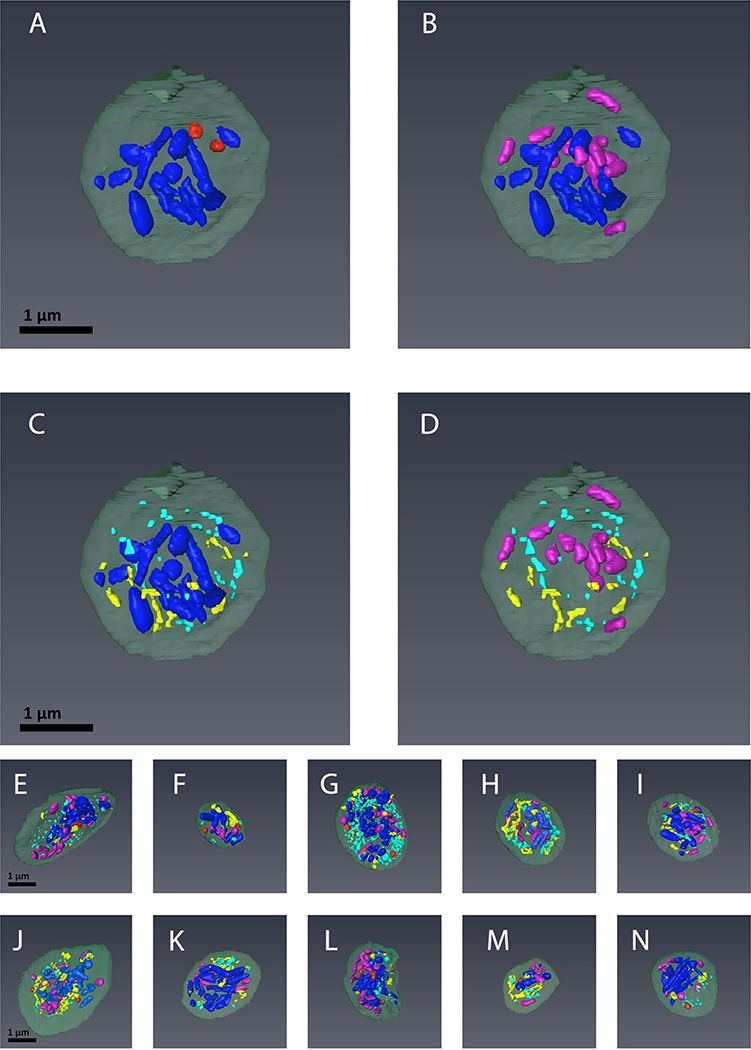
In Figure 3, 3D rendering showed all four organelle classes to be excluded from the platelet periphery. We suggest that this is due to the presence of a well-established, exclusionary circumferential band of microtubules [21]. α-Granules (blue) were often elongated and tended to be centrally located, while dense granules (red) leaned to be more peripheral. α-Granules were typically close to one another and hence tended to exclude extensive spatial intermixing with the other organelle classes. Mitochondria (purple) also tended to be spatially clustered. Elements of the canalicular system (open or closed) were generally excluded from the most central regions of the platelets. The overall 3D arrangement of each organelle class in mouse platelets was similar to that previously observed in resting human platelets [5].
FIGURE 3. The spatial arrangement of α-granules, dense granules, canalicular system (open and closed), and mitochondria in mouse platelets.
Depicted are 3D renderings of individual platelets in which the organelles have been color-coded: α-granules (blue), dense granules (red), mitochondria (purple) and open and close canalicular system (yellow and turquoise, respectively). The relative distributions for given organelles are highlighted by direct comparison: A. α-Granules vs. Dense Granules; B. α-Granules vs. Mitochondria; C. α-Granules vs. Canalicular System; D. Mitochondria vs. Canalicular System. E-N. Depict combined color-coded images for 10 individual platelets rendered in 3D.
Quantitative 3D characterization of organelle frequency and volume in resting human platelets
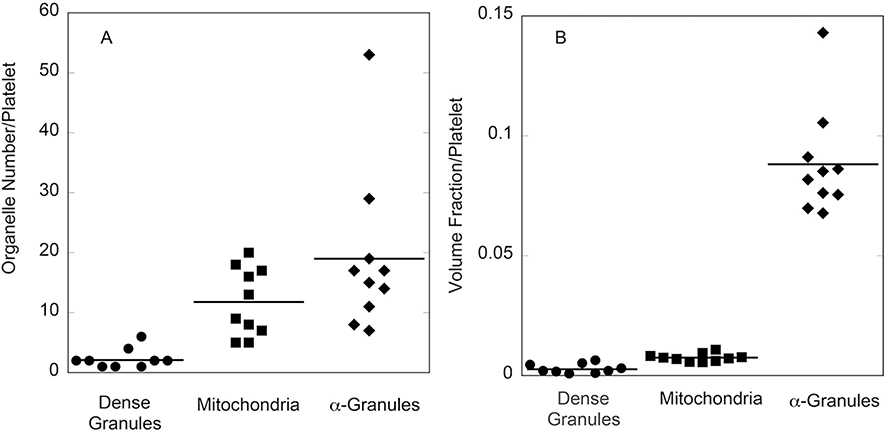
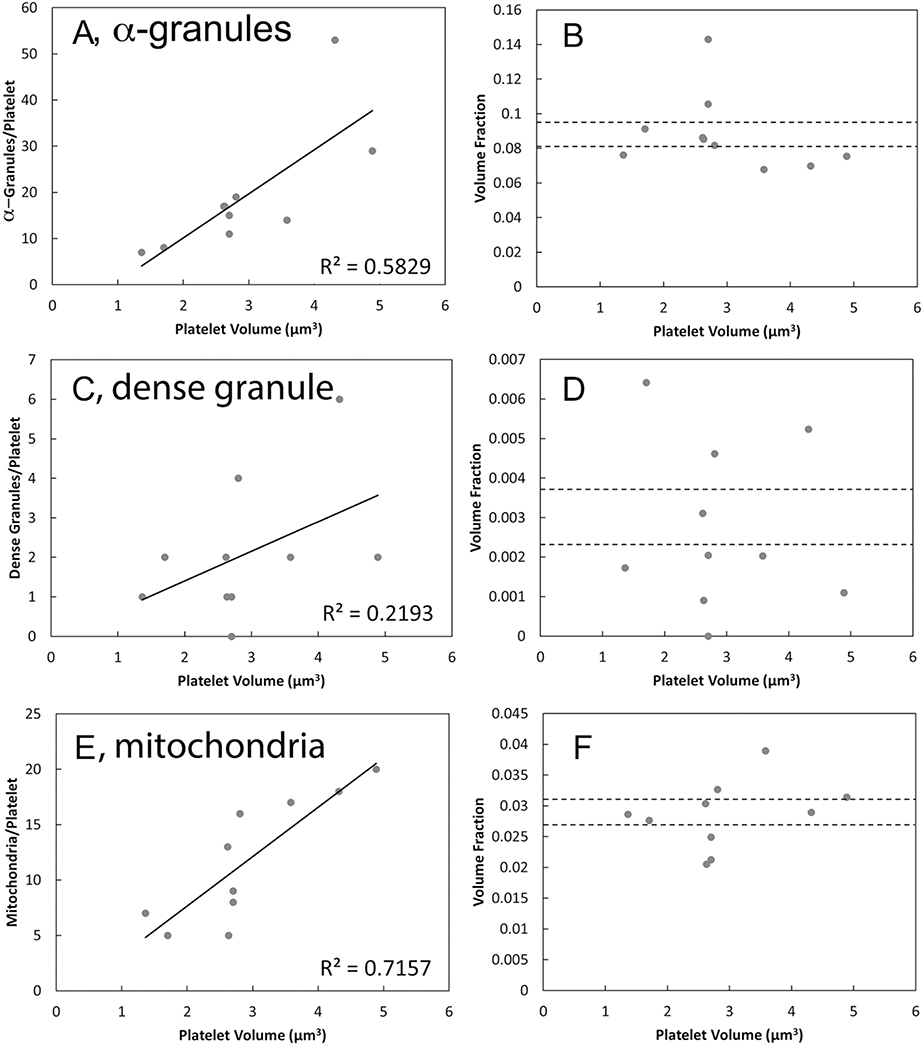
With the level of detail offered by the 3D rendering, it was possible to quantitatively characterize morphological parameters for the 4 major organelles: α-granules, dense granules, CS and mitochondria, in the 10 scored mouse platelets (Table 1). These data were then compared to averaged data collected from 30 human platelets, 10 platelets each, 3 donors [5]. The number of α-granules per mouse platelet was ~40% of that of human platelets, consistent with the smaller platelet volume. On average, the mouse α-granules were elongated compared to the human. On a volume fraction basis (volume of total organelle/total platelet volume), the two major organelles: α-granules and mitochondria, occupied similar portions of the platelets in both mice and humans. The canalicular system (open or closed) was within a factor of two or less in volume fraction. On an individual platelet basis, the number of dense granules, mitochondria, and α-granules per mouse platelet varied over a roughly 5-fold range (Figure 4A). Comparable range values were observed previously on an individual donor basis for human platelets [5]. When normalized for mouse platelet volume and expressed as volume fraction per platelet, the variation was decreased by ~two-fold (Figure 4B). When plotted against individual platelet volume, both α-granule and mitochondria number, but not dense granule number, showed a near-linear relationship to platelet volume (Figure 5). Interestingly, this correlation was stronger in mouse than in human platelets as indicated by the correlation coefficients [present work, 5]. The low correlation between dense granule incidence and platelet size may reflect the low frequency of dense granules; a sample size of 50 to 100 platelets would be required to give a comparable number of granule examples.
FIGURE 4. Dispersion in mouse platelet number (A) and volume fraction per platelet (B) summarized in dot plots.
The data are from the 10 randomly chosen platelets 3D rendered and segmented. Volume fraction per platelet was computed from the summation of voxel volumes included within the segmented objects.
Figure 5. Numbers and volume fractions of mouse platelet organelles plotted against platelet volume.
Numbers of α-granules (A), dense core granules (C), and mitochondria (E); and volume fractions of α-granules (B), dense core granules (D), and mitochondria (F), where dashed lines indicate ± one standard error of mean. α-granule and mitochondrial number per platelet correlate with platelet volume.
Detailed 3D analysis of α-granule size and shape in resting mouse platelets
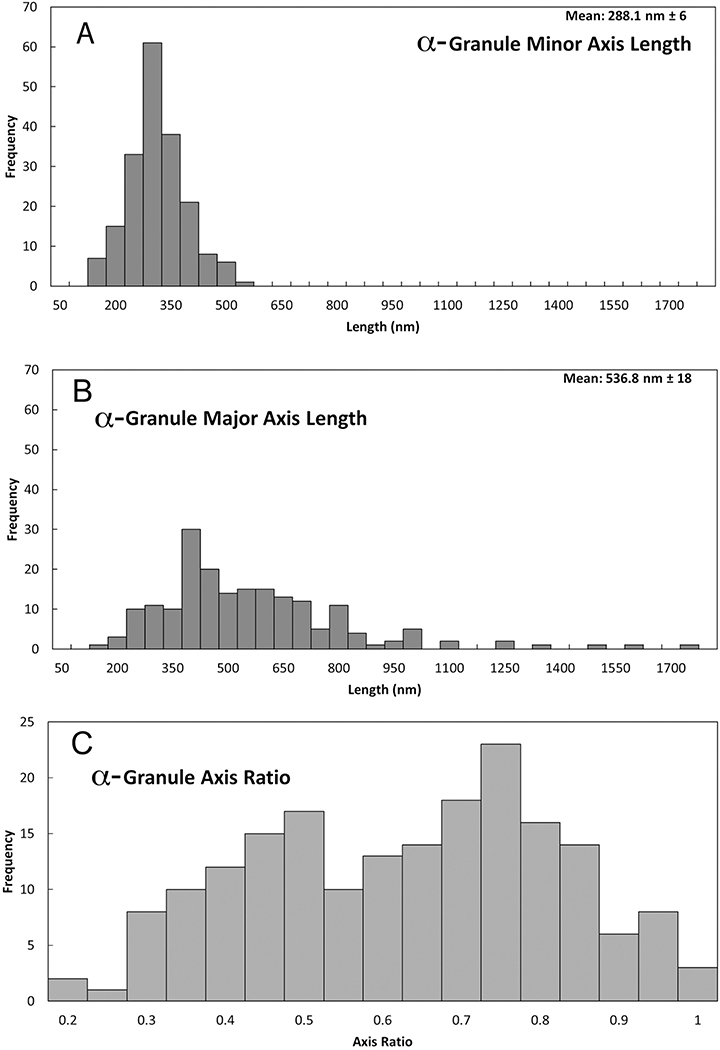
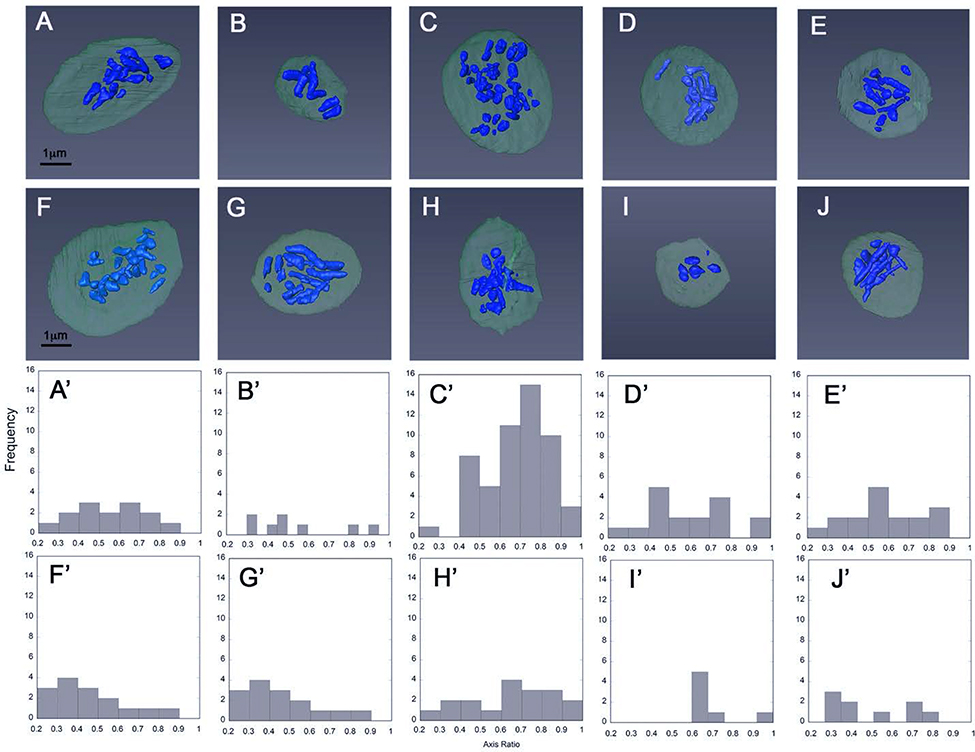
The qualitative and quantitative data presented in Figure 3 and Table 1 indicate distinct size and shape differences between mouse and human platelet α-granules, with mouse α-granules being more elongate. To determine the extent to which these differences reflect individual granule properties versus individual platelet properties, we first plotted granule dimension histograms (minor and major axes and axial ratios) on an individual α-granule basis and second on an individual platelet basis. As shown in Figure 6A, on an individual granule basis, the mouse α-granule minor axis length histogram exhibited the properties of an ideal, normal distribution, i.e., a near symmetric peak centered about a single value, 288 Å} 8 nm, skew and “excess” kurtosis both nearly zero: 0.33 and 0.28, respectively. In striking contrast, the major axis length distribution for mouse α-granules was strongly weighted towards the long side (+ kurtosis) with little indication of a normal distribution (Figure 6B, skew 1.63 and “excess” kurtosis 4.20). When plotted as axis ratio, short to long, at least three peaks, ~0.45, ~0.75, and ~0.95, were apparent in the distribution (Figure 6C). At the individual platelet level, a similar variation in α-granule shape, axial ratio, was apparent in each of the 10 SBF-EM rendered, mouse platelets (Figure 7). As a final confirmation, we rendered α-granules in 5 FIB-SEM imaged resting mouse platelets. FIB-SEM has a higher resolution in Z (Z-step size: a nominal 5 nm versus 35 nm for SBF-SEM). Consistently, this method qualitatively showed a variation in granule length versus diameter confirming the SBF-SEM analysis (image examples not shown). In sum, serial block-face imaging of mouse α-granules yielded shape parameters suggestive of multiple granule size classes that differ in length, but not width, i.e., rods/cylinders of differing lengths. This outcome contrasts sharply with our previous characterization of human α-granules in which shape parameter analysis indicated a single α-granule population, based on both size and shape [5]. In both the mouse and human case, the platelets were immediately fixed upon blood draw to limit activation. Consistent with their resting nature, we failed to detect any interconnecting features such as tubules [14] or apparent “waistlines” [6], i.e., apparent broad fusion zones between adjacent structures, in the 190 mouse α-granules scored. Tubular granule extensions found on human α-granules [5, 14, 22] were not observed in this study of mouse platelets.
FIGURE 6. Quantitative distribution of the axial shape parameters of 190 α-granules from 10 randomly chosen mouse platelets.
Total α-granule population plots. A. Binned minor (short) axis lengths, apparent normal distribution. B. Binned major (long axis) lengths of each α-granule. The α-granule axis ratio distribution (C) is calculated by dividing the width in A by the length in B and is a measure of the shape of the granules. In C, the x-axis scale of 1 is defined as a perfect sphere and anything less than 1 is elongate. The minor (short) and major (long) axis lengths were calculated using Amira software by creating a “Custom Measure” in the “Label Analysis” module after using the “Connected Components” module to assign a unique material classification to each α-granule in a platelet. Based upon skewness and kurtosis values calculated using Kaledagraph software (see Methods, Results), the distribution in (A) falls well within the statistical expectations for a normal Gaussian distribution while those in (B) and (C) do not.
FIGURE 7. Qualitative and quantitative depiction of α-granule shape on an individual platelet basis.
A-J. α-Granules in individually rendered platelets are shown in blue while the rest of the platelet volume is depicted in dark gray. Granule heterogeneity was probed by measuring granule dimensions in each rendering (A-J) and plotting their distribution in each platelet (A’-J’). Histogram plots of α-granule axis ratio distributions: minor (short) axis divided by major (long) axis are shown.
Discussion
Given the utility of mice in dissecting platelet function, the ultra-structural analysis of mouse platelets in the literature is surprisingly limited. Previous studies [20,21] focused on platelet size and organelle numbers but relied on thin-section EM that gave limited insights into the structure of a platelet in 3D. To rectify this and reveal possible physiologically important features, we collected data on the 3D structural organization of resting mouse platelets using current state-of-the-art technology, i.e., serial block-face and focused ion beam electron microscopy. We have obtained a detailed, quantitative 3D ultrastructural database for resting, wild type, mouse platelets from the C57BL/6 mice, a commonly used strain. From our analysis, three significant conclusions can be drawn: 1) the spatial organization of organelles within both resting mouse and human platelets [5] is similar, e.g., α-granules are tightly clustered together preventing extensive interdigitation by other organelles; 2) there is a tight correlation between α-granule and mitochondrial number and the total platelet volume suggesting a high degree of regulation or organelle segregation during platelet biogenesis; 3) the size and shape of α-granule in mouse platelets is more heterogeneous with mouse α-granules having longer rod-like morphologies than in human platelets. This final observation may be explained in multiple ways, e.g., differences in α-granule biogenesis, perhaps at the level of the megakaryocyte, or by organelle dynamics within the circulating platelet, i.e. the possibility of differentially balanced granule fusion and fission. Given that inter-strain differences in platelet-related, hemostatic parameters (e.g., platelet count, mean platelet volume, or fibrinogen levels) are small, approximately ±10% [23], our ultrastructural data may extrapolate across commonly used wild type mouse strains and thus provide useful insights into platelet functions in murine models.
The overall spatial organization of resting mouse platelets is similar to that seen in resting human platelets [5]. Specifically, the α-granule population in both species was tightly clustered in 3D space to exclude extensive interdigitation by other platelet organelles. As expected, α-granules, at 19 per platelet, were the most numerous organelles with mitochondria being second. The percentage of total platelet volume for α-granules (~8.8%) and mitochondria (~2.8%) were similar in both mouse and human platelets [see references in 5,24]. The inclusion of both α-granules and mitochondria in mouse platelets showed little variability based on number or fractional volume. There was a tight linear relationship between both α-granule and mitochondrial number and platelet volume; additionally α-granule and mitochondrial volume fraction held within a narrow variation from the mean. Neither relationship was found for dense granules, an organelle that was present in approximately two per platelet, and is therefore presumably strongly subject to highly stochastic distribution between cells. Interestingly, these correlations were two to threefold better in mouse platelets than in resting human platelets [5]. We suggest that the smaller size of mouse platelets may result mechanistically in a tighter linkage between the microtubules mediated delivery of α-granules and mitochondria to the tips of extending megakaryocyte pseudopods and proplatelets pinching off. Conceivably, this could be based on the tighter geometry rather than on novel biochemical mechanism(s). Further analysis will be required to address this point.
The most surprising results of our analysis were the fact that α-granules in resting mouse platelets were more heterogeneous in size and shape than those in resting human platelets [see references in 5]. Mouse α-granules were on average almost twice as long as human α-granules, (the major axis value, 0.54 μm ± 0.002 μm vs. 0.30 μm ± 0.002 μm [5]). Plots of the distributions of minor and major axis dimensions revealed that, regardless of overall major axis length, all mouse α-granules had a common minor axis diameter of 0.29 μm ± 0.01 μm. Collectively, these data suggest a rod-like α-granule population that varies in “length” but not “width”. We suggest that the rod-like shape may be either a consequence of α-granule formation steps within the megakaryocyte or granule dynamics within the circulating mouse platelet. To the authors, the T shaped α-granule seen in Figure 2 is reminiscent of examples of branched mitochondria that arise from organelle fusion [for review, see 25, 26]. We infer from the individual granule data and distribution analysis the speculative interpretation that the α-granule size and shape are a consequence of dynamic α-granule fission and fusion. If so, fusion appears to be more favored in mouse than in human platelets. Consistent with this concept, the size and shape distribution of mitochondria in other cell types has been shown to be the outcome of the dynamic balance between mitochondrial fission and fusion [for review, see 25, 26].
In conclusion, our detailed study of mouse platelet 3D morphology leads to valuable structural insights that cannot currently be obtained from other approaches and raise new questions about the biogenesis and/or dynamics of α-granules within circulating platelets. Once 3D-rendered and quantified, the serial block-face EM data point to a central conclusion, that, although the spatial organization of organelles within resting mouse platelets is very similar to that in human platelets, the 3D size, and shape of mouse α-granules is much more heterogeneous than the round to ovoid granules scored in human platelets [5]. Distribution analysis suggests that there may well be distinct granule size classes based on variation in length, not diameter, i.e., variation in the length of the “rod”. We speculate that this variation could be the result of granule formation steps within the megakaryocyte or granule-granule fusion dynamics within the circulating platelet. Further experimentation will be required to distinguish between these possibilities.
We close with an acknowledgment that an analysis of greater numbers of platelets is needed to make more detailed conclusions about platelet ultrastructure, its variations, and its subtleties. Such studies will be possible in the future as technologies advance. The value of our present work is that it is a start, a valuable database from which to begin framing more far-reaching questions about platelet structure and their biogenesis.
ACKNOWLEDGMENTS
The authors thank Carl Zeiss, Inc (Thornwood, NY) for performing the FIB-SEM imaging and Joel Mancusco of Zeiss for arranging this.
FUNDING
The Storrie laboratory was supported in part by National Institutes of Health grants R01 HL119393 and R56 HL119393. The Whiteheart laboratory was supported in part by National Institutes of Health grants HL56652 and HL138179, American Heart Association grant AHA16GRNT27620001, and a Veterans Affairs Merit Award to SWW and an American Heart Association predoctoral grant AHA15PRE25550020 to SJ. The Leapman laboratory was supported by the intramural program at NIBIB at the National Institutes of Health, Bethesda, MD.
Footnotes
CONFLICT OF INTEREST DISCLOSURE
The authors have no conflict of interest to declare.
References
- 1.White JG. Electron microscopic studies of platelet secretion. Prog Hemost Thromb 1974;2:49–98. [PubMed] [Google Scholar]
- 2.White JG. Current concepts of platelet structure. Am J Clin Pathol 1979;71:363–378. [DOI] [PubMed] [Google Scholar]
- 3.King SM, Reed GL. Development of platelet secretory granules. Semin Cell Dev Biol 2002;13:293–302 [DOI] [PubMed] [Google Scholar]
- 4.Yadav S, Storrie B. The cellular basis of platelet secretion: Emerging structure/function relationships. Platelets. 2017;28:108–118. [DOI] [PMC free article] [PubMed] [Google Scholar]
- 5.Pokrovskaya ID, Yadav S, Rao A, et al. 3D ultrastructural analysis of α-granule, dense granule, mitochondria and canalicular system arrangement in resting human platelets. Res Practice Thromb Haemost 2020;4:472–485. [DOI] [PMC free article] [PubMed] [Google Scholar]
- 6.Pokrovskaya ID, Joshi S, Tobin M, et al. SNARE-dependent membrane fusion initiates α-granule matrix decondensation in mouse platelets. Blood Advances 2018;2(21):2947–2958. [DOI] [PMC free article] [PubMed] [Google Scholar]
- 7.Jonnalagadda D, Izu LT, Whiteheart SW. Platelet secretion is kinetically heterogeneous in an agonist-responsive manner. Blood. 2012;184:5209–5218. [DOI] [PMC free article] [PubMed] [Google Scholar]
- 8.Folkman J Angiogenesis: an organizing principle for drug discovery? Nature Rev Drug Discovery 2007;6:273–286. [DOI] [PubMed] [Google Scholar]
- 9.Sehgal S, Storrie B. Evidence that differential packaging of the major platelet granule protein von Willebrand factor and fibrinogen can support differential release. J Thromb Haemos. 2007;5:2009–2016. [DOI] [PubMed] [Google Scholar]
- 10.Italiano JE Jr, Richardson JL, Patel-Hett S, et al. Angiogenesis is regulated by a novel mechanism: pro-and antiangiogenic proteins are organized into separate platelet alpha-granules and differentially released. Blood 2008;111:1227–1233. [DOI] [PMC free article] [PubMed] [Google Scholar]
- 11.Kamykowski J, Carlton P., Sehgal S, Storrie B. Quantitative immunofluorescence mapping reveals little functional co-clustering of proteins within platelet α-granules. Blood. 2011;118:1370–73. [DOI] [PubMed] [Google Scholar]
- 12.Battinelli EM, Thon JN, Okazaki R, et al. Megakaryotes package contents into separate α-granules that are differentially distributed in platelets. Blood Advances 2019;3:3092–3098. [DOI] [PMC free article] [PubMed] [Google Scholar]
- 13.Wang R, Stone RL, Jason TJ, et al. Electron cryotomography reveals ultrastructural alterations in platelets from patients with ovarian cancer. Proc. Natl Acad. Sci USA. 2015;112:14266–14273. [DOI] [PMC free article] [PubMed] [Google Scholar]
- 14.Pokrovskaya ID, Aronova MA, Kamykowski JA, et al. STEM tomography reveals that the canalicular system and α-granules remain separate compartments during early secretion stages in blood platelets. J Thromb Haemost 2016;14:572–584. [DOI] [PMC free article] [PubMed] [Google Scholar]
- 15.Eckly A, Rinckel JY, Proamer F, et al. Respective contributions of single and compound granule fusion to secretion by activated platelets. Blood 2016;120(26):2538–2549. [DOI] [PMC free article] [PubMed] [Google Scholar]
- 16.Yadav S, Williamson JK, Aronova MA, Prince AA, Pokrovskaya ID, Leapman RD, Storrie B. Golgi proteins in circulating human platelets are distributed across non-stacked, scattered structures. Platelets 2017;28:400–408. [DOI] [PMC free article] [PubMed] [Google Scholar]
- 17.McBride EL, Rao A, Zhang G, et al. Comparison of 3D cellular imaging techniques based on scanned electron probes: serial block face SEM vs. axial bright-field STEM tomography. J Struct Biol. 2018; 202:216–228. [DOI] [PMC free article] [PubMed] [Google Scholar]
- 18.Joshi S, Banerjee M, Zhang J, Kesaraju A, Pokrovskaya ID, Storrie B, Whiteheart SW. Alterations in platelet secretion differentially affect thrombosis and hemostasis, Blood Advances 2018;2(17):2187–2198. [DOI] [PMC free article] [PubMed] [Google Scholar]
- 19.Pokrovskaya ID, Tobin M, Desai R, et al. Canalicular system reorganization during mouse platelet activation as revealed by 3D ultrastructural analysis. Platelets 2020;January 31:1–8. doi: 10.1080/09537104.2020.1719993. [Epub ahead of print]. [DOI] [PMC free article] [PubMed] [Google Scholar]
- 20.Schmitt A, Guichard J, Mass JM, Debili N, Cramer EM. Of mice and men: comparisonof the ultrastructure of megakaryocytes and platelets. Exp Hematol 2001;29:1295–1302. [DOI] [PubMed] [Google Scholar]
- 21.White JG. An overview of platelet structural physiology. Scanning Microsc 19–87;1:1677–1700. [PubMed] [Google Scholar]
- 22.van Nispen tot Pannerden H, de Haas F, Gerts W, et al. The platelet interior revisited: electron tomography reveals tubular alpha-granule subtypes. Blood 2010; 118:1147–1156. [DOI] [PubMed] [Google Scholar]
- 23.Barrios M, Rodr.guez-Acosta A, Gil A, Salazar AM, Taylor P, S.nchez EE, Arocha-Piñango GL,Guerrero B. Comparative hemostatic parameters in BALB/c, C57BL/6 and C3H/He mice. Thromb Res. 2009; 2:338–343. [DOI] [PubMed] [Google Scholar]
- 24.Frojmovic MM, Milton JG. Human platelet size, shape and related functions in health and disease. Physiol Rev 1982;62:185–261. [DOI] [PubMed] [Google Scholar]
- 25.Nunnari J Mitochondria: in sickness and in health. Cell 2012;148:1145–1159. [DOI] [PMC free article] [PubMed] [Google Scholar]
- 26.Labba K, Murley A, Nunnari J. Determinants and functions of mitochondrial behavior. Annu Rev Cell Dev Biol 2014;30:357–391. [DOI] [PubMed] [Google Scholar]


