

Summary
Background
How specific nutrients influence adaptive immunity is of broad interest. Iron deficiency is the most common micronutrient deficiency worldwide and imparts a significant burden of global disease; however, its effects on immunity remain unclear.
Methods
We used a hepcidin mimetic and several genetic models to examine the effect of low iron availability on T cells in vitro and on immune responses to vaccines and viral infection in mice. We examined humoral immunity in human patients with raised hepcidin and low serum iron caused by mutant TMPRSS6. We tested the effect of iron supplementation on vaccination-induced humoral immunity in piglets, a natural model of iron deficiency.
Findings
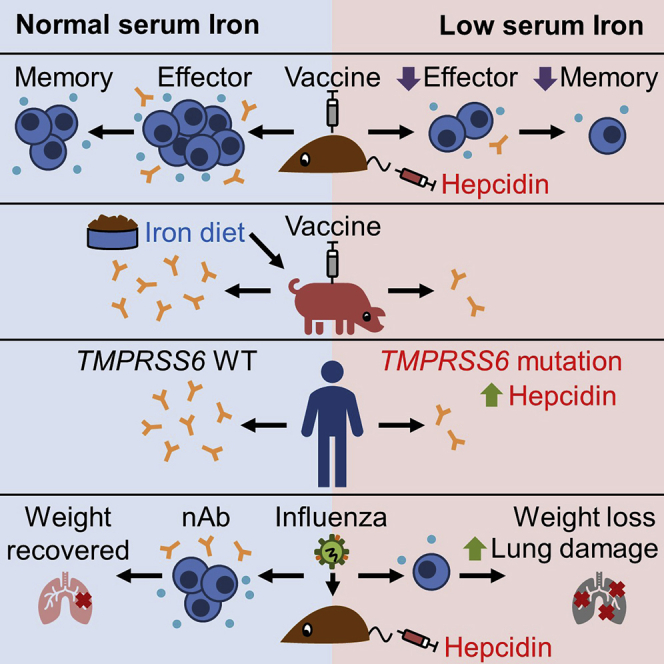
We show that low serum iron (hypoferremia), caused by increased hepcidin, severely impairs effector and memory responses to immunizations. The intensified metabolism of activated lymphocytes requires the support of enhanced iron acquisition, which is facilitated by IRP1/2 and TFRC. Accordingly, providing extra iron improved the response to vaccination in hypoferremic mice and piglets, while conversely, hypoferremic humans with chronically increased hepcidin have reduced concentrations of antibodies specific for certain pathogens. Imposing hypoferremia blunted the T cell, B cell, and neutralizing antibody responses to influenza virus infection in mice, allowing the virus to persist and exacerbating lung inflammation and morbidity.
Conclusions
Hypoferremia, a well-conserved physiological innate response to infection, can counteract the development of adaptive immunity. This nutrient trade-off is relevant for understanding and improving immune responses to infections and vaccines in the globally common contexts of iron deficiency and inflammatory disorders.
Funding
Medical Research Council, UK
Keywords: hepcidin, iron, hypoferremia, vaccination, immunometabolism, infection, influenza virus, global health, adaptive immunity, T-cells
Graphical Abstract
Highlights
Low serum iron caused by hepcidin impairs primary and memory immune responses
Activated T-cells demand iron and iron scarcity inhibits mitochondrial metabolism
Patients with mutant TMPRSS6 have high hepcidin and lower IgG against pathogens
High hepcidin during viral infection inhibits T- and B-cells and inflames disease
Context and Significance
Iron deficiency is very common in humans and animals. Frost et al demonstrate that low concentrations of iron in serum, caused by the hormone hepcidin, inhibit the body’s response to vaccines and infections; conversely, increasing iron can boost immunity.
Iron deficiency is very common in humans and animals. Frost et al. demonstrate that low concentrations of iron in serum, caused by the hormone hepcidin, inhibit the body’s response to vaccines and infections; conversely, increasing iron can boost immunity.
Introduction
Adaptive immunity is essential for protection from infectious disease and for the preservation of health. After activation, antigen-specific lymphocytes proliferate rapidly, differentiate, and acquire effector functions, necessitating accelerated metabolism and macromolecular synthesis.1 Iron is necessary for many fundamental cellular processes, including DNA synthesis, the tricarboxylic acid cycle, and oxidative phosphorylation,2 and a rare mutation in transferrin receptor that disrupts the ability of cells to acquire iron causes immunodeficiency.3
The high global prevalence of iron deficiency and anemia results from a combination of nutritional iron deficiency, blood loss, and inflammation-induced hepcidin.4 The master iron regulatory hormone hepcidin suppresses dietary iron absorption and macrophage iron recycling by inhibiting the iron-exporter protein, ferroportin, which releases iron into serum.5,6 Hepcidin expression is regulated both by iron, as part of homeostatic mechanisms,5,7 and inflammation, as part of the innate immune responses that attempt to deny iron to invading pathogens.8 Hepcidin rapidly decreases serum iron concentrations, and persistent high hepcidin and hypoferremia can lead to anemia.9 We found very low concentrations of serum iron and high hepcidin levels (driven by inflammation) in Gambian infants.10,11
There have been many studies linking iron deficiency and impaired immunity, but results have been inconsistent, and the methods used to define iron deficiency and to analyze immune responses have varied considerably, leading to uncertainty.12,13 More recent reports have suggested that iron can exacerbate autoimmune T cell activity,14 and severe nutritional iron deficiency may impair B cell-proliferative responses.15 However, whether hepcidin, as the iron-regulatory hormone, influences adaptive immunity to vaccination and infection is unknown. In this study, we show how physiological variation in serum iron concentrations, controlled by hepcidin or iron supplementation, profoundly influences lymphocyte biology and immune responses.
Results
Hepcidin Activity Inhibits Responses to Immunization via Hypoferremia
To begin testing how changes in serum iron levels affect the adaptive immune response, mice were placed on a low iron diet (2 ppm Fe) to model low iron supply. Three days after immunization, the mice were injected daily with minihepcidin (a mimetic of hepcidin with the same mechanism of action16), which transiently suppresses serum iron concentrations to ~5 μmol/L (Figures 1A and S1A). Mice in the low iron treatment group had low serum iron and decreased endogenous liver hepcidin mRNA expression (Figure 1A, indicating low iron stores), and exhibited a profoundly suppressed antigen-specific CD8 T cell response to immunization with recombinant adenovirus encoding ovalbumin (AdHu5-ovalbumin [OVA]) and to OVA protein in adjuvant (Figures 1B and 1C). In addition, the T follicular helper cell, germinal center (GC) B cell, and plasma cell responses were strikingly reduced, and anti-OVA IgG titers were suppressed (Figure 1D). We dissected the key aspects of altered iron homeostasis that influenced the adaptive immune response. Mice on a low iron diet for 4 weeks had substantially decreased liver iron and liver hepcidin mRNA, indicating low iron stores, but serum iron remained unchanged, and the antigen-specific CD8+ T cell and GC B cell responses to immunization were unaltered (Figures S1B and S1C). The lack of effect of 4 weeks of a low iron diet to alter serum iron, but to deplete liver iron, was reproducible in the absence of immunization (Figure S1D), and a low iron diet did not alter the growth rate of mice (Figure S1E). Furthermore 4 weeks of a low iron diet only resulted in mild microcytic hypochromic anemia (Figure S1F).
Figure 1.

Minihepcidin-Induced Serum Iron Deficiency Inhibits Immune Responses
(A) Experimental design for investigation of the effect of combined minihepcidin injection and low iron diet on the primary immune response to immunization. Serum iron levels and liver hepcidin mRNA were measured 24 h after the last minihepcidin injection. Means ± SDs. Student’s 2-tailed t test, unpaired.
(B) Left: representative flow cytometry plots showing frequency of OVA (SIINFEKL) tetramer-positive CD8 effector T cells (Tetramer+ CD44+ CD8 T cells) as a percentage of CD8s T cells. Right: number of splenic OVA-specific CD8 effector cells 7 days after immunization with AdHu5-OVA. Means ± SDs. Student’s 2-tailed t test, unpaired.
(C) Number of splenic OVA-specific CD8 effector cells 7 days after OVA protein in adjuvant immunization. Means ± SDs. Student’s 2-tailed t test, unpaired.
(D) Number of T follicular helper cells (PD-1+ CXCR5+ CD44+ CD4 T cells), germinal center (GC) B cells (IgD− CD95+ B220+ B cells), plasma cells (CD138+ IgD− cells), and anti-OVA IgG titer (a.u., arbitrary unit) 7 days after immunization with OVA in adjuvant. Means ± SDs. Student’s 2-tailed t test, unpaired.
(E) Experimental design to determine whether parenteral iron supplementation can reverse the effect of minihepcidin injection; FAC = ferric ammonium citrate. Left: the frequency of antigen-specific splenic OT-I CD8 T cells; center: normalized relative mean fluorescence intensity (MFI) of surface CD71 expression by OT-I CD8 T cells 5 days after OVA and adjuvant immunization were detected with flow cytometry; right: liver hepcidin mRNA. Means ± SDs. One-way ANOVA with correction for multiple comparisons.
In mice on a normal iron diet (188 ppm Fe), a single injection of minihepcidin 3 h before immunization with OVA in adjuvant, to cause low serum iron for ~24 h concurrent with dendritic cell (DC)-T cell interactions, did not alter the magnitude of subsequent OT-I (OVA-specific CD8+ T cell) responses (Figure S1G). However, 2 injections of minihepcidin on days 3 and 4 after immunization were sufficient to suppress the expansion of OT-I cells, and the fewer responding cells had increased transferrin receptor (TFRC) expression, indicating relative cellular iron deficiency, and liver hepcidin mRNA was decreased, which is consistent with hypoferremia (Figure 1E). The injection of ferric ammonium citrate rescued the minihepcidin-induced suppression of OT-I expansion, decreased TFRC expression on responding T cells, and increased liver hepcidin mRNA (Figure 1E). Neither hepcidin peptide nor minihepcidin directly altered T cell proliferation or TFRC expression in vitro (Figures S2A–S2C), suggesting that the in vivo effect of minihepcidin is mediated via iron redistribution during the expansion phase of the immune response. Hepcidin causes hypoferremia in part by sequestering iron in splenic macrophages. However, injecting mice with iron-dextran, which induces iron accumulation in splenic macrophages without decreasing serum iron, did not (unlike minihepcidin) inhibit the OT-I response to immunization (Figures S2D–S2G). Therefore, decreased serum iron, caused by minihepcidin, is necessary and sufficient for impairing the response of activated and proliferating antigen-specific lymphocytes to immunization.
Hypoferremia Inhibits T Cell Cytokine Production in Response to Viral Vectors
Exploring this concept in more depth, we found that minihepcidin injections decreased the endogenous CD8 T cell OVA-specific response to AdHu5-OVA in the spleen and peripheral blood, the splenic OT-I response to Modified Vaccinia Ankara encoding OVA (MVA-OVA), the splenic OT-I response to OVA in adjuvant, and the endogenous CD8 T cell splenic vaccinia-specific (B8R peptide) response to MVA-OVA, all in mice on a standard iron diet (Figures 2A and 2B). Beyond the effects on proliferation, OT-I CD8 cells from minihepcidin-treated mice secreted less of the effector cytokines interferon γ (IFNγ) and tumor necrosis factor-α (TNF-α), and fewer of these cells produced interleukin-2 (IL-2), on ex vivo restimulation (Figure 2C). Minihepcidin also suppressed the endogenous cytokine-producing effector CD4 T cell response to MVA-OVA and the CD4 OT-II T follicular helper cell response to OVA in adjuvant; furthermore fewer splenic OT-II CD4 effector cells secreted IL-2 or TNF-α on restimulation with peptide ex vivo, and splenic GC B cell responses were suppressed (Figures 2D and 2E). In summary, hypoferremia inhibits several elements of immune responses across multiple vaccination platforms and different antigens.
Figure 2.

Minihepcidin-Mediated Serum Iron Deficiency Inhibits the CD8 T Cell Response to a Diverse Range of Immunizations and Impairs the Quality of CD4 T Cell Responses.
(A) Experimental scheme to examine effect of minihepcidin injection on immunization.
(B) Antigen-specific T cell populations quantified by flow cytometry 7 days after immunization. Left to right: number of splenic endogenous OVA-specific CD8 T cells after AdHu5-OVA immunization, frequency of endogenous OVA-specific CD8 T cells as a percentage of total CD8s in peripheral blood after AdHu5-OVA immunization, number of splenic OT-I OVA-specific CD8 T cells after MVA-OVA immunization, number of splenic OT-I OVA-specific CD8 T cells after OVA and adjuvant immunization, and frequency of endogenous vaccinia (B8R epitope)-specific CD8 T cells as a percentage of total CD8s, resolved by IFNγ production after ex vivo peptide restimulation, induced by MVA-OVA immunization. Means ± SDs. t test. Student’s 2-tailed t test, unpaired.
(C) Left to right: relative MFI of IFNγ and TNF-α for OT-I effector cells producing the respective cytokine, MFI normalized to average of vehicle group; percentage of OT-I effector cells that secrete IL-2. Cytokine-producing cells resolved by intracellular cytokine staining after ex vivo restimulation of splenocytes from mice with SIINFEKL peptide 7 days after MVA-OVA immunization. Means ± SDs. t test. Student’s 2-tailed t test, unpaired.
(D) Frequency of endogenous vaccinia-specific IFNγ, TNF-α, or IL-2 producing CD40L+ CD4 Th1 effector T cells as a percentage of total CD4s, resolved by intracellular cytokine staining after ex vivo restimulation of splenocytes with MVA-OVA-pulsed dendritic cells. Means ± SDs. t test. Student’s 2-tailed t test, unpaired.
(E) Number of splenic OT-II T follicular helper cells induced by OVA and adjuvant immunization. Frequency of splenic TNF-α+ and IL-2+ OT-II effector cells induced by OVA and adjuvant immunization as a percentage of total OT-II CD4 T cells after ex vivo restimulation with peptide. Frequency of splenic GC B cells as a percentage of B cells after OVA and adjuvant immunization. All 7 days post-immunization. Means ± SDs. t test. Student’s 2-tailed t test, unpaired.
Iron Acquisition Is a Cell-Intrinsic Requirement for Lymphocyte Responses
To investigate the cell-intrinsic nature of iron-dependent responses, we tested how the Y20H mutation in TFRC, which impairs cellular iron uptake and causes immunodeficiency in humans,3 influences lymphocyte responses to immunization. Competitive bone marrow transplant experiments were performed in which bone marrow from wild-type (WT) mice and TfrcY20H/Y20H mice were mixed and transferred into lethally irradiated WT recipient mice, and both lymphopoiesis and response to immunization were analyzed (Figure 3A). The TfrcY20H/Y20H allele did not influence the reconstitution of T cells or B cells into the circulation (Figure 3B), but after immunization with MVA-OVA, responding antigen-specific CD8 T cells, T follicular helper cells, and GC B cells carrying the TfrcY20H/Y20H allele were underrepresented compared to their WT counterparts, indicating that the TfrcY20H/Y20H mutation bestows cell-intrinsic defects to proliferative lymphocyte responses specifically after immunization (Figure 3C).
Figure 3.

Iron Uptake via the Transferrin Receptor Is Cell-Intrinsically Essential for Immune Responses
(A) Experimental design for establishing mixed bone marrow chimeras to investigate cell-intrinsic effect of TfrcY20H/Y20H allele on immune response in vivo. Data from TfrcY20H/Y20H ; WT chimeras are displayed in red, whereas data from WT;WT chimeras are in blue.
(B) Ratio of the frequencies of CD45.2:CD45.1 cells within peripheral blood CD8 T cells, CD4 T cells, and B cells at 65 days after establishment of chimeras, determined by flow cytometry. Means ± SDs. Student’s 2-tailed t test, unpaired.
(C) Comparison of the ratio of the frequencies of CD45.2:CD45.1 cells within naive and effector lymphocyte populations within each chimeric mouse, 72 days after establishment of chimeras and 1 week after MVA-OVA immunization. The data are displayed for naive (CD44−) and effector tetramer+ splenic CD8 T cells, dLN naive (CD44−) CD4 T cells and T follicular helper cells (PD-1+ CXCR5+ CD44+ CD4 T cells), and dLN naive follicular (IgD+, CD95−) and GC B cells (IgD− CD95+ GL7+ B cells). Student’s 2-tailed t test, paired.
Impaired Iron Acquisition Impairs T Cell Physiology
To understand the basis of T cell sensitivity to iron deprivation, we assessed the expression of key iron-handling proteins5 in the first 24 h after the activation of CD8 T cells in standard cell culture media from published datasets.17 TFRC was highly upregulated, ferrous ion importers DMT1 (Slc11a2) and ZIP14 (Slc39a14) and intracellular iron sensors18 IRP1 and IRP2 (iron-responsive element-binding proteins 1 and 2) were also increased, while levels of the iron-storage protein ferritin (FTL and FTH) were not significantly altered; the iron export protein ferroportin (Slc40a1) was not detected, but ferroportin mRNA expression was strongly decreased after activation (Figures S3A and S3B). These changes indicate a drive to sense, acquire, and retain iron after activation.
IRP1 and IRP2 control cellular iron homeostasis.18 To test the functional importance of these regulators in CD8+ T cells, we used floxed Irp1 and Irp2 alleles that are excised via a tamoxifen-activated Cre-ERT2 recombinase (Figure S3C). Stimulated CD8+ T cells induced to delete Irp1 and Irp2 did not upregulate TFRC to the same extent as control cells and proliferated relatively poorly; however, proliferation was substantially improved by the addition of inorganic FeSO4, which is taken up independently of TFRC (Figures 4A, 4B, and S3D). Thus, Irp1/2 control of TFRC-mediated T cell iron acquisition is required for proliferation after activation.
Figure 4.

Cellular Iron Metabolism Is Remodeled upon T Cell Activation, and Iron Deficiency Disrupts T Cell Physiology
(A) Left to right: Histograms of CD71 (Tfrc) expression on 4-OHT treated CD8 T cells from IRP1/2 floxed mice lacking (blue) or expressing Cre (red) at 24h (top) and 72h (bottom) after in vitro activation; relative CD71 MFI for CD8 T cells treated with 4-OHT measured by flow cytometry (72h after activation); relative CD71 MFI of 4-OHT treated compared to EtOH treated CD8 T cells (to control for effects of 4-OHT, 72h after activation). Mean+/- SD, Student's two tailed T-test, unpaired.
(B) Percentage divided CD8 T cells of each genotype/EtOH or 4-OHT combination cultured with a titration of FeSO4, 72 h after activation. Percentage of divided determined as percentage of cells that had diluted out their CellTrace Violet signal once or more. Mean ± range. Two-way ANOVA, corrected for multiple comparisons, p values for difference between EtOH (control), and 4-OHT at each iron concentration.
(C) Left to right: ATP content was measured using CellTiter Glo luminescent assay for equal numbers of WT CD8 T cells per condition and normalized to the control condition of each biological replicate. Total, glycolytic, and mitochondrial ATP production rates measured by Seahorse. Each data point is a biological replicate from a single mouse, representing the average of 2–5 technical replicate wells. Mitochondrial content (MitoTracker Green [MTG]) and mitochondrial inner membrane potential (MitoTracker Deep Red [MTDR]) were measured by flow cytometric analysis of 72-h activated divided cells and the ratio calculated. Mean ± range. One-way ANOVA, effect of iron, paired within each biological replicate.
To further explore the effect of low iron availability on aspects of T cell physiology, we activated WT CD8 T cells in vitro across a range of transferrin-iron concentrations. Low iron did not alter early CD69 upregulation but resulted in fewer cells with higher than 2N DNA content within 24 h and decreased proliferation over 3 days (Figure S3E). Iron deficiency reduced total cellular ATP content 24 h after activation and decreased ATP production due to lower mitochondrial ATP generation, while glycolytic ATP production was unaltered, and after 72 h, iron-deficient T cells had relatively depolarized mitochondria (Figure 4C). Notably, DNA synthesis and mitochondrial ATP synthesis are iron-dependent processes, while in contrast none of the 10 enzymes that mediate glycolysis appear to require iron.
Mammalian target of rapamycin complex 1 (mTORC1) senses diverse environmental signals and is an important regulator of T cell differentiation17,19; while iron-dependent regulation of mTORC1 can regulate the erythroid response to iron deficiency,20 the presence of this signaling axis in other primary cell types is unknown. We found that low iron also reduced CD8+ T cell mTORC1 activity (as measured by intracellular phosphorylated S6 ribosomal protein) and expression of the amino acid transporter CD98, and decreased cell size (Figure S3F). Furthermore, granzyme B and the IL-2 receptor (CD25) levels were reduced, indicating an impaired effector phenotype (Figure S3G). In complementary experiments, we increased iron availability to activated CD8 T cells from TfrcY20H/Y20H mice by providing iron in forms that bypass the defective Y20H TFRC protein (Figure S4A). Rapid CD69 upregulation was unaffected, but FeSO4 improved TfrcY20H/Y20H CD8 T cell ATP content, mitochondrial health, increased cell size and the percentage of phospho-S6+ cells, and rescued proliferation (Figures S4B–S4D). In summary, after activation, CD8 T cells transform their ability to acquire iron, and iron is required for T cell mitochondrial and effector functions, optimal metabolic activity, and cell-cycle progression.
Transient Hypoferremia Has Long-Term Consequences on T Cell Memory
The in vitro requirements of T cells for iron and the strong effects of hypoferremia on primary immune responses led us to test whether low iron availability had longer-term effects on the formation of immunological memory. We transferred OT-I cells into recipient mice, injected OVA protein in adjuvant, then treated mice with minihepcidin daily for 4 days; 28 days later, at which point serum iron was normalized, there were marginally decreased total splenic OT-I memory cells and a marked significant reduction in the frequency of memory cells with a central memory-like phenotype (CD62L+; or CD27+, CD43−; or CX3CR1−)21,22 from mice that had received minihepcidin during priming (Figure S5A). Following in vitro restimulation, fewer splenic memory cells capable of synthesizing IL-2, IFNγ, and TNF-α (individually or combined) were detected in mice that had experienced low serum iron during the primary immune response; responding cells also produced less of each cytokine (Figures S5B–S5E). Finally, to test recall responses in a separate experiment, mice that had been injected with OVA in adjuvant with or without minihepcidin on days 3–6 post-immunization were re-challenged with OVA subcutaneously on day 35 after immunization and the secondary response analyzed on day 40. Hypoferremia during priming reduced the OVA-specific CD8 T cell recall response and the percentage of IFNγ-producing CD8+ T cells (Figure 5A). Hence, transient hypoferremia during primary responses impairs the quality and quantity of subsequent T cell memory and recall capacity in mice.
Figure 5.

CD8 T Cell Recall Responses Are Disrupted by Serum Iron Deficiency during the Primary Immune Response
(A) Experimental design to investigate the effect of serum iron deficiency during the primary immune response on the magnitude of the secondary recall CD8 T cell response.
(B) Number of endogenous OVA-specific secondary CD8 effector cells in the spleen detected by OVA tetramer binding and percentage of splenic OVA-specific CD8 effector cells detected by IFNγ+ production after ex vivo stimulation with SIINFEKL. Means ± SDs. Student’s 2-tailed t test, unpaired.
Impaired Anitbody Responses in Iron-Deficient Piglets and Humans
To understand whether similar principles of iron-limiting immune responses apply in species with different metabolic needs, we took advantage of the natural piglet physiology, in which the low iron reserves at birth due to large litter size, rapid post-natal growth, and iron-poor sow’s milk necessitates additional provision of iron to prevent the swift onset of anemia.23 In piglets reared only on sow’s milk replacer without added iron, serum iron was relatively low and hemoglobin levels dropped steadily in the 4 weeks after birth; the red blood cell number was also decreased while platelets were increased, indicating iron-deficiency anemia (IDA) (Figures 6A, S6A, and S6B). At 2 weeks of age, piglets were vaccinated against Mycoplasma hyopneumoniae (a standard immunization against an important piglet pathogen24), at which time there was no significant difference in antibody titer (Figure S6C). Two weeks later, the vaccine-specific antibody response was relatively increased in the piglets that had received iron (Figures 6B and S6C). Therefore, against a background of IDA, iron supplementation not only maintains hemoglobin but can also improve responses to vaccination.
Figure 6.

Iron Supplementation Normalizes Piglet Iron Status and Improves Vaccine Responses at 28 Days of Age
Routine vaccinations are less efficacious in IRIDA patients.
(A) Serum iron and hemoglobin of control and iron-supplemented piglets. Means ± SDs. Serum iron, mixed-effects model, p value is effect of iron supplementation. Hemoglobin, 2-way ANOVA, p value is effect of iron supplementation.
(B) Antibody response against M. hyopneumoniae vaccination reported as improvement in percentage block at 28 days post-natal, relative to pre-immunization percentage block at 14 days after birth. Mean ± range. Student’s 2-tailed t test, unpaired.
(C) Age of TMPRSS6 and WT control cohorts. Means ± SDs. Student’s 2-tailed t test, unpaired.
(D) Antibody concentrations against rubella, Haemophilus influenzae b, and Streptococcus pneumoniae serotype 1 measured in IRIDA patients with TMPRSS6 mutations and non-anemic healthy controls without mutant TMPRSS6 alleles from the same clinic. Means ± SDs. Student’s 2-tailed t test, unpaired; Mann-Whitney U test for rubella. Right-most panel: analysis of the frequency of individuals for both genotypes with antibody concentrations against Streptococcus pneumoniae serotype 1 exceeding the protective threshold of 0.35 μg/mL (dotted line). Fisher exact test.
A rare form of iron-refractory IDA (IRIDA) in humans is caused by increased hepcidin in patients with mutations in TMPRSS6, a protease that normally represses hepcidin.25 The quality of adaptive immunity in IRIDA patients has not been explored before. We investigated antibodies specific for various pathogens that are targeted by vaccines in a group of 12 IRIDA patients who had increased hepcidin levels, hypoferremia (~5 μmol/L serum Fe) and hematological parameters indicative of IDA (Figure S6D) compared to controls of similar age collected at the same clinic (Figure 6C). None of the IRIDA patients (and controls) had raised C-reactive protein (all IRIDA patients <0.5 mg/L), indicating a lack of systemic inflammation (Figure S6D). Compared to the control group, the IRIDA group had lower serum immunoglobulin G (IgG) concentrations against rubella, Hib and anti-Streptococcus pneumoniae serotype 1 (PS1), a leading cause of invasive pneumococcal disease globally26 (Figure 6D). For anti-PS1, none of the IRIDA patients achieved an antibody concentration above the World Health Organization (WHO) protective threshold of 0.35 μg/mL (Figure 6D), and overall, IRIDA patients were less likely to achieve protective concentrations to S. pneumoniae serotypes (Figure S6E). Controlling for age and gender, we found genotype effects on anti-PS1 (p = 0.005), anti-PS18C (p = 0.048), and anti-Hib (p = 0.066) serum IgG (all lower in the IRIDA group). These data show that a condition of persistently high hepcidin associates with lower antibody levels against some important pathogens in humans.
Hypoferremia Exacerbates Influenza Virus Infection and Lung Inflammation
Innate immune responses to infection increase hepcidin, contributing to hypoferremia of infection.8 We investigated how minihepcidin treatment, to enforce prolonged hypoferremia, influenced the immune response to a respiratory viral infection (influenza A virus) in mice (Figure 7A). We observed fewer virus-specific CD8 T cells in the spleen and lungs; fewer granzyme B-expressing splenic CD8 T cells; and fewer T-follicular helper cells, antigen-experienced CD44+ CD4 cells, and GC B cells in the mediastinal lymph nodes on day 8 post-infection (Figures 7B and 7C); however, lung mRNA expression of pro-inflammatory cytokines IL-6 and TNF-α was higher (Figure S7A). Cellular immune responses in the spleen were also reduced on day 10 post-infection (Figure S7B), circulating influenza neutralizing antibodies were undetectable (Figure 7D), and lung viral load (measured as influenza nucleoprotein RNA) was significantly higher (Figure 7E). Histologically, focal airway inflammation was present in all of the infected mice, but despite suppressed lymphocyte responses, perivascular/peribronchiolar inflammation was more severe in the lungs of minihepcidin-treated infected mice, with marked extension into the alveolar parenchyma (Figures 7F and 7G). The increased inflammatory cell infiltrates in minihepcidin-treated mice comprised both mononuclear cells and neutrophils, with larger areas of the lung exhibiting disrupted alveolar structures (Figures 7F, 7G S7C, and S7D); however, no change in lung non-heme iron content was observed (Figure S7E). In addition to this increased tissue damage, minihepcidin-treated mice failed to recover infection-induced weight loss (Figure S7F). Therefore, mice with persistent hypoferremia had a suppressed adaptive immune response, were less able to clear the virus, and experienced more severe pulmonary disease and sustained morbidity.
Figure 7.

Serum Iron Deficiency Suppresses Adaptive Immune Responses to Influenza Infection, Worsening Lung Inflammation and Preventing Recovery of Weight
(A) Experimental scheme for investigation effect of minihepcidin injection on the outcome of infection with 0.08 hemagglutination units of influenza virus A/X-31 (H3N2).
(B) Representative plots of the frequency of influenza nucleoprotein (NP)-specific CD8 effector cells as a percentage of CD8 T cells in the spleens of mice 8 days post-infection. Numbers of NP-specific CD8 effector cells in the spleen and lung at 8 days post-infection. Number of splenic granzyme B+ CD8 T cells. Means ± SDs. Student’s 2-tailed t test, unpaired.
(C) Mediastinal lymph node T follicular helper cell number (PD-1+ CXCR5+ CD44+ CD4 T cells) and frequency of CD44+ antigen-experienced CD4 T cells as a percentage of CD4 were identified by flow cytometry. Representative plots of the frequency of mediastinal lymph node GC B cells as a percentage of total B cells and the number of mediastinal lymph node GC B cells at day 8 post-infection (IgD− CD95+ GL7+ B cells). Means ± SDs. Student’s 2-tailed t test, unpaired.
(D) Half-maximal effective concentration (EC50) of neutralizing antibody from serum on day 10 post-infection. LOD, limit of detection. Means ± SDs. Student’s 2-tailed t test, unpaired.
(E) Influenza NP RNA in homogenates of a whole lung lobe taken at day 10. Means ± SDs. Student’s 2-tailed t test, unpaired.
(F) Leder staining of representative lung sections from mice on day 10 post-influenza infection from each group; 200×, scale bar 20 μm. Polymorphonuclear cells stained with pink cytoplasm indicated by arrows.
(G) Lung inflammation and neutrophil infiltration scoring. Means ± SDs. Kruskal-Wallis test with correction for multiple comparisons.
Discussion
Iron and Immunometabolism
Hepcidin-induced hypoferremia is a well-conserved component of the innate immune response in vertebrates.8 We demonstrate that hypoferremia may impair multiple aspects of adaptive immunity if it occurs during the period of lymphocyte expansion, with the potential for subsequent long-term inhibition of T cell memory even after hypoferremia has resolved. We show that appropriate regulation of cellular iron uptake controlled by IRP1/2 is essential for T cell effector functions; and TFRC-mediated iron acquisition is cell-intrinsically required for B and T cell responses in vivo. The remarkable upsurge in the expression of TFRC by activated T cells, increasing by ~1 million copies of protein per cell within 24 h, along with escalations in transmembrane iron importers, indicates a significant intensification of efforts to acquire iron from extracellular sources. Although we showed that oxidative metabolism and DNA synthesis studies are two iron-dependent processes inhibited in T cells by low iron availability, many other cellular pathways important in T cell biology, including epigenetic reprogramming and hypoxia sensing, also require iron and should be investigated. Furthermore, reduced CD25 expression and failure to sense IL-2 could contribute to the poorer quality of effector/memory CD8 T cells observed in iron deficiency.27 Because the accelerated metabolic activity of activated lymphocytes is particularly sensitive to iron availability, physiological variations in iron concentrations strongly influence immune responses. Therefore, iron may be considered a nutrient relevant to concepts of immunometabolism.28
Hepcidin, Hypoferremia, and Viral Infections
Hepcidin-controlled iron redistribution protects against some bacterial infections and malaria in mice.29,30 In humans, increased hepcidin and hypoferremia occur after experimental norovirus, typhoid, and malaria infections,31, 32, 33 and during the initial emergence of viremia in HIV-1-infected blood donors.34 Although inflammatory hypoferremia can be beneficial in the context of infections with single-cell organisms that must acquire iron from their host, evidence that low serum iron is protective in the context of viral infections is lacking. In fact, in our experiments with influenza virus, imposing hepcidin-induced hypoferremia resulted in an impaired adaptive immune response, viral persistence, and severe pulmonary disease, suggesting that low serum iron may sometimes be an unhelpful response to infection. Recent reports show that hypoferremia is present in coronavirus disease 2019 (COVID-19) patients on admission to the intensive care unit (ICU).35 Low serum iron correlated with lymphopenia, and extremely low serum iron (~3 μmol/L) identified COVID-19 patients with severe respiratory hypoxemia, likely secondary to pulmonary damage. This hypoferremia is more profound than in previously reported cohorts of non-COVID-19 ICU patients, including those with sepsis,36,37 indicating that extreme hypoferremia may be a particular feature of severe COVID-19 disease. IL-6 drives hepcidin expression, and an unbalanced inflammatory response of high IL-6 and relatively low type I and type III IFN associates with severe COVID-19 and poor outcomes.38,39 IL-6-driven and hepcidin-mediated hypoferremia could impair the antiviral adaptive immune response, contributing to the severity of infection. Tocilizumab, which targets IL-6R, under investigation as a therapeutic for COVID-19, may counteract hypoferremia. Monitoring serum iron in COVID-19 patients may be useful in evaluating disease severity and the effects of treatments.
The Iron Trade-Off—Consequences for Adaptive Immunity and Vaccination
Previous characterizations of the role of iron in the context of infection describe the attempts of the pathogen to hijack host iron, which the host defends, leading to an evolutionary arms race.40 We propose that the hypoferremia of infection also represents a trade-off for the host, which attempts to decrease the virulence of invading pathogens by withholding iron, but in so doing simultaneously withholds iron from adaptive immune responses. The outcome of this trade-off will depend on the nature of the causative infection, the magnitude and type of the inflammatory response, and the underlying iron status of the host. Globally, hypoferremia is common in populations in which nutritional iron deficiency is prevalent and in which there is also a burden of infections and inflammation that increase hepcidin, a combination that likely affects hundreds of millions of individuals.4,10 As well as influencing responses to infection directly, hypoferremia may have indirect effects on the infectious burden by impairing responses to vaccination. The efficacy and immunogenicity of some vaccines is suboptimal in populations in which iron deficiency is endemic,41 and in such populations, childhood mortality from vaccine-preventable infections remains unacceptably high.42 Here, we demonstrate in a piglet model that iron augments responses to vaccination in the context of naturally occurring iron deficiency. Recently, we showed in a retrospective analysis of Kenyan infants that anemia associates with impaired humoral responses to some vaccines and that iron supplementation may enhance the humoral response to a measles vaccine.43 However, iron can also increase the risk of some infections and adversely influence gut microbiota.4 Consequently, bespoke trials are needed to determine whether targeted nutritional iron given around the time of vaccinations improves the efficacy of immunizations in populations with iron deficiency, including children and the elderly.
Raised hepcidin and hypoferremia in IRIDA patients with mutations in TMPRSS6 may associate with impaired humoral immunity, at least against some pathogens. Persistently high hepcidin and hypoferremia are also features of non-infectious chronic inflammatory disorders such as chronic kidney disease,9 and inflammation and iron deficiency are observed in cancers.44 Adaptive immunity in these populations and conditions may be compromised by hypoferremia. Of note, pharmacological or genetic manipulation of hepcidin activity, intended as a therapeutic intervention for iron-related disorders, is relatively well developed.45 Therefore, hepcidin is already a potentially accessible target and can be investigated as a modality of controlling immune responses in multiple contexts.
Limitations of Study
While our study found that iron restriction impairs T cell aerobic metabolism as assessed by oxygen consumption and mitochondrial membrane potential, broader hypothesis-free approaches could provide a more holistic appreciation of the mechanism by which limiting iron availability disrupts the function of T cells. Both T and B cell responses are impaired by serum iron deficiency in vivo, but we did not explore how the physiology of isolated B cells is perturbed by iron deficiency or how T cell differentiation is influenced by iron. Furthermore, we have not asked to what extent the impairment of CD8 T cell memory by iron deficiency extends to CD4 and B cell memory and how these observations could affect responses to vaccines and protection against infection.
Summary
We found that hepcidin-induced hypoferremia impaired primary and memory responses to immunization, and we uncovered a profound demand of activated T cells for iron mediated at least in part by IRP1/2 and TFRC. High hepcidin can inhibit adaptive immune responses to pathogens, while against a background of low serum iron, supplemental iron can improve immune responses. These results indicate that serum iron, regulated by hepcidin, is an important and potentially targetable control point for immunity.
STAR★Methods
Key Resources Table
| REAGENT or RESOURCE | SOURCE | IDENTIFIER |
|---|---|---|
| Antibodies | ||
| Purified low endotoxin CD3, clone 145-C11 | Biolegend | 100339; RRID:AB_11150783 |
| Purified low endotoxin CD28, clone 37.51 | Biolegend | 102115; RRID:AB_11150408 |
| Purified CD16/CD32, clone 93 | Biolegend | 101302; RRID:AB_312801 |
| FITC CD8, clone 53.6.7 | Biolegend | 100705; RRID:AB_312744 |
| FITC CD3, clone 17A2 | Biolegend | 100203; RRID:AB_312660 |
| FITC CD71, clone R17217 | Biolegend | 113805; RRID:AB_313566 |
| FITC CD11b, clone M1/70 | Biolegend | 101205; RRID:AB_312788 |
| FITC CD4, clone GK1.5 | Biolegend | 100405; RRID:AB_312690 |
| FITC CD45.1, clone A20 | Biolegend | 110706; RRID:AB_313495 |
| FITC CD62L, clone MEL-14 | Biolegend | 104405; RRID:AB_313092 |
| FITC GL7, clone GL7 | Biolegend | 144603; RRID:AB_2561696 |
| FITC CD44, clone IM7 | Biolegend | 103005; RRID:AB_312956 |
| FITC CD25, clone PC61 | Biolegend | 102005; RRID:AB_312854 |
| FITC Tcrb, clone H57-597 | Biolegend | 109205; RRID:AB_313428 |
| FITC TNF-alpha, MP6-XT22 | Biolegend | 506303; RRID:AB_315424 |
| PerCP/Cy5.5 CD4, clone GK1.5 | Biolegend | 100433; RRID:AB_893330 |
| PerCP/Cy5.5 CD8, clone 53.6.7 | Biolegend | 100733; RRID:AB_2075239 |
| PerCP/Cy5.5 Tcrb, clone H57-597 | Biolegend | 109227; RRID:AB_1575176 |
| PerCP/Cy5.5 IgD, clone 11-26c2a | Biolegend | 405709; RRID:AB_1575115 |
| PerCP/Cy5.5 CD90.2, clone 30-H12 | Biolegend | 105337; RRID:AB_2571944 |
| PerCP/Cy5.5 B220, clone RA3-6B2 | Biolegend | 103235; RRID:AB_893356 |
| PE CD71, clone R17217 | Biolegend | 113807; RRID:AB_313568 |
| PE CD43, clone 1B11 | Biolegend | 121207; RRID:AB_493389 |
| PE CD69, clone H1.2F3 | Biolegend | 104507; RRID:AB_313110 |
| PE CD62L, clone MEL-14 | Biolegend | 104407; RRID:AB_313094 |
| PE CD98 (4F2), clone RL388 | Biolegend | 128207; RRID:AB_1186107 |
| PE CD127, clone SB/199 | Biolegend | 121111; RRID:AB_493510 |
| PE CD138, clone 281-2 | Biolegend | 142503; RRID:AB_10915989 |
| PE CD154, clone MR1 | Biolegend | 106505; RRID:AB_313270 |
| PE CD185 (CXCR5), clone L138D7 | Biolegend | 145503; RRID:AB_2561967 |
| PE CX3CR1, clone SA011F11 | Biolegend | 149005; RRID:AB_2564314 |
| PE IL-2, clone JES6-5H4 | Biolegend | 503807; RRID:AB_315301 |
| PE/Cy7 CD71, clone R17217 | Biolegend | 113811; RRID:AB_2203383 |
| PE/Cy7 CD8, clone 53-6.7 | Biolegend | 100707; RRID:AB_312746 |
| PE/Cy7 CD279 (PD-1), clone RMPI-30 | Biolegend | 109109; RRID:AB_572016 |
| PE/Cy7 IFN-gamma, clone XMG1.2 | Biolegend | 505825; RRID:AB_1595591 |
| PE/Cy7 KRLG1, clone 2F1/KRLG1 | Biolegend | 138415; RRID:AB_2561735 |
| PE/Cy7 CD98 (4F2), clone RL388 | Biolegend | 128213; RRID:AB_2750546 |
| PE/Cy7 Tcrb, clone H57-597 | Biolegend | 109221; RRID:AB_893627 |
| PE/Cy7 CD69, clone H1.2F3 | Biolegend | 104511; RRID:AB_493565 |
| Pacific Blue CD3, clone 17A2 | Biolegend | 100213; RRID:AB_493644 |
| Pacific Blue CD8, clone 53-6.7 | Biolegend | 100728; RRID:AB_493426 |
| Pacific Blue CD44, clone IM7 | Biolegend | 103019; RRID:AB_493682 |
| Pacific Blue Tcrb, clone H57-597 | Biolegend | 109225; RRID:AB_1027655 |
| Pacific Blue GL7, clone GL7 | Biolegend | 144613; RRID:AB_2563291 |
| BV421 CD27, clone LG.3A10 | Biolegend | 124223; RRID:AB_2565547 |
| BV421 CD71, clone R17217 | Biolegend | 113813; RRID:AB_10899739 |
| BV421 CD127, clone A7R34 | Biolegend | 135027; RRID:AB_2563103 |
| BV421 CD138, clone 281-2 | Biolegend | 142507; RRID:AB_11204257 |
| BV421 TNF-alpha, clone MP6-XT22 | Biolegend | 506328; RRID:AB_2562902 |
| BV605 CD8, clone 53-6.7 | Biolegend | 100744; RRID:AB_2562609 |
| BV605 B220, clone RA3-6B2 | Biolegend | 103244; RRID:AB_2563312 |
| BV605 CD45.1, clone A20 | Biolegend | 110737; RRID:AB_11204076 |
| BV605 IL-2, clone JES6-5H4 | Biolegend | 503829; RRID:AB_11204084 |
| BV785 CD44, clone IM7 | Biolegend | 103041; RRID:AB_11218802 |
| BV785 CD8, clone 53-6.7 | Biolegend | 100749; RRID:AB_11218801 |
| BV785 CD3, clone 17A2 | Biolegend | 100231;RRID:AB_11218805 |
| BV785 CD45.1, clone A20 | Biolegend | 110743; RRID:AB_2563379 |
| APC CD4, clone GK1.5 | Biolegend | 100411; RRID:AB_312696 |
| APC CD44, clone IM7 | Biolegend | 103011; RRID:AB_312962 |
| APC CD25, clone PC61 | Biolegend | 102011; RRID:AB_312860 |
| APC CD45.1, clone A20 | Biolegend | 110713; RRID:AB_313502 |
| APC CD62L, clone MEL-14 | Biolegend | 104411; RRID:AB_313098 |
| APC CX3CR1, clone SA011F11 | Biolegend | 149007; RRID:AB_2564491 |
| APC IFN-gamma, clone XMG1.2 | Biolegend | 505809; RRID:AB_315403 |
| APC IL-2, clone JES6-5H4 | Biolegend | 503809; RRID:AB_315303 |
| APC Tcrb, clone H57-597 | Biolegend | 109211; RRID:AB_313434 |
| APC B220, clone RA3-6B2 | Biolegend | 103211; RRID:AB_312996 |
| APC/Cy7 B220, clone RA3-6B2 | Biolegend | 103224; RRID:AB_313007 |
| APC/Cy7 CD11b, clone M1/70 | Biolegend | 101226; RRID:AB_830642 |
| PE/Cy7 CD95, clone Jo2 | BD | 557653; RRID:AB_396768 |
| APC pS6, clone D57.2.2E | Cell Signaling | 14733S; RRID:AB_2721245 |
| Alkaline phosphatase conjugated Goat ant-mouse IgG | Sigma | A-3562; RRID:AB_258091 |
| Bacterial and Virus Strains | ||
| A/X-31 (H3N2) A/Aichi/2/1968 | (46) | N/A |
| H3N2 (X31) GFP expressing pseudotyped reporter virus (S-FLU) | (47) | N/A |
| AdHu5-OVA | (Wang et al., 2016)48 | N/A |
| MVA-OVA | (Wang et al., 2016)48 | N/A |
| Chemicals, Peptides, and Recombinant Proteins | ||
| Chicken Ovalbumin | Invivogen | Vac-pova |
| MPLA | Invivogen | Vac-mpla |
| alpha-galactosylceramide | GS. Besra, University of Birmingham/ Enzo Life Sciences | KRN7000 |
| Pannexin NTS serum substitute (made iron free to order) | Pan Biotech | P04-95080 |
| Holotransferrin | Sigma/Merck | T0665 |
| Apotransferrin | Sigma/Merck | T1147 |
| 4-hydroxytamoxifen | Sigma/Merck | H6278 |
| FeSO4 | Sigma/Merck | F8633 |
| Ferric Ammonium Citrate | Sigma/Merck | F5879 |
| DNAase1 | Sigma/Merck | D5025 |
| Collagenase IV | Sigma/Merck | C5138 |
| Percoll | GE Healthcare | 17-0891-02 |
| Cell Trace Violet | Invitrogen | C34557 |
| Mitotracker Green | Thermofisher | M7514 |
| Mitotracker Deep Red | Thermofisher | M22426 |
| Interleukin-2 (murine recombinant) | Biolegend | 575402 |
| FLT3L (murine recombinant) | Biolegend | 550702 |
| CpG ODN 1826 | Invivogen | Tlrl-1826 |
| SIINFEKL (OVA peptide 257-264) | Invivogen | Vac-sin |
| OVA 323-339 | Invivogen | Vac-isq |
| B8R (20-27, TSYKFESV) | Anaspec | AS-64688 |
| Suwaxyn MH-One | Zoetis Ltd | N/A |
| bathophenanthrolinedisulphonic acid | Sigma/Merck | 146617 |
| Thioglycolyic acid | Sigma/Merck | 88652 |
| Minihepcidin PR73 | (29) Chinese Peptide Company | N/A |
| Purebright SL220/ Sunbright DSPE-020CN | NOF | N/A |
| Critical commercial assays | ||
| CD8 T cell isolation kit | Stem Cell Technologies | 19853 |
| CD8 T cell isolation kit | Miltenyi Biotech | 130-104-075 |
| RNeasy plus kit | QIAGEN | 74136 |
| High capacity RNA to cDNA kit | Life technologies | 4387406 |
| M. hyopneumoniae detection kit, | Thermo Scientific Oxoid, UK, | K004311 |
| Seahorse real-time ATP rate assay kit | Agilent | 103592-100 |
| Cell titer-Glo | Promega | G7570 |
| Taqman Gene expression master mix | Thermofisher | 4369542 |
| Control iron diet (200ppm) | Teklad | TD.07801 |
| Low iron diet (2ppm) | Teklad | TD.99397 |
| Experimental Models: Cell Lines | ||
| MDCK-SIAT cells for Influenza virus propagation | ECACC | 05071502 |
| Experimental Models: Organisms/Strains | ||
| C57BL/6 | Envigo | N/A |
| OT-II transgenic mice | Oliver Bannard | N/A |
| OT-I transgenic mice | Vincenzo Cerundolo | N/A |
| B6SJLCD45.1 mice | Oxford University Core breeding facility | N/A |
| Tfrc Y20H/Y20H mice | Raif S. Geha (3) | N/A |
| Aco1flox/flox,Ireb2flox/flox, Rosa26+/CreERT2 | Bruno Galy (49) | N/A |
| Oligonucleotides | ||
| Aco1 primer 1 TACTGTAGCAAAAATGCTTTGTCTCTG | Sigma/Merck | N/A |
| Aco1 primer 2 TCTATCCCTGAGGTCGGTAGGC | Sigma/Merck | N/A |
| Aco1 primer 3 GTCATTTTTCTCATTTCTTGAGCATTAG | Sigma/Merck | N/A |
| Ireb2 primer 1 GGCTTCAATAGTCTTCATACCACG | Sigma/Merck | N/A |
| Ireb2 primer 2 CTGAAAGACTGACCCTTCTTGTTC | Sigma/Merck | N/A |
| Ireb2 primer 3 TGAGTGGTGCCTGCATTTTAAG | Sigma/Merck | N/A |
| Taqman probe: Hypoxanthine-guanine phosphoribosyltransferase | Applied biosystems/ Thermofisher | Mm01545399_m1 |
| Taqman probe: Interleukin 6 | Applied biosystems/ Thermofisher | Mm99999064_m1 |
| Taqman probe: Tumor necrosis factor alpha | Applied biosystems/ Thermofisher | Mm00443258_m1 |
| Taqman probe: Ferroportin | Applied biosystems/ Thermofisher | Mm01254822_m1 |
| Taqman probe: Beta-2-microglobulin | Applied biosystems/ Thermofisher | Mm00437762_m1 |
| Taqman probe: Hepcidin | Applied biosystems/ Thermofisher | Mm04231240_s1 |
| Taqman probe: Influenza Nucleoprotein | Applied biosystems/ Thermofisher | NC_002019.1 Assay ID: AIX02UC |
| Software and Algorithms | ||
| Graphpad prism version 8 | http://graphpad.com | N/A |
| Flowjo version 10.4r1 | https://flowjo.com | N/A |
Resource Availability
Lead Contact
Further information and requests for resources and reagents should be directed to and will be fulfilled by the Lead Contact, Hal Drakesmith (alexander.drakesmith@imm.ox.ac.uk)
Materials Availability
This project did not generate new unique reagents
Data and Code Availability
This project did not generate any new code or novel datasets
Experimental Model and Subject Details
Mice
Unless otherwise stated, animal procedures were performed under the authority of UK Home Office project and personal licenses in accordance with the Animals (Scientific Procedures) Act 1986, and were approved by the University of Oxford ethical review committee. Mice were housed in individually ventilated cages and fed ad-libitum with a standard diet containing 188ppm iron (SDS Dietex Services, diet 801161), or irradiated low iron diet (2ppm Fe, TD.99397, Teklad Envigo), or irradiated adjusted iron diet (control for low iron diet, 200ppm Fe, TD.07801, Teklad Envigo). Mice were euthanised in increasing CO2 concentrations.
WT C57BL/6JOlaHsd mice were ordered from Envigo. WT B6.SJL-Ptprca Pepcb/BoyJ (congenic C57BL/6 CD45.1 expressing mice) were bred in house at the University of Oxford. WT mice were maintained on standard 188ppm iron diet for at least 2-weeks in house before comparisons to transgenics was made. TfrcY20H/Y20H mice on a homogeneous C57BL/6 background were a kind gift from Raif Geha, Boston Children’s Hospital, Harvard Medical School.3 OT-I CD45.1: Transgenic C57BL/6.Tg(TcraTcrb)1100Mjb (OT-I) mice crossed with BL6 congenic strain B6.SJL-Ptprca Pepcb/BoyJ in house were a kind donation from Mike Bogetofte Barnkob and Vincenzo Cerundolo (MRC HIU). OT-II CD45.1/CD45.2 heterozygous mice. Transgenic B6.Cg-Tg(TcraTcrb)425Cbn/J (OT-II) mice were a girft from Oliver Bannard and originally from The Jackson Laboratory, Bar Harbor ME and crossed to congenic homozygous B6.SJL-Ptprca Pepcb/BoyJ (CD45.1) to generate mice heterozygous for the Tg(TcrbaTcrb)425Cbn transgene, Pepc and Pepb alleles: OT-II CD45.1/CD45.2 heterozygous. All mice were sex matched and age matched (to within 2-weeks) within individual experiment. For in vivo immunisation experiments mice were used between 6-9 weeks of age, all mice were between 6-12 weeks-of-age when initiating the experiment. Within each experiment mice were randomly allocated to treatment groups such that an equal number of mice in each cage received each treatment. For diet experiments mice were randomly assigned to diet groups at the beginning of the experiment.
T cells with conditional loss of IRP function were derived from animals obtained by crossing mouse lines carrying floxed Irp1 (Aco1) and Irp2 (Ireb2) alleles49 with a knock-in strain bearing a tamoxifen-inducible CRE recombinase (CreERT2) sequence into the permissive Rosa26 locus.50 Aco1flox/flox, Ireb2flox/flox, Rosa26+/+ (CRE negative, termed IRP1/2flox/flox Cre –ve) and Aco1flox/flox,Ireb2flox/flox, Rosa26+/CreERT2 littermates (CRE positive, termed IRP1/2flox/flox Cre +ve) were on a homogeneous C57BL/6 background. The breeding and procedures carried out on mice at the DKFZ was done according to institutional guidelines. Mice were genotyped using the Aco1 and Ireb2 primer sequences in the Key Resources Table.
Injected substances
Minihepcidin: An appropriate mass of mini-hepcidin PR7329 (da-TH-Dpa-bhPro-RCR-bhPhe-Ahx-Ida(Hexadecylamine)-NH2) was dissolved in 80% ethanol and then mixed with 60mg of Purebright SL220/ Sunbright DSPE-020CN (NOF). The control solution was Purebright SL220 dissolved in ethanol. The ethanol was evaporated off using a vacuum chamber warmed to 50°C. The resultant gel was stored up to 24 hours at 4°C and re-dissolved in an appropriate volume of water to give a mHep concentration of 1mM: 100nMoles of mini-hepcidin in 100 μL of water was injected per mouse per dose.
Ferric ammonium citrate (FAC) (F5879 Sigma Aldrich) was dissolved to 3mg/ml in PBS. 100 μL was injected intraperitoneally into mice. Iron dextran (Sigma, D8517) was adjusted to 20mg/ml in PBS and 100 μL was injected intraperitoneally into mice.
Immunizations
Modified vaccinia virus Ankara expressing Ovalbumin: MVA-OVA was a kind gift from the Viral Vector Core Facility, Jenner Institute, University of Oxford. Virus was diluted to 10ˆ7 plaque forming units (PFU)/mL in PBS, 100 μL was injected sub-cutaneously into the flank of mice.
Adenovirus human serotype 5 expressing Ovalbumin: AdHu5-OVA was a kind gift from the Viral Vector Core Facility, Jenner Institute, University of Oxford. Virus was diluted to 10ˆ10 viral particles (VP)/mL in PBS, 100 μL was injected sub-cutaneously into the flank of mice.
For primary OVA protein immunisations mice received 200ug (for OT-I or OT-II responses) or 800ug (endogenous responses) of OVA (endofit Ovalbumin vac-pova, Invivogen), 25ug of MPLA (vac-mpla, Invivogen) and 1ug of alpha-galactosylceramide (gift from GS Besra, University of Birmingham, UK or KRN7000 Enzo Life Sciences). For secondary OVA protein immunisations mice received 200ug of OVA and 25ug of MPLA subcutaneously in the flank.
Adoptive transfers
For experiments involving response of OT-I CD8 or OT-II CD4 T cells, red cell lysed spleen suspensions were obtained and the frequency of OT-I CD8 T cells or OT-II CD4 T cells was evaluated by flow cytometry. The concentration of whole spleen suspension was adjusted to 50,000 OT-I CD8 T cells/ml or 500,000 OT-II CD4 T cells/ml and 100ul of cell suspension in PBS was injected i.v.
Mixed bone marrow chimeras
For mixed bone marrow chimerism experiments a mix of 60% TfrcY20H/Y20H CD45.2 (or WT CD45.2) bone marrow was combined with 40% CD45.1 bone marrow to test the capacity of TfrcY20H/Y20H cells to reconstitute and contribute to immune responses relative to wild-type cells. Male CD45.2 recipients at 8-weeks of age received were lethally irradiated with 4.5 Gy for 300 s, followed by a 3-hour rest, and a subsequent 4.5 Gy dose for 300 s. Mice received 2 million total bone marrow cells from the specified mice, after 9-weeks of rest peripheral blood was taken to analyze reconstitution by flow cytometry. To prevent bacterial infection recipient mice received antibiotics in their drinking water (0.16mg/mL Enrofloxacin (Baytril), Bayer Coporation).
Influenza virus infection
Influenza virus (A/X-31 (H3N2) A/Aichi/2/1968)46 was propagated in MDCK-SIAT1 cells and quantified by hemagglutination assays and TCID50 as previous described.47
Mice were anaesthetised with aerosolised isoflurane and infected with 0.08 haemagglutination units (HAU) of influenza virus X-31 intranasally. Virus suspension was pipetted drop wise onto the nares such that the virus is inhaled.
Influenza specific antibody titers in serum of infected mice was measured by in vitro microneutralisation assays of infection of MDCK-SIAT1 cells with a H3N2 (X31) GFP expressing pseudotyped reporter virus (S-FLU) as described47 with minor modifications. In brief, collected mouse sera was heat inactivated at 56C for 30min. Dilutions of sera (starting dilution 1:40) was incubated with H3N2 (X31) S-FLU for 2 hours at 37C before addition of 3e4 of indicator MDCK-SIAT1 cells. Plates were incubated overnight at 37C. Plates were then washed and fixed in 10% formalin. GFP expression was measured on a Clariostar plate reader and the dilution of sera that resulted in 50% reduction of infection of the virus (determined via 50% reduction in GFP signal) was reported as the neutralising titer (EC50).
Piglet study
Piglet housing and experimental procedures were all performed at the Centre for Dairy Research (CEDAR), University of Reading, in accordance with local ethical guidelines. All experiments were approved by the Reading Animal Welfare and Ethical Review Body (AWERB) and were performed under a UK Home Office License. To assess the impact of iron deficiency on responses to vaccination, 18 large white F1 hybrid piglets from 6 litters were distributed evenly between 2 sex-matched treatment groups at 1 day old. Treatments were: group 1: Non-iron supplemented control, fed sow milk replacer (SMR) similar to bovine-based infant formula milk; group 2: fed iron supplemented (150mg/kg BW) SMR, half this group also received an intramuscular (IM) iron injection (200mg Fe) at 1 day old (Figure S6). Prior to their arrival at CEDAR, the piglets did not receive vaccinations, antibiotics or standard husbandry IM iron injections. Initially piglets were housed in 2 groups (oral iron and no oral iron supplementation) in order to learn to drink from bowls and at 2 days old were individually housed. Throughout the trial piglets were housed at 30°C on sawdust and straw and provided with heat lamps under a 12h light and dark cycle and had free access to fresh drinking water. Piglets were initially fed 10% SMR concentration (either iron supplemented or non-supplemented) every 4 hours (5 feeds/day) and this was increased to 15% and finally to 20% (4 feeds/day, standard concentration) by day 4 in order to reduce the risk of scouring. Following twice-a-week weight measurements, the amount of SRM and ferrous sulfate (oral iron supplementation) was increased accordingly to achieve 150mg/kg body weight throughout the trial. All piglets received an IM vaccination against Mycoplasma hyopneumoniae (2ml, Suwaxyn MH-One, Zoetis Ltd, Leatherhead, UK) at 2 weeks old and blood samples were collected via venepuncture using non-EDTA vacutainers at 2 weeks (pre-vaccination), 3 and 4 weeks old (post-vaccination). Blood was immediately refrigerated for 3-4 hours before being centrifuged to obtain serum, which was stored at −80°C. At 28 days, piglets were killed by overdose of pentobarbital sodium BP 20% (Dolethal, Vetoquinol Ltd, Northamptonshire, UK).
IRIDA patients
Collection, genotyping, and hematological phenotyping of IRIDA and control patients has been described previously.51
Cell culture
All cells were cultured at 37°C, 20% O2 and 5% CO2. Media. Complete R10. RPMI with 10% FCS (sigma), glutamine (2mM), penicillin (100U/ml), streptomycin (0.1mg/ml) and Beta-mercaptoethanol (55μM). Iron modified culture medium. Pannexin NTS serum substitute (P04-95080; Pan Biotech) lacking iron was ordered. Iron free Pannexin NTS serum substitute was added at 10% v/v to RPMI alongside glutamine (2mM), penicillin (100U/ml), streptomycin (0.1mg/ml) and Beta-mercaptoethanol (55μM) to make iron free complete medium. To modify the iron content of the iron free complete medium, holotransferrin (T0665 Sigma Aldrich) was added at the specified concentration. Apotransferrin (T1147 Sigma Aldrich) was also added to iron free complete medium to maintain the total transferrin concentration of the medium at 1.2mg/ml.
CD8 T cells. Single cell suspensions were made from cervical, inguinal, axillary and brachial lymph nodes by mechanical dissociation through a 40 μm cell strainer. When proliferation was analyzed lymph node suspensions were resuspended in 500 μL of PBS with 5μM Invitrogen Cell Trace Violet (C34557) and stained at 37°C for 8 minutes before quenching with 12ml of complete medium, washing and proceeding to T cell isolation. CD8 T cells were isolated from the lymph nodes of WT C57BL/6, TfrcY20H/Y20H, OT-I CD45.1 using the Stem Cell Technologies CD8 T cell isolation kit (19853, Stem Cell Technologies) and Easy Plate Magnet, and from IRP1/2flox/flox Cre -/+ ve mice using the Miltenyi Biotech negative CD8 T cell isolation kit (130-104-075, Miltenyi Biotech) as per manufactures instructions.
Flat bottom tissue culture treated plates were coated with 5 μg/ml of anti-mouse CD3 (145-2C11) for 2 hours at 37°C and then washed with PBS. CD8 T cells were plated in complete medium with a final concentration of 100U/ml mouse IL-2 and 1 μg/ml anti-mouse CD28 (37.51). Cultures involving TfrcY20H/Y20H, WT C57BL/6 cells or IRP1/2flox/flox Cre -/+ ve were carried out in complete R10 medium. Cultures examining the effect of reduced iron concentration on WT T cells from C57BL6/ or OT-1 CD45.1 mice were performed in iron free complete medium. CD8 T cells were plated at a final concentration of 500,000/ml for analysis at 72hrs post activation for proliferation analysis or 700,000/ml for analysis at 24hrs post activation for activation analysis.
For culture of IRP1/2flox/flox Cre -/+ ve cells were treated with either 4-hydroxytamoxifen (4-OHT) (H6278, Sigma/Merck) at 100nM or a comparable volume of pure ethanol concurrent with the activation mixture of soluble anti-CD28, IL-2 and plate-bound anti-CD3. When cell proliferation was to be analyzed, after 24hrs of culture cells were harvested, spun down and resuspended in fresh medium with 100U/ml mouse IL-2 and 1 μg/ml anti-mouse CD28 to remove 4-OHT or EtOH and re-plated in wells coated with anti-mouse CD3. Cells were cultured for an additional 48hrs and proliferation was evaluated by flow cytometry.
For iron rescue experiments iron sulfate (FeSO4) (F8633, Sigma Aldrich) or ferric ammonium citrate (FAC) (F5879, Sigma Aldrich) was added at the indicated concentration from the start of culture and replenished in the case of the IRP1/2flox/flox Cre -/+ ve experiments after 24hrs when 4-OHT/EtOH was removed.
BMDCs were cultured as described52 with minor modifications. In brief, red cell lysed bone marrow cells from C57BL/6 mice were resuspended at 1 million cells/ml in complete R10 medium with 100ng/ml FLT3L (550702, Biolegend) and cultured for 7 days before use.
Method Details
Flow cytometry
Single cell suspensions of lymph nodes or spleen were made by mechanical dissociation through a 40 μm cell strainer. Red cells were lysed in spleen suspensions using Tris ammonium chloride (ACT) Red cell lysis buffer (2.06 g/L Tris base and 7.47 g/L NH4Cl, 1L H20, adjusted to pH 7.2)
To isolate lymphocytes from the lung, lungs were minced with scissors and digested for 30 minutes in 4ml of digestion medium: RPMI, 40U/ml DNase I (Sigma-Aldrich, catalog number: D5025) and 0.4mg/ml of Collagenase IV (Sigma-Aldrich, catalog number: C5138). Single cell suspensions were made by crushing through a 70μM cell strainer. Cells were pelleted and red cell lysed with ACT Red cell lysis buffer. A 40%/80% Percoll (GE Healthcare 17-0891-02) layer isolation was then used to enrich for lymphocytes in the lung suspension. Enriched lymphocytes were then washed and counted before flow staining.
For analysis of murine peripheral blood leukocytes, 100μl of whole blood collected by tail bleed into a BD microtainer EDTA tube was mixed with 1ml of ACT Red Cell lysis buffer and incubated at room temperature for 20 minutes. The blood solution was spun down at 400 g for 5 minutes, supernatant removed, and the leukocyte pellet transferred to a round bottom 96 well plate for flow cytometric staining.
Tissue cell suspensions or in vitro activated cells at appropriate time points after activation cells were transferred to a 96 well round bottom plate, spun down and washed with 200 μL of PBS. Cells were stained with appropriate concentrations of FC receptor block, fluorophore conjugated antibodies and a fixable live dead dye in 40 μL of PBS for 20 minutes at 4°C in the dark. Cells were washed and ran directly on an Invitrogen Attune or BD LSR Fortessa. For some experiments, cells were fixed for 10 minutes in 100ul of 4% paraformaldehyde at 4°C in the dark before washing and resuspension for analysis or resuspended in saponin based perm buffer to stain intracellular antigens.
Tetramer staining using reagents from the NIH tetramer facility was carried out at room temperature for 30 mins in FACs buffer (PBS with 2% FCS and 0.04% Sodium Azide) prior to antibody staining.
For mitochondrial analysis, cells were washed and stained with Mitotracker Green (M7514, Thermofisher Scientific) and Mitotracker Deep Red (M22426, Thermofisher Scientific) at 100nM in complete media (either iron deficient medium for serum iron deficiency recapitulating cultures or R10 for TfrcY20H/Y20H cultures) for 30mins at 37°C as per the manufacturer’s instructions. We found that MTDR staining was sensitive to pharmacological disruption of the mitochondrial membrane potential with Carbonyl cyanide-p-trifluoromethoxyphenylhydrazone (FCCP) consistent with published literature.53 The ratio of MTDR to MTG was calculated to indicate the membrane potential normalized for volume of mitochondria.
For detection of intracellular cytokines splenocytes were plated at 2 million cells/200μl in complete media in a round bottom 96 well plate with 0.1μg/ml SIINFEKL (OVA 257-264)(Vac-sin Invivogen) peptide for OVA specific responses, 0.5μg/ml B8R peptide for Vaccinia specific responses (AS-64688, Anaspec) or 1ug/ml OVA (323-339), (Va- isq, Invivogen) to induce OT-II cytokine production. After 30mins 5μg/ml Brefeldin A was added and cells were cultured for a further 4 hours before surface/intracellular staining for flow cytometry.
For detection of MVA specific CD4 responses by ICS, day 7 BMDC were plated at 0.3 million cells per well of a 96 well plate with 50ng/ml FLT3L. BMDCs were either left unstimulated, non-specifically stimulated with 0.5μM of CpG (ODN 1826) (Tlrl-1826, Invivogen) or infected with MOI of 1 of MVA-OVA overnight. The following day the cells were washed and 2 million splenocytes from unimmunised or MVA immunized mice were added. After 30mins Brefeldin A was added to a final concentration of 5μg/ml and cells were cultured for a further 4 hours before surface/intracellular staining for flow cytometry. Cytokine secreting CD4 T cells were defined as CD154+ cytokine+ (compared to unstimulated CD4 on CpG pulsed DCs or CD4s from naive mice).
See Key Resources Table for antibodies used.
Example gating schemes for key populations are depicted in Supplementary Methods Figures 1–6. CD8+ CD44+ Tetramer+ CD8 T cells (Supplementary Methods Figure 1A) and effect of minihepcidin on tetramer positive CD8s (Supplementary Methods Figure 1B). B220+ IgD- CD95+ germinal center B cells (Supplementary Methods Figure 2A) and effect of minihepcidin on germinal center B cells (Supplementary Methods Figure 2B). CD4+ CD44+ CXCR5+ PD-1+ T follicular helper cells (Supplementary Methods Figure 3A) and effect of minihepcidin on T follicular helper cells (Supplementary Methods Figure 3B). CD138+ IgD- plasma cells (Supplementary Methods Figure 4A) and effect of minihepcidin on plasma (Supplementary Methods Figure 4B). CD8+ CD45.1+ OT-I CD8s (Supplementary Methods Figure 5A) and effect of minihepcidin on OT-I effector cells (Supplementary Methods Figure 5B). Gating of OT-I IFN-gamma, TNF-alpha or IL-2 producing CD8 T cells by ICS (Supplementary Methods Figure 6A) and effect of minihepcidin on cytokine producing CD8 T cells (Supplementary Methods Figure 6B).
Gene expression analysis by quantitative real time PCR (qRT-PCR)
RNA was extracted from liver explants or lung lobes harvested into RNA later (AM7020 Thermofisher Scientific) and snap frozen cell pellets with the RNeasy plus kit (QIAGEN, 74136) and reverse transcribed to cDNA (Life Technologies, 4387406) for quantitative PCR on the Applied Biosystems 6500 Fast Real-Time PCR system machine using TaqMan assays listed in the Key Resources Table. according to the manufacturer’s protocols. Gene expression is presented as 2ˆ([CT of endogenous control gene] – [CT of gene of interest]). Hprt was used an endogenous control gene for liver and lung qRT-PCR. B2m was used as a control gene for CD8 T cell cultures as the CT does not change during T cell activation.
Tissue and serum iron measurements
Tissues were dried for 3 hours at 100°C, and the dry mass of tissue piece was measured. Tissue pieces were digested in 10% trichloroacetic acid/ 30% hydrochloric acid for 20 hours at 65°C. Non-haem iron content was determined by reaction of the acid digested tissue with chromogen reagent containing 0.1% (w/v) bathophenanthrolinedisulphonic acid (Sigma, 146617) and 0.8% thioglycolyic acid (Sigma, 88652) measuring absorption at 535nm and comparing to a standard curve of ferric ammonium citrate as described.54
For serum analysis of murine samples up to 400μl of blood obtained by cardiac puncture was placed in a BD microtainer SST tube (Beckton Dickinson). Serum was obtained by spinning the clotted blood sample was spun at 8,000 g for 5 minutes and stored at −80°C. Serum iron was quantified using the Abbott Architect c16000 automated analyzer (Abbott Laboratories) and the MULTIGENT Iron Kit at Oxford John Radcliffe Hospital, UK.
Analysis of piglet study
Pig serum iron was measured using an automated assay on an Abbott Architect c16000 automated analyzer (Abbott Laboratories) in the Department of Clinical Biochemistry, OUHNHS. Serum samples were tested for M. hyopneumoniae antibodies using a commercial monoclonal blocking ELISA (M. hyopneumoniae detection kit, Thermo Scientific Oxoid, UK, K004311) according to manufacturer’s instructions at Biobest Laboratories Ltd, Edinburgh; sample optical density (OD) results were corrected using the mean OD of buffer control wells. Serum titers of neutralising antibodies (agnostic of isotype) were calculated as a percentage blocking of signal derived from binding of the defined anti-M. hyopneumoniae HRP conjugated antibody included in the assay. Results were reported as improvement in % block on day 28 (14 days post immunisation) relative to day 14 (day of immunisation) to detect improvement in antibody responses above inherited maternal antibody. Improvement in % block = (% block on day 28) – (% block on day 14).
Murine anti-OVA IgG titers
Antibody titers against OVA protein from immunized mice were determined by ELISA. In, brief, plates were coated with OVA protein (InvivoGen Endofit, 50 μl/well at 10 μg/ml) over night. Dilutions of test sera (in triplicate) were added to the plate. Plates were washed 6 times with PBS-T (PBS, 0.05% Tween). To detect OVA binding IgG, the goat anti-mouse secondary Ab binding an alkaline-phosphatase–conjugated goat anti-mouse IgG (Sigma Aldrich A-3562), followed by further washing. OD405 after addition of pNPP substrate was quantified using an ELx800 plate reader (Bio-Tek). The dilution at which the OD was first below background + 3 SD was recorded in AU as the endpoint titer.
Human sera antibody measurements in IRIDA patients
Antibody concentrations (IgG) against Measles, Mumps, Rubella, Varicella, Ptx, FHA, Prn, Dtxd, Ttx, Hib, and Steptococcus pneumoniae seroptypes 1, 3, 4, 5, 6A, 6B, 7F, 9V, 14, 18C, 19A, 19F, 23F in sera from IRIDA patients with mutant TMPRSS6 alleles and non-iron deficient wild-type TMPRSS6 controls were measured at National Institute for Public Health and the Environment, Bilthoven, Netherlands. In no case was mean antibody concentration significantly higher in TMPRSS6 patients.
Histology
To evaluate airway inflammation, lung samples were fixed with 4% paraformaldehyde in phosphate buffer and embedded in paraffin at the HEMS core facility at i3S, Portugal. Following deparaffinization with xylene and hydration by a passage through a grade of alcohols, 3μm-thick sections were stained with hematoxylin-eosin. Histopathology scores for pulmonary inflammation were assigned using modified criteria55 as follows: 0, normal, no inflammation; 1, minimal, rare foci of inflammation; 2, mild, inflammatory cell infiltrate of the perivascular/peribronchiolar compartment with none or scarce alveolar extension; 3, moderate, inflammatory cell infiltrate of the perivascular/peribronchiolar space with modest extension into the alveolar parenchyma; and 4, severe, inflammatory cell infiltrate of the perivascular/peribronchiolar space with a greater magnitude of inflammatory foci found in the alveolar parenchyma. Neutrophilic infiltration was classified as 0, no evidence of polymorphonuclear leukocytes (PMN); 1, presence of dispersed PMN; 2, frequent PMN with focal aggregation; 3, frequent PMN with multifocal aggregation. Neutrophil infiltration was further evaluated with the chloracetate esterase (Leder) stain, performed at the Anatomic Pathology Service at Centro Hospitalar de São João, Portugal. Orcein staining (performed at IPATIMUP Diagnostics, Portugal) was used to evaluate the elastic fibers of the alveolar septa and assess the degree of alteration of the alveolar lung structure associated to the presence of the inflammatory infiltrate. Sections were scored by two investigators, including a trained pathologist in a blinded manner without prior knowledge of the treatment groups. The mean score was calculated and compared between treatment groups. Spleen sections were processed similarly, but stained with Perls’ Prussian blue reaction for ferric iron using standard procedures.
ATP production rate by Seahorse metabolic flux analysis
ATP production rate and the relative contribution of mitochondrial and glycolytic metabolism to this was calculated as per manufacturer’s protocol using the Agilent Seahorse XF real-time ATP rate assay kit (103592-100) and an Aligent XF96 instrument. In brief CD8 T cells were harvested after 48 hours of activation in media with the specified transferrin concentration, washed, resuspended in Seahorse Assay Media (unbuffered RPMI pH 7.40 with 1mM pyruvate, 2mM L-glutamine and 10mM Glucose) and 150,000 viable cells/well were aliquoted into a Poly-D-lysine coated XF96 microplate. Oxygen consumption rates (OCR) and extracellular acidification rates (ECAR) were measured upon sequential addition of 1.5 μM Oligomycin and 0.5 μM Rotenone/Antimycin A.
ATP quantification by luminescence
ATP production was measured using Cell Titer-Glo (Promega G7570) according to manufacturer’s instructions. In brief CD8 T cells were cultured as described in ‘cell culture’ for 24 hr (and therefore analyzed to prior to the initiation of cell division), spun down and resuspended in 50 μL of medium (iron free for iron deficiency cultures, normal RPMI with 10% FCS for TfrcY20H/Y20H cultures), transferred to a white walled opaque 96-well plate appropriate for luminescence measurements and 50 μL of Cell Titer-Glo was added. Wells were mixed and luminescence, proportional to ATP content, was measured on a Promega GloMax Luminometer.
Quantification and Statistical Analysis
Standard randomization procedures were used for in vivo experiments mice of the same age and sex (experimental and control mice were chosen at random from among littermates). The investigators were not blinded to allocation during experiments and assessments. The required number of mice for each experiment was determined from availability of bred animals, power calculations, prior experience of performing experiments with the same strains of mice and data from pilot experiments. Statistical analyses were performed using Prism version 6 (GraphPad Software). Details of specific statistical tests are given in figure legends.
For antibody concentrations of TMPRSS6 IRIDA patients, we conducted statistical analyses with SPSS (IBM SPSS statistics, Version 22). Data were checked for normality by Smirnov-Kolmogorov tests and by visual inspection of histogram plots. Non-normally distributed data were logarithmically transformed for statistical analyses. We defined immunological response as protective when participants had anti-diphtheria serum IgG concentrations ≥ 0·1IU/ml,56 anti-tetanus IgG > 0.5IU/ml,57 anti-Hib IgG > 1.0μg/ml,57 anti-PCV IgG ≥ 0·35 μg/ml58 and anti-measles IgG ≥ 0·12IU/ml.59 There is no protective serum concentration established for anti-pertussis IgG.57 For between-group effects, independent sample t tests or independent sample non-parametric tests were used. We performed analysis of covariance (ANCOVA) to assess the effect of group (IRIDA versus control) on serum IgG concentrations. Group was defined as fixed effect and we sequentially added known predictors of vaccine response: gender, age, Hb, TSAT as covariates to the models. We performed Pearson Chi-Square test and Fisher’s Exact test to compare seroconversion between the IRIDA and control groups.
Acknowledgments
The authors thank the staff of the Department of Biomedical Services, University of Oxford for animal husbandry, Alireza Morovat (Clinical Biochemistry, Oxford University Hospitals NHS Foundation Trust) for assistance with biochemical measurements, David Pattinson (Jenner Institute, Oxford University) and Biobest Laboratories, Edinburgh, for help with ELISAs, and the Weatherall Institute of Molecular Medicine flow cytometry facility and members of the Cantrell Lab, University of Dundee, for many helpful discussions. This work was supported by the UK Medical Research Council (MRC Human Immunology Unit core funding to H.D., award no. MC_UU_12010/10), and a Christopher Welch Scholarship and EMBO Short Term Fellowship to J.N.F. S.J. Draper is a Jenner Investigator, a Lister Institute Research Prize Fellow, and a Wellcome Trust Senior Fellow (106917/Z/15/Z). We thank the Jenner Institute, University of Oxford, Viral Vector Core Facility for the production of recombinant viral vaccines. The work conducted at i3S was supported by the Norte 2020 Portugal Regional Operational Programme (grant no. Norte-01-0145-FEDER-000012); the authors also acknowledge support of the i3S Scientific Platform HEMS, a member of the national infrastructure PPBI-Portuguese Platform of Bioimaging (PPBI-POCI-01-0145-FEDER-022122). O.B. is funded by a Sir Henry Wellcome Fellowship (105654/Z/14/Z). T.K.T. was funded by the Townsend-Jeantet Charitable Trust (charity no. 1011770). M.S. and U.G. were supported by the MRC Human Immunology Unit core funding to V.C. B.K. is funded by an NIHR Research Capability Funding grant from the Oxford Biomedical Research Centre. S.J. Dunachie is a Jenner Investigator and is funded by the Fleming Fund at the UK Department of Health and Social Care. M.D.F and D.R.C. are supported by the S. Burt Wolbach Professorship, Harvard Medical School. S.K.W. was supported by the Wellcome Trust Infection, Immunology & Translational Medicine doctoral programme (grant no. 108869/Z/15/Z). B.G. received grants from the Deutsche Forschungsgemeinschaft (grant nos. GA2075/3-1 and GA2075/5-1). M.A. was funded by a University of Reading International Research Studentship. A.S. is currently supported by an NIHR Doctoral Research Fellowship (NIHR-DRF-2017-10-094). This study is dedicated to Maria de Sousa and Vincenzo Cerundolo.
Author Contributions
Conception and Design of Work, J.N.F., T.K.T., M.A., T.L.D., A.E.A., A.R.M.T., B.G., M.C.L., and H.D. Acquisition and Analysis of Data, J.N.F., T.K.T., M.A., A.S., S.K.W., M.B., N.S., K.W., B.K., G.S., D.R.C., T.L.D., J.M.L., A.E.A., J.A., P.J.L., A.E.P., D.A., M.T., C.N., M.S., U.G., F.R.M.v.d.K., A.R.M.T., B.G., M.D.F., M.C.L., and H.D. Collection, Phenotyping, and Genotyping of Iron-Deficient Patients, M.D.F. and D.R.C. Interpretation of Data, J.N.F., N.S., T.L.D., O.B., S.C.A., S.J. Dunachie, M.Z., F.R.M.v.d.K., V.C., S.J. Draper, A.R.M.T., B.G., M.D.F., M.C.L., and H.D. Writing, J.N.F. and H.D.
Declaration of Interests
H.D. has sat on the advisory board of Kymab, received research funding from Pfizer and La Jolla Pharmaceutical Company, and received honoraria from Pharmacosmos and Vifor. The other authors declare no competing interests.
Published: November 19, 2020
Footnotes
Supplemental Information can be found online at https://doi.org/10.1016/j.medj.2020.10.004.
Contributor Information
Joe N. Frost, Email: joe.frost@imm.ox.ac.uk.
Hal Drakesmith, Email: alexander.drakesmith@imm.ox.ac.uk.
Supplemental Information
References
- 1.Phan A.T., Goldrath A.W., Glass C.K. Metabolic and epigenetic coordination of T cell and macrophage Immunity. Immunity. 2017;46:714–729. doi: 10.1016/j.immuni.2017.04.016. [DOI] [PMC free article] [PubMed] [Google Scholar]
- 2.Andreini C., Putignano V., Rosato A., Banci L. The human iron-proteome. Metallomics. 2018;10:1223–1231. doi: 10.1039/c8mt00146d. [DOI] [PubMed] [Google Scholar]
- 3.Jabara H.H., Boyden S.E., Chou J., Ramesh N., Massaad M.J., Benson H., Bainter W., Fraulino D., Rahimov F., Sieff C. A missense mutation in TFRC, encoding transferrin receptor 1, causes combined immunodeficiency. Nat. Genet. 2016;48:74–78. doi: 10.1038/ng.3465. [DOI] [PMC free article] [PubMed] [Google Scholar]
- 4.Pasricha S.R., Armitage A.E., Prentice A.M., Drakesmith H. Reducing anaemia in low income countries: control of infection is essential. BMJ. 2018;362:k3165. doi: 10.1136/bmj.k3165. [DOI] [PubMed] [Google Scholar]
- 5.Muckenthaler M.U., Rivella S., Hentze M.W., Galy B. A Red Carpet for Iron Metabolism. Cell. 2017;168:344–361. doi: 10.1016/j.cell.2016.12.034. [DOI] [PMC free article] [PubMed] [Google Scholar]
- 6.Nemeth E., Tuttle M.S., Powelson J., Vaughn M.B., Donovan A., Ward D.M., Ganz T., Kaplan J. Hepcidin regulates cellular iron efflux by binding to ferroportin and inducing its internalization. Science. 2004;306:2090–2093. doi: 10.1126/science.1104742. [DOI] [PubMed] [Google Scholar]
- 7.Lim P.J., Duarte T.L., Arezes J., Garcia-Santos D., Hamdi A., Pasricha S.R., Armitage A.E., Mehta H., Wideman S., Santos A.G. Nrf2 controls iron homeostasis in haemochromatosis and thalassaemia via Bmp6 and hepcidin. Nat. Metab. 2019;1:519–531. doi: 10.1038/s42255-019-0063-6. [DOI] [PMC free article] [PubMed] [Google Scholar]
- 8.Drakesmith H., Prentice A.M. Hepcidin and the iron-infection axis. Science. 2012;338:768–772. doi: 10.1126/science.1224577. [DOI] [PubMed] [Google Scholar]
- 9.Ganz T. Anemia of Inflammation. N. Engl. J. Med. 2019;381:1148–1157. doi: 10.1056/NEJMra1804281. [DOI] [PubMed] [Google Scholar]
- 10.Armitage A.E., Agbla S.C., Betts M., Sise E.A., Jallow M.W., Sambou E., Darboe B., Worwui A., Weinstock G.M., Antonio M. Rapid growth is a dominant predictor of hepcidin suppression and declining ferritin in Gambian infants. Haematologica. 2019;104:1542–1553. doi: 10.3324/haematol.2018.210146. [DOI] [PMC free article] [PubMed] [Google Scholar]
- 11.Prentice A.M., Bah A., Jallow M.W., Jallow A.T., Sanyang S., Sise E.A., Ceesay K., Danso E., Armitage A.E., Pasricha S.-R. Respiratory infections drive hepcidin-mediated blockade of iron absorption leading to iron deficiency anemia in African children. Sci. Advances. 2019;5:eaav9020. doi: 10.1126/sciadv.aav9020. [DOI] [PMC free article] [PubMed] [Google Scholar]
- 12.Dallman P.R. Iron deficiency and the immune response. Am. J. Clin. Nutr. 1987;46:329–334. doi: 10.1093/ajcn/46.2.329. [DOI] [PubMed] [Google Scholar]
- 13.Oppenheimer S.J. Iron and its relation to immunity and infectious disease. J. Nutr. 2001;131(2S-2):616S–633S, discussion 633S–635S. doi: 10.1093/jn/131.2.616S. [DOI] [PubMed] [Google Scholar]
- 14.Wang Z., Yin W., Zhu L., Li J., Yao Y., Chen F., Sun M., Zhang J., Shen N., Song Y., Chang X. Iron Drives T Helper Cell Pathogenicity by Promoting RNA-Binding Protein PCBP1-Mediated Proinflammatory Cytokine Production. Immunity. 2018;49:80–92.e7. doi: 10.1016/j.immuni.2018.05.008. [DOI] [PubMed] [Google Scholar]
- 15.Jiang Y., Li C., Wu Q., An P., Huang L., Wang J., Chen C., Chen X., Zhang F., Ma L. Iron-dependent histone 3 lysine 9 demethylation controls B cell proliferation and humoral immune responses. Nat. Commun. 2019;10:2935. doi: 10.1038/s41467-019-11002-5. [DOI] [PMC free article] [PubMed] [Google Scholar]
- 16.Preza G.C., Ruchala P., Pinon R., Ramos E., Qiao B., Peralta M.A., Sharma S., Waring A., Ganz T., Nemeth E. Minihepcidins are rationally designed small peptides that mimic hepcidin activity in mice and may be useful for the treatment of iron overload. J. Clin. Invest. 2011;121:4880–4888. doi: 10.1172/JCI57693. [DOI] [PMC free article] [PubMed] [Google Scholar]
- 17.Howden A.J.M., Hukelmann J.L., Brenes A., Spinelli L., Sinclair L.V., Lamond A.I., Cantrell D.A. Quantitative analysis of T cell proteomes and environmental sensors during T cell differentiation. Nat. Immunol. 2019;20:1542–1554. doi: 10.1038/s41590-019-0495-x. [DOI] [PMC free article] [PubMed] [Google Scholar]
- 18.Hentze M.W., Muckenthaler M.U., Galy B., Camaschella C. Two to tango: regulation of mammalian iron metabolism. Cell. 2010;142:24–38. doi: 10.1016/j.cell.2010.06.028. [DOI] [PubMed] [Google Scholar]
- 19.Hukelmann J.L., Anderson K.E., Sinclair L.V., Grzes K.M., Murillo A.B., Hawkins P.T., Stephens L.R., Lamond A.I., Cantrell D.A. The cytotoxic T cell proteome and its shaping by the kinase mTOR. Nat. Immunol. 2016;17:104–112. doi: 10.1038/ni.3314. [DOI] [PMC free article] [PubMed] [Google Scholar]
- 20.Knight Z.A., Schmidt S.F., Birsoy K., Tan K., Friedman J.M. A critical role for mTORC1 in erythropoiesis and anemia. eLife. 2014;3:e01913. doi: 10.7554/eLife.01913. [DOI] [PMC free article] [PubMed] [Google Scholar]
- 21.Gerlach C., Moseman E.A., Loughhead S.M., Alvarez D., Zwijnenburg A.J., Waanders L., Garg R., de la Torre J.C., von Andrian U.H. The Chemokine Receptor CX3CR1 Defines Three Antigen-Experienced CD8 T Cell Subsets with Distinct Roles in Immune Surveillance and Homeostasis. Immunity. 2016;45:1270–1284. doi: 10.1016/j.immuni.2016.10.018. [DOI] [PMC free article] [PubMed] [Google Scholar]
- 22.Hikono H., Kohlmeier J.E., Takamura S., Wittmer S.T., Roberts A.D., Woodland D.L. Activation phenotype, rather than central- or effector-memory phenotype, predicts the recall efficacy of memory CD8+ T cells. J. Exp. Med. 2007;204:1625–1636. doi: 10.1084/jem.20070322. [DOI] [PMC free article] [PubMed] [Google Scholar]
- 23.Rytych J.L., Elmore M.R., Burton M.D., Conrad M.S., Donovan S.M., Dilger R.N., Johnson R.W. Early life iron deficiency impairs spatial cognition in neonatal piglets. J. Nutr. 2012;142:2050–2056. doi: 10.3945/jn.112.165522. [DOI] [PubMed] [Google Scholar]
- 24.Maes D., Segales J., Meyns T., Sibila M., Pieters M., Haesebrouck F. Control of Mycoplasma hyopneumoniae infections in pigs. Vet. Microbiol. 2008;126:297–309. doi: 10.1016/j.vetmic.2007.09.008. [DOI] [PMC free article] [PubMed] [Google Scholar]
- 25.Finberg K.E., Heeney M.M., Campagna D.R., Aydinok Y., Pearson H.A., Hartman K.R., Mayo M.M., Samuel S.M., Strouse J.J., Markianos K. Mutations in TMPRSS6 cause iron-refractory iron deficiency anemia (IRIDA) Nat. Genet. 2008;40:569–571. doi: 10.1038/ng.130. [DOI] [PMC free article] [PubMed] [Google Scholar]
- 26.Harboe Z.B., Benfield T.L., Valentiner-Branth P., Hjuler T., Lambertsen L., Kaltoft M., Krogfelt K., Slotved H.C., Christensen J.J., Konradsen H.B. Temporal trends in invasive pneumococcal disease and pneumococcal serotypes over 7 decades. Clin. Infect. Dis. 2010;50:329–337. doi: 10.1086/649872. [DOI] [PubMed] [Google Scholar]
- 27.Kalia V., Sarkar S. Regulation of Effector and Memory CD8 T Cell Differentiation by IL-2—A Balancing Act. Front. Immunol. 2018;9:2987. doi: 10.3389/fimmu.2018.02987. [DOI] [PMC free article] [PubMed] [Google Scholar]
- 28.Lee Y.S., Wollam J., Olefsky J.M. An Integrated View of Immunometabolism. Cell. 2018;172:22–40. doi: 10.1016/j.cell.2017.12.025. [DOI] [PMC free article] [PubMed] [Google Scholar]
- 29.Arezes J., Jung G., Gabayan V., Valore E., Ruchala P., Gulig P.A., Ganz T., Nemeth E., Bulut Y. Hepcidin-induced hypoferremia is a critical host defense mechanism against the siderophilic bacterium Vibrio vulnificus. Cell Host Microbe. 2015;17:47–57. doi: 10.1016/j.chom.2014.12.001. [DOI] [PMC free article] [PubMed] [Google Scholar]
- 30.Portugal S., Carret C., Recker M., Armitage A.E., Gonçalves L.A., Epiphanio S., Sullivan D., Roy C., Newbold C.I., Drakesmith H., Mota M.M. Host-mediated regulation of superinfection in malaria. Nat. Med. 2011;17:732–737. doi: 10.1038/nm.2368. [DOI] [PMC free article] [PubMed] [Google Scholar]
- 31.Darton T.C., Blohmke C.J., Giannoulatou E., Waddington C.S., Jones C., Sturges P., Webster C., Drakesmith H., Pollard A.J., Armitage A.E. Rapidly Escalating Hepcidin and Associated Serum Iron Starvation Are Features of the Acute Response to Typhoid Infection in Humans. PLOS Negl. Trop. Dis. 2015;9:e0004029. doi: 10.1371/journal.pntd.0004029. [DOI] [PMC free article] [PubMed] [Google Scholar]
- 32.Spottiswoode N., Armitage A.E., Williams A.R., Fyfe A.J., Biswas S., Hodgson S.H., Llewellyn D., Choudhary P., Draper S.J., Duffy P.E., Drakesmith H. Role of Activins in Hepcidin Regulation during Malaria. Infect. Immun. 2017;85:e00191-e17. doi: 10.1128/IAI.00191-17. [DOI] [PMC free article] [PubMed] [Google Scholar]
- 33.Williams A.M., Ladva C.N., Leon J.S., Lopman B.A., Tangpricha V., Whitehead R.D., Armitage A.E., Wray K., Morovat A., Pasricha S.R. Changes in micronutrient and inflammation serum biomarker concentrations after a norovirus human challenge. Am. J. Clin. Nutr. 2019;110:1456–1464. doi: 10.1093/ajcn/nqz201. [DOI] [PMC free article] [PubMed] [Google Scholar]
- 34.Armitage A.E., Stacey A.R., Giannoulatou E., Marshall E., Sturges P., Chatha K., Smith N.M., Huang X., Xu X., Pasricha S.R. Distinct patterns of hepcidin and iron regulation during HIV-1, HBV, and HCV infections. Proc. Natl. Acad. Sci. USA. 2014;111:12187–12192. doi: 10.1073/pnas.1402351111. [DOI] [PMC free article] [PubMed] [Google Scholar]
- 35.Shah A., Frost J.N., Aaron L., Donovan K., Drakesmith H., Collaborators Systemic hypoferremia and severity of hypoxemic respiratory failure in COVID-19. Crit. Care. 2020;24:320. doi: 10.1186/s13054-020-03051-w. [DOI] [PMC free article] [PubMed] [Google Scholar]
- 36.Lan P., Pan K.H., Wang S.J., Shi Q.C., Yu Y.X., Fu Y., Chen Y., Jiang Y., Hua X.T., Zhou J.C., Yu Y.S. High Serum Iron level is Associated with Increased Mortality in Patients with Sepsis. Sci. Rep. 2018;8:11072. doi: 10.1038/s41598-018-29353-2. [DOI] [PMC free article] [PubMed] [Google Scholar]
- 37.Tacke F., Nuraldeen R., Koch A., Strathmann K., Hutschenreuter G., Trautwein C., Strnad P. Iron Parameters Determine the Prognosis of Critically Ill Patients. Crit. Care Med. 2016;44:1049–1058. doi: 10.1097/CCM.0000000000001607. [DOI] [PubMed] [Google Scholar]
- 38.Blanco-Melo D., Nilsson-Payant B.E., Liu W.C., Uhl S., Hoagland D., Møller R., Jordan T.X., Oishi K., Panis M., Sachs D. Imbalanced Host Response to SARS-CoV-2 Drives Development of COVID-19. Cell. 2020;181:1036–1045.e9. doi: 10.1016/j.cell.2020.04.026. [DOI] [PMC free article] [PubMed] [Google Scholar]
- 39.Cao X. COVID-19: immunopathology and its implications for therapy. Nat. Rev. Immunol. 2020;20:269–270. doi: 10.1038/s41577-020-0308-3. [DOI] [PMC free article] [PubMed] [Google Scholar]
- 40.Barber M.F., Elde N.C. Escape from bacterial iron piracy through rapid evolution of transferrin. Science. 2014;346:1362–1366. doi: 10.1126/science.1259329. [DOI] [PMC free article] [PubMed] [Google Scholar]
- 41.Olotu A., Fegan G., Wambua J., Nyangweso G., Leach A., Lievens M., Kaslow D.C., Njuguna P., Marsh K., Bejon P. Seven-Year Efficacy of RTS,S/AS01 Malaria Vaccine among Young African Children. N. Engl. J. Med. 2016;374:2519–2529. doi: 10.1056/NEJMoa1515257. [DOI] [PMC free article] [PubMed] [Google Scholar]
- 42.Greenwood B. The contribution of vaccination to global health: past, present and future. Philos. Trans. R. Soc. Lond. B Biol. Sci. 2014;369:20130433. doi: 10.1098/rstb.2013.0433. [DOI] [PMC free article] [PubMed] [Google Scholar]
- 43.Stoffel N.U., Uyoga M.A., Mutuku F.M., Frost J.N., Mwasi E., Paganini D., van der Klis F.R.M., Malhotra I.J., LaBeaud A.D., Ricci C. Iron Deficiency Anemia at Time of Vaccination Predicts Decreased Vaccine Response and Iron Supplementation at Time of Vaccination Increases Humoral Vaccine Response: A Birth Cohort Study and a Randomized Trial Follow-Up Study in Kenyan Infants. Front. Immunol. 2020;11:1313. doi: 10.3389/fimmu.2020.01313. [DOI] [PMC free article] [PubMed] [Google Scholar]
- 44.Lopez A., Cacoub P., Macdougall I.C., Peyrin-Biroulet L. Iron deficiency anaemia. Lancet. 2016;387:907–916. doi: 10.1016/S0140-6736(15)60865-0. [DOI] [PubMed] [Google Scholar]
- 45.Katsarou A., Pantopoulos K. Hepcidin Therapeutics. Pharmaceuticals (Basel) 2018;11:127. doi: 10.3390/ph11040127. [DOI] [PMC free article] [PubMed] [Google Scholar]
- 46.Schulman J.L., Kilbourne E.D. Independent variation in nature of hemagglutinin and neuraminidase antigens of influenza virus: distinctiveness of hemagglutinin antigen of Hong Kong-68 virus. Proc. Natl. Acad. Sci. USA. 1969;63:326–333. doi: 10.1073/pnas.63.2.326. [DOI] [PMC free article] [PubMed] [Google Scholar]
- 47.Powell T.J., Silk J.D., Sharps J., Fodor E., Townsend A.R. Pseudotyped influenza A virus as a vaccine for the induction of heterotypic immunity. J. Virol. 2012;86:13397–13406. doi: 10.1128/JVI.01820-12. [DOI] [PMC free article] [PubMed] [Google Scholar]
- 48.Wang C., Hart M., Chui C., Ajuogu A., Brian I.J., de Cassan S.C. Germinal center B cell and T follicular helper cell responses to viral vector and protein-in-adjuvant vaccines. J. Immunol. 2016;197:1242–1251. doi: 10.4049/jimmunol.1502472. [DOI] [PMC free article] [PubMed] [Google Scholar]
- 49.Galy B., Ferring D., Hentze M.W. Generation of conditional alleles of the murine Iron Regulatory Protein (IRP)-1 and -2 genes. Genesis. 2005;43:181–188. doi: 10.1002/gene.20169. [DOI] [PubMed] [Google Scholar]
- 50.Badea T.C., Wang Y., Nathans J. A noninvasive genetic/pharmacologic strategy for visualizing cell morphology and clonal relationships in the mouse. J. Neurosci. 2003;23:2314–2322. doi: 10.1523/JNEUROSCI.23-06-02314.2003. [DOI] [PMC free article] [PubMed] [Google Scholar]
- 51.Heeney M.M., Guo D., De Falco L., Campagna D.R., Olbina G., Kao P.P., Schmitz-Abe K., Rahimov F., Gutschow P., Westerman K. Normalizing hepcidin predicts TMPRSS6 mutation status in patients with chronic iron deficiency. Blood. 2018;132:448–452. doi: 10.1182/blood-2017-03-773028. [DOI] [PMC free article] [PubMed] [Google Scholar]
- 52.Naik S.H., Proietto A.I., Wilson N.S., Dakic A., Schnorrer P., Fuchsberger M., Lahoud M.H., O’Keeffe M., Shao Q.X., Chen W.F. Cutting edge: generation of splenic CD8+ and CD8- dendritic cell equivalents in Fms-like tyrosine kinase 3 ligand bone marrow cultures. J. Immunol. 2005;174:6592–6597. doi: 10.4049/jimmunol.174.11.6592. [DOI] [PubMed] [Google Scholar]
- 53.Xiao B., Deng X., Zhou W., Tan E.K. Flow Cytometry-Based Assessment of Mitophagy Using MitoTracker. Front. Cell. Neurosci. 2016;10:76. doi: 10.3389/fncel.2016.00076. [DOI] [PMC free article] [PubMed] [Google Scholar]
- 54.Armitage A.E., Lim P.J., Frost J.N., Pasricha S.R., Soilleux E.J., Evans E., Morovat A., Santos A., Diaz R., Biggs D. Induced Disruption of the Iron-Regulatory Hormone Hepcidin Inhibits Acute Inflammatory Hypoferraemia. J. Innate Immun. 2016;8:517–528. doi: 10.1159/000447713. [DOI] [PMC free article] [PubMed] [Google Scholar]
- 55.Buchweitz J.P., Karmaus P.W., Harkema J.R., Williams K.J., Kaminski N.E. Modulation of airway responses to influenza A/PR/8/34 by Delta9-tetrahydrocannabinol in C57BL/6 mice. J. Pharmacol. Exp. Ther. 2007;323:675–683. doi: 10.1124/jpet.107.124719. [DOI] [PubMed] [Google Scholar]
- 56.Efstratiou A., Maple P.A.C. World Health Organization Regional Office for Europe; 1994. Laboratory Diagnosis of Diphtheria. [Google Scholar]
- 57.Hefele L., Syphan S., Xayavong D., Homsana A., Kleine D., Chanthavilay P., Nouanthong P., Xaydalasouk K., Phathammavong O., Billamay S. Seroprotection at Different Levels of the Healthcare System After Routine Vaccination With Diphtheria-Tetanus-Pertussis Whole Cell-Hepatitis B-Haemophilus influenzae Type B in Lao People’s Democratic Republic. Clin. Infect. Dis. 2019;69:2136–2144. doi: 10.1093/cid/ciz143. [DOI] [PMC free article] [PubMed] [Google Scholar]
- 58.World Health Organization Recommendation for the production and control of pneumococcal conjugate vaccines. World Health Organ. Tech. Rep. Ser. 2005;927:64–98. [Google Scholar]
- 59.Chen R.T., Markowitz L.E., Albrecht P., Stewart J.A., Mofenson L.M., Preblud S.R., Orenstein W.A. Measles antibody: reevaluation of protective titers. J. Infect. Dis. 1990;162:1036–1042. doi: 10.1093/infdis/162.5.1036. [DOI] [PubMed] [Google Scholar]
Associated Data
This section collects any data citations, data availability statements, or supplementary materials included in this article.
Supplementary Materials
Data Availability Statement
This project did not generate any new code or novel datasets