

Abstract
Background and Aim:
Sulawesi is an Indonesian island located within the Wallacea region that contains a distinctive mix of Asian and Australasian species. This distinctiveness extends to parasites, including Trypanosoma evansi, the cause of surra. Surra has non-specific clinical signs such as anemia, anorexia, weight loss, drop in milk production, and reproductive disorders which cause economic losses. Due to the trade of livestock, surra has spread in Indonesia from one island to another. The aim of this study was to investigate the trypanosomes infecting cattle in South Sulawesi, using internal transcribed spacer (ITS2) ribosomal DNA (rDNA) sequencing.
Materials and Methods:
A total of 100 whole blood samples were collected from cattle in Makassar, South Sulawesi Province, Indonesia. All samples were tested using conventional parasitological methods (CPT), namely, thin blood smear, buffy coat smears, and polymerase chain reaction (PCR) testing. Positive PCR results were sequenced and phylogenetically analyzed.
Results:
Only one of the 100 samples was found to be positive with microscopic observation; however, PCR analysis revealed that 3% (3/100) of samples were positive. Sequencing identified the positive samples as T. evansi, China isolate (KU552344), with a homology of 99%. Two out of three sequences showed variations in ITS2 region.
Conclusion:
Based on CPT and molecular analysis, T. evansi isolates from infected cattle in South Sulawesi demonstrate genetic diversity of ITS2 sequences.
Keywords: cattle, internal transcribed spacer-2, Sulawesi, Surra, Trypanosoma evansi
Introduction
Surra is a disease caused by Trypanosoma evansi [1], affecting several vertebrate hosts. T. evansi entered Southeast Asia through livestock imported from India [2]. In Indonesia, surra was first reported in 1898. Since then, surra has rapidly spread throughout the Indonesian islands through livestock exchange, and cases of T. evansi infection have been reported in almost all Indonesian regions [3]. Of all known pathogenic trypanosomes, T. evansi has the widest host range, infecting both wildlife and domestic animals [4]. Notably, livestock trading on Sulawesi, the largest island in Wallacea region, had a profound impact on the spread of T. evansi. Sulawesi is a significant biodiversity hotspot, it has the highest number of mammals of which 83 of 132 species (63%) are endemic that support substantial undocumented parasite diversity [5,6]. In addition, Sulawesi’s position between the Asian and Australian continental is home to endemic parasites and likely to be relevant to the biogeography of trypanosomes, such as T. evansi [7,8].
Surra cases recur throughout the year in South Sulawesi and cause livestock mortality, while research on T. evansi in South Sulawesi has not provided sufficient data. The phylogenetic diversity of trypanosome in Sulawesi has been studied in Trypanosoma theileri and Trypanosoma lewisi in murine rodents. T. theileri clade is native to Sulawesi and T. lewisi clade invaded Sulawesi recently [9]. It is important to do the phylogenetic analysis of T. evansi in Sulawesi to differentiate between the native and introduced T. evansi to better understand which changes may be associated with adaptation to the new environment related to the pathogenesis.
In this study, we investigated the species of trypanosomes infecting cattle in South Sulawesi using internal transcribed spacer (ITS2) ribosomal DNA (rDNA) sequence analysis. Our data may inform the implementation of governmental prevention programs to control the spread of surra on Sulawesi Island.
Materials and Methods
Ethical approval
All procedures performed in this study were approved by the Ethical Clearance Committee of the Faculty of Veterinary Medicine, Universitas Gadjah Mada, Indonesia (clearance number 0131/EC-FKH/Int./2019).
Study period, area, and sample collection
This research was conducted for 5 months (October 2019 to February 2020) consisting of pre-research, samples collection and laboratory examination. Blood samples were taken from 100, stochastically chosen adult cattle in two geographically separated areas in Makassar (Figure-1). We obtained samples from Biringkanaya district that surrounded by rice fields and Manggala district that is close to the garbage dump. Blood (5 mL) was collected from each animal into a tube (OneMed, Indonesia) containing the anticoagulant ethylenediaminetetraacetic acid by jugular venipuncture and stored in refrigerated condition (4°C) until arrival at the laboratory. Thin blood smears were prepared from each sample a few seconds after blood collection. Approximately 75 mL of blood was moved into a capillary tube (Brand, Germany) and centrifuged for 5 min at 12,000 g. Next, the buffy coat was dropped onto an object-glass in preparation for buffy coat smears. All smears were dried, methanol-fixed, stained with Giemsa, and microscopically examined under 100× oil immersion.
Figure-1.
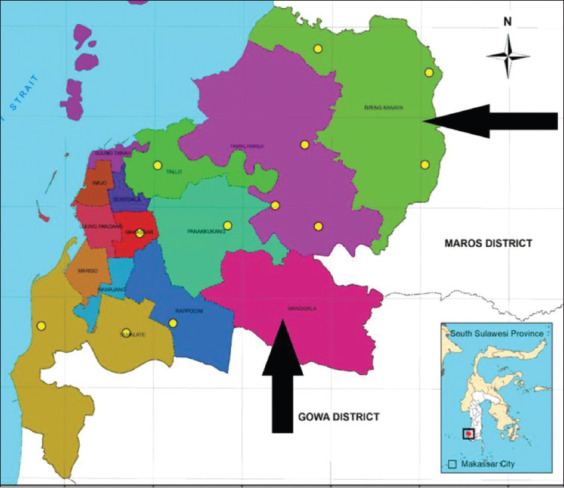
Map of Makassar, South Sulawesi. Location of sampling sites shown in black arrows (Source: Arif et al., [8]).
DNA extraction, polymerase chain reaction (PCR) amplification, and sequence analysis of rDNA ITS2
DNA was extracted from blood samples using the DNeasy® blood DNA extraction kit (Qiagen, USA) following the manufacturer’s instructions; DNA was stored at −20°C until used. Forward (5’-CTC CTC GTG TGG TGC ATA TT-3’) and reverse (5’-GAA GCG TAC ACG AAA GAA GC-3’) primers for PCR amplification were designed based on T. evansi nucleotide sequence (accession number FJ416612) in the GenBank database using the primer3online program (http://bioinfo.ut.ee/primer3-0.4.0). PCR was carried out in a 25 μL reaction volume containing 12.5 μL of master mix (MyTaq™ Mix, Bioline), 5 μL DNA template, 1 μL (10 μmol/L) each of primer, and 5.5 μL ddH2O. The PCR amplification was performed as follows: An initial hold at 94°C for 4 min, then 35 cycles of denaturation at 94°C for 30 s, annealing at 57°C for 30 s, extension at 72°C for 30 s, and a final hold at 72°C for 5 min. PCR products were subjected to electrophoretic separation on 1% agarose gel at 100 volts for 30 min, stained with the FluoroVue™ Nucleic Acid Gel Staining reagent (SMOBIO Technology Inc., Taiwan), and visualized on an ultraviolet transilluminator. The positive samples were sequenced at First Base, Malaysia.
Phylogenetic analysis
Positive PCR sequences were used to query the National Center for Biotechnology Information database using Basic Local Alignment Search Tool (BLAST) for identify sequence matches. Sample sequences were aligned against homologous sequences deposited in GenBank and analyzed using the ClustalW and MEGA (version X) software programs [10]. Phylogenetic trees were constructed based on the sequence data of the ITS2 rDNA regions of the samples and reference GenBank sequences. The analysis was performed using the neighbor-joining method and each branch point was evaluated with 1000 bootstrap replications. Trypanosoma cruzi (AF362827) was used to root the constructed tree.
Results
Morphology and PCR result
One positive sample was found during the microscopic observation of 100 samples, which were assessed using both thin blood and buffy coat smears. Both smears of the positive sample showed the presence of trypanosomes (Figure-2) with the same morphology as described by Desquesnes et al. [11]. PCR analysis using ITS2 primers showed that 3 out of 100 samples (3%) were infected with trypanosome parasites; the 508 bp bands clearly indicated the presence of parasites in positive cattle blood samples (Figure-3).
Figure-2.

Morphology of Trypanosoma evansi: (a) Blood smear and (b) buffy coat smear, stained with Giemsa and observed under light microscopy; 1000× total magnification.
Figure-3.

Polymerase chain reaction detection of Trypanosoma evansi, visualized as a positive band (508 bp) on 1% agarose gel. K(+): Positive control; K(−): Negative control; 1, 2, and 3: Positive samples.
DNA sequence analysis
The ITS2 sample sequences were compared with other sequences from GenBank using BLAST. The positive sample sequences were revealed to share 99% similarity with T. evansi from some countries such as China, the Philippines, Thailand, Taiwan, Indonesia, Egypt, Colombia, and India. The sequences showed 98% similarity to Trypanosoma equiperdum and Trypanosoma brucei brucei and Trypanosoma brucei gambiense.
A subsequent analysis of variation between ITS2 samples and Guangdong China isolate (KU552344) revealed the presence of several mutations in ITS2 samples (Table-1). Categories of mutations were present; two instances of transverse mutation of samples AW4, two instances of transition mutations of samples AW12, one instance of transition mutations, and three instances of transverse mutations of samples AW45.
Table-1.
Nucleotide variations and type of mutations between ITS2 samples and T. evansi from Guangdong China.
| Species | Nucleotide sequence number | ||||||
|---|---|---|---|---|---|---|---|
| 60 | 257 | 318 | 345 | 416 | 456 | 457 | |
| T. evansi Guangdong China | A | G | G | G | A | T | A |
| Trypanosoma_Makassar AW4 | A | G | G | G | A | A | T |
| Trypanosoma_Makassar AW12 | A | A | A | G | C | T | A |
| Trypanosoma_Makassar AW45 | T | A | G | C | C | T | A |
| Type of mutation | TV | TS | TS | TV | TV | TS | TS |
*Description: TV = Transverse mutation; TS = Transition mutation. ITS2= Internal transcribed spacer, T. evansi = Trypanosoma evansi
Phylogenetic analysis
The phylogenetic tree was generated with MEGA (version X) software using alignment data from ClustalW. The ITS2 partial sequences were compared to several intraspecies and interspecies using discontinuous megablast result. The phylogenetic tree (Figure-4) showed that the ITS2 samples AW4 had a short genetic distance to T. evansi Guangdong China (0.4%) and large genetic distance to Leishmania mexicana 56%, respectively (Table-2). The phylogenetic tree inferred from the ITS2 sequences (508 bp) illustrates the genetic diversity of the parasites. It showed that all samples were closely related to T. evansi from Guangdong China (KU552344) but two samples (AW12 and AW45) form a separate clade.
Figure-4.

Trypanosoma evansi phylogenetic tree, based on ITS2 sequences, according to the neighbor-joining method, showing the position of Makassar strains.
Table-2.
Genetic distance of the ITS2 samples compared with intra- and interspecies.
| Species | 1 | 2 | 3 | 4 | 5 | 6 | 7 | 8 | 9 | 10 | 11 | 12 | 13 | 14 | 15 | 16 | 17 | 18 | 19 | 20 |
|---|---|---|---|---|---|---|---|---|---|---|---|---|---|---|---|---|---|---|---|---|
| Trypanosoma_Makassar_Sample_AW4 | ||||||||||||||||||||
| Trypanosoma_Makassar_Sample_AW12 | 0.009 | |||||||||||||||||||
| Trypanosoma_Makassar__Sample_AW45 | 0.011 | 0.007 | ||||||||||||||||||
| Trypanosoma evansi_EF546009_Lopburi_Thailand | 0.011 | 0.011 | 0.013 | |||||||||||||||||
| Trypanosoma brucei gambiense_MT460094_Gabon | 0.033 | 0.033 | 0.035 | 0.031 | ||||||||||||||||
| Trypanosoma equiperdum_LC386051_Mongolia | 0.013 | 0.013 | 0.015 | 0.011 | 0.029 | |||||||||||||||
| Trypanosoma evansi evansi_MK246125_Ngawi_Indonesia | 0.007 | 0.007 | 0.009 | 0.009 | 0.031 | 0.011 | ||||||||||||||
| Trypanosoma evansi_KU552344_Guangdong_China | 0.004 | 0.004 | 0.007 | 0.007 | 0.029 | 0.009 | 0.002 | |||||||||||||
| Trypanosoma evansi evansi_HQ593645_Manila_Philippines | 0.007 | 0.007 | 0.009 | 0.009 | 0.031 | 0.011 | 0.000 | 0.002 | ||||||||||||
| Trypanosoma evansi evansi_DQ472707_Bangkok_Thailand | 0.007 | 0.007 | 0.009 | 0.009 | 0.031 | 0.011 | 0.000 | 0.002 | 0.000 | |||||||||||
| Trypanosoma evansi evansi_D89527_Tansui-Taiwan | 0.007 | 0.007 | 0.009 | 0.004 | 0.027 | 0.007 | 0.004 | 0.002 | 0.004 | 0.004 | ||||||||||
| Trypanosoma evansi_MN446740_Xinjiang_China | 0.007 | 0.007 | 0.009 | 0.004 | 0.027 | 0.007 | 0.004 | 0.002 | 0.004 | 0.004 | 0.000 | |||||||||
| Trypanosoma evansi evansi_AY912272_Bangkok_Thailand | 0.011 | 0.009 | 0.011 | 0.013 | 0.035 | 0.015 | 0.004 | 0.007 | 0.004 | 0.004 | 0.009 | 0.009 | ||||||||
| Trypanosoma evansi evansi_AB551921_Cairo-Egypt | 0.009 | 0.009 | 0.011 | 0.007 | 0.024 | 0.004 | 0.007 | 0.004 | 0.007 | 0.007 | 0.002 | 0.002 | 0.011 | |||||||
| Trypanosoma evansi_FJ416613_Hubei_China | 0.011 | 0.011 | 0.013 | 0.009 | 0.031 | 0.011 | 0.009 | 0.007 | 0.009 | 0.009 | 0.004 | 0.004 | 0.013 | 0.007 | ||||||
| Trypanosoma evansi_KY014244_Antioquia_Colombia | 0.038 | 0.038 | 0.040 | 0.035 | 0.055 | 0.035 | 0.035 | 0.033 | 0.035 | 0.035 | 0.031 | 0.031 | 0.040 | 0.031 | 0.035 | |||||
| Trypanosoma brucei_AF306777_Ivoire_Koudougou | 0.038 | 0.038 | 0.035 | 0.035 | 0.053 | 0.033 | 0.035 | 0.033 | 0.035 | 0.035 | 0.031 | 0.031 | 0.040 | 0.029 | 0.035 | 0.060 | ||||
| Trypanosoma brucei_JN673391_Serengeti_Tanzania | 0.038 | 0.038 | 0.040 | 0.035 | 0.053 | 0.033 | 0.035 | 0.033 | 0.035 | 0.035 | 0.031 | 0.031 | 0.040 | 0.029 | 0.035 | 0.060 | 0.053 | |||
| Trypanosoma evansi_MT225591_Karnataka_India | 0.051 | 0.051 | 0.053 | 0.053 | 0.075 | 0.055 | 0.049 | 0.046 | 0.049 | 0.049 | 0.049 | 0.049 | 0.053 | 0.051 | 0.053 | 0.077 | 0.075 | 0.080 | ||
| Leishmania mexicana_AB558251_Venezuela | 0.562 | 0.560 | 0.558 | 0.558 | 0.560 | 0.558 | 0.558 | 0.560 | 0.558 | 0.558 | 0.560 | 0.560 | 0.555 | 0.558 | 0.562 | 0.564 | 0.558 | 0.558 | 0.577 |
ITS2=Internal transcribed spacer
Discussion
Detection of trypanosome infection is usually performed by microscopic observation of the parasite in a Giemsa-stained blood smear. However, the parasite cannot always be detected by this method, even when animals display clinical symptoms [12]. Further, low-level parasitemia makes it impossible to detect and differentiate the morphology of parasites using Giemsa-stained smears [13]. In this study, only one positive sample (out of 100 total samples) was found through microscopic examination with both blood and buffy coat smears. This is similar to other reports from the literature. For example, Ahmadi et al. [14] detected four positive samples out of 117 blood samples using the Giemsa staining method. Another previous study reported that no positive samples were found out of 113 blood samples screened by microscopic examination, and seven positive samples were obtained by PCR [12]. Our data, taken together with reports from the literature, indicate that while microscopic examination of blood smears is the most commonly used method for the diagnosis of trypanosome infection, it is not suitable for epidemiological studies. Conventional parasitological method (CPT) is specific but not sensitive enough for efficient and widespread screening.
Newer molecular detection methods provide increased sensitivity. Using PCR, we demonstrated that 3 out of 100 samples (3%) were positive for T. evansi. As expected, the PCR method was able to detect a higher number of positive samples than CPT. In fact, other epidemiological studies indicate that PCR detection is more sensitive than hematocrit centrifugation technique [15]. The advantages of PCR as a diagnostic method have been further demonstrated during the chronic phase of trypanosome infection [16]. The sensitivity of this method is high: The threshold of detection is 1-20 parasite/mL of blood [17]. Our data confirm that PCR is the superior diagnostic method for trypanosomiasis.
Nucleotide changes in ITS2 samples as compared to ITS2 of T. evansi from Guangdong China impact on the ribosome biogenesis. ITS2 is a specific site of mutagenesis [18]. ITS2 as a scaffold to mediate topological rearrangement or as a timer to prevent premature folding that is critical in ribosome biogenesis. During this process, the 5.8S-ITS2-25S complex can rapidly fold in which the ITS2 folding could bring 5.8S and 25s pre-rRNA into close vicinity, thus facilitating hybridization [19] so that any sequence change could trigger conformational switches [20]. Mutation of sequence ITS2 samples may lead to the mutation of T. evansi in South Sulawesi. Genetic data, especially rDNA sequences, are critical for phylogenetic analysis, evolutionary process evaluation, and the determination of taxonomic identities of trypanosomes [21]. The ITS region consists of two regions (ITS1 and ITS2) that are located between the repeating array of nuclear 18S, 5.8S, and 28S rRNA genes [22]. Due to these features, the ITS region has been proven to be a useful tool in identifying both intra- and interspecific variability [23].
Many published reports have detailed the utility of ITS2 sequences in the phylogenetic study of trypanosomatids. It has been shown that ITS2 sequences are more useful for performing interspecific comparisons: ITS2 sequences are more variable than the ITS1 and the 5.8S rDNA sequences [24]. Khuchareontaworn et al. [23] also reported that the ITS2 region was informative for characterizing the genetic diversity of water buffalo trypanosomatids (four groups were detected). Similarly, Amer et al. [25] reported that analysis of the ITS region is very useful for elucidating the genetic diversity of T. evansi population of Egyptian camels. In another report, the phylogenetic tree inferred from ITS2 sequences clearly showed the genetic diversity of T. evansi infected camels in Sudan [26]. Genetic variations of sequence ITS2 samples may cause by the adaptation of T. evansi to the new environments, proven by the difference of sequence samples between Biringkanaya district and Manggala district. These data also suggest that T. evansi from Biringkanaya district, which is close to the garbage dump, adapt further to the environment or another possibility is that T. evansi is native to Sulawesi.
This is the first study using ITS2 sequences in the analysis of Sulawesi’s T. evansi isolates. Our data confirm previous observations of T. evansi genetic diversity [23] from two geographically separated areas in Makassar, South Sulawesi. Our phylogenetic and genetic analysis suggests that all sequences of ITS2 samples were most closely related to T. evansi from Guangdong, China but AW12 and AW45 samples that obtained from Manggala district display characteristics indicative of them being clade that is native to Sulawesi. Conversely, AW4 sample obtained from Biringkanaya district displays characteristic indicative of an introduced T. evansi. Notably, transportation of cattle from different islands in Indonesia may have an impact on the heterogeneity and dynamics of T. evansi populations in Sulawesi, Indonesia. The high degree of genetic variability with T. evansi population is most likely related to its capacity for rapid adaptation to different hosts and environments.
Conclusion
Based on the microscopic parasitological methods and genetic analysis, the trypanosomes infecting cattle in Makassar, South Sulawesi, are T. evansi. In addition, phylogenetic analysis using ITS2 sequences identified two branching groups of T. evansi. This report provides preliminary data for studying the genetic diversity and dynamics of T. evansi in Indonesian livestock. This study will provide recommendations for future work to identify the distinct species of T. evansi in Sulawesi.
Authors’ Contributions
AS, WN, and DP conceptualized the research, drafted the manuscript, prepared, and edited the manuscript according to the title. AS, RTB, and DSRS performed the research, analyzed the data, collected the literature, edited the manuscript, and finalized the manuscript. All authors read and approved the final manuscript.
Acknowledgments
This study was supported by the RTA program of Universitas Gadjah Mada, Indonesia, Grant Number 2488/UN.P.III/DIT-LIT/PT/2020.
Competing Interests
The authors declare that they have no competing interests.
Publisher’s Note
Veterinary World remains neutral with regard to jurisdictional claims in published map and institutional affiliation.
References
- 1.Nurcahyo W, Yowi M.R.K, Hartati S, Prastowo J. The prevalence of horse trypanosomiasis in Sumba Island, Indonesia and its detection using card agglutination tests. Vet. World. 2019;12(5):646–652. doi: 10.14202/vetworld.2019.646-652. [DOI] [PMC free article] [PubMed] [Google Scholar]
- 2.Hoare C.A. The Trypanosomes of Mammals, A Zoological Monograph Blackwell Scientific Publications, Oxford. 1972:555–593. [Google Scholar]
- 3.Nurcahyo R.W, Priyowidodo D, Prastowo J. Trypanosoma evansi detection and vector identification in Central Java and Yogyakarta, Indonesia. In: Isnansetyo A, Nuringtyas T, editors. Springer, Cham: Proceeding of the 1s International Conference on Tropical Agriculture; 2017. pp. 549–559. [Google Scholar]
- 4.Nuryady M.M, Widayanti R, Nurcahyo R.W, Fadjrinatha B, Fahrurrozi A.Z.S. Characterization and phylogenetic analysis of multidrug-resistant protein-encoding genes in Trypanosoma evansi isolated from buffaloes in Ngawi district, Indonesia. Vet. World. 2019;12(10):1573–1577. doi: 10.14202/vetworld.2019.1573-1577. [DOI] [PMC free article] [PubMed] [Google Scholar]
- 5.Supriatna J. Wallacea a Living Laboratory of Evolution. Elsevier SciTech Connect. 2017. [Retrieved on 29-06-2020]. Available from: http://www.scitechconnect.elsevier.com/wallacea-living-laboratory-evolution .
- 6.Carlson C.J, Burgio K.R, Dougherty E.R, Phillpis A.J, Bueno V.M, Clements C.F, Castaldo G, Dallas T.A, Cizauskas C.A, Cumming G.S, Dona J, Harris N.C, Jovani R, Mironov S, Muellerklein O.C, Proctor H.C, Getz W.M. Parasite biodiversity faces extinction and redistribution in a changing climate. Sci. Adv. 2017;3(9):e1602422. doi: 10.1126/sciadv.1602422. [DOI] [PMC free article] [PubMed] [Google Scholar]
- 7.Stelbrink B, Albrecht C, Hall R, Rintelen T. The biogeography of Sulawesi revisited:Is there evidence for a vicariant origin of taxa on Wallace's “anomalous island“? Evolution. 2012;66(7):2252–2271. doi: 10.1111/j.1558-5646.2012.01588.x. [DOI] [PubMed] [Google Scholar]
- 8.Astuti A, Giselawati P, Musrizal M. Hazard mapping of subterranean termite attacks in Makassar City, South Sulawesi, Indonesia. Insects. 2019;11(1):31. doi: 10.3390/insects11010031. [DOI] [PMC free article] [PubMed] [Google Scholar]
- 9.Winterhoff M.L, Achmadi A.S, Roycroft E.J, Handika H, Putra R.T.J, Rowe K.M.C, Perkins S.L, Rowe K.C. Native and introduced trypanosome parasites in endemic and introduced murine rodents of Sulawesi. J. Parasitol. 2020;106(5):523–536. doi: 10.1645/19-136. [DOI] [PubMed] [Google Scholar]
- 10.Kumar S, Stecher G, Li M, Knyaz C, Tamura K. MEGA X:Molecular evolutionary genetics analysis across computing platforms. Mol. Biol. Evol. 2018;35(6):1547–1549. doi: 10.1093/molbev/msy096. [DOI] [PMC free article] [PubMed] [Google Scholar]
- 11.Desquesnes M, Dargantes A, Lai D.H, Lun Z.R, Holzmuller P, Jittapalapong S. Trypanosoma evansi and Surra:A review and perspectives on transmission, epidemiology and control, impact, and zoonotic aspects. Biomed. Res. Int. 2013;2013(2013):321237. doi: 10.1155/2013/321237. [DOI] [PMC free article] [PubMed] [Google Scholar]
- 12.Zangooie F, Ganjali M, Keighobadi M, Nabavi R. Molecular detection of Trypanosoma evansi based on ITS1 rDNA gene in Camelus dromedarius in Sistan Region, Iran. Trop. Biomed. 2018;35(4):1140–1147. [PubMed] [Google Scholar]
- 13.Iglesias J.R, Eleizalde M.C, Reyna-Bello A, Mendoza M. Molecular diagnosis of cattle trypanosomes in Venezuela:Evidences of Trypanosoma evansi and Trypanosoma vivax infections. J. Parasit. Dis. 2017;41(2):450–458. doi: 10.1007/s12639-016-0826-x. [DOI] [PMC free article] [PubMed] [Google Scholar]
- 14.Ahmadi H.M, Qazvinian K.H, Darvishi M. Second Veterinary Laboratory Congress. Semnan, Iran: Semnan University; 2012. Investigation of tropianosome evasion contamination and its prevalence in Semnan camels; pp. 22–23. [Google Scholar]
- 15.Herrera H.M, Dávila A.M.R, Norek A, Abreu U.G.P, Souza S.S, Dandrea O.S, Jansen A.M. Enzootiology of Trypanosoma evansi in Pantanal, Brazil. Vet. Parasitol. 2004;125(3-4):263–275. doi: 10.1016/j.vetpar.2004.07.013. [DOI] [PubMed] [Google Scholar]
- 16.Fernández D, González-Baradat B, Eleizalde M.C, González-Marcano E, Perrone T, Mendoza M. Trypanosoma evansi:A comparison of PCR and parasitological diagnostic tests in experimentally infected mice. Exp. Parasitol. 2009;121(1):1–7. doi: 10.1016/j.exppara.2008.09.013. [DOI] [PubMed] [Google Scholar]
- 17.Desquesnes M, Dávila A.M. Applications of PCR-based tools for detection and identification of animal trypanosomes:A review and perspectives. Vet. Parasitol. 2002;109(3-4):213–231. doi: 10.1016/s0304-4017(02)00270-4. [DOI] [PubMed] [Google Scholar]
- 18.Cote C.A, Peculis B.A. Role of the ITS2-proximal stem and evidence for indirect recognition of processing sites in pre-rRNA processing in yeast. Nucleic Acid Res. 2001;29(10):2106–2116. doi: 10.1093/nar/29.10.2106. [DOI] [PMC free article] [PubMed] [Google Scholar]
- 19.Woolford J.L, Baserga S.J. Ribosome biogenesis in the yeast Saccharomyces cerevisiae. Genetics. 2013;195(3):643–681. doi: 10.1534/genetics.113.153197. [DOI] [PMC free article] [PubMed] [Google Scholar]
- 20.Zhang W, Tian W, Gao Z, Wang G, Zhao H. Phylogenetic utility of rRNA ITS2 sequence-structure under functional constraint. Int. J. Mol. Sci. 2020;21(17):6395. doi: 10.3390/ijms21176395. [DOI] [PMC free article] [PubMed] [Google Scholar]
- 21.Sarkhel S.P, Gupta S.K, Kaushik J, Singh J, Gaur D.K, Kumar S, Kumar R. Molecular characterization of internal transcribed spacer 1 (ITS 1) region of different Trypanosoma evansi isolates of India. J. Parasit. Dis. 2017;41(2):527–533. doi: 10.1007/s12639-016-0843-9. [DOI] [PMC free article] [PubMed] [Google Scholar]
- 22.Lodish H, Berk A, Zipursky S.L, Mastsudaira P, Balimore D, Darnell J. 4th ed. New York: W. H. Freeman and Company; 2001. Molecular Cell Biology. [Google Scholar]
- 23.Khuchareontaworn S, Singhaphan P, Viseshakul N, Chansiri K. Genetic diversity of Trypanosoma evansi in buffalo based on internal transcribed spacer (ITS) regions. J. Vet. Med. Sci. 2007;69(5):487–493. doi: 10.1292/jvms.69.487. [DOI] [PubMed] [Google Scholar]
- 24.Beltrame-Botelho I.T, Gaspar-Silva D, Steindel M, Davila A.M, Grisard E.C. Internal transcribed spacers (ITS) of Trypanosoma rangeli ribosomal DNA (rDNA):A useful marker for inter-specific differentiation. Infect. Genet. Evol. 2005;5(1):17–28. doi: 10.1016/j.meegid.2004.05.007. [DOI] [PubMed] [Google Scholar]
- 25.Amer S, Ryu O, Tada C, Fukuda Y, Inoue N, Nakai Y. Molecular identification and phylogenetic analysis of Trypanosoma evansi from dromedary camels (Camelus dromedarius) in Egypt, a pilot study. Acta Trop. 2011;117(1):39–46. doi: 10.1016/j.actatropica.2010.09.010. [DOI] [PubMed] [Google Scholar]
- 26.Croof H.I.M.N, Malelle I, Nyingilili H.S, Sadeq S, Brooks D, Ali N. Phylogenetic analysis of Trypanosoma evansi in naturally infected camels from Sudan based on ribosomal DNA sequences. Am. J. Microbiol. Biotechnol. 2017;4(6):75–82. [Google Scholar]