

Abstract
Significance.
High-contrast acuity in individuals with infantile nystagmus syndrome (INS) is poorer than expected from their ongoing retinal image motion, indicating a sensory loss. Conversely, acuity for larger, low-contrast letters in these observers may be limited by image motion alone.
Purpose.
The aim of this study was to assess visual acuity for letters of different contrast in normal observers and individuals with idiopathic INS under conditions of comparable retinal image motion.
Methods.
Visual acuity was measured using projected Landolt-C charts in 3 normal observers and 11 observers with presumed idiopathic INS. Normal observers viewed each chart after reflection from a front-surface mirror that underwent continuous 4 Hz ramp motion with amplitudes ranging from 4 to 9.6 deg and simulated foveation durations of 20 to 80 ms. Observers with INS viewed the charts directly. By reciprocally varying the luminance of the projected charts and a superimposed veiling source, Landolt Cs were presented on a background luminance of 43 cd/m2 with Weber contrasts between −12 and −89%.
Results.
Whereas normal observers’ high-contrast acuity during imposed image motion depends only on the duration of the simulated foveation periods, acuity for low-contrast optotypes also worsens systematically as motion intensity (frequency × amplitude) increases. For comparable parameters of retinal image motion, high contrast acuity in all but one of the observers with INS was poorer than in normal observers. On the other hand, low-contrast acuity in the two groups of observers was similar when the retinal image motion was comparable.
Conclusions.
Reduced high-contrast acuity in observers with INS appears to be attributable primarily to a sensory deficit. On the other hand, the reduction of low-contrast acuity in observers with INS may be accounted for on the basis of retinal image motion.
The incessant retinal image velocity that occurs as a result of the eye movements in individuals with infantile nystagmus syndrome is associated with an impairment of high-contrast visual acuity (e.g.,1–3). Of the several parameters that are used to describe the nystagmus wave form, visual acuity is associated most closely with the duration of foveation periods, the brief intervals during which the target of interest is imaged at low velocity on or near the fovea.4–8 Similar results have been reported when normal observers view high-contrast acuity targets during retinal image motion simulating that in individuals with infantile nystagmus syndrome.9–11 However, when the characteristics of retinal image motion are comparable, visual acuity typically is better in normal observers than in observers with idiopathic infantile nystagmus syndrome, i.e., individuals whose nystagmus is not associated with any other observable visual-system abnormality.12–14
Visual acuity is sometimes measured using low as well as high contrast letters, to provide a measure of performance for targets larger than the high-contrast resolution threshold.15–17 Although visual acuity has been determined for low contrast targets in patients with infantile nystagmus syndrome,18–19 the influence of the parameters of nystagmus has not been explored. The goals of the present study were to compare the influence of various parameters of retinal image motion on the visual acuity of normal observers for targets of different contrast and to compare these results to the measured visual acuity for targets of different contrast in a sample of observers with idiopathic infantile nystagmus syndrome.
METHODS
Observers and Psychophysical Procedures
Letter acuity was measured at a distance of 3.85 m using projected Landolt-C charts in three young-adult normal observers and 11 adolescent and adult observers with presumed idiopathic infantile nystagmus syndrome (7 males, 4 females). Prior to participation in the study, all observers with infantile nystagmus syndrome underwent a full optometric examination, with dilation, performed either by a faculty member at University of Houston University Eye Institute or by the referring extramural optometrist. A diagnosis of idiopathic infantile nystagmus syndrome was made on the basis of this examination as well as the reported family history. Electrophysiological testing, OCT, and genetic testing were not conducted.
Each acuity chart contained 8 four-position Landolt Cs (Although observers with infantile nystagmus syndrome exhibit poorer resolution for vertical compared to horizontal grating stimuli,20–22 little or no acuity difference was reported for Landolt Cs with vertically vs. horizontally oriented gaps.18,23), embedded within an array of 17 equally-spaced tumbling Es that maintained a uniform separation of one letter width between adjacent targets.24 Dark Landolt Cs and tumbling Es were presented on a lighter background with a Weber contrast ([Ltarget – Lbackground] / Lbackground) of −12, −19, −46 or −89%, produced by varying the relative luminance of the projected charts and a superimposed veiling luminance produced by a second projector. Corresponding Michelson contrasts range from 6 to 80%. The luminances of the chart and the veiling stimulus were varied using combinations of neutral density filters in front of each projector, chosen to maintain a constant background luminance of 43 cd/sq m. Between measures of acuity, the order of the Landolt Cs on each chart was varied by changing the orientation of the slides in the projector. LogMAR acuity thresholds corresponding to 62.5% (equal to 50% correct after being adjusted for guessing) were determined using probit analysis from the values of percent correct that were obtained for a range of letter sizes.
Normal observers viewed the acuity charts monocularly after reflection from a first-surface galvanometer-mounted mirror that oscillated horizontally with a ramp waveform to simulate jerk nystagmus.9–11,25 The frequency of ramp motion was 4 Hz and the amplitude was 4, 6.7, 9.5 or 12.6 deg, producing motion intensities (frequency × amplitude) of 16, 26.8, 38, and 50.4 deg/s. Each cycle of the ramp wave form included a zero-velocity, simulated foveation period that, within one set of acuity measurements was equal to 20, 30, 40, 50 or 80 ms. We verified in our previous studies that normal observers are unable to track these target motions9–10 and instructed our observers to fixate at one end of the target’s excursion. Viewing was binocular in the observers with infantile nystagmus syndrome, who viewed the acuity targets directly without an interposed mirror. Because binocular visual acuity for both high and low contrast targets is only a few percent better than monocular acuity,26 the use of two eyes by the observers with infantile nystagmus syndrome vs. one eye of the normal observers was not expected to have any appreciable influence on the experimental outcome. For both the normal observers and the observers with infantile nystagmus syndrome, a head rest minimized head movements and ensured that gaze was maintained in or very near the primary position. The viewing duration of the acuity stimuli was unlimited. For observers who required refractive correction, the acuity charts were viewed using their optimal distance spectacle or contact lens correction. Experimental procedures were reviewed by the University of Houston Committee for the Protection of Human Subjects and written informed consent was obtained from all of the observers or their parents/guardians before participation in the study.
Eye Movement Recording and Analyses
Recordings of the horizontal positions of both eyes were recorded for the observers with infantile nystagmus syndrome during binocular fixation in straight-ahead gaze using a Biometrics model 200 Eye Movement Monitor. Recordings typically lasted for several minutes, which allowed each observer’s predominant nystagmus wave form to be identified. We did not attempt to determine how the characteristics of the observers’ nystagmus varied with the direction of gaze or map the observers’ null zones. The average amplitude and frequency of nystagmus and the average duration of foveation periods were determined from representative segments of the recording with a duration of approximately 10 s, while the observer fixated a small laser spot at a distance of 3.75 m in straight-ahead gaze. Pertinent characteristics of the 11 observers with infantile nystagmus syndrome are summarized in Table 1.
Table 1.
Characteristics of Observers with Infantile Nystagmus Syndrome during Binocular Viewing in Straight-ahead Gaze.
| Observer | Waveform Error | Amplitude (deg) |
Frequency (Hz) |
Foveation Duration (ms) |
Nystagmus Intensity (deg/s) |
Visual Acuity (logMAR) |
Refractive Error |
|---|---|---|---|---|---|---|---|
| GE (m) | pseudocycloid | 3.8 | 3.2 | 44 | 12.2 | 0.338 | +0.50–6.50×020 |
| +0.50–4.75×165 | |||||||
| MSG (f) | PAN | 8.4 | 4.5 | 62 | 37.8 | 0.141 | −3.00–2.75×019 |
| −3.75–2.50×010 | |||||||
| AJ (f) | jerk left | 7.7 | 6.0 | 80 | 46.2 | 0.159 | −3.00–1.75×005 |
| −3.00–1.00×003 | |||||||
| CNU (m) | pendular with foveating saccades | 4.7 | 2.8 | 60 | 13.2 | 0.114 | +0.25–0.50×080 |
| +0.25 sphere | |||||||
| DV (m) | PAN | 9.1 | 4.6 | 40 | 41.9 | 0.392 | −0.75–2.50×009 |
| plano-3.50×015 | |||||||
| FR (m) | pendular | 10.8 | 3.0 | 36 | 32.4 | 0.803 | +3.50–4.00×180 |
| +2.75–3.50×168 | |||||||
| SME (m) | pendular with foveating saccades | 4.2 | 2.4 | 76 | 10.1 | 0.102 | −0.25–3.00×012 |
| −1.50–2.00×170 | |||||||
| SMA (m) | PAN | 15.3 | 3.3 | 40 | 50.5 | 0.480 | −0.75 sphere |
| −0.75–0.50×085 | |||||||
| JH (f) | jerk left | 3.0 | 3.0 | 120 | 9.0 | −0.195 | plano |
| plano | |||||||
| CNI (f) | jerk left | 5.0 | 3.0 | 112 | 15.0 | 0.292 | −4.00–2.25×020 |
| −4.75–1.50×010 | |||||||
| MIS (m) | bi-directional jerk | 4.6 | 1.8 | 71 | 8.3 | 0.315 | +3.25–2.75×170 |
| +3.25–2.50×005 |
m = male; f = female; PAN = periodic alternating nystagmus
RESULTS
Imposed Image Motion in Normal Observers
Figure 1 plots the average logMAR acuities of the normal observers as a function of the intensity of the simulated infantile-nystagmus motion, with a separate panel for each of the 4 letter contrasts. In each panel, the average logMAR acuity in the absence of imposed motion is specified by the isolated square symbol on the vertical axis. For each value of letter contrast, it is clear that logMAR acuity worsens systematically as the duration of the simulated foveation period is reduced from 80 to 20 ms. For letters of high (−89%) contrast, the visual acuity measured for each simulated foveation duration is essentially unaffected by the intensity of the imposed image motion (Figure 1, lower right). This outcome is in agreement with results reported previously by Currie et al.9 and Chung & Bedell.10 On the other hand, when the letter contrast is −46% or lower an increase in the intensity of motion produces a deleterious effect on logMAR acuity. For a letter contrast of −46%, logMAR acuity worsens only when the simulated foveation duration is brief, i.e., between 20 and 40 ms (Figure 1, upper right). For letter contrasts of −19% and −12%, logMAR acuity worsens systematically for all 5 of the simulated foveation durations tested (Figure 1, left panels). A comparison of the slopes of the logMAR-vs.-intensity functions in the four panels indicates that the influence of intensity on acuity increases systematically as either the simulated foveation duration or contrast of the letters is reduced. A final observation to be made from Figure 1 is that the difference between the logMAR acuity without imposed image motion and during image motion with the longest (80 ms) simulated foveation duration increases from less than 0.1 logMAR for letters with −89% and −46% contrast to approximately 0.25 logMAR when the letter contrast is reduced to −12%. This outcome implies that a substantially longer simulated foveation duration would be required to achieve the optimal value of logMAR acuity for low- compared to high-contrast letters. Chung & Bedell25 reported a similar result when logMAR acuity was measured during imposed retinal image motion for targets of low compared to high luminance.
Figure 1.
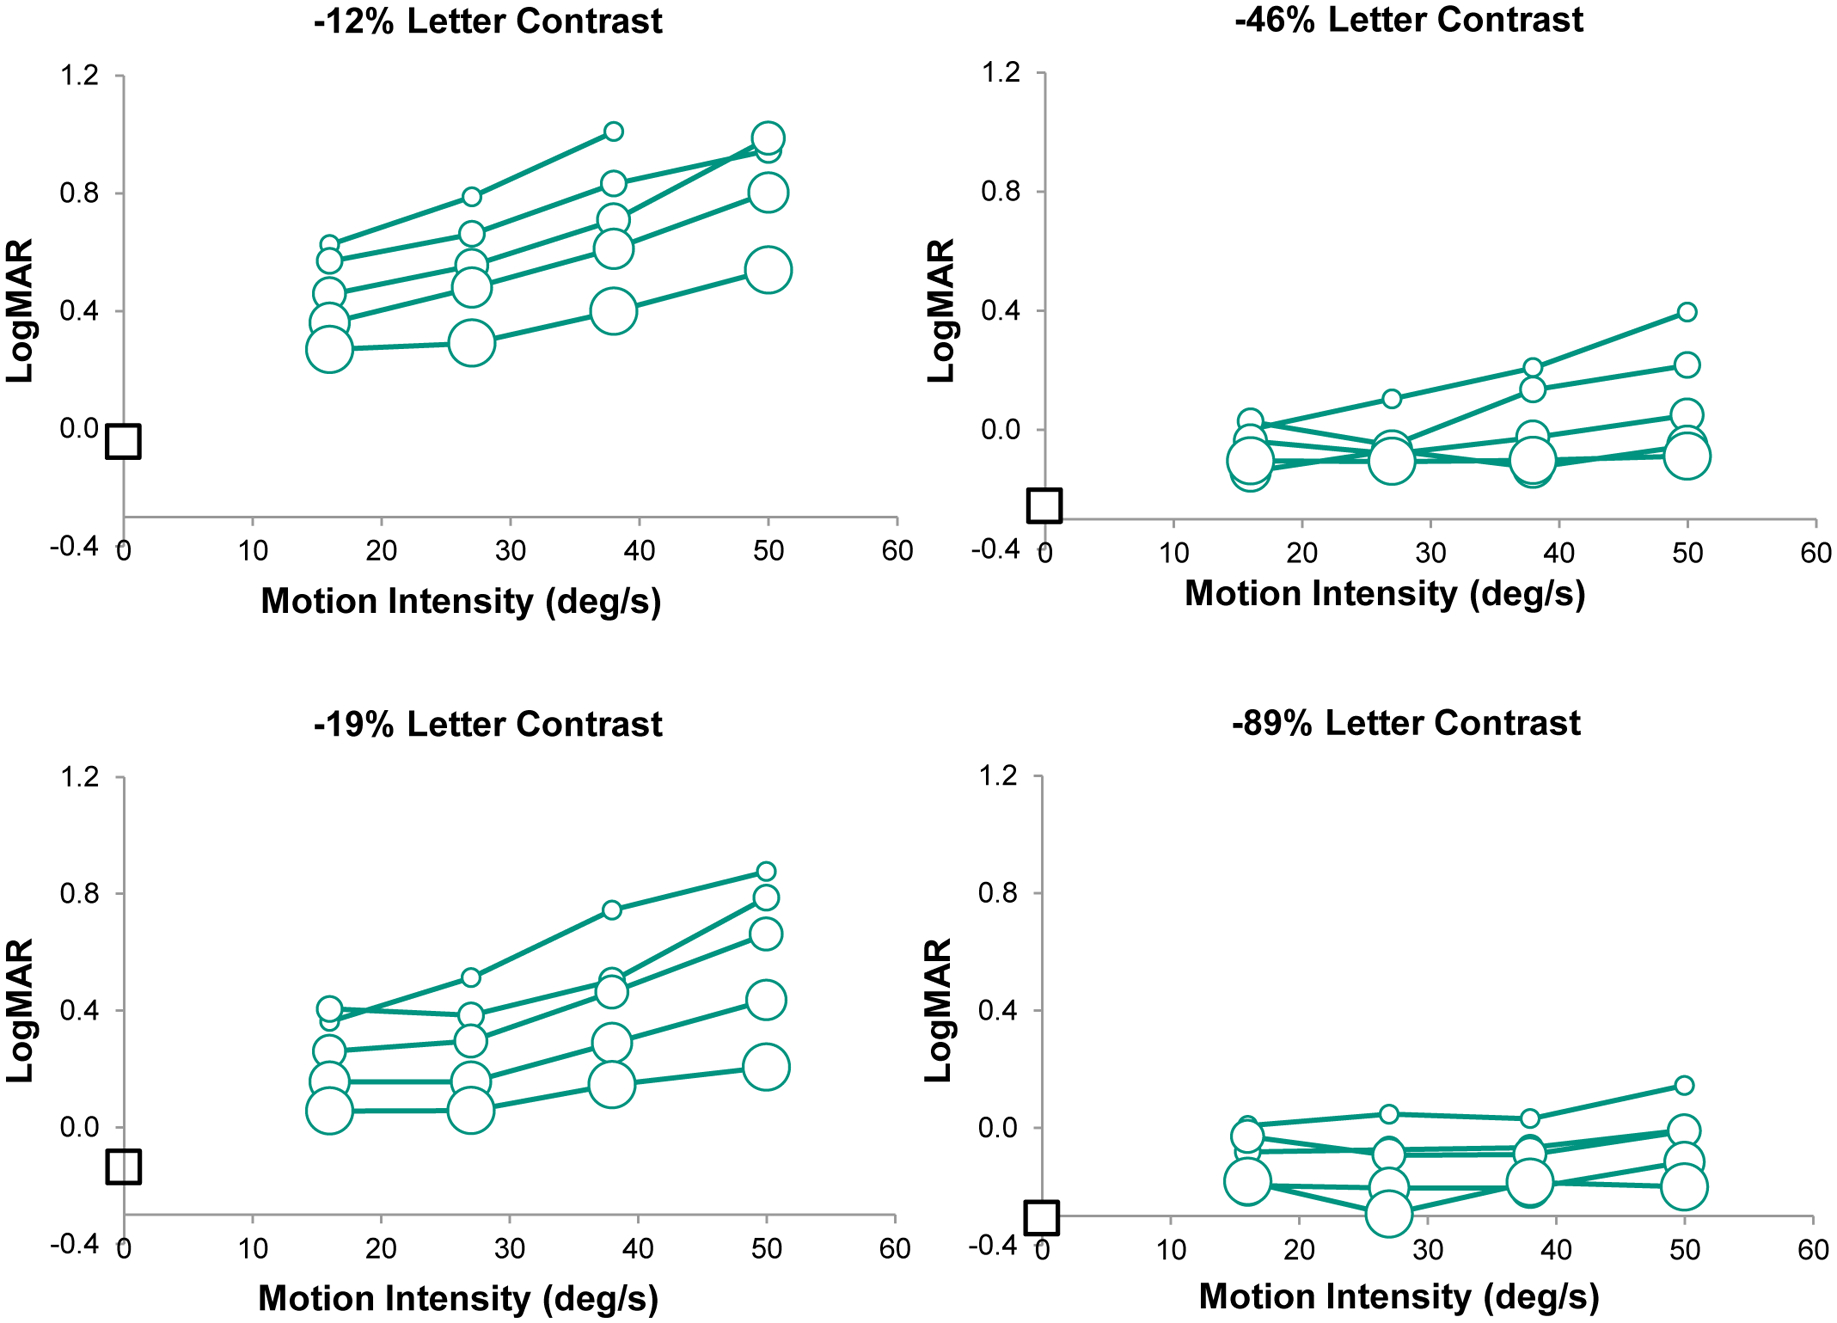
Average LogMAR visual acuity of 3 normal observers is plotted against the intensity of imposed image motion for 4 contrasts of the Landolt C targets. Data for the different target contrasts are shown in separate panels. Within each panel, results are shown for 5 simulated foveation durations (20, 30, 40, 50 and 80 ms), indicated by symbols of increasing size. LogMAR acuity in the absence of imposed motion is represented by the square symbol on the left hand axis of each plot. To prevent clutter, error bars are not included. The mean standard error across all conditions is 0.05 logMAR.
The joint influences of letter contrast and the simulated foveation duration on logMAR acuity can be clarified by defining a variable that we will designate the temporally integrated contrast (TIC):
Essentially, TIC reflects the summation across time of the letter contrast that is available during a simulated foveation period. Figure 2 plots the normal observers’ average logMAR acuity vs. log(TIC) for the 4 intensities of imposed image motion. For values of log(TIC) greater than approximately 1.25 (corresponding, e.g., to letters of 90% contrast and a 20 ms simulated foveation duration), the data for the different intensities of motion collapse to a single line with a slope of −0.31. For values of log(TIC) less than approximately 1.25, the results for the different intensities of imposed image motion diverge. Specifically, the slopes of the best fitting lines decrease progressively from a value of −1.27 for a motion intensity of 50.4 deg/s to a value of −0.75 for a motion intensity of 16 deg/s.
Figure 2.

Average logMAR visual acuity of 3 normal observers is plotted against the log of the temporally integrated contrast (TIC), defined as the target contrast × the simulated foveation duration. The plot includes data for all of the conditions of imposed motion shown in Figure 1. Different intensities of imposed motion are represented by different unfilled symbols: 16 deg/s = triangles; 26.8 deg/s = diamonds; 38 deg/s = squares; 50.4 deg/s = circles. Straight lines fit to the data for each intensity of motion for log(TIC) < 1.25 show a systematic increase in (negative) slope: 16 deg/s = −0.755; 26.8 deg/s = −0.951; 38 deg/s = −1.128; 50.4 deg/s = −1.272, with coefficients of determination (r2) between 0.86 and 0.96. The solid black line fit to the logMAR data for all intensities of motion for log(TIC) > 1.25 has a slope of −0.311, with a coefficient of determination equal to 0.574. Average normal data for the condition with no imposed motion are indicated by filled black triangles and are described by the dashed line with slope = −0.301 (r2 = 0.97). The data points for the no-motion condition are placed on the log(TIC) axis assuming that visual-target information is integrated for a duration of 116 ms (see text).
As noted, the change in logMAR acuity is independent of the velocity of the simulated infantile-nystagmus slow phases for values of log(TIC) greater than 1.25. Further, these results are essentially parallel to the change in logMAR with log contrast for stationary stimuli (Figure 2). In the Figure, the normal observers’ data for the no-motion condition are plotted on the horizontal log(TIC) axis by assuming that the duration of temporal integration is equal to ~120 ms (25 and Figure 4, below). For this assumed duration of temporal integration, the visual acuity for stationary targets at each letter contrast is approximately 0.1 logMAR better than the acuity values measured in high-log(TIC) conditions with imposed retinal image.
Figure 4.

LogMAR acuities of the normal observers (unfilled triangles) and individuals with INS (filled circles) are presented as a function of the simulated/measured foveation duration. The top and bottom panels show results for acuity targets of −89 and −12% contrast, respectively. In each panel, the solid line represents an exponential of the form logMAR = a + b × exp(−c × Duration) that bests fit the normal data. Fitted parameters are a = −0.308, b = 0.600, and c = −0.0259) in the top panel and a = −0.045, b = 1.123, and c = −0.0121 in the bottom panel. Time constants of the fitted exponential curves are −1/c, corresponding to 38.6 ms in the top panel and 83.0 ms in the bottom panel.
Letter Contrast Sensitivity Function in Observers with Infantile Nystagmus Syndrome
Figure 3 plots the logMAR acuity of the observers with infantile nystagmus syndrome as a function of letter contrast. The data for observers with similar intensities of nystagmus are presented in separate panels. The results of the observers with infantile nystagmus syndrome are superimposed on the average results of the 3 normal observers, obtained for a range of simulated foveation durations. No results are presented for an intensity of motion equal to 26.8 deg/s because none of the observers with infantile nystagmus syndrome had a similar intensity of nystagmus. In each panel, it is apparent that increasing letter contrast results in a smaller change in logMAR acuity in the observers with infantile nystagmus syndrome compared to the normal observers. For example, when the intensity of imposed image motion is 38 deg/s, an increase in letter contrast from 12% to 89% results in a 0.6 to 1.0 log unit improvement in the normal observers’ logMAR acuity, depending on the duration of the simulated foveation periods. For the same increase in letter contrast, the acuity of the three observers with comparable intensities of nystagmus (range = 32.4 – 41.9 deg/s) improves only by 0.2 log units. In addition, with the exception of observer JH, whose data appear in the topmost panel of Figure 3, the logMAR acuities of the observers with infantile nystagmus syndrome for high contrast letters are poorer than those achieved by the normal observers during comparable retinal image motion. On the other hand, the logMAR acuities of the observers with infantile nystagmus syndrome are similar to the normal observers for the low contrast targets.
Figure 3.

LogMAR visual acuity for 11 observers with INS is plotted against the absolute value of Landolt-C contrast on a logarithmically scaled axis. The data for different observers with INS are superimposed on the average results of the 3 normal observers, in separate panels corresponding to different intensities of imposed motion: 16 (top panel), 26.8 (middle panel) and 50.4 deg/s (bottom panel). The data for each observer with INS (connected by heavy solid lines) are located on the panel that contains data from normal observers with the most similar intensity of image motion. Normal data are shown as thin dashed lines of different color to represent different simulated foveation durations: 20 ms (purple), 30 ms (blue), 40 ms (blue green), 50 ms (orange) and 80 ms (dark red). The results of the observers with INS are color coded similarly, according to the mean duration of their foveation periods. The symbols for the different observers are: (top panel) GE: blue green circles, CNU: orange triangles, MIS: red squares, SME: red triangles, CNI: red diamonds, JH: red circles; (middle panel) FR: blue green triangles, DV: blue green diamonds, MSG: orange circles; (bottom panel) SMA: blue green diamonds, AJ: red circles. The dashed black line near the bottom of each panel shows average normal results in the absence of imposed image motion.
These observations are emphasized in Figure 4, in which the upper and lower panels depict logMAR acuity as a function of the foveation duration for letters with −89% and −12% contrast, respectively. With one exception (observer JH), the high-contrast data for the observers with infantile nystagmus syndrome lie substantially above the normal results in the upper panel, representing poorer acuities. On the other hand, the low-contrast data for normal observers and observers with infantile nystagmus syndrome are intermingled in the lower panel. It should be noted that the greater variability in the results of the normal observers for low- compared to high-contrast letters in Figure 4 reflects primarily the variation in logMAR acuity with motion intensity that is evident in the low-contrast condition (e.g., Figure 1).
In Figure 4, the time constants of the exponential functions that best fit the results of the normal observers is 38.6±6.9 ms for letters with −89% contrast and 83.0±14.2 ms for letters with −12% contrast. For letters of −46% contrast, the best fitting exponential time constant is 34.5±5.5 ms, which is similar to that found for letters of −89% contrast. For letters of −19% contrast, the best fitting time constant is 52.2±8.0 ms, which is intermediate between the time constants fit to the results for letters of −46% and −12% contrast.
DISCUSSION
Retinal image motion simulating that in individuals with infantile nystagmus syndrome results in a degradation of both high- and low-contrast visual acuity in normal observers. As reported previously by Currie et al.,9 visual acuity for high contrast targets depends on the duration of simulated foveation periods and is essentially independent of the intensity of the imposed retinal image motion within the range studied, i.e., from 16 to 50 deg/s. On the other hand, the acuity for low-contrast targets worsens systematically as the duration of simulated foveation periods is reduced and also as the intensity of the imposed retinal image motion increases. These relationships are summarized in Figure 2, above, which plots the logMAR acuity of our normal observers as a function of the temporally-integrated contrast (TIC). For values of log(TIC) less than approximately 1.25, logMAR worsens rapidly as log(TIC) becomes lower, more so for high compared to low intensities of imposed retinal image motion. On the other hand, visual acuity improves more gradually for values of log(TIC) greater than approximately 1.25, independently of the intensity of imposed image motion.
Chung et al.11 compared the visual acuity of normal observers in two viewing conditions. During the “whole waveform” condition, high-contrast acuity targets were presented during image motion simulating that in individuals with infantile nystagmus syndrome, as in the current investigation. In the “foveation only” condition, stationary high-contrast targets were exposed intermittently, corresponding to the timing of the foveation periods in a simulated nystagmus waveform. Visual acuity was consistently about 0.1 logMAR better in the “foveation only” condition, indicating that image motion during the non-foveation periods of simulated infantile nystagmus syndrome waveforms contributes to a reduction of visual acuity. Chung et al.11 concluded that acuity is reduced because information from the clear image during simulated foveation periods is integrated, at least partially, with the smeared image during simulated non-foveating periods. In Figure 2, above, the difference between the visual acuity measured with and without imposed retinal image motion for values of log(TIC) larger than approximately 1.25 is approximately 0.1 log MAR, corresponding to the difference between the “whole waveform” and “foveation only” conditions of Chung et al.11 For values of log(TIC) less than 1.25, the more rapid degradation of logMAR acuity for high compared to low intensities of imposed image motion may reflect the integration of greater amounts of motion smear during rapid retinal image motion.
Our study sought to evaluate the effects of comparable retinal image motion on visual acuity for targets of different contrast in normal observers and individuals with infantile nystagmus syndrome. An important question is whether imposed retinal image motion and the image motion produced by the eye movements of observers with infantile nystagmus syndrome have the same influence on visual functions such as acuity. As noted by many authors, observers with infantile nystagmus syndrome typically do not report oscillopsia.27–29 In contrast, when a target undergoes imposed repetitive motion, normal observers perceive the target to oscillate. In addition, whereas normal observers perceive targets in rapid motion to be smeared,30–32 observers with infantile nystagmus syndrome perceive a much smaller extent of motion smear than would be expected from their ongoing eye movements.32–33 Nevertheless, the results presented in Figures 3 and 4 show clearly that visual acuity for high-contrast targets is uniformly better in the normal observers than observers with infantile nystagmus syndrome, suggesting that neither the normal observers’ perception of oscillopsia nor their greater extent of perceived motion smear is associated with a substantial reduction of visual acuity. Additional support for this conclusion comes from comparing spatial-bisection acuity in observers with infantile nystagmus syndrome and individuals with normal vision during comparable retinal image motion.34 Similar to the results reported here, the observers with infantile nystagmus syndrome exhibit poorer spatial bisection thresholds than the normal observers, especially for closely spaced targets.
Several previous studies examined how the visual acuity of normal observers changes with contrast for stationary targets.15–16,35–41 The results of some,15,35–36,39–40 but not all of these studies16,37–38,41 are consistent with the two-branched function shown in Figure 2, indicating a rapid improvement in logMAR acuity for a range of low values of log contrast followed by more gradual improvement at higher log-contrast values. For example, Liou & Brennan40 measured visual acuity using Bailey-Lovie charts with seven levels of Michelson contrast, ranging from 5 to 80% (equivalent Weber contrasts = −9.5 to −90%). For the lowest two or three contrast levels, logMAR acuity improved with log contrast according to a slope of approximately −1.26, similar to the results we obtained with an intensity of imposed retinal image motion of 50 deg/s. For Weber contrasts greater than −20 to −25%, the improvement of logMAR acuity with log contrast had a much shallower slope, on the order of −0.37. Other studies reported either steeper39 or shallower slopes15,35–36 for one or both branches of the logMAR vs. log contrast relationship. Because similar experimental methods were employed in all of the above studies, the reason for the wide variations in slope is not immediately apparent.
Similar two-branched functions were reported to describe the change in log contrast sensitivity with log exposure duration, both for foveally presented bright spots42–43 and for middle- and high-spatial frequency grating targets.44–47 The steeper slope for stimuli of short duration is attributed to the temporal integration of contrast and the shallower slope for stimuli of longer duration is ascribed to probability summation.44,46–47
As shown in Figure 4, the duration of the simulated foveation period that is required to achieve optimal logMAR acuity in normal observers increases as the contrast of the letter targets is reduced, indicating a prolongation of the temporal integration period for low contrast letters. The estimated durations of temporal summation calculated from the time constants in Fig 4 (assuming that temporal summation comprises 3 time constants) range from 116 ms for letters of −89% contrast, in agreement with earlier estimates,10 to 249 ms for letters of −12% contrast. Previously, Chung & Bedell25 found that the time constants fit to plots of logMAR vs. the simulated foveation duration increase systematically from 46 to 126 ms (corresponding to estimated temporal summation periods of 138 to 378 ms) as the luminance of the acuity targets decreases from 50 to 0.005 cd/m2.
Poorer visual acuity in individuals with infantile nystagmus syndrome compared to normal observers when viewing high-contrast targets under comparable conditions of retinal image motion is consistent with previous reports.9,12–13 However, the results of the present study indicate that this difference is virtually eliminated for low-contrast acuity targets. Because low-contrast targets are necessarily larger than high-contrast targets at the acuity threshold, this observation is consistent qualitatively with findings that deficits of grating contrast sensitivity in observers with infantile nystagmus syndrome, when present, affect primarily high spatial frequency stimuli.21,48–51 Essentially, our results suggest that the relatively small reduction in low-contrast visual acuity in observers with infantile nystagmus syndrome compared to normal observers may be accounted for by the retinal image motion associated with nystagmus. Similar to the results reported here, low-contrast visual acuity is less degraded in individuals with amblyopia than high-contrast acuity.52–55
The overlapping acuities of normal observers and individuals with infantile nystagmus syndrome in the lower panel of Figure 4 appear to conflict with results reported by Pascal & Abadi,18 who found that individuals with idiopathic infantile nystagmus syndrome exhibit approximately the same logMAR acuity deficit, compared to normal observers, at all 3 levels of letter contrast that they tested. However, in the current study we compared the visual acuity of individuals with nystagmus and normal observers in the presence of similar retinal image motion, whereas Pascal & Abadi18 did not. Inspection of the different panels of our Figure 1 indicates that imposed image motion exerts a substantially more deleterious effect on low- compared to high-contrast visual acuity in normal observers. We suggest that the absence of retinal image motion in the normal observers tested by Pascal and Abadi18 accounts for their better low contrast visual acuity compared to individuals with infantile nystagmus syndrome. A comparison of the normal data obtained in the current study in the absence of imposed image motion to that of the observers with infantile nystagmus syndrome (Figure 3) is consistent with this suggestion.
Previously, Chung & Bedell25 compared visual acuity in individuals with infantile nystagmus syndrome and in normal observers during comparable retinal-image motion for a 4-log-unit range of target luminances. Like the results presented here for targets of high vs. low contrast, most of the observers with infantile nystagmus syndrome exhibited a smaller change in LogMAR acuity compared to the normal observers as luminance decreases. Indeed, at the lowest two luminances tested, corresponding to dim mesopic and scotopic light levels, most of the observers with infantile nystagmus syndrome exhibited marginally better LogMAR acuity than the normal observers. Visual acuity deficits associated with amblyopia also are smaller at low compared to high luminance, when the threshold acuity targets are necessarily larger.56–59
We conclude that a neural sensitivity loss is primarily responsible for the decreased visual acuity for high-contrast letters in most individuals with infantile nystagmus syndrome. This loss of neural sensitivity may be attributed to a combination of meridional amblyopia that results from early uncorrected astigmatism20,60–61 and “motion amblyopia.”62–63 Previously, Dunn et al.22 reported that resolution thresholds of observers with infantile nystagmus syndrome do not differ significantly for constantly viewed vs. strobed vertical square-wave gratings and concluded that the retinal image motion produced by nystagmus does not limit these observers’ visual acuity (on the other hand some clinical studies, but not all, reported that a treatment-related reduction of nystagmus intensity and/or an increase in the duration of foveation periods is associated with improved visual acuity.3,64–66). Under the conditions of retinal image motion investigated in this study, visual acuity for low-contrast letters is similar in individuals with infantile nystagmus syndrome and normal observers. Although individuals with infantile nystagmus syndrome still exhibit a visual-acuity deficit for low-contrast letters, we suggest that this deficit is attributable primarily to the retinal image motion that results from their involuntary eye movements.
ACKNOWLEDGMENTS
The authors thank Dr. Susana Chung for helpful comments. Portions of the results were presented at the 1991 meeting of the American Academy of Optometry and the 1993 ARVO meeting.
This research was supported in part by Research Grant R01 EY 05068 and Training Grant T35 EY 07088 from the National Eye Institute.
REFERENCES
- 1.Abadi RV, Bjerre A. Motor and Sensory Characteristics of Infantile Nystagmus. Br J Ophthalmol 2002;86:1152–60. [DOI] [PMC free article] [PubMed] [Google Scholar]
- 2.Hanson KS, Bedell HE, White JM, Ukwade MT. Distance and Near Visual Acuity in Infantile Nystagmus. Optom Vis Sci 2006;83:823–9. [DOI] [PubMed] [Google Scholar]
- 3.McLean R, Proudlock F, Thomas S, Degg C. et al. Congenital Nystagmus: Randomized, Controlled, Double-masked Trial of Memantine/Gabapentin. Ann Neurol 2007:61:130–8. [DOI] [PubMed] [Google Scholar]
- 4.Dell’Osso LF, Daroff RB. Congenital Nystagmus Waveforms and Foveation Strategy. Doc Ophthalmol 1975;39:155–82. [DOI] [PubMed] [Google Scholar]
- 5.Abadi RV, Worfolk R. Retinal Slip Velocities in Congenital Nystagmus. Vision Res 1989;29:195–205. [DOI] [PubMed] [Google Scholar]
- 6.Sheth NV, Dell’Osso LF, Leigh RJ, van Doren CL et al. The Effects of Afferent Stimulation on Congenital Nystagmus Foveation Periods. Vision Res 1995;35:2371–82. [DOI] [PubMed] [Google Scholar]
- 7.Cesarelli M, Bifulco P, Loffredo L, Bracale M. Relationship between Visual Acuity and Eye Position Variability during Foveations in Congenital Nystagmus. Doc Ophthalmol 2000;101:59–72. [DOI] [PubMed] [Google Scholar]
- 8.Felius J, Fu VL, Birch EE, et al. Quantifying Nystagmus in Infants and Young Children: Relation between Foveation and Visual Acuity. Invest Ophthalmol Vis Sci 2011;52:8724–31. [DOI] [PubMed] [Google Scholar]
- 9.Currie DC, Bedell HE, Song S. Visual Acuity for Optotypes with Image Motions Simulating Congenital Nystagmus. Clin Vision Sci 1993;8:73–84. [Google Scholar]
- 10.Chung ST, Bedell HE. Velocity Criteria for “Foveation Periods” Determined from Image Motions Simulating Congenital Nystagmus. Optom Vis Sci 1996;73:92–103. [DOI] [PubMed] [Google Scholar]
- 11.Chung ST, LaFrance MW, Bedell HE. Influence of Motion Smear on Visual Acuity in Simulated Infantile Nystagmus. Optom Vis Sci 2011;88:200–7. [DOI] [PMC free article] [PubMed] [Google Scholar]
- 12.Bedell HE, Ukwade MT. Sensory deficits in idiopathic congenital nystagmus In: Lakshminarayanan V, ed. Basic and Clinical Applications of Vision Science. Dordrecht, The Netherlands: Kluwer Academic; 1997:251–5. [Google Scholar]
- 13.Bedell HE. Perception of a Clear and Stable Visual World with Congenital Nystagmus. Optom Vis Sci 2000;77:573–81. [DOI] [PubMed] [Google Scholar]
- 14.Felius J, Muhanna ZA. Visual Deprivation and Foveation Characteristics both Underlie Visual Acuity Deficits in Idiopathic Infantile Nystagmus. Invest Ophthalmol Vis Sci 2013;52:3520–5. [DOI] [PubMed] [Google Scholar]
- 15.Luckiesh M. Light, Vision and Seeing. New York: Van Nostrand Co; 1944. [Google Scholar]
- 16.Regan D, Niema D. Low-contrast Letter Charts as a Test of Visual Function. Ophthalmology 1983;90:1192–1200. [DOI] [PubMed] [Google Scholar]
- 17.Brown B, Lovie-Kitchen JE. High and Low Contrast Acuity and Clinical Contrast Sensitivity Tested in a Normal Population. Optom Vis Sci 2000;66:467–73. [DOI] [PubMed] [Google Scholar]
- 18.Pascal E, Abadi RV. Contour Interaction in the Presence of Congenital Nystagmus. Vision Res 1995;35:1785–89. [DOI] [PubMed] [Google Scholar]
- 19.Evans BJ, Evans BV, Jordahl-Moroz J, Nabee M. Randomized Doubled-Masked Placebo-Controlled Trial of a Treatment for Congenital Nystagmus. Vision Res 1998;38:2193–202. [DOI] [PubMed] [Google Scholar]
- 20.Bedell HE, Loshin DS. Interrelations between Measures of Visual Acuity and Parameters of Eye Movement in Congenital Nystagmus. Invest Ophthalmol Vis Sci 1991;32:416–21. [PubMed] [Google Scholar]
- 21.Hertle RW, Reese M. Clinical Contrast Sensitivity Testing in Patients with Infantile Nystagmus Syndrome Compared with Age-Matched Controls. Am J Ophthalmol 2007;143:1063–5. [DOI] [PubMed] [Google Scholar]
- 22.Dunn MJ, Margrain TH, Woodhouse JM, et al. Grating Visual Acuity in Infantile Nystagmus in the Absence of Image Motion. Invest Ophthalmol Vis Sci 2014;55:2682–6. [DOI] [PubMed] [Google Scholar]
- 23.Chung STL, Bedell HE. Effect of Retinal Image Motion on Visual Acuity and Contour Interaction in Congenital Nystagmus. Vision Res 1995;35:3071–82. [DOI] [PubMed] [Google Scholar]
- 24.Flom MC, Weymouth FW, Kahneman D. Visual Resolution and Contour Interaction. J Opt Soc Am 1963;53:1026–32. [DOI] [PubMed] [Google Scholar]
- 25.Chung ST, Bedell HE. Congenital Nystagmus Image Motion: Influence on Visual Acuity at Different Luminances. Optom Vis Sci 1997;74:266–72. [PubMed] [Google Scholar]
- 26.Home R Binocular Summation: a Study of Contrast Sensitivity, Visual Acuity and Recognition. Vision Res 1978;18:579–85. [DOI] [PubMed] [Google Scholar]
- 27.Leigh RJ, Dell’Osso LF, Yaniglos SS, Thurston SE. Oscillopsia, Retinal Image Stabilization and Congenital Nystagmus. Invest Ophthalmol Vis Sci 1988;29:279–82. [PubMed] [Google Scholar]
- 28.Abadi RV, Whittle JP, Worfolk R. Oscillopsia and Tolerance to Retinal Image Movement in Congenital Nystagmus. Invest Ophthalmol Vis Sci 1999;40:339–45. [PubMed] [Google Scholar]
- 29.Bedell HE. Sensitivity to Oscillatory Target Motion in Congenital Nystagmus. Invest Ophthalmol Vis Sci 1992;33:1811–21. [PubMed] [Google Scholar]
- 30.McDougall W The Sensations Excited by a Single Momentary Stimulation of the Eye. Brit J Psychol 1904;1:78–113. [Google Scholar]
- 31.Chen S, Bedell HE, Öğmen H. A Target in real Motion Appears Blurred in the Absence of Other Proximal Moving Targets. Vision Res 1995;35:2315–28. [DOI] [PubMed] [Google Scholar]
- 32.Bedell HE, Bollenbacher MA. Perception of Motion Smear in Normal Observers and in Persons with Congenital Nystagmus. Invest Ophthalmol Vis Sci 1996;37:188–95. [PubMed] [Google Scholar]
- 33.Bedell HE, Tong J. Asymmetrical Perception of Motion Smear in Infantile Nystagmus. Vision Res 2009;49:262–7. [DOI] [PubMed] [Google Scholar]
- 34.Ukwade MT, Bedell HE. Spatial-Bisection Acuity in Infantile Nystagmus. Vision Res 2012;64:1–6. [DOI] [PMC free article] [PubMed] [Google Scholar]
- 35.Ludvigh E Effect of Reduced Contrast on Visual Acuity as Measured with Snellen Test Letters. Arch Ophthalmol 1941;25:469–74. [Google Scholar]
- 36.Mainster MA, Timberlake GT, Schepens CL. Automated Variable Contrast Acuity Testing. Ophthalmology 1981;88:1045–53. [DOI] [PubMed] [Google Scholar]
- 37.Legge GE, Rubin GS, Luebker A. Psychophysics of Reading V. The Role of Contrast in Normal Vision. Vision Res 1987;27:1165–77. [DOI] [PubMed] [Google Scholar]
- 38.Herse PR, Bedell HE. Contrast Sensitivity for Letter and Grating Targets under Various Stimulus Conditions. Optom Vis Sci 1989;68:774–81. [DOI] [PubMed] [Google Scholar]
- 39.Johnson CA, Casson E. Luminance, Blur, and Contrast Effects on Acuity. Optom Vis Sci 1995;72:864–869. [DOI] [PubMed] [Google Scholar]
- 40.Liou H-L, Brennan NA. Letter Contrast Sensitivity Function of the Eye. Acta Ophthalmol Scand 1998;76:325–8. [DOI] [PubMed] [Google Scholar]
- 41.Adrian W The Effect of Observation Time and Contrast on Visual Acuity. Clin Exp Optom 2003;86:179–82. [DOI] [PubMed] [Google Scholar]
- 42.Karn HW. Area and the Intensity-Time Relation in the Fovea. J Gen Psychol 1936;14:360–9. [Google Scholar]
- 43.Saunders RM. The Critical Duration of Temporal Summation in the Human Central Fovea. Vision Res 1975;15:699–703. [DOI] [PubMed] [Google Scholar]
- 44.Legge GE. Sustained and Transient Mechanisms in Human Vision: Temporal and Spatial Properties. Vision Res 1978;18:69–81. [DOI] [PubMed] [Google Scholar]
- 45.Rovamo J, Leinonen L, Laurinen P, Virsu V. Temporal Integration and Contrast Sensitivity in Foveal and Peripheral Vision. Perception 1984;13:665–74. [DOI] [PubMed] [Google Scholar]
- 46.Georgeson MA. Temporal Properties of Spatial Contrast Vision. Vision Res 1987;27:765–80. [DOI] [PubMed] [Google Scholar]
- 47.Tolhurst DJ. Reaction Times in the Detection of Gratings by Human Observers: A Probabilistic Mechanism. Vision Res 1975;15:1143–9. [DOI] [PubMed] [Google Scholar]
- 48.Abadi RV, Sandikcioglu M. Visual Resolution in Congenital Pendular Nystagmus. Am J Optom Physiol Optics 1975; 52: 573–81. [DOI] [PubMed] [Google Scholar]
- 49.Dickinson CM, Abadi RV. The Influence of Nystagmoid Oscillation on Contrast Sensitivity in Normal Observers. Vision Res 1985;25:1080–96. [DOI] [PubMed] [Google Scholar]
- 50.Dickinson CM, Abadi RV. Suprathreshold Contrast Perception in Congenital Nystagmus. Clin Vision Sci 1992;7:31–7. [Google Scholar]
- 51.Bedell HE. Visual and Perceptual Consequences of Congenital Nystagmus. Semin Ophthalmol 2006;21:91–5. [DOI] [PubMed] [Google Scholar]
- 52.Brown VA, Doran RM, Woodhouse JM. The Use of Computerized Contrast Sensitivity, Arden Gratings and Low Contrast Letter Charts in the Assessment of Amblyopia. Ophthal Physiol Opt 1987;7:43–51. [PubMed] [Google Scholar]
- 53.Loeffler M, Wise JS, Gans M. Contrast Sensitivity Letter Charts as a Test of Visual Function in Amblyopia. J Pediatr Ophthalmol Strabismus 1990;27:28–31. [DOI] [PubMed] [Google Scholar]
- 54.Giashi DE, Degan D, Kraft SP, Kothe AC. Crowding and Contrast in Amblyopia. Optom Vis Sci 1993;70:192–7. [DOI] [PubMed] [Google Scholar]
- 55.Simmers AJ, Gray LS, McGraw PV, Winn B. Contour Interaction for High and Low Contrast Optotypes in Normal and Amblyopic Observers. Ophthalmic Physiol Opt 1999;19:253–60. [PubMed] [Google Scholar]
- 56.von Noorden GK, Burian HM. Visual Acuity in Normal and Amblyopic Patients under Reduced Illumination. I. Behavior of Visual Acuity with and without Neutral Density Filter. Arch Ophthalmol 1959;61:533–5. [DOI] [PubMed] [Google Scholar]
- 57.Caloroso E, Flom MC. Influence of Luminance on Visual Acuity in Amblyopia. Am J Optom Arch Am Acad Optom 1969;46:189–95. [DOI] [PubMed] [Google Scholar]
- 58.Barbeito R, Bedell HE, Flom MC, Simpson TL. Effects of Luminance on the Visual Acuity of Strabismic and Anisometropic Amblyopes and Optically Blurred Normals. Vision Res 1987;27:1543–9. [DOI] [PubMed] [Google Scholar]
- 59.Habeeb Y, Arthus BW, ten Hove MW. The Effect of Neutral Density Filters on Testing in Patients with Strabismic Amblyopia. Can J Ophthalmol 2012;47:348–50. [DOI] [PubMed] [Google Scholar]
- 60.Sampath V, Bedell HE. Distribution of Refractive Errors in Albinos and Persons with Idiopathic Congenital Nystagmus. Optom Vis Sci 2002;79:292–99. [DOI] [PubMed] [Google Scholar]
- 61.Wang J, Wyatt LM, Felius J, Stager DR Jr, Stager DR Sr, Birch EE, Bedell HE. Onset and Progression of With-the-Rule Astigmatism in Children with Infantile Nystagmus Syndrome. Invest Ophthalmol Vis Sci 2010;51:594–601. [DOI] [PMC free article] [PubMed] [Google Scholar]
- 62.Abadi RV, King-Smith PE. Congenital Nystagmus Modifies Orientational Detection. Vision Res 1979:19:1409–11. [DOI] [PubMed] [Google Scholar]
- 63.Hertle RW. Binocular Ocular Motility: Breaking with the Past: How Understanding Dynamic Ocular Motor Control and Central Nervous System Plasticity Promote Novel Discovery and Therapy of Nystagmus. Binoc Vis Strabology Q 2011;24:210–21. [PubMed] [Google Scholar]
- 64.Dell’Osso LF, Flynn JT. Congenitall Nystagmus Surgery a Quantitaitve Evaluation of the Effects. Arch Ophthalmol 1979;97:642–9. [DOI] [PubMed] [Google Scholar]
- 65.Kirschen DG. Auditory Feedback in the Control of Congenital Nystagmus. Am J Optom Physiol Opt 1983;60:364–8. [DOI] [PubMed] [Google Scholar]
- 66.Hertle RW. Horizontal Rectus Muscle Tenotomy in Children with Infantile Nystagmus Syndrome: a Pilot Study. J AAPOS 2004;8:539–48. [DOI] [PubMed] [Google Scholar]