

Abstract
Elderly populations (≥65 years old) have the highest risk of developing Alzheimer’s disease (AD) and/or obtaining a traumatic brain injury (TBI). Using translational mouse models, we investigated sleep disturbances and inflammation associated with normal aging, TBI and aging, and AD. We hypothesized that aging results in marked changes in sleep compared with adult mice, and that TBI and aging would result in sleep and inflammation levels similar to AD mice. We used female 16-month-old wild-type (WT Aged) and 3xTg-AD mice, as well as a 2-month old reference group (WT Adult), to evaluate sleep changes. WT Aged mice received diffuse TBI by midline fluid percussion, and blood was collected from both WT Aged (pre- and post-TBI) and 3xTg-AD mice to evaluate inflammation. Cognitive behavior was tested, and tissue was collected for histology. Bayesian generalized additive and mixed-effects models were used for analyses. Both normal aging and AD led to increases in sleep compared with adult mice. WT Aged mice with TBI slept substantially more, with fragmented shorter bouts, than they did pre-TBI and compared with AD mice. However, differences between WT Aged and 3xTg-AD mice in immune cell populations and plasma cytokine levels were incongruous, cognitive deficits were similar, and cumulative sleep was not predictive of inflammation or behavior for either group. Our results suggest that in similarly aged individuals, TBI immediately induces more profound sleep alterations than in AD, though both diseases likely include cognitive impairments. Unique pathological sleep pathways may exist in elderly individuals who incur TBI compared with similarly aged individuals who have AD, which may warrant disease-specific treatments in clinical settings.
Keywords: Sleep, Alzheimer’s disease, traumatic brain injury, blood cytokines, monocytes, aging, RRID:SCR_004633, RRID:SCR_00044, RRID: AB_312977, RRID:AB_312791, RRID:AB_2562351, RRID:AB_10640819), RRID:AB_2562218, RRID:AB_2732058, RRID:AB_11203896, RRID:AB_2722581, RRID:AB_2734548, RRID:AB_839504, RRID:AB_2340855, RRID:AB_2340846, RRID:SCR_001905
Introduction
Aging is a natural process that affects all biological systems and impacts sleep quantity, quality, and architecture (Espiritu, 2008). Sleep duration and overall sleep quality play a role in cognitive performance, where sleep disturbances are a marker of neurocognitive dysfunction in the elderly population (≥65 years old) (Espiritu, 2008; Mattis & Sehgal, 2016; Miyata et al., 2013). Furthermore, altered sleep may be associated with deleterious pathological processes and physiological changes that are inherent to aging (Espiritu, 2008; Myers & Badia, 1995).
Aging is a risk factor for accidents and falls, which can cause physical injuries (Rietz & Hagel, 1999) that include traumatic brain injuries (TBIs) (Flanagan, Hibbard, & Gordon, 2005; Stevens & Adekoya, 2001; Susman et al., 2002). In the elderly, TBI is responsible for >80,000 emergency department visits annually in the United States (Langlois, Rutland-Brown, & Wald, 2006). With longer life expectancy, the epidemiological pattern of TBI has changed and the number of elderly persons with new-onset TBI is on the rise (Flanagan et al., 2005; Susman et al., 2002). Patients with TBI typically experience sleep disturbances both immediately following TBI and months or years after the initial injury (Baumann, 2012; Baumann, Werth, Stocker, Ludwig, & Bassetti, 2007; Imbach et al., 2016; Sandsmark, Elliott, & Lim, 2017). Yet, data regarding how TBI affects sleep in the elderly remain sparse, as most research has overwhelmingly focused on young adults and juveniles (Iboaya, Harris, Arickx, & Nudo, 2019). A seminal study of elderly patients recently reported that sleep disturbances were more prevalent in older adults that incurred a TBI than in age-matched adults without a history of TBI (Wei et al., 2020). Further research addressing this knowledge gap is warranted to improve the treatment of sleep disturbances post-TBI in older adults.
Aging also increases the risk of developing neurodegenerative diseases and dementias. The most common dementia that develops with age is Alzheimer’s disease (AD), which impacts approximately 1 in 10 elderly people (Newcombe et al., 2018). Although some AD cases are genetically linked (Kunkle et al., 2019), pre-existing diseases and lifestyle factors that include TBI can also increase the risk of developing AD (Baugh et al., 2012; Faden & Loane, 2015; Gavett, Stern, Cantu, Nowinski, & McKee, 2010). Sleep disturbances are a common sequalae of AD, reported by 25–44% of AD patients (Guarnieri et al., 2012). The extent of sleep disturbances in AD patients develops along with the severity of symptoms and pathology, which indicates both clinical and etiological relevance (Ancoli-Israel, Klauber, Butters, Parker, & Kripke, 1991; Liguori et al., 2020; Mander, Winer, Jagust, & Walker, 2016; Prinz et al., 1982). Identifying the underlying cause and patterns of sleep disturbances in AD could inform treatment and rehabilitation strategies while also improving the overall quality of life of patients living with the disease.
Inflammation is a key mediator of sleep (Krueger, Obal, Fang, Kubota, & Taishi, 2001; Krueger, Rector, & Churchill, 2007; Opp, 2005; Simpson & Dinges, 2007) that is also linked to AD and TBI. An inflammatory component of AD is associated with the accumulation of both amyloid plaques and tau tangles in the brain (Akiyama et al., 2000; Bamberger & Landreth, 2002). Though the inflammatory component of TBI may be exacerbated by the deposition of amyloid and tau protein, the initiating inflammatory event occurs from an external force that causes mechanical damage to the brain (Puntambekar, Saber, Lamb, & Kokiko-Cochran, 2018). The cause of disease differs between TBI and AD, but both conditions typically lead to inflammation, sleep disturbances, and cognitive deficits (Johnson, Stewart, & Smith, 2010, 2012; Kokiko-Cochran & Godbout, 2018; Puntambekar et al., 2018). Reducing inflammation is considered a primary target for therapeutic options in both TBI and AD, which could mitigate subsequent sleep disturbances (Green, Ortiz, Wonnacott, Williams, & Rowe, 2020).
In this study, we investigated sleep disturbances associated with normal aging, TBI in aged mice, and transgenic AD mice. Employing translational mouse models, 16-month-old female 3xTg-AD and wild-type (WT Aged) mice were used to investigate age-related alterations in sleep-wake behavior, inflammation, and deficits in cognitive performance associated with aging, TBI, and AD. We hypothesized that WT Aged mice would exhibit marked changes in sleep compared with younger adult mice, and that WT Aged mice subjected to diffuse TBI would exhibit similar levels of sleep and inflammation to those observed in a genetic AD model. We further hypothesized that levels of cumulative sleep could predict changes in inflammation (e.g., peripheral monocyte populations and plasma cytokine levels) and cognitive performance.
METHODS
Rigor
Animal studies were conducted in accordance with the guidelines established by the NIH and the Institutional Animal Care and Use Committee (IACUC) at the University of Arizona. The Animal Research: Reporting In Vivo Experiments (ARRIVE) guidelines were followed (Kilkenny, Browne, Cuthill, Emerson, & Altman, 2010). Surgeries/injuries were performed on 16 WT Aged mice. Two WT Aged mice died from brain injury-induced pulmonary edema <30 minutes after injury (Saber et al., 2020). Therefore, a total of 30 mice were used for data analyses: 16 3xTg-AD mice and 14 WT Aged TBI mice. No animals were excluded from analyses of sleep-related outcomes. One 3xTg-AD mouse was excluded from analysis of blood flow data because of sample processing error. One 3xTg-AD mouse and one WT Aged mouse were excluded from analysis of cytokines data because of measurement errors. All of the information for the primary antibodies used in this manuscript can be found in Table 1.
Table 1:
Antibodies used.
| Antibody | Host | Clonality | Source | Catalog No. | Concentration |
|---|---|---|---|---|---|
| APC anti-mouse CD45 antibody | Rat | Monoclonal; Clone 30-F11 | Biolegend | 103112 | 1:200 |
| PE anti-mouse/human CD11b | Rat | Monoclonal; Clone M1/20 | Biolegend | 101208 | 1:200 |
| Brilliant Violet 510™ anti-mouse Ly-6C antibody | Rat | Monoclonal; Clone HK1.4 | Biolegend | 128033 | 1:100 |
| APC/Cyanine7 anti-mouse Ly-6G antibody | Rat | Monoclonal; Clone 1A8 | Biolegend | 127624 | 1:200 |
| Brilliant Violet 421™ anti-mouse NK-1.1 antibody | Mouse | Monoclonal; Clone PK136 | Biolegend | 108732 | 1:100 |
| Brilliant Violet 421™ anti-mouse CD3 Antibody | Rat | Monoclonal; Clone 17A2 | BD Biosciences | 555273 | 1:100 |
| Brilliant Violet 421™ anti-mouse/human CD45R/B220 Antibody | Rat | Monoclonal; Clone RA3–6B2 | Biolegend | 103240 | 1:200 |
| Brilliant Violet 421™ anti-mouse Siglec-F Antibody | Rat | Monoclonal; E50–2440 | BD Biosciences | 562681 | 1:100 |
| Purified anti-β-Amyloid, 17–24 Antibody | Mouse | Monoclonal; Clone 4G8 | Biolegend | 800712 | 1:250 |
| Anti-Iba1 | Rabbit | Polyclonal antibody | Wako | 019–19741 | 1:500 |
Animals and Experimental Timeline
A schematic of the study design is provided in Figure 1. We used 16-month-old female 3xTg-AD mice (n = 16) and female age-matched C7BL/6;129X1/SvJ;129S1/S wild-type (WT Aged) controls (n = 16), because mortality substantially increases for 3xTg-AD mice beyond this age (Torres-Lista, De la Fuente, & Gimenez-Llort, 2017). As is common practice with 3xTg-AD mice, only females were used in this study because 3xTg-AD males have inconsistent and less severe pathology (Belfiore et al., 2019; Rosenberg, Fu, & Lambracht-Washington, 2018; Yang et al., 2018). Mice were ordered from The Jackson Laboratory (Sacramento, CA, RRID:SCR_004633), bred at Arizona State University, and transferred to the University of Arizona where they acclimated for at least two weeks prior to initiation of the study. Mice were housed in a 14:10 light-dark period (lights on at 6:00AM; 200 lux cool, white fluorescent light) at a constant temperature (23°C ± 2) and given food and water ad libitum.
Figure 1:

Study design to compare AD and TBI sleep behavior, peripheral inflammation, and cognitive deficits. Day 0, mice were put in sleep cages for acclimation. Day 3, sleep was recorded for 48 consecutive hours serving as baseline. Day 5, blood was collected, and WT Aged mice received surgical preparation for diffuse brain injury. Day 6, mice were removed from their sleep cages and WT Aged mice received a diffuse brain injury via mFPI. Day 7, blood was collected via submandibular vein. Mice were placed back in sleep cages for 2 days of uninterrupted sleep measurements (day 8 and 9). Day 10, mice were tested on open field and novel object recognition.
The scope of this study was an 11-day experimental timeline. Mice were singly housed and acclimated to a non-invasive sleep cage for three days (days 0–2). Baseline sleep parameters were collected for 48 consecutive hours (days 3–4). On day 5, all mice were removed from their sleep cages, blood was collected, and subcutaneous saline was administered; WT Aged mice also received surgical preparation for diffuse brain injury. On day 6, WT Aged mice received a diffuse brain injury via midline fluid percussion injury (mFPI). Thereafter, all mice were immediately returned to their sleep cage and 24 hours of uninterrupted sleep parameters were collected. On day 7, blood was collected via submandibular vein. Mice were then placed back in sleep cages for 2 days and uninterrupted sleep parameters were collected (days 8 and 9). On day 10, mice were tested in an open field and on a novel object recognition task. All experimentation occurred between 8:00AM and 10:00AM to allow for uninterrupted sleep measurements at all other hours, except for day 10 when behavior was evaluated. All behavior testing was conducted in the same room to avoid potential confounding of novel locations on behavioral responses.
Midline fluid percussion injury (mFPI)
WT Aged mice were subjected to mFPI as previously described (Rowe, Griffiths, & Lifshitz, 2016; Rowe, Harrison, Zhang, et al., 2018). Mice were anesthetized using 5% isoflurane mixed in 100% oxygen for 2 minutes and then transferred to a stereotaxic frame with continuous delivery of isoflurane at 2.5% via nose-cone. Body temperature was maintained using a Deltaphase isothermal heating pad (Braintree Scientific Inc., Braintree, MA, USA). While anesthetized, a midline incision was made exposing the area between bregma and lambda. A 3-mm outer diameter trephine was used to make a circular craniectomy between bregma and lambda on the midline without disrupting the dura. An injury hub was made from the female portion of a Luer-Loc needle hub and was fixed over the craniectomy site using cyanoacrylate gel and methyl-acrylate (Hygenic Corp, Akron, OH, USA). The hub was filled with saline. A cap made from a modified syringe tip was placed in the hub to prevent debris from entering the hub. Animals were returned to a heated recovery cage and monitored until ambulatory before being returned to their individual sleep cages.
Mice were re-anesthetized 24-h post-surgery using 5% isoflurane delivered for 2 minutes. The cap was removed from the injury-hub assembly and the craniectomy was visually inspected for an intact dura and undisturbed sinus. The hub was filled with sterile saline and attached to the fluid percussion device (Custom Design and Fabrication, Virginia Commonwealth University, Richmond, VA) using extension tubing (Baxter, #2C5643). Following confirmation of a toe pinch response, the pendulum was released from a pre-determined height onto the fluid-filled cylinder causing a fluid pulse directly onto the dura, which resulted in a diffuse brain injury. Immediately after injury, the hub was removed, and animals were placed on their side and monitored for clinical signs of apnea, seizure-like activity, and return of the righting reflex. After mice spontaneously righted, the craniectomy was inspected for uniform herniation, hematoma, and an intact dura, and the incision was sutured. Animals were returned to a heated recovery cage and monitored until ambulatory. Mice were returned to their individual sleep cages ≤2 hours post-injury. Injured mice were evaluated the first day post-injury for post-operative check-ups by physical examination and documentation of body weight, physical appearance, and swelling around the suture site. Animals retained in this study had to have a hematoma without asymmetrical herniation, visual evidence of a change in breathing (apnea, irregular, rapid, etc.), and a righting reflex time between 4 and 8 minutes.
Collection of sleep-wake parameters
Sleep and wake activity were measured using a non-invasive piezoelectric sleep cage system (Signal Solutions, Lexington, KY, USA), which classified sleep behavior according to previously described methods (Harrison et al., 2015; Rowe, Harrison, Morrison, et al., 2018; Saber et al., 2019). This non-invasive method has been validated with electroencephalogram (EEG) and human observations, and has demonstrated a classification accuracy (sleep vs wake) of >90% in mouse sleep research (Mang et al., 2014). Each cage had an open bottom that allowed direct placement on a Polyvinylidine Difluoride sensor on the cage floor, and the sensors were coupled to an input differential amplifier to generate pressure signals. Sleep was characterized by regular breathing movements associated with sleep (3 hertz, regular amplitude signals; (Donohue, Medonza, Crane, & O’Hara, 2008). Mice that were characterized as exhibiting wake behavior had the absence of this sleep signal and the presence of higher amplitude, irregular spiking, associated with volitional movements. The piezoelectric signals were analyzed over tapered eight-second windows at a two-second interval, from which a decision statistic was computed and classified by a linear discriminate classifier as “sleep” or “wake”. Data collected from the sleep cages were binned at each hour using a rolling average of the percentage sleep. Data were also binned by length of individual sleep bouts to calculate the hourly mean bout length (duration). This allowed us to calculate average sleep and bout length for every hour. Sleep bouts required a minimum of 4-second epochs. Data were also collected for cumulative minutes slept within each 24-hour period. To assess sleep fragmentation, the frequencies of individual sleep bouts with different episode durations were analyzed (Giordano et al., 2020; Rowe, Harrison, Morrison, et al., 2018). Sleep bouts were assigned to one of eight bins of exponentially increasing durations (4–7, 8–15, 16–31, 32–63, 64–127, 128–255, 256–511, and >512 seconds) and the frequency of the number of bouts in each bin was calculated. Each 24-hour period was grouped into three periods; the first light period (10:00AM to 7:59PM), the dark period (8:00PM to 5:59AM), and the second light period (6:00AM to 9:59AM). The start of the first light period (10:00AM) was the start of the post-injury sleep in mice subjected to TBI. For baseline sleep, measurements for percent sleep, cumulative minutes slept, and frequency of individual sleep bouts were averaged across day 3 and 4 of the study timeline. For baseline sleep reported in hourly increments, the data collected at each hour on days 3 and 4 were averaged and a single value was calculated as the baseline value for that hour. For cumulative sleep and frequency of individual sleep bouts, baseline data from days 3 and 4 were averaged and a single baseline value is reported.
Open field
On day 10 of the experiment, the open field task was used to assess anxiety-like behavior (Rowe, Harrison, Morrison, et al., 2018). Mice were placed in the corner of an empty arena (45.7 cm W × 45.7 cm L × 30.5 cm H; Volume = 0.064 m3) and allowed to explore freely for 10 minutes. Movement was tracked by an overhead camera. Time in center (16-cm2 area) and total distance traveled were calculated using EthoVision XT 10 software (Noldus Information Technology, Leesburg, VA, USA; RRID:SCR_00044).
Novel object recognition task
The novel object recognition (NOR) task was used to assess cognitive performance (Rowe, Harrison, O’Hara, & Lifshitz, 2014b), which consisted of three phases: acclimation, training, and testing. Mice were acclimated to clean individual plastic testing cages (30.5 cm W × 40.7 cm L × 20.3 cm H; Volume = 0.025 m3) for one hour. The same plastic cage was used for all three phases to prevent potential confounding of placing mice in a new cage for novel object testing. Two identical objects (plastic toys) were placed in opposing quadrants of the testing cage for the training phase. Mice were subsequently placed in the center of the testing cage and given 10 minutes to explore the objects and then returned to their sleep cages for 3 hours. For the testing phase, one of the original objects was replaced with a novel object. Mice were placed in the center of their individual plastic testing cages and given 10 minutes to explore the objects. Exploration of the object was defined as nose to object. The animals were tracked using an overhead camera. The time (sec) spent exploring the novel object (tnovel) and the old object (told) were recorded using EthoVision XT 10 software. A discrimination index bounded between −1 and 1 was calculated:
Preference for the new object was defined as DI from 0.25 to 1, preference for the old object from −1 to −0.25, and no preference from −0.25 to 0.25 (Lueptow, 2017).
Flow cytometry analysis of blood
75 μL of whole blood (~7.5×10⁵ immune cells) were first blocked with Fc block (1:500) for 10 minutes and then incubated in the following antibodies: CD45 (Biolegend, code 103112; 1:200, RRID: AB_312977), CD11b (Biolegend, code 101208; 1:200, RRID:AB_312791), Ly6C (Biolegend, code: 128033; 1:100, RRID:AB_2562351), Ly6G (Biolegend, code: 127624; 1:200, RRID:AB_10640819), NK1.1 (Biolegend, code: 108732; 1:100, RRID:AB_2562218), CD3 (BD Biosciences, code 555273; 1:100, RRID:AB_2732058), B220 (Biolegend, code: 562922; 1:200, RRID:AB_11203896), and Siglec F (BD Biosciences, code: 565934; 1:100, RRID:AB_2722581). Blood was lysed with red blood cell lysis buffer (Biolegend, code: 420301; 1X in deionized water) and washed with FACs buffer (1X Hanks balanced buffer solution treated with 0.5 g BSA, 25 mM Hepes, 0.05% sodium azide) (Saber et al., 2019). The viability dye 7AAD (Biolegend, code: 420404) was used for live/dead staining. Eighty thousand CD45+ events were collected to keep analysis of myeloid cell populations consistent across all samples. After gating out debris and dead cells, CD45+ events were subsequently gated on CD11b+ events to identify myeloid cells. To specifically focus on monocyte and neutrophil populations, Nk1.1, Cd3, B220, and SiglecF were used to gate out natural killer cells, T cells, B cells, and eosinophils, respectively. Cells were then gated on Ly6C. Populations of interest were defined as CD11b+Ly6Chigh monocytes and CD11b+Ly6G+ neutrophils. The total number of events of interest were taken as a ratio to CD11b+ cells to calculate percentage of cells of interest.
Cytokine measurement
Approximately 75 µL of blood were centrifuged to collect approximately 40 µL of plasma from each animal at 8:00AM on days 5 and 7 (Saber et al., 2019). Cytokine plates (MILLIPLEX MAP Mouse Cytokine/Chemokine Magnetic Bead Panel - Immunology Multiplex Assay) were used to assess interleukin (IL)-6, IL-1β, and tumor necrosis factor (TNF)-α levels in peripheral blood at day 5 (baseline) and day 7 (1-day post-TBI for WT Aged mice). All samples were diluted in 1:1 assay buffer and run in triplicate in representative 96-well plates. Manufacturer’s instructions were followed and a handheld magnet (EMD Millipore Catalog #40–285) was used for all plate washes. Samples were incubated at 4°C for 16 hours. Pre-mixed Luminex® magnetic beads containing fluorescent dye bonded to antibodies of interest were measured on a Bio-Plex® 200 system (Milliplex Map mouse cytokine/chemokine magnetic panel, code: MCYTOMAG-70k). All plates were run in duplicate sets and were averaged and analyzed between groups.
Immunohistochemistry and immunofluorescence
Brains were collected within 24 hours after behavior testing was completed and were analyzed for AD and TBI pathology. Immunofluorescence was used to visualize amyloid plaque and microglia colocalization, and immunohistochemistry (3,3′-diaminobenzidine; DAB) was used to confirm amyloid pathology and microglial activation. Briefly, mice were euthanized with Euthasol® (0.002 ml/g; Patterson veterinary, 07-805-9296) and perfused with cold 1× phosphate buffered saline (PBS). Brains were collected and drop-fixed in 4% paraformaldehyde in PBS. After 48 hours, brains were transferred into a 30% sucrose solution before being embedded in optical cutting temperature (OCT) compound. Free-floating coronal sections (30 µm) were collected and stored at 4°C in PBS with 0.05% sodium azide. Sections were washed three times for 5 minutes each in PBS before being boiled at 90°C in 10mM sodium citrate for 5 minutes. For florescent staining, sections were blocked in 5% normal horse serum (NHS)/0.3% Triton X-100 in 1× PBS (Blocking solution) at room temperature for 1 hour and then incubated with primary antibodies anti-B-amyloid (Biolegend, 800712; 1:250, RRID:AB_2734548) and Iba1 (Wako, 019-19741; 1:500, RRID:AB_839504) over night at 4°C. The following day, sections were washed in 0.1% PBST (phosphate-buffered solution with Triton X-100) and incubated for 1 hour in Alexa Fluor® 594 (Jackson immuno, 715-585-152; 1:500, RRID:AB_2340855) and Alexa Fluor® 488 (Jackson immuno, 715-545-150; 1:500, RRID:AB_2340846) to visualize amyloid and Iba1, respectively. Sections were mounted and cover slipped with DAPI-Fluoromount-G™ mounting medium (Fisher Scientific, 0B010020) and imaged within 48 hours of staining.
For immunohistochemistry, sections were incubated in 0.3% H2O2 in PBS for 30 minutes then blocked at room temperature for 1 hour. Sections were then incubated with anti-B-amyloid or Iba1 antibody (4°C overnight). The following day, sections were washed three times for 5 minutes in 0.1% PBST then incubated for 1 hour at room temperature in secondary antibodies conjugated to biotin (1:1000; Vector Laboratories, BA-1100). Sections were washed in PBST and incubated with Avidin/Biotinylated enzyme complex (ABC reagent; Vector Laboratories, PK-6100) reagent for 30 minutes at room temperature, washed in PBS, and developed with 3,3′-diaminobenzidine (DAB) until a brown reaction product was observed. Following DAB, sections were washed in PBS, mounted on glass slides, and dehydrated in increasing alcohol concentrations (70%, 90%, and 100%). Sections were cleared in CitriSolv (Fisher Scientific, 22-143-975) and cover slipped with DPX Mountant (Fisher Scientific, 50-980-370).
Statistical analysis
We used the general analytical approach described by Saber et al. (2019) in which hierarchical mixed effects and generalized additive models were fit in a Bayesian inferential framework (West, Welch, Gałecki, & Gillespie, 2015; Wu, 2010). We employed this approach for two primary reasons: 1) most of the outcome variables of interest violated primary assumptions of analytical methods that are commonly used in neuroscience, such as t-tests and analysis of variance (ANOVA), and using those methods under such circumstances can substantially increase Type I error rates (false positives) and the probability of obtaining erroneous results (Aarts, Dolan, Verhage, & van der Sluis, 2015; Aarts, Verhage, Veenvliet, Dolan, & van der Sluis, 2014); and 2) similar to most other animal-based neuroscience studies (Button et al., 2013), our study had relatively small within-group sample sizes, where fitting models to small sample data in a Bayesian framework permits quantification of the uncertainty in effects and can result in more accurate and reliable parameter estimates, if informative priors are used (McNeish, 2016; van de Schoot, Broere, Perryck, Zondervan-Zwijnenburg, & van Loey, 2015; Zondervan-Zwijnenburg, Peeters, Depaoli, & Van de Schoot, 2017). We applied conservatively informative priors to model parameters and variance components, the specifications of which were based on results from previous preliminary and published studies by our group (Saber et al., 2019), as well as our knowledge of the study systems and recommendations from prior statistical research.
Sleep data from 16 WT Adult (2-month old) female mice from a separate study (Saber et al., 2019), which were collected under the same conditions as the present study, were used as a control for aging only in comparisons of baseline sleep metrics. Percentage sleep and sleep bout lengths were time-series repeated measures data, and we were primarily interested in effects within each sleep period, not at each hour or among periods. The hourly data were therefore subset by period and each period was analyzed separately (i.e., separate models for light #1, dark, and light #2 periods) (Saber et al., 2019). We fit generalized additive models in which smoothing splines were modeled on hours (Perperoglou, Sauerbrei, Abrahamowicz, Schmid, & Initiative, 2019), and each model included group-level varying intercepts for individual mice that were implicitly nested within their respective cohorts (sensu random effects). This group-level specification accounted for potential dependency among hourly measurements for each mouse, as well as variation that may have been induced by cohort or time entered into the study (West et al., 2015; Wu, 2010). A beta distribution was specified for the percentage sleep outcome, because percentages are bounded between 0 and 1 (Ferrari & Cribari-Neto, 2004; Figueroa-Zuniga, Arellano-Valle, & Ferrari, 2013), and negative-binomial distributions were specified for sleep bout length, number of sleep bouts, and cumulative sleep outcomes, because those values were recorded as integer counts and exploratory analyses indicated overdispersion existed (Hilbe, 2014). We applied ~Normal(0, 1) priors to population-level parameters, given our a priori expectations of no differences between groups; a ~Gamma(0.1, 0.1) prior to the scaling parameter (ϕ); and, per the recommendations of Gelman (2006), ~Cauchy(0, 5) priors to the standard deviations of group-level effects and smoothing splines, thereby appropriately restricting the parameter space to positive values.
Cytokine levels were zero-truncated, positive continuous variables that we specified log-normal distributions for, and fit multivariate models in which each outcome was simultaneously modeled as independent. Blood flow cytometry data were measured as positive percentages, and we similarly fit multivariate models but specified beta distributions for each outcome. The aforementioned models included group-level effects that were identical to those specified in the sleep models. For the cognitive outcomes, we specified a t-distribution that was bounded between −1 and 1 for DI and included heterogeneous variance in the model specification (Kruschke, 2013), whereas we specified negative-binomial distributions for the zero-truncated integer counts of distance traveled and time spent in center. Group-level effects were excluded from the cognitive models because these data were not repeated measures. We applied ~Normal(0, 1) priors to all population-level parameters of the log-normal, beta, and negative-binomial models, ~Cauchy(0, 5) priors to the standard deviations of group-level effects as well as the variance scaling parameter (σ) of the log-normal models, and a ~Gamma(0.01, 0.01) prior to ϕ of the beta and negative-binomial models. In contrast, we followed the recommendations of Kruschke (2013) for models with the t-distribution and applied a ~Student-t(3, 4, 10) prior on the population intercept, a ~Student-t(3, 0, 10) prior on the intercept of σ, and a ~Gamma(2, 0.1) prior on the degrees of freedom parameter (ν).
For percentage sleep, sleep bout lengths, cumulative sleep, blood flow, and cytokine outcomes, we fit the following population-level effects (sensu fixed effects) in separate models: 1) Genetics, with data subset to only include day 5 (0 days post-TBI), to investigate differences between genetic groups at baseline; and 2) a Genetics × Day interaction, to investigate differences between genetic groups across days. Additionally, we fit models with just a Day effect to only the WT Aged mice sleep data to validate that expected temporal changes following TBI occurred (Rowe, Striz, et al., 2014; Saber et al., 2019). For the number of sleep bouts, we fit models that included the aforementioned effects as well as the following: 1) Episode Duration Category, to investigate differences among categories, and 2) a Genetics × Day × Episode Duration Category interaction, to investigate differences between groups in each category across days. For cognitive outcomes, we fit only a Genetics population-level effect to investigate differences between groups. In total, we fit 24 models to the sleep data, 1 multivariate model with 8 sub-models to the blood flow cytometry data, 1 multivariate model with 3 sub-models to the cytokine data, and 3 models to the cognitive performance data.
To investigate if sleep was linearly predictive of cognitive performance or inflammation (Rowe (Rowe, Harrison, Morrison, et al., 2018), we fit models to the following outcomes: DI measured at day 10, IL-6 cytokines measured at day 7, and CD11b+Ly6Chigh monocytes measured at day 7. Each model included a Cumulative Sleep × Genetics interaction as the population-level effects, where Cumulative Sleep was measured at day 7. For this predictive analysis only, we centered and scaled the Cumulative Sleep predictor to have a mean of zero and unit variance to mitigate collinearity (Ciaburro, 2018). We specified a Gaussian distribution bounded between −1 and 1 for DI, log-normal distribution for IL-6, and beta distribution for CD11b+Ly6Chigh, with ~Normal(0, 1) priors on population-level effects, ~Cauchy(0, 5) priors on σ of the DI and IL-6 models, and a ~Gamma(0.1, 0.1) prior on ϕ of the CD11b+Ly6Chigh model.
Models were fit using the Stan computational platform (v2.19.2) implemented via the brms package (v2.10.0) in the R statistical analysis program (v3.6.1) (Burkner, 2017, 2018; Carpenter et al., 2017; R Core Team, 2019)( RRID:SCR_001905). All models were fit using four Markov chains, each with a burn-in of 2,000 iterations of the No-U-Turn Sampler extension to Hamiltonian Monte-Carlo sampling, followed by 3,000 sampling iterations. This resulted in a total of 12,000 posterior samples for each model. Convergence was assessed via trace plots and by calculating the potential scale reduction factor and effective sample sizes (neff); optimal values were strictly and neff > 1,000 (A. Gelman, Rubin, D.B., 1992; A. Gelman, Shirlet, K., 2011). Model fit was assessed with posterior predictive check plots via the R package bayesplot (v1.7.0), in which 1,000 posterior predictive distribution samples were compared to the observed data (J. Gabry, Mahr, 2019; J. Gabry, Simpson, Vehtari, Betancourt, & Gelman, 2019; A. Gelman, Carlin, J.B., Stern, H.S., Dunson, D.B., Vehtari, A., Rubin, D.B., 2013).
We focused inferences on a combination of model parameter estimates (θ; posterior means), 95% credible intervals (CI), conditional marginal effects under the posterior distribution, and posterior probabilities (P) and Bayes factors (Brambor, Clark, & Golder, 2006). Posterior probability is scaled 0 to 1, where 0 equates to no evidence and 1 equates to decisive evidence. Bayes factor, in the context of the application to the current data, measures the strength of evidence given P and the data under consideration, and is scaled 0 to ∞ (Kass & Raftery, 1995). For supported effects, we also calculated effect sizes (Cohen, 1988; Sawilowsky, 2009), using the estimated group-specific posterior means and their pooled variances from conditional marginal effects, as supplemental measures of magnitude. A summary of said criteria that were used for evaluating the evidentiary strength and magnitude of effects is provided in Table 2.
Table 2.
Summary of statistical metrics used to evaluate strength of support and magnitude of supported effects.
| Strength of Support |
||||
|---|---|---|---|---|
| Metric | Weak | Moderate | Strong | Decisive |
| Posterior Probability (P) | 0.90–0.92 | 0.93–0.95 | 0.96–0.98 | ≥0.99 |
| Bayes Factor (K) | <3 | 3–10 | 11–100 | >100 |
| Magnitude of Effect |
||||
| Metric | Small | Medium | Large | Very Large |
| Effect Size (d) | 0.10–0.49 | 0.50–0.79 | 0.80–1.19 | ≥1.20 |
RESULTS
Both normal aging and aging in a genetic model of AD led to significant changes in sleep compared with young adult mice.
We hypothesized that WT Aged mice and aged 3xTg-AD mice would have profound changes in sleep compared with young adult mice (WT Adult). This hypothesis was supported, and WT Aged and 3xTg-AD mice slept more cumulative minutes with more fragmented short bouts than WT Adult mice (Figure 2).
Figure 2:

Posterior marginal effects point estimates and 95% credible intervals of (A) baseline cumulative sleep (minutes) and (B) frequency of binned categories of sleep bout durations (seconds) among WT Adult mice (2 months), WT Aged mice (16 months), and 3xTg-AD mice (16 months).
WT Aged and 3xTg-AD mice had 47 minutes (95% CI: −9, 103; P = 0.94, K = 17.13) and 71 minutes (95% CI: 15, 127; P > 0.99, K = 140.18) more cumulative sleep than 2-month-old WT Adult mice, whereas WT Aged mice had similar cumulative sleep as AD mice (P = 0.80, K = 3.69; Figure 2A; Supp. Tables A1, B1). Effect sizes for baseline cumulative sleep differences were nominal (d ≤ 0.01). The number of sleep bouts at baseline was similar among WT Adult, WT Aged, and 3xTg-AD mice in episode duration categories 4–7, 8–15, 16–31, and 256–511 secs (P ≤ 0.88, K ≤ 7.5), but differed among groups for the following categories (Figure 2B; Supp. Tables A2, B2). Bout durations 32–63 secs: Compared with WT Adult mice, WT Aged mice had 33 more bouts (95% CI: 13, 53; P = 0.98, K = 64.93) and AD mice had 26 more bouts (95% CI: 8, 44; P = 0.97, K = 35.36), whereas the number of bouts were similar between WT Aged and AD mice (P = 0.65, K = 1.82). Bout durations 64–127 secs: Compared with WT Adult mice, WT Aged mice had 44 more bouts (95% CI: 26, 63; P > 0.99, K > 1,000) and AD mice had 49 more bouts (95% CI: 31, 68; P > 0.99, K > 1,000), whereas the number of bouts were similar between WT Aged and AD mice (P = 0.65, K = 1.89). Bout durations 128–255 secs: WT Aged and AD mice had 18 (95% CI: 5, 31; P = 0.96, K = 22.62) and 48 (95% CI: 32, 65; P > 0.99, K > 1,000) more bouts than WT Adult mice, respectively, and WT Aged mice had 30 (95% CI: 12, 48; P = 0.99, K = 154.84) fewer bouts than AD mice. Bout durations ≥512 secs: WT Aged and AD mice had 6 (95% CI: 3, 8; P > 0.99, K > 1,000) and 10 (95% CI: 7, 12; P > 0.99, K > 1,000) fewer bouts than WT Adult mice, respectively, but WT Aged mice had 4 (95% CI: 2, 6; P > 0.99, K > 1,000) more bouts than AD mice. Although effect sizes for most of the above bout duration category differences at baseline were nominal (d ≤ 0.09), all effect sizes for the ≥512 secs category were small to medium (d = 0.32–0.77).
We hypothesized that WT Aged mice and 3xTg-AD mice would have a higher percent sleep with a shorter mean bout length of sleep compared with young WT Adult mice, which was partially supported. WT Aged and 3xTg-AD mice had a higher percent sleep in the first light period, 3xTg-AD mice had a higher percent sleep in the dark period, and both WT Aged and 3xTg-AD mice had a lower percent sleep and shorter mean bout length in the second light period compared with WT Adult mice (Figure 3).
Figure 3:

Posterior marginal effects point estimates and 95% credible intervals of percentage of time slept and sleep bout lengths during the light and dark periods at baseline for WT Adult mice, WT Aged mice, and 3xTg-AD mice. Baseline sleep was analyzed 48 h prior to experimentation. (A) Percent sleep during the first light period (10:00AM to 7:59PM). (B) Percent sleep during the dark period (8:00PM to 5:59AM). (C) Percent sleep during the second light period (6:00AM to 9:59AM). (D) Sleep bout lengths during the first light period. (E) Sleep bout lengths during the dark period. (F) Sleep bout lengths during the second light period.
During the first light period, WT Aged and 3xTg-AD mice slept 9% (95% CI: 7, 16; P > 0.99, K > 1,000) and 11% (95% CI: 4, 13; P > 0.99, K > 1,000) more than WT Adult mice, respectively, whereas WT Aged and 3xTg-AD mice exhibited similar sleep percentages (95% CI: −2, 7; P = 0.89, K = 8.26; Figure 3A; Supp. Tables A3, B3). During the dark period, both WT mice groups exhibited similar sleep percentages (95% CI: −3, 7; P = 0.82, K = 4.43), whereas AD mice slept 12% (95% CI: 7, 17; P > 0.99, K > 1,000) more than WT Adult mice and WT Aged mice slept 10% less (95% CI: −16, −4; P > 0.99, K > 1,000) than AD mice (Figure 3B; Supp. Tables A4, B4). During the second light period, WT Aged and AD mice slept 9% (95% CI: −3, −15; P = 0.99, K = 90.60) and 15% (95% CI: −8, −22; P > 0.99, K > 1,000) less than WT Aged mice, respectively, and WT Aged mice slept 6% more than 3xTg-AD mice (95% CI: 0, 12; P = 0.92, K = 11.24; Figure 3C; Supp. Tables A5, B5). Effect sizes for baseline percentage sleep differences indicated the magnitudes of said effects were very large (d = 2.24–15.36). No differences in bout lengths among the three groups were detected during the first light period (P = 0.62–0.86, K = 1.62–6.24; Figure 3D; Supp. Tables A6, B6). During the dark period, WT Aged mice had 11 sec (95% CI: −22, −1; P = 0.96, K = 23.84) and 10 sec (95% CI: −20, 1; P = 0.94, K = 16.88) shorter bout lengths than WT Adult and AD mice, respectively, whereas AD and WT Adult mice exhibited similar bout lengths (95% CI: −11, 8; P = 0.60, K = 1.41; Figure 3E; Supp. Tables A7, B7). During the second light period, WT Aged and AD mice exhibited similar bout lengths (95% CI: −12, 15; P = 0.56, K = 1.27) and had 33 sec (95% CI: −52, −15; P > 0.99, K = 665.67) and 32 sec (95% CI: −45, −18; P > 0.99, K = 630.58) shorter bout lengths than WT Adult mice, respectively (Figure 3F; Supp. Tables A8, B8). Effect sizes for these bout length differences were nominal (d ≤ 0.03).
Diffuse TBI in WT Aged mice led to more sleep with fragmented shorter bouts compared with pre-injury baseline sleep.
We hypothesized that a diffuse TBI in WT Aged mice would result in increased sleep quantity, but decreased sleep quality compared with their pre-injury baseline sleep, which were supported. WT Aged mice slept more cumulative minutes on days 7 and 8 (post-injury day 1 and 2) compared with their baseline sleep (Figure 4A). This sleep was fragmented with more sleep bouts of shorter durations post-injury compared with baseline bouts (Figure 4B).
Figure 4:

Posterior marginal effects point estimates and 95% credible intervals of (A) cumulative sleep (minutes) and (B) frequency of binned categories of sleep bout durations (seconds) for WT Aged mice among baseline (day 5), day 7, 8, and 9 (1, 2, and 3 days post-TBI).
Compared with baseline (pre-injury), WT Aged TBI mice had 133 minutes (95% CI: 97, 169; P > 0.99, K > 1,000) and 118 minutes (95% CI: 82, 154; P > 0.99, K > 1,000) more cumulative sleep at days 7 and 8, respectively, whereas day 9 was similar to baseline (95% CI: −11, 62; P = 0.86, K = 6.40; Supp. Tables A9, B9). Cumulative sleep at day 9 was also 108 minutes (95% CI: 65, 150; P > 0.99, K > 1,000) and 93 minutes (95% CI: 51, 134; P > 0.99, K > 1,000) lower than days 7 and 8, respectively. However, effect sizes for cumulative sleep differences were very small (d ≤ 0.02).
Bout durations 4–7 secs: The number of bouts were similar among all days (P = 0.46–0.85, K = 0.86–5.86), with nominal effect sizes (Supp. Tables A10, B10). Bout durations 8–15 secs: Compared with baseline, there were 98 (95% CI: 33, 164; P = 0.95, K = 15.69) and 80 (95% CI: 17, 144; P = 0.94, K = 15.22) more bouts at days 7 and 8, respectively, whereas the number of bouts at day 9 were similar to baseline (95% CI: −17, 95; P = 0.71, K = 2.46). The number of bouts were similar between days 7 and 8 (95% CI: −59, 94; P = 0.51, K = 1.03), slightly higher at day 7 than day 9 (95% CI: −11, 130; P = 0.83, K = 4.75), and slightly higher at day 8 than day 9 (95% CI: −27, 110; P = 0.82, K = 4.58). All effect sizes were nominal (d ≤ 0.01). Bout durations 16–31 secs: Compared with baseline, there were 149 (95% CI: 87, 211; P > 0.99, K > 1,000), 113 (95% CI: 57, 169; P > 0.99, K = 332.33), and 52 (95% CI: 7, 97; P = 0.90, K = 8.49) more bouts at days 7, 8, and 9, respectively. The number of bouts at days 7 and 8 were similar (95% CI: −39, 111; P = 0.64, K = 1.78), whereas there were 97 (95% CI: 30, 164; P = 0.97, K = 28.78) and 61 (95% CI: 1, 122; P = 0.93, K = 13.08) more bouts at days 7 and 8 than day 9, respectively. All effect sizes were nominal (d ≤ 0.02). Bout durations 32–63 secs: Compared with baseline, there were 173 (95% CI: 113, 234; P > 0.99, K > 1,000), 141 (95% CI: 86, 195; P > 0.99, K > 1,000), and 64 (95% CI: 23, 106; P = 0.97, K = 38.47) more bouts at days 7, 8, and 9, respectively. The number of bouts at days 7 and 8 were similar (95% CI: −42, 108; P = 0.62, K = 1.61), whereas there were 109 (95% CI: 43, 176; P = 0.98, K = 58.11) and 76 (95% CI: 15, 137; P = 0.97, K = 29.85) more bouts at days 7 and 8 than day 9, respectively. All effect sizes were nominal (d ≤ 0.03).
Bout durations 64–127 secs: Compared with baseline, there were 101 (95% CI: 53, 149; P > 0.99, K = 278.07), 82 (95% CI: 38, 126; P = 0.99, K = 186.50), and 41 (95% CI: 3, 78; P = 0.88, K = 7.17) more bouts at days 7, 8, and 9, respectively. The number of bouts at days 7 and 8 were similar (95% CI: −38, 76; P = 0.56, K = 1.27), whereas there were 61 (95% CI: 8, 113; P = 0.92, K = 11.88) and 42 (95% CI: −7, 90; ; P = 0.90, K = 8.55) more bouts at days 7 and 8 than day 9, respectively. All effect sizes were nominal (d ≤ 0.02). Bout durations 128–255 secs: There were 10 fewer bouts (95% CI: −28, 9; P = 0.90, K = 3.56) at day 7 than baseline, whereas days 8 and 9 had similar numbers of bouts as baseline (P = 0.67–0.70, K = 2.01–2.30). The number of bouts did not substantially differ among days 7, 8, and 9 (P = 0.53–0.84, K = 1.12–5.23). All effect sizes were nominal (d ≤ 0.02). Bout durations 256–511 secs: Compared with baseline, there were 15 (95% CI: −21, −9; P > 0.99, K > 1,000), 10 (95% CI: −17, −4; P > 0.99, K = 520.73), and 6 (95% CI: −13, 1; P = 0.96, K = 23.54) fewer bouts at days 7, 8, and 9, respectively. There were also 4 fewer bouts at day 7 than day 8 (95% CI: −9, 0; P = 0.96, K = 27.31), 9 fewer bouts at day 7 than day 9 (95% CI: −14, −4; P > 0.99, K = 520.74), and 4 fewer bouts at day 8 than day 9 (95% CI: −10, 1; ; P = 0.87, K = 6.76). Effect sizes for differences between baseline and day 7, baseline and day 8, day 7 and day 8, and day 7 and day 9 were small (d = 0.12–0.21), whereas all other effect sizes were nominal (d ≤ 0.07). Bout durations ≥512 secs: Compared with baseline, there were 5 (95% CI: −7, −3; P > 0.99, K > 1,000), 5 (95% CI: −7, −3; P > 0.99, K > 1,000), and 4 (95% CI: −6, −2; P > 0.99, K > 1,000) fewer bouts at days 7, 8, and 9, respectively. The number of bouts at days 7 and 8 were similar (95% CI: −1, 1; P = 0.57, K = 1.32), but there was 1 fewer bout at day 7 than day 9 (95% CI: −2, 0; P = 0.93, K = 12.76) and 1 fewer bout at day 8 than day 9 (95% CI: −2, 0; ; P = 0.90, K = 8.75). Effect sizes for differences between baseline and day 7, baseline and day 8, and baseline and day 9 were medium (d = 0.51–0.71), whereas effect sizes between day 7 and day 9 and day 8 and day 9 were small (d = 0.32).
We hypothesized that a diffuse TBI in WT Aged mice would result in greater percentage sleep immediately following injury, with a shorter mean bout length, compared with pre-injury baseline sleep. This hypothesis was generally supported and TBI led to greater percentage sleep, specifically during the dark period, but shorter bouts during the light periods (Figure 5).
Figure 5:

Posterior marginal effects point estimates and 95% credible intervals of percentage of time slept and sleep bout lengths during the light and dark periods for WT Aged mice between baseline and post-traumatic sleep at days 7, 8, and 9 (1, 2, and 3 days post-TBI). (A) Percent sleep during the first light period (10:00AM to 7:59PM). (B) Percent sleep during the dark period (8:00PM to 5:59AM). (C) Percent sleep during the second light period (6:00AM to 9:59AM). (D) Sleep bout lengths during the first light period. (E) Sleep bout lengths during the dark period. (F) Sleep bout lengths during the second light period.
During the first light period (10:00AM to 7:59PM), WT Aged mice slept 3% more at day 7 (95% CI: −2.8, 9.1; P = 0.93, K = 14.04) but slept 5% less at day 8 (95% CI: −11.0, 1.3; P = 0.99, K = 98.17) and 5% less at day 9 (95% CI: −11.6, −0.9; P = 0.99, K = 170.43) compared with their baseline (Figure 5A; Supp. Tables A11, B11). There was no difference in percentage sleep between days 8 and 9 (95% CI: −5.9, 6.9; P = 0.59, K = 1.43), but mice slept 8% (95% CI: 1.9, 14.1; P > 0.99, K > 1,000) and 8% (95% CI: 2.3, 14.6; P > 0.99, K > 1,000) more at day 7 than days 8 and 9, respectively. Effect sizes for all percentage sleep differences during the first light period were very large (d = 4.25–10.78), except for the effect size between days 8 and 9, which was medium (d = 0.58).
During the first dark period, WT Aged mice slept 20% more at day 7 (95% CI: 14.1, 26.7; P > 0.99, K > 1,000), 23% more at day 8 (95% CI: 17.0, 29.6; P > 0.99, K > 1,000), and 9% more at day 9 (95% CI: 2.5, 15.0; P > 0.99, K > 1,000) compared with their baseline (Figure 5B; Supp. Tables A12, B12). There was not a substantial difference in percentage sleep between days 7 and 8 (95% CI: −3.7, 9.5; P = 0.88, K = 7.50), but mice slept 12% (95% CI: 5.1, 18.2; P > 0.99, K > 1,000) and 15% (95% CI: 8.0, 21.1; P > 0.99, K > 1,000) more at days 7 and 8 than day 9, respectively. Effect sizes for all percentage sleep differences during the first dark period were very large (d = 3.18–28.30).
During the second light period (6:00AM to 9:59AM), WT Aged mice slept 6% more at day 8 (95% CI: −3.3, 15.6; P = 0.96, K = 24.05) compared with their baseline, but slept similar percentages as their baseline at day 7 (95% CI: −7.3, 12.1; P = 0.75, K = 3.03) and day 9 (95% CI: −5.2, 13.9; P = 0.89, K = 8.13; Figure 5C; Supp. Tables A13, B13). There was no substantial difference in percentage sleep between days 8 and 9 (95% CI: −8.0, 11.2; P = 0.69, K = 2.26), but mice slept 9% (95% CI: −1.1, 18.2; P = 0.99, K = 106.14) and 7% (95% CI: −3.0, 16.5; P = 0.97, K = 28.63) more at day 7 than days 8 and 9, respectively. Effect sizes for all percentage sleep differences during the second light period were very large (d = 1.22–4.44), except for the effect size between days 8 and 9, which was large (d = 0.96).
Compared with baseline, WT Aged mice exhibited 30 secs (95% CI: −47, −12; P > 0.99, K > 1,000), 37 secs (95% CI: −54, −20; P > 0.99, K > 1,000), and 24 secs (95% CI: −42, −6; P > 0.99, K > 1,000) shorter bout lengths during the first light period (Figure 5D; Supp. Tables A14, B14). At day 7, mice had 8 secs (95% CI: −5, 20; P = 0.99, K = 183.62) longer bout lengths than day 8, but 6 secs (95% CI: −9, 20; P = 0.95, K = 19.69) shorter bout lengths than day 9; bout lengths at day 8 were 13 secs (95% CI: −27, 0; P > 0.99, K > 1,000) shorter than day 9. Effect sizes for all bout length differences during the first light period were very small (d ≤ 0.06).
During the dark period, bout lengths at day 7 were similar to baseline (95% CI: −6, 10; P = 0.79, K = 3.73), whereas bout lengths at days 8 and 9 were 8 secs (95% CI: −1, 17; P > 0.99, K > 1,000) and 4 secs (95% CI: −4, 13; P = 0.95, K = 18.39) longer than baseline, respectively (Figure 5E; Supp. Tables A15, B15). At day 7, bout lengths were 10 seconds (95% CI: −19, −1; P > 0.99, K > 1,000) and 6 seconds (95% CI: −14, 2; P = 0.99, K = 121.45) shorter than days 8 and 9, respectively. Bout lengths at day 8 were also 4 seconds (95% CI: −5, 14; P = 0.95, K = 17.29) longer than at day 9. Effect sizes for all bout length differences during the dark period were very small (d ≤ 0.06).
During the second light period, WT Aged mice had 24 secs (95% CI: −39, −9; P > 0.99, K > 1,000), 13 secs (95% CI: −29, 3; P > 0.99, K = 520.74), and 8 secs (95% CI: −25, 9; P = 0.96, K = 21.26) shorter bout lengths than at baseline (Figure 5F; Supp. Tables A16, B16). Bout lengths at day 7 were also 11 secs (95% CI: −25, 2; P > 0.99, K = 799.00) and 16 secs (95% CI: −30, −2; P > 0.99, K > 1,000) shorter than at days 8 and 9, respectively, whereas bout lengths were 5 secs (95% CI: −20, 10; P = 0.89, K = 8.06) shorter at day 8 compared with day 9. Effect sizes for all bout length differences during the second light period were very small (d ≤ 0.05).
Diffuse TBI in WT Aged mice led to more sleep with fragmented shorter bouts compared with aged 3xTg-AD mice.
We hypothesized that WT Aged mice subjected to diffuse TBI would exhibit similar levels of sleep compared to aged 3xTg-AD mice. This hypothesis was not supported. Diffuse TBI led to substantially more cumulative sleep comprised of shorter fragmented bouts compared with 3xTg-AD mice (Figure 6).
Figure 6:
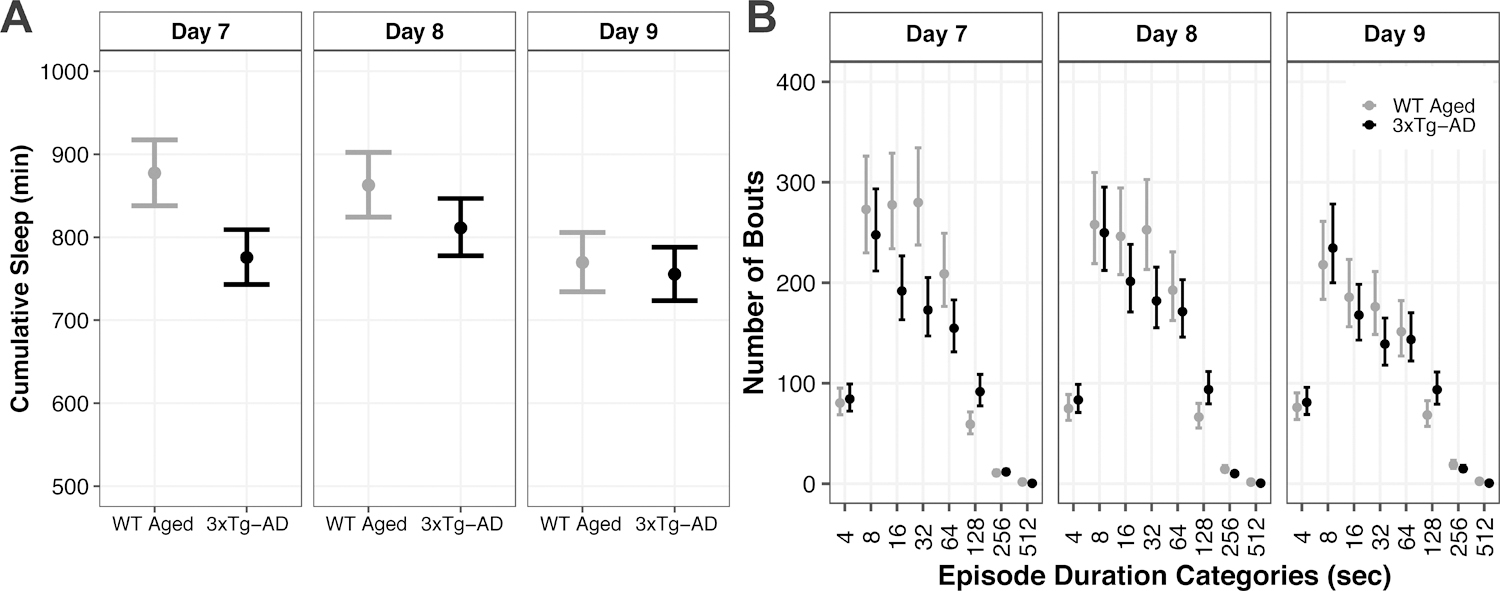
Posterior marginal effects point estimates and 95% credible intervals of (A) cumulative sleep (minutes) and (B) frequency of binned categories of sleep bout durations (seconds) between WT Aged mice after TBI and 3xTg-AD mice across days 7, 8, and 9.
At days 7 and 8, WT Aged TBI mice had 102 minutes (95% CI: 50, 153; P > 0.99, K > 1,000) and 51 minutes (95% CI: 1, 102; P = 0.97, K = 33.78) more cumulative sleep, respectively, than 3xTg-AD mice (Figure 6A; Supp. Tables A17, B17). At day 9, cumulative sleep was similar between WT Aged TBI and 3xTg-AD mice (95% CI: −33, 61; P = 0.72, K = 2.64). However, effect sizes for cumulative sleep differences were very small (d ≤ 0.02).
Bout durations 4–7 secs: WT Aged TBI and 3xTg-AD mice had similar numbers of bouts at day 7 (95% CI: −22, 14; P = 0.50, K = 1.00), day 8 (95% CI: −28, 10; P = 0.70, K = 2.36), and day 9 (95% CI: −23, 14; P = 0.53, K = 1.19; Figure 5B; Supp. Tables A18, B18). Bout durations 8–15 secs: TBI and AD mice had similar numbers of bouts at day 7 (95% CI: −37, 87; P = 0.83, K = 4.98), day 8 (95% CI: −51, 70; P = 0.69, K = 2.26), and day 9 (95% CI: −37, 70; P = 0.77, K = 2.31). Bout durations 16–31 secs: TBI mice had 84 (95% CI: 27, 142; P > 0.99, K > 1,000) and 45 (95% CI: −9, 100; P = 0.94, K = 15.19) more bouts than AD mice at days 7 and 8, respectively, whereas the number of bouts were similar at day 9 (95% CI: −25, 60; P = 0.82, K = 4.49). Bout durations 32–63 secs: TBI mice had 107 (95% CI: 50, 164; P > 0.99, K > 1,000), 71 (95% CI: 18, 125; P = 0.99, K = 89.23), and 37 (95% CI: −1, 76; P = 0.96, K = 22.86) more bouts than AD mice at days 7, 8, and 9, respectively.
Bout durations 64–127 secs: TBI mice had 53 more bouts than AD mice at day 7 (95% CI: 10, 97; P = 0.99, K = 399.00), but the number of bouts were similar at day 8 (95% CI: −23, 66; P = 0.84, K = 5.31) and day 9 (95% CI: −28, 44; P = 0.73, K = 2.74). Bout durations 128–255 secs: TBI mice had 32 (95% CI: 13, 51; P > 0.99, K > 1,000), 27 (95% CI: 7, 48; P = 0.96, K = 24.64), and 25 (95% CI: 5, 45; P = 0.95, K = 17.52) fewer bouts than AD mice at days 7, 8, and 9, respectively. Bout durations 256–511 secs: TBI and AD mice had similar number of bouts at day 7 (95% CI: −5, 3; P = 0.68, K = 2.13), whereas TBI mice had 4 (95% CI: 1, 8; P = 0.98, K = 63.52) and 4 (95% CI: −1, 9; P = 0.93, K = 14.00) more bouts than AD mice at days 8 and 9, respectively. Bout durations ≥512 secs: TBI mice had 1 (95% CI: 0, 2; P > 0.99, K > 1,000), 1 (95% CI: 0, 2; P = 0.99, K = 192.55), and 2 (95% CI: 1, 3; P > 0.99, K > 1,000) more bouts than AD mice at days 7, 8, and 9 respectively.
We hypothesized that WT aged mice subjected to diffuse TBI would exhibit similar percentages of sleep and mean bout lengths compared to aged 3xTg-AD mice. This hypothesis was not supported. Diffuse TBI led to a greater percent sleep and shorter mean bout lengths compared with 3xTg-AD mice (Figure 7).
Figure 7:

Posterior marginal effects point estimates and 95% credible intervals of percentage of time slept and sleep bout lengths during the light and dark periods at days 7, 8, and 9 between WT Aged TBI and 3xTg-AD mice. (A) Percent sleep during the first light period. (B) Percent sleep during the dark period. (C) Percent sleep during the second light period. (D Sleep bout lengths during the first light period. (E) Sleep bout lengths during the dark period. (F) Sleep bout lengths during the second light period.
During the first light period (10:00AM to 7:59PM), WT Aged TBI mice slept 9% (95% CI: 4.0, 14.4; P > 0.99, K > 1,000) and 3% (95% CI: −2.6, 8.5; P = 0.90, K = 7.86) more than 3xTg-AD mice at days 7 and 9, respectively, whereas percentage sleep was similar at day 8 (95% CI: −5.4, 5.6; P = 0.52, K = 1.08; Figure 7A; Supp. Tables A19, B19). During the dark period (8:00PM to 5:59AM), TBI mice slept 4% (95% CI: −1.2, 9.2; P = 0.98, K = 53.55) and 4% (95% CI: −1.5, 9.4; P = 0.97, K = 29.61) more than AD mice at days 7 and 8, respectively, whereas percentage sleep was similar at day 9 (95% CI: −7.9, 3.7; P = 0.88, K = 7.49; Figure 7B; Supp. Tables A20, B20). During the second light period (, TBI mice slept 6% (95% CI: −2.0, 14.5; P = 0.98, K = 48.79) and 10% (95% CI: 2.1, 18.1; P > 0.99, K = 225.42) more than AD mice at days 7 and 8, respectively, whereas percentage sleep was similar at day 9 (95% CI: −5.7, 10.5; P = 0.74, K = 2.82; Figure 7C; Supp. Tables A21, B21). Effect sizes for all percentage sleep differences were very large (d ≥ 1.87), except for the first light period at day 8, which was small (d = 0.20).
During the first light period, TBI and AD mice had similar bout lengths at day 7 (95% CI: −9.3, 15.1; P = 0.70, K = 2.01), day 8 (95% CI: −17.9, 5.9; P = 0.88, K = 7.44), and day 9 (95% CI: −11.3, 15.5; P = 0.63, K = 1.68; Figure 7D; Supp. Tables A22, B22). During the dark period, TBI mice had 9 sec (95% CI: −17.4, −1.2; P = 0.99, K = 372.62) shorter bout lengths than AD mice at day 7, whereas bout lengths were similar at day 8 (95% CI: −7.3, 10.5; P = 0.65, K = 1.83) and day 9 (95% CI: −7.4, 9.0; P = 0.58, K = 1.40; Figure 7E; Supp. Tables A23, B23). During the second light period, TBI mice had 7 sec (95% CI: −4.7, 18.7; P = 0.90, K = 8.51) longer bout lengths than AD mice at day 8, whereas bout lengths were similar at day 7 (95% CI: −15.0, 6.8; P = 0.85, K = 5.74) and day 9 (95% CI: −13.5, 13.9; P = 0.51, K = 1.04; Figure 7F; Supp. Tables A24, B24). Most effect sizes for bout lengths were very small (d ≤ 0.03), except for the dark period at day 7, which was small (d = 0.10).
Diffuse TBI in WT Aged mice resulted in more CD11b+Ly6G+ neutrophils and CD11b+Ly6Cint phagocytes but fewer CD11b+Ly6Chigh monocytes compared with 3xTg-AD mice.
We hypothesized that WT Aged mice subjected to diffuse TBI would have similar levels of inflammation, indicated by peripheral immune cells, as 3xTg-AD mice. This hypothesis was not supported. However, differences in immune cell populations between TBI and AD mice were incongruous, given the directionalities of those differences were dissimilar and varied by marker. WT Aged TBI mice had more neutrophils and intermediate phagocytes but fewer classical monocytes compared with 3xTg-AD mice (Figure 8).
Figure 8:

Posterior marginal effects point estimates and 95% credible intervals of monocytes and neutrophils in the blood at days 5 and 7 between WT Aged TBI and 3xTg-AD mice. (A) Representative flow cytometry plots are shown. Leukocyte populations were gated using forward scatter (FSC) and side scatter (SSC) for cell size and granularity, 80,000 CD45+ cells were collected. Of this population, CD11b+ events were gated. Final populations of Ly6Chigh, Ly6Cint, Ly6Clow monocytes and Ly6G+ neutrophils were gated and analyzed. (B) Populations of CD11b+ cells at days 5 and 7. (C) Populations of CD11b+Ly6Chigh cells at days 5 and 7. (D) Populations of CD11b+Ly6Clow monocytes at days 5 and 7. (E) Populations of CD11b+Ly6Cint cells at days 5 and 7. (F) Populations of CD11b+Ly6CintLy6G− monocytes at days 5 and 7. (G) Populations of CD11b+Ly6G+ neutrophils at days 5 and 7.
Leukocyte populations were gated using forward scatter (FSC) and side scatter (SSC) for cell size and granularity (Figure 8A). Myeloid (CD11b+) populations were similar between WT Aged and 3xTg-AD mice at both day 5 (95% CI: −7.79, 3.78; P = 0.67, K = 2.07) and day 7 (95% CI: −5.9, 5.9; P = 0.51, K = 1.05; Figure 8B; Supp. Tables A25, B25). However, WT Aged TBI and 3xTg-AD mice had 5% (95% CI: −1.00, 10.92; P = 0.99, K = 67.97) and 3% (95% CI: −2.78, 8.79; P = 0.95, K = 17.55) more myeloid populations, respectively, at day 7 compared with the respective day 5. Effect sizes for differences in myeloid populations were very large (d ≥ 1.53), except for between TBI and AD mice at day 7 (d = 0.00). WT Aged mice had 3% (95% CI: −5.26, 0.74; P = 0.99, K = 124.00) and 7% (95% CI: −9.12, −4.88; P > 0.99, K > 1,000) fewer “classical” monocyte (CD11b+ Ly6Chigh) populations than 3xTg-AD mice at both day 5 and day 7, respectively (Figure 8C; Supp. Tables A26, B26). Additionally, WT Aged TBI mice had 3% more classical monocyte populations at day 5 compared with day 7 (95% CI: 1.00, 5.01; P > 0.99, K > 1,000), whereas AD mice had similar classical monocytes at days 5 and 7 (95% CI: −3.36, 1.35; P = 0.74, K = 2.83). Effect sizes for differences in classical monocyte populations were very large (d ≥ 3.80). WT Aged mice had 6% fewer “non-classical” monocytes (CD11b+Ly6Clow) than 3xTg-AD mice at day 5 (95% CI: −13.59, 1.60; P = 0.94, K = 16.70), but populations were similar between them at day 7 (95% CI: −9.54, 5.55; P = 0.73, K = 2.75; Figure 8D; Supp. Tables A27, B27). WT Aged and AD mice had 3% (95% CI: −4.69, 10.70; P = 0.90, K = 8.19) and 7% (95% CI: −0.44, 14.37; P > 0.99, K = 460.54) more non-classical monocytes, respectively, at day 5 compared with their day 7. Effect sizes for differences in non-classical monocyte populations were very large (d ≥ 1.87).
WT Aged mice had 10% (95% CI: 3.21, 16.79; P > 0.99, K = 217.18) and 8% (95% CI: 1.00, 15.26; P = 0.99, K = 75.43) more Ly6C intermediate phagocyte (CD11b+Ly6Cint) populations than 3xTg-AD mice at days 5 and 7, respectively (Figure 8E; Supp. Tables A28, B28). WT Aged and AD mice had 6% (95% CI: −13.35, 1.34; P > 0.99, K = 460.54) and 8% (95% CI: −14.70, −1.30; P > 0.99, K = 799.00) fewer intermediate phagocytes, respectively, at day 5 compared with their day 7. Effect sizes for differences in intermediate phagocyte populations were very large (d ≥ 6.10).
At day 5 and day 7, WT Aged mice had 4% (95% CI: −5.88, −2.12; P > 0.99, K > 1,000) and 2% (95% CI: −3.29, 0.10; P = 0.96, K = 25.09) fewer “intermediate” monocyte (CD11b+Ly6CintLy6G−) populations, respectively, than 3xTg-AD mice (Figure 8F, Supp. Tables A29, B29). WT Aged mice had similar “intermediate” monocytes at days 5 and 7 (95% CI: −1.07, 2.26; P = 0.77, K = 3.43), whereas AD mice had 8% more “intermediate” monocytes at day 5 compared with day 7 (95% CI: 5.63, 9.43; P > 0.99, K > 1,000). Effect sizes for differences in “intermediate” monocyte populations were very large (d ≥ 1.20).
WT Aged mice had 12% (95% CI: 5.14, 18.86; P > 0.99, K > 1,000) and 13% (95% CI: 5.57, 20.43; P > 0.99, K = 922.08) more neutrophils (CD11b+Ly6G+) than 3xTg-AD mice at days 5 and 7, respectively (Figure 8G; Supp. Tables A30, B30). Additionally, WT Aged and AD mice had 5% (95% CI: −12.79, 2.78; P = 0.98, K = 51.17) and 4% (95% CI: −10.48, 2.44; P = 0.99, K = 86.59) fewer neutrophils, respectively, at day 5 compared with their day 7. Effect sizes for differences between groups within days were very large (d = 1.26–1.37), whereas effect sizes for differences between days within groups were small (d = 0.45–0.49).
Diffuse TBI in WT Aged mice resulted in higher IL-6 compared with pre-injury baseline levels and lower IL-1β compared with 3xTg-AD mice.
We hypothesized that diffuse TBI would result in greater peripheral cytokine concentrations in WT Aged mice compared with their pre-injury baseline levels, and that post-TBI levels would be comparable to aged 3xTg-AD mice. This hypothesis was not supported. TBI resulted in greater IL-6, no change in IL-1β, and lower TNF-α compared with pre-injury baseline levels (Figure 9). TBI also resulted in higher IL-6, lower IL-1β, and similar TNF-α levels compared with aged 3xTg-AD mice.
Figure 9:

Posterior marginal effects point estimates and 95% credible intervals of IL-6, IL-1β, and TNF-α levels in the blood of WT Aged and 3xTg-AD mice at day 7. (A) Concentration of IL-6 at days 5 and 7. (B) Concentration of IL-1β at days 5 and 7. (C) Concentration of TNF-α at days 5 and 7.
WT Aged and 3xTg-AD mice had similar IL-6 concentrations at day 5 (95% CI: −26.43, 15.49; P = 0.71, K = 2.40), whereas WT Aged TBI mice had 28.60 pg/mL greater concentrations than AD mice at day 7 (95% CI: −16.04, 73.24; P = 0.90, K = 9.51; Figure 9A; Supp. Tables A31, B31). WT Aged and AD mice had 62.23 pg/mL (95% CI: 23.24, 101.22; P > 0.99, K > 1,000) and 28.16 pg/mL (95% CI: −2.03, 58.35; P > 0.99, K = 205.90) greater IL-6 concentrations, respectively, at day 7 compared with day 5. Effect sizes for all differences in IL-6 concentrations were nominal (d ≤ 0.02). WT Aged mice had 4.05 pg/mL (95% CI: −7.66, −0.44; P = 0.99, K = 67.57) and 4.76 pg/mL (95% CI: −8.34, −1.18; P > 0.99, K = 202.39) lower concentrations of IL-1β than 3xTg-AD mice at days 5 and 7, respectively (Figure 9B; Supp. Tables A32, B32). However, IL-1 β concentrations were similar between days 5 and 7 for WT Aged mice (95% CI: −2.49, 3.45; P = 0.80, K = 3.99) and AD mice (95% CI: −4.35, 3.89; P = 0.61, K = 1.59). Effect sizes for differences in IL-1 β concentrations were small (d ≤ 0.19).
WT Aged and 3xTg-AD mice had similar TNF-α concentrations at day 5 (95% CI: −11.58, 12.28; P = 0.52, K = 1.07) and day 7 (95% CI: −15.92, 7.71; P = 0.75, K = 2.95; Figure 9C; Supp. Tables A33, B33). WT Aged TBI mice had 2.24 pg/mL lower TNF-α at day 7 compared with their day 5 (95% CI: −14.12, 9.64; P = 0.92, K = 12.20), whereas AD mice had 2.21 pg/mL higher TNF-α at day 7 compared with their day 5 (95% CI: −9.65, 14.07; P = 0.92, K = 11.13). Effect sizes for differences in TNF-α concentrations were nominal (d ≤ 0.02).
Cognitive deficits were indistinguishable between WT Aged TBI and 3xTg-AD mice.
We hypothesized that diffuse TBI would result in cognitive deficits similar to a genetic model of AD. This hypothesis was supported, considering performance on the open field and NOR tasks were generally similar between aged mice subjected to TBI and 3xTg-AD mice. In the open field assessment for anxiety-like behavior, WT Aged TBI mice traveled 283 cm further than 3xTg-AD mice (95% CI: −182, 748; P = 0.90, K = 7.68; Figure 10A; Supp. Tables A34, B34) but spent a similar amount of time in the center of the open field (95% CI: −11, 9; P = 0.62, K = 1.61; Figure 10B; Supp. Tables A35, B35). In the novel object recognition cognitive assessment, WT Aged TBI mice and AD mice had similar DI values (95% CI: −0.45, 0.42; P = 0.53, K = 1.14; Figure 10C; Supp. Tables A36, B36).
Figure 10:

Posterior marginal effects point estimates and 95% credible intervals of open field and novel object recognition testing in 3xTg-AD and WT Aged TBI mice. (A) Distance traveled in open field. (B) Time spent in center of open field. (C) Discrimination index scores for novel object recognition. Dark gray region represents preference for the new object (DI = 0.25 to 1), light gray region represents preference for the old object (DI = −1 to −0.25), and white region represents no preference for either object (DI = −0.25 to 0.25).
Cumulative sleep did not predict changes in blood monocytes, plasma IL-6, or NOR DI.
We hypothesized that levels of cumulative sleep could predict changes in inflammation (e.g., peripheral monocyte populations, IL-6 cytokine levels) and cognitive performance on the NOR task. This hypothesis was not supported. There was no support for cumulative sleep being predictive of blood CD11b+Ly6Chigh monocyte populations at Day 7 (θCumSleep:Genetics = 0.03 [95% CI: −0.30, 0.36], P = 0.58, K = 1.38; Figure 11A), plasma IL-6 at Day 7 (θCumSleep:Genetics = 0.00 [95% CI: −0.91, 0.90], P = 0.50, K = 1.00; Figure 11B), or DI measure at Day 10 (θCumSleep:Genetics = 0.02 [95% CI: −1.88, 1.91], P = 0.50, K = 1.01; Figure 11C).
Figure 11:

Posterior marginal effects point estimates and 95% credible intervals from models that investigated if cumulative sleep was linearly predictive of inflammation or cognitive performance. (A) CD11b+Ly6Chigh monocytes, (B) IL-6, and (C) novel object recognition discrimination index, accounting for genetics.
Diffuse TBI in WT Aged mice led to microglial activation in the absence of amyloid pathology compared with 3xTg-AD mice that had activated microglia and amyloid plaque pathology.
We hypothesized that diffuse TBI would lead to activated microglia and that aged 3xTg-AD mice would have both activated microglia and significant amyloid pathology. This hypothesis was supported, considering WT Aged mice had activated microglia following a TBI, but no amyloid pathology, whereas 3xTg-AD mice had robust amyloid staining and activated microglia (Figure 12). Activated microglia were evident surrounding amyloid plaques in 3xTg-AD mice.
Figure 12:

Histological representation of amyloid pathology and microglial activation. Representative images for amyloid staining for (A) WT Aged control and (B) 3xTg-AD. (C) Representative image for immunofluorescence for 3xTg-AD mouse with an example of microglial activation surrounding amyloid plaques (arrow). Representative images of microglia (Iba1) in (D) WT Aged mice with an example of a ramified microglia (arrow), (E) WT Aged TBI mice with an example of an activated microglia defined by enlarged cell body and retraction of processes (arrow), and (F) 3xTg-AD with an example of an activated microglia (arrow).
Discussion
Sleep quality declines with age in both mice and humans, and distinct sleep-wake alterations are strongly associated with both TBI and AD, which collectively can impair patients’ quality of life (Cordone, Annarumma, Rossini, & De Gennaro, 2019; Sandsmark et al., 2017; Witting, Kwa, Eikelenboom, Mirmiran, & Swaab, 1990). Despite a high prevalence of sleep disturbances in these patient populations, particularly the elderly, strategies to restore sleep quality and treat the underlying causes of these disturbances remain scarce. Few studies have compared both sleep and inflammation between TBI and AD to elucidate potential pathophysiological pathways that may serve as therapeutic targets. Therefore, we investigated sleep and inflammation in aged mice subjected to diffuse TBI and a genetic mouse model of AD.
Our results provide considerable evidence that TBI resulted in WT Aged mice sleeping substantially more than AD mice during the first 24–48 hours following injury, which contradicts our hypothesis. Interestingly, the greatest period-specific differences in sleep between TBI and AD mice occurred during the light periods, when mice subjected to TBI slept considerably more. In contrast, excessive sleep during the dark period is typical following TBI in young adult mice (Rowe, Harrison, O’Hara, & Lifshitz, 2014a; Rowe, Striz, et al., 2014; Willie et al., 2012). Thus, the light period-specific sleep discrepancies between TBI and AD suggest that changes in sleep may occur during different periods with age, depending on the type of neurodegenerative condition. This is an important age-related insight into the mechanisms of sleep-wake disturbances after injury and degenerative conditions, because alterations in sleep could be an early indicator for neuroinflammatory conditions (dos Santos, Barreto, & Kohlmeier, 2014; dos Santos, Kohlmeier, & Barreto, 2015). To our knowledge, this study is among the first to identify differential sleep alterations between experimental TBI in aged mice and AD.
Consistent with previously published studies, we found strong evidence of age-specific and AD-specific changes in sleep, absent of TBI (Musiek, 2015; Musiek & Holtzman, 2016; Soltani et al., 2019; Wimmer et al., 2013). Uninjured WT Aged mice slept more and exhibited a higher frequency of shorter bouts than 2-month-old adult mice at baseline. Additionally, AD mice slept more, with a higher percentage sleep during the dark period (homologous with naps), than both younger WT Adult and uninjured WT Aged mice, and also exhibited a higher frequency of shorter sleep bouts than WT Adult mice. This latter finding is consistent with previous transgenic AD mouse studies that concluded shorter bout lengths suggest increased sleep fragmentation and disruption in sleep consolidation (Duncan et al., 2012; Sethi et al., 2015). In our study, 3xTg-AD mice also had a higher frequency of bouts that were longer in duration than the average bout length reported for female 5XFAD mice, a transgenic AD mouse strain with <60 seconds average bout length (Sethi et al., 2015). Further studies are needed to investigate if the long bouts measured in our study are related to changes in vigilance states.
This is also one of the first studies to investigate sleep after experimental TBI in aged mice, and we found that WT Aged mice subjected to diffuse TBI slept substantially more than their pre-injury baseline, particularly during the dark (active) period. This is consistent with the elevated acute post-traumatic sleep documented in previous studies of younger mice (Rowe, Harrison, Morrison, et al., 2018; Rowe, Striz, et al., 2014; Saber et al., 2019), thereby demonstrating that the sleep WT Aged mice exhibited reflected the expected increase in sleep following experimental TBI. Compared with their baseline sleep, WT Aged mice subjected to TBI also exhibited substantially more sleep bouts of short durations (<1 minute), which is indicative of sleep fragmentation and poor sleep quality. Clinical TBI data suggest excessive daytime sleepiness and sleep fragmentation are common sleep phenotypes in TBI survivors (Sandsmark et al., 2017).
Increased inflammation may be associated with greater cumulative sleep and reduced quality of sleep (Krueger et al., 1995; Medic, Wille, & Hemels, 2017; Rohleder, Aringer, & Boentert, 2012). For example, elevated sleep regulatory cytokines (i.e., IL-6, IL-1β, TNF-α) in the brain occur immediately after TBI and have been linked to increased sleep (Morganti-Kossman et al., 1997; Opp, 2005; Rowe, Striz, et al., 2014; Ziebell & Morganti-Kossmann, 2010). Although we found some support for the inflammatory profiles in the acute and sub-acute phase of TBI being different than that of the AD model, the results were incongruous and demonstrated no consistency. Both TBI and AD mice had robust microglia activation. These activated microglia were evident surrounding amyloid plaques in our AD mice, which is consistent with previous findings that 3xTg-AD mice showed microgliosis and an age-dependent accumulation of plaques by 12-months of age (Belfiore et al., 2019). Furthermore, cumulative sleep was not predictive of inflammation for either TBI or AD mice. Thus, our results collectively do not lend sufficient support for discerning the magnitude or direction by which inflammation may differ between TBI and AD but do suggest that direct relationships between sleep and inflammation may dissipate with age, assuming our predictive models accurately described biological processes.
Experimental models of TBI and AD are also often associated with cognitive deficits and changes in anxiety-like behavior (Breitve et al., 2016; McInnes, Friesen, MacKenzie, Westwood, & Boe, 2017; Rowe, Harrison, Morrison, et al., 2018; Rowe, Ziebell, et al., 2016; Sterniczuk, Dyck, LaFerla, & Antle, 2010). We found that TBI and AD mice exhibited similar deficits and performance across all behavioral tests, thereby strongly supporting the notion that these diseases likely have similar impacts on cognition and anxiety in the elderly. We note that the mice we used are generally less ambulatory and exploratory than other background strains, though similar to C57BL/6 (Lueptow, 2017; Sik, van Nieuwehuyzen, Prickaerts, & Blokland, 2003); the cognitive testing duration also may have been shorter than necessary to detect differences (Sterniczuk, Antle, LaFerla, & Dyck, 2010). Nevertheless, similar to our results for inflammation, cumulative sleep was not predictive of cognitive performance for either TBI or AD mice. Considering the observed differences in sleep but similarity in cognitive deficits, this suggests that cognitive deficits from both diseases may not be directly related to changes in sleep behavior.
Our study does have some limitations, including the use of non-invasive piezoelectric cages, which limit the discrimination of sleep stages. However, measuring sleep following experimental models of TBI and genetic models of AD using piezoelectric sleep cages is well described in the literature and represents an appropriate, validated alternative to EEG recordings (Duncan et al., 2019; Duncan et al., 2012; Rowe, Harrison, Morrison, et al., 2018; Rowe, Striz, et al., 2014; Saber et al., 2019). Another potential limitation was the use of only female mice, given the mounting evidence for sex-specific differences in sleep and inflammation following experimental TBI (Saber et al., 2019). Furthermore, although female mice are common in studies that use the 3xTg-AD strain, TBI literature strongly suggests that sex may be a biological variable that influences symptoms and recovery of function (Berry et al., 2009; Farace & Alves, 2000; Saber et al., 2019; Villapol, Loane, & Burns, 2017). Future similar studies as ours should include both sexes and disaggregate data to account for sex-dependent differences in outcome measures. Finally, our study was also limited by the number of WT Aged mice that were age-matched to our transgenic AD model and available for use; consequently, we did not have a sufficient sample size to include a sham surgery group for WT Aged mice. Uninjured sham mice typically exhibit minimal changes in sleep and inflammation (Saber et al., 2019), but future studies using WT Aged mice should include age-matched sham controls to confirm the strength and magnitude of our post-TBI results.
Conclusions and Future Directions
Both TBI and AD in the aging population are major health concerns that require an age-appropriate approach to clinical care. This study provides substantial evidence that unique pathological sleep pathways may exist in elderly that incur TBI compared with similarly aged individuals that have AD. Furthermore, sleep may be an effective biomarker for TBI in aged female mice, extending this utility beyond young adults. TBI in the elderly may present differently in terms of sleep disturbances which provides clinical information for improving diagnoses and treatment of TBI.
Supplementary Material
Significance Statement:
Translational models for aging and TBI remain scarce, though elderly populations (≥65 years old) have the highest risk of developing AD and/or obtaining a TBI. TBI and AD share similar pathophysiology, including disturbed sleep, increased inflammation, and cognitive behavioral deficits. TBI is also one of the primary environmental risk factors for development of AD. However, few studies have compared sleep and inflammation in TBI and AD to elucidate potential pathophysiological pathways. This study provides evidence that unique pathological sleep pathways may exist in older individuals that incur TBI compared with similarly aged individuals that have AD.
Acknowledgments
The authors would like to thank Salvatore Oddo for providing the aged mice used in these studies.
Funding
This research was funded by NIH-R21-NS096515, Arizona Alzheimer’s Consortium, T32-AG044402, and Phoenix Children’s Hospital Mission Support funds
Footnotes
Conflict of Interest
The authors declare that the research was conducted in the absence of any commercial or financial relationships that could be construed as a potential conflict of interest.
Data Availability Statement
Data provided privately for peer-reviewers at the following link, but will be publicly available in the Dryad Digital Repository upon manuscript acceptance: https://datadryad.org/stash/share/h33IGnGdr-iKO_cH-V6BDwX1OgVirk7m-B4uQfuASEI
References
- Aarts E, Dolan CV, Verhage M, & van der Sluis S (2015). Multilevel analysis quantifies variation in the experimental effect while optimizing power and preventing false positives. BMC Neurosci, 16 10.1186/s12868-015-0228-5 [DOI] [PMC free article] [PubMed] [Google Scholar]
- Aarts E, Verhage M, Veenvliet JV, Dolan CV, & van der Sluis S (2014). A solution to dependency: using multilevel analysis to accommodate nested data. Nature neuroscience, 17(4), 491–496. 10.1038/nn.3648 [DOI] [PubMed] [Google Scholar]
- Akiyama H, Barger S, Barnum S, Bradt B, Bauer J, Cole GM, … Wyss-Coray T (2000). Inflammation and Alzheimer’s disease. Neurobiol Aging, 21(3), 383–421. doi: S019745800000124X [pii] [DOI] [PMC free article] [PubMed] [Google Scholar]
- Ancoli-Israel S, Klauber MR, Butters N, Parker L, & Kripke DF (1991). Dementia in institutionalized elderly: relation to sleep apnea. J Am Geriatr Soc, 39(3), 258–263. 10.1111/j.1532-5415.1991.tb01647.x [DOI] [PubMed] [Google Scholar]
- Bamberger ME, & Landreth GE (2002). Inflammation, apoptosis, and Alzheimer’s disease. Neuroscientist, 8(3), 276–283. [DOI] [PubMed] [Google Scholar]
- Baugh CM, Stamm JM, Riley DO, Gavett BE, Shenton ME, Lin A, … Stern RA (2012). Chronic traumatic encephalopathy: neurodegeneration following repetitive concussive and subconcussive brain trauma. Brain Imaging Behav, 6(2), 244–254. 10.1007/s11682-012-9164-5 [DOI] [PubMed] [Google Scholar]
- Baumann CR (2012). Traumatic brain injury and disturbed sleep and wakefulness. Neuromolecular medicine. [DOI] [PubMed]
- Baumann CR, Werth E, Stocker R, Ludwig S, & Bassetti CL (2007). Sleep-wake disturbances 6 months after traumatic brain injury: a prospective study. Brain, 130(Pt 7), 1873–1883. 10.1093/brain/awm109 [DOI] [PubMed] [Google Scholar]
- Belfiore R, Rodin A, Ferreira E, Velazquez R, Branca C, Caccamo A, & Oddo S (2019). Temporal and regional progression of Alzheimer’s disease-like pathology in 3xTg-AD mice. Aging Cell, 18(1). 10.1111/acel.12873 [DOI] [PMC free article] [PubMed] [Google Scholar]
- Berry C, Ley EJ, Tillou A, Cryer G, Margulies DR, & Salim A (2009). The effect of gender on patients with moderate to severe head injuries. J Trauma, 67(5), 950–953. 10.1097/TA.0b013e3181ba3354 [DOI] [PubMed] [Google Scholar]
- Brambor T, Clark WR, & Golder M (2006). Understanding interaction models: Improving empirical analyses. Political Analysis, 14(1), 63–82. 10.1093/pan/mpi014 [DOI] [Google Scholar]
- Breitve MH, Hynninen MJ, Bronnick K, Chwiszczuk LJ, Auestad BH, Aarsland D, & Rongve A (2016). A longitudinal study of anxiety and cognitive decline in dementia with Lewy bodies and Alzheimer’s disease. Alzheimers Res Ther, 8, 3 10.1186/s13195-016-0171-4 [DOI] [PMC free article] [PubMed] [Google Scholar]
- Burkner PC (2017). brms: An R Package for Bayesian Multilevel Models Using Stan. Journal of Statistical Software, 80(1), 1–28. 10.18637/jss.v080.i01 [DOI] [Google Scholar]
- Burkner PC (2018). Advanced Bayesian Multilevel Modeling with the R Package brms. R Journal, 10(1), 395–411. [Google Scholar]
- Button KS, Ioannidis JPA, Mokrysz C, Nosek BA, Flint J, Robinson ESJ, & Munafo MR (2013). Power failure: why small sample size undermines the reliability of neuroscience. Nature Reviews Neuroscience, 14(5), 365–376. 10.1038/nrn3475 [DOI] [PubMed] [Google Scholar]
- Carpenter B, Gelman A, Hoffman MD, Lee D, Goodrich B, Betancourt M, … Riddell A (2017). Stan: A Probabilistic Programming Language. Journal of Statistical Software, 76(1), 1–29. 10.18637/jss.v076.i01 [DOI] [PMC free article] [PubMed] [Google Scholar]
- Ciaburro G (2018). Regression Analysis with R : Design and develop statistical nodes to identify unique relationships within data at scale. Birmingham, UK: Packt Publishing Ltd. [Google Scholar]
- Cohen J (1988). Statistical power analysis for the behavioral sciences (2nd ed.). Hillsdale, N.J.: L. Erlbaum Associates. [Google Scholar]
- Cordone S, Annarumma L, Rossini PM, & De Gennaro L (2019). Sleep and beta-Amyloid Deposition in Alzheimer Disease: Insights on Mechanisms and Possible Innovative Treatments. Front Pharmacol, 10, 695 10.3389/fphar.2019.00695 [DOI] [PMC free article] [PubMed] [Google Scholar]
- Donohue KD, Medonza DC, Crane ER, & O’Hara BF (2008). Assessment of a non-invasive high-throughput classifier for behaviours associated with sleep and wake in mice. Biomed Eng Online, 7, 14 10.1186/1475-925X-7-14 [DOI] [PMC free article] [PubMed] [Google Scholar]
- dos Santos AB, Barreto GE, & Kohlmeier KA (2014). Treatment of sleeping disorders should be considered in clinical management of Parkinson’s disease. Front Aging Neurosci, 6 doi:ARTN 273 [DOI] [PMC free article] [PubMed] [Google Scholar]
- dos Santos AB, Kohlmeier KA, & Barreto GE (2015). Are sleep disturbances preclinical markers of Parkinson’s disease? Neurochem Res, 40(3), 421–427. 10.1007/s11064-014-1488-7 [DOI] [PubMed] [Google Scholar]
- Duncan MJ, Farlow H, Tirumalaraju C, Yun DH, Wang C, Howard JA, … Bachstetter AD. (2019). Effects of the dual orexin receptor antagonist DORA-22 on sleep in 5XFAD mice. Alzheimers Dement (N Y), 5, 70–80. 10.1016/j.trci.2019.01.003 [DOI] [PMC free article] [PubMed] [Google Scholar]
- Duncan MJ, Smith JT, Franklin KM, Beckett TL, Murphy MP, St Clair DK, … O’Hara BF (2012). Effects of aging and genotype on circadian rhythms, sleep, and clock gene expression in APPxPS1 knock-in mice, a model for Alzheimer’s disease. Exp Neurol, 236(2), 249–258. 10.1016/j.expneurol.2012.05.011 [DOI] [PubMed] [Google Scholar]
- Espiritu JRD (2008). Age-related sleep changes. Clinics in Geriatric Medicine, 24(1). 10.1016/j.cger.2007.08.007 [DOI] [PubMed] [Google Scholar]
- Faden AI, & Loane DJ (2015). Chronic neurodegeneration after traumatic brain injury: Alzheimer disease, chronic traumatic encephalopathy, or persistent neuroinflammation? Neurotherapeutics, 12(1), 143–150. 10.1007/s13311-014-0319-5 [DOI] [PMC free article] [PubMed] [Google Scholar]
- Farace E, & Alves WM (2000). Do women fare worse? A metaanalysis of gender differences in outcome after traumatic brain injury. Neurosurg Focus, 8(1), e6. [DOI] [PubMed] [Google Scholar]
- Ferrari SLP, & Cribari-Neto F (2004). Beta regression for modelling rates and proportions. Journal of Applied Statistics, 31(7), 799–815. 10.1080/0266476042000214501 [DOI] [Google Scholar]
- Figueroa-Zuniga JI, Arellano-Valle RB, & Ferrari SLP (2013). Mixed beta regression: A Bayesian perspective. Computational Statistics & Data Analysis, 61, 137–147. 10.1016/j.csda.2012.12.002 [DOI] [Google Scholar]
- Flanagan SR, Hibbard MR, & Gordon WA (2005). The impact of age on traumatic brain injury. Phys Med Rehabil Clin N Am, 16(1), 163–177. 10.1016/j.pmr.2004.06.012 [DOI] [PubMed] [Google Scholar]
- Gabry J, Mahr. (2019). Bayesplot: Plotting for Bayesian Models (Version R Package Version 1.7.0).
- Gabry J, Simpson D, Vehtari A, Betancourt M, & Gelman A (2019). Visualization in Bayesian workflow. Journal of the Royal Statistical Society Series a-Statistics in Society, 182(2), 389–402. 10.1111/rssa.12378 [DOI] [Google Scholar]
- Gavett BE, Stern RA, Cantu RC, Nowinski CJ, & McKee AC (2010). Mild traumatic brain injury: a risk factor for neurodegeneration. Alzheimers Res Ther, 2(3), 18 10.1186/alzrt42 [DOI] [PMC free article] [PubMed] [Google Scholar]
- Gelman A, Carlin JB, Stern HS, Dunson DB, Vehtari A, Rubin DB (2013). Bayesian Data Analysis: Model checking and improvement (3 ed.). Boca Raton, FL, USA: CRC Press. [Google Scholar]
- Gelman A, Rubin DB (1992). Inference from iterative simulation using multiple sequences. Statistical Science, 7(4), 457–472. [Google Scholar]
- Gelman A, Shirlet K (2011). Inference from simulations and monitoring convergence. Boca Raton, FL, USA: CRC Press. [Google Scholar]
- Giordano KR, Denman CR, Dollish HK, Fernandez F, Lifshitz J, Akhter M, & Rowe RK (2020). Intracerebral hemorrhage in the mouse altered sleep-wake patterns and activated microglia. Exp Neurol, 327, 113242 10.1016/j.expneurol.2020.113242 [DOI] [PubMed] [Google Scholar]
- Green TRF, Ortiz JB, Wonnacott S, Williams RJ, & Rowe RK (2020). The bidirectional relationship between sleep and inflammation links traumatic brain injury and alzheimer’s disease. Frontiers in Neuroscience, 14:894 10.3389/fnins.2020.00894 [DOI] [PMC free article] [PubMed] [Google Scholar]
- Guarnieri B, Adorni F, Musicco M, Appollonio I, Bonanni E, Caffarra P, … Sorbi S (2012). Prevalence of sleep disturbances in mild cognitive impairment and dementing disorders: a multicenter Italian clinical cross-sectional study on 431 patients. Dement Geriatr Cogn Disord, 33(1), 50–58. 10.1159/000335363 [DOI] [PMC free article] [PubMed] [Google Scholar]
- Harrison JL, Rowe RK, Ellis TW, Yee NS, O’Hara BF, Adelson PD, & Lifshitz J (2015). Resolvins AT-D1 and E1 differentially impact functional outcome, post-traumatic sleep, and microglial activation following diffuse brain injury in the mouse. Brain Behav Immun, 47, 131–140. 10.1016/j.bbi.2015.01.001 [DOI] [PMC free article] [PubMed] [Google Scholar]
- Hilbe JM (2014). Negative Binomial Regression. Modeling Count Data, 126–161. 10.1017/Cbo9781139236065 [DOI]
- Iboaya A, Harris JL, Arickx AN, & Nudo RJ (2019). Models of Traumatic Brain Injury in Aged Animals: A Clinical Perspective. Neurorehabil Neural Repair, 33(12), 975–988. 10.1177/1545968319883879 [DOI] [PMC free article] [PubMed] [Google Scholar]
- Imbach LL, Buchele F, Valko PO, Li T, Maric A, Stover JF, … Baumann CR (2016). Sleep-wake disorders persist 18 months after traumatic brain injury but remain underrecognized. Neurology, 86(21), 1945–1949. 10.1212/WNL.0000000000002697 [DOI] [PubMed] [Google Scholar]
- Johnson VE, Stewart W, & Smith DH (2010). Traumatic brain injury and amyloid-beta pathology: a link to Alzheimer’s disease? Nat Rev Neurosci, 11(5), 361–370. 10.1038/nrn2808 [DOI] [PMC free article] [PubMed] [Google Scholar]
- Johnson VE, Stewart W, & Smith DH (2012). Widespread tau and amyloid-Beta pathology many years after a single traumatic brain injury in humans. Brain Pathol, 22(2), 142–149. 10.1111/j.1750-3639.2011.00513.x [DOI] [PMC free article] [PubMed] [Google Scholar]
- Kilkenny C, Browne WJ, Cuthill IC, Emerson M, & Altman DG (2010). Improving bioscience research reporting: the ARRIVE guidelines for reporting animal research. PLoS Biol, 8(6), e1000412 10.1371/journal.pbio.1000412 [DOI] [PMC free article] [PubMed] [Google Scholar]
- Kokiko-Cochran ON, & Godbout JP (2018). The Inflammatory Continuum of Traumatic Brain Injury and Alzheimer’s Disease. Frontiers in immunology, 9, 672 10.3389/fimmu.2018.00672 [DOI] [PMC free article] [PubMed] [Google Scholar]
- Krueger JM, Obal F, Fang JD, Kubota T, & Taishi P (2001). The role of cytokines in physiological sleep regulation. Role of Neural Plasticity in Chemical Intolerance, 933, 211–221. [DOI] [PubMed] [Google Scholar]
- Krueger JM, Rector DM, & Churchill L (2007). Sleep and Cytokines. Sleep Med Clin, 2(2), 161–169. [DOI] [PMC free article] [PubMed] [Google Scholar]
- Krueger JM, Takahashi S, Kapas L, Bredow S, Roky R, Fang JD, … Obal F (1995). Cytokines in sleep regulation. Advances in Neuroimmunology, 5(2), 171–188. [DOI] [PubMed] [Google Scholar]
- Kruschke JK (2013). Bayesian Estimation Supersedes the t Test. Journal of Experimental Psychology-General, 142(2), 573–603. 10.1037/a0029146 [DOI] [PubMed] [Google Scholar]
- Kunkle BW, Grenier-Boley B, Sims R, Bis JC, Damotte V, Naj AC, … Environmental Risk for Alzheimer’s Disease, C. (2019). Genetic meta-analysis of diagnosed Alzheimer’s disease identifies new risk loci and implicates Abeta, tau, immunity and lipid processing. Nat Genet, 51(3), 414–430. 10.1038/s41588-019-0358-2 [DOI] [PMC free article] [PubMed] [Google Scholar]
- Langlois JA, Rutland-Brown W, & Wald MM (2006). The epidemiology and impact of traumatic brain injury: a brief overview. J Head Trauma Rehabil, 21(5), 375–378. [DOI] [PubMed] [Google Scholar]
- Liguori C, Spanetta M, Izzi F, Franchini F, Nuccetelli M, Sancesario GM, … Placidi F (2020). Sleep-Wake Cycle in Alzheimer’s Disease Is Associated with Tau Pathology and Orexin Dysregulation. J Alzheimers Dis, 74(2), 501–508. 10.3233/JAD-191124 [DOI] [PubMed] [Google Scholar]
- Lueptow LM (2017). Novel Object Recognition Test for the Investigation of Learning and Memory in Mice. Jove-Journal of Visualized Experiments(126). 10.3791/55718 [DOI] [PMC free article] [PubMed] [Google Scholar]
- Mander BA, Winer JR, Jagust WJ, & Walker MP (2016). Sleep: A Novel Mechanistic Pathway, Biomarker, and Treatment Target in the Pathology of Alzheimer’s Disease? Trends Neurosci, 39(8), 552–566. 10.1016/j.tins.2016.05.002 [DOI] [PMC free article] [PubMed] [Google Scholar]
- Mang GM, Nicod J, Emmenegger Y, Donohue KD, O’Hara BF, & Franken P (2014). Evaluation of a piezoelectric system as an alternative to electroencephalogram/ electromyogram recordings in mouse sleep studies. Sleep, 37(8), 1383–1392. 10.5665/sleep.3936 [DOI] [PMC free article] [PubMed] [Google Scholar]
- Mattis J, & Sehgal A (2016). Circadian Rhythms, Sleep, and Disorders of Aging. Trends Endocrinol Metab, 27(4), 192–203. 10.1016/j.tem.2016.02.003 [DOI] [PMC free article] [PubMed] [Google Scholar]
- McInnes K, Friesen CL, MacKenzie DE, Westwood DA, & Boe SG (2017). Mild Traumatic Brain Injury (mTBI) and chronic cognitive impairment: A scoping review. PLoS One, 12(4), e0174847 10.1371/journal.pone.0174847 [DOI] [PMC free article] [PubMed] [Google Scholar]
- McNeish D (2016). On Using Bayesian Methods to Address Small Sample Problems. Structural Equation Modeling-a Multidisciplinary Journal, 23(5), 750–773. 10.1080/10705511.2016.1186549 [DOI] [Google Scholar]
- Medic G, Wille M, & Hemels ME (2017). Short- and long-term health consequences of sleep disruption. Nat Sci Sleep, 9, 151–161. 10.2147/NSS.S134864 [DOI] [PMC free article] [PubMed] [Google Scholar]
- Miyata S, Noda A, Iwamoto K, Kawano N, Okuda M, & Ozaki N (2013). Poor sleep quality impairs cognitive performance in older adults. J Sleep Res, 22(5), 535–541. 10.1111/jsr.12054 [DOI] [PubMed] [Google Scholar]
- Morganti-Kossman MC, Lenzlinger PM, Hans V, Stahel P, Csuka E, Ammann E, … Kossmann T (1997). Production of cytokines following brain injury: beneficial and deleterious for the damaged tissue. Mol Psychiatry, 2(2), 133–136. 10.1038/sj.mp.4000227 [DOI] [PubMed] [Google Scholar]
- Musiek ES (2015). Circadian clock disruption in neurodegenerative diseases: cause and effect? Front Pharmacol, 6, 29 10.3389/fphar.2015.00029 [DOI] [PMC free article] [PubMed] [Google Scholar]
- Musiek ES, & Holtzman DM (2016). Mechanisms linking circadian clocks, sleep, and neurodegeneration. Science, 354(6315), 1004–1008. 10.1126/science.aah4968 [DOI] [PMC free article] [PubMed] [Google Scholar]
- Myers BL, & Badia P (1995). Changes in circadian rhythms and sleep quality with aging: mechanisms and interventions. Neurosci Biobehav Rev, 19(4), 553–571. 10.1016/0149-7634(95)00018-6 [DOI] [PubMed] [Google Scholar]
- Newcombe EA, Camats-Perna J, Silva ML, Valmas N, Huat TJ, & Medeiros R (2018). Inflammation: the link between comorbidities, genetics, and Alzheimer’s disease. J Neuroinflammation, 15(1), 276 10.1186/s12974-018-1313-3 [DOI] [PMC free article] [PubMed] [Google Scholar]
- Opp MR (2005). Cytokines and sleep. Sleep Med Rev, 9(5), 355–364. 10.1016/j.smrv.2005.01.002 [DOI] [PubMed] [Google Scholar]
- Perperoglou A, Sauerbrei W, Abrahamowicz M, Schmid M, & Initiative TS (2019). A review of spline function procedures in R. Bmc Medical Research Methodology, 19 10.1186/s12874-019-0666-3 [DOI] [PMC free article] [PubMed] [Google Scholar]
- Prinz PN, Vitaliano PP, Vitiello MV, Bokan J, Raskind M, Peskind E, & Gerber C (1982). Sleep, EEG and mental function changes in senile dementia of the Alzheimer’s type. Neurobiol Aging, 3(4), 361–370. 10.1016/0197-4580(82)90024-0 [DOI] [PubMed] [Google Scholar]
- Puntambekar SS, Saber M, Lamb BT, & Kokiko-Cochran ON (2018). Cellular players that shape evolving pathology and neurodegeneration following traumatic brain injury. Brain Behav Immun, 71, 9–17. 10.1016/j.bbi.2018.03.033 [DOI] [PubMed] [Google Scholar]
- R Core Team. (2019). R: A language and environment for statistical computing. R Foundation for Statistical Computing, Vienna, Austria,. [Google Scholar]
- Rietz S, & Hagel K (1999). [Falls incurred by the elderly resulting in injury: pathogenesis and rehabilitation]. Rehabilitation (Stuttg), 38(1), 16–19. [PubMed] [Google Scholar]
- Rohleder N, Aringer M, & Boentert M (2012). Role of interleukin-6 in stress, sleep, and fatigue. Ann N Y Acad Sci, 1261, 88–96. 10.1111/j.1749-6632.2012.06634.x [DOI] [PubMed] [Google Scholar]
- Rosenberg RN, Fu M, & Lambracht-Washington D (2018). Active full-length DNA Abeta42 immunization in 3xTg-AD mice reduces not only amyloid deposition but also tau pathology. Alzheimers Res Ther, 10(1), 115 10.1186/s13195-018-0441-4 [DOI] [PMC free article] [PubMed] [Google Scholar]
- Rowe RK, Griffiths DR, & Lifshitz J (2016). Midline (Central) Fluid Percussion Model of Traumatic Brain Injury. Methods Mol Biol, 1462, 211–230. 10.1007/978-1-4939-3816-2_13 [DOI] [PubMed] [Google Scholar]
- Rowe RK, Harrison JL, Morrison H, Subbian V, Murphy SM, & Lifshitz J (2018). Acute post-traumatic sleep may define vulnerability to a second traumatic brain injury in mice. J Neurotrauma. 10.1089/neu.2018.5980 [DOI] [PMC free article] [PubMed]
- Rowe RK, Harrison JL, O’Hara BF, & Lifshitz J (2014a). Diffuse brain injury does not affect chronic sleep patterns in the mouse. Brain Inj, 28(4), 504–510. 10.3109/02699052.2014.888768 [DOI] [PMC free article] [PubMed] [Google Scholar]
- Rowe RK, Harrison JL, O’Hara BF, & Lifshitz J (2014b). Recovery of neurological function despite immediate sleep disruption following diffuse brain injury in the mouse: clinical relevance to medically untreated concussion. Sleep, 37(4), 743–752. 10.5665/sleep.3582 [DOI] [PMC free article] [PubMed] [Google Scholar]
- Rowe RK, Harrison JL, Zhang H, Bachstetter AD, Hesson DP, O’Hara BF, … Lifshitz J (2018). Novel TNF receptor-1 inhibitors identified as potential therapeutic candidates for traumatic brain injury. J Neuroinflammation, 15(1), 154 10.1186/s12974-018-1200-y [DOI] [PMC free article] [PubMed] [Google Scholar]
- Rowe RK, Striz M, Bachstetter AD, Van Eldik LJ, Donohue KD, O’Hara BF, & Lifshitz J (2014). Diffuse brain injury induces acute post-traumatic sleep. PLoS One, 9(1), e82507 10.1371/journal.pone.0082507 [DOI] [PMC free article] [PubMed] [Google Scholar]
- Rowe RK, Ziebell JM, Harrison JL, Law LM, Adelson PD, & Lifshitz J (2016). Aging with Traumatic Brain Injury: Effects of Age at Injury on Behavioral Outcome following Diffuse Brain Injury in Rats. Dev Neurosci. 10.1159/000446773 [DOI] [PubMed]
- Saber M, Giordano KR, Hur Y, Ortiz JB, Morrison H, Godbout JP, … Rowe RK (2019). Acute peripheral inflammation and post-traumatic sleep differ between sexes after experimental diffuse brain injury. Eur J Neurosci. 10.1111/ejn.14611 [DOI] [PMC free article] [PubMed]
- Saber M, Rice AD, Christie I, Roberts RG, Knox KS, Nakaji P, … Lifshitz J (2020). Remote Ischemic Conditioning Reduced Acute Lung Injury After Traumatic Brain Injury in The Mouse. Shock. 10.1097/SHK.0000000000001618 [DOI] [PMC free article] [PubMed]
- Sandsmark DK, Elliott JE, & Lim MM (2017). Sleep-Wake Disturbances After Traumatic Brain Injury: Synthesis of Human and Animal Studies. Sleep, 40(5). 10.1093/sleep/zsx044 [DOI] [PMC free article] [PubMed] [Google Scholar]
- Sawilowsky SS (2009). New Effect Size Rule of Thumb. Journal of Modern Applied Statistical Methods, 8(2), 597–599. 10.22237/jmasm/1257035100 [DOI] [Google Scholar]
- Sethi M, Joshi SS, Webb RL, Beckett TL, Donohue KD, Murphy MP, … Duncan MJ (2015). Increased Fragmentation of Sleep-Wake Cycles in the 5xfad Mouse Model of Alzheimer’s Disease. Neuroscience, 290, 80–89. 10.1016/j.neuroscience.2015.01.035 [DOI] [PMC free article] [PubMed] [Google Scholar]
- Sik A, van Nieuwehuyzen P, Prickaerts J, & Blokland A (2003). Performance of different mouse strains in an object recognition task. Behavioural brain research, 147(1–2), 49–54. 10.1016/S0166-4328(03)00117-7 [DOI] [PubMed] [Google Scholar]
- Simpson N, & Dinges DF (2007). Sleep and inflammation. Nutr Rev, 65(12 Pt 2), S244–252. 10.1111/j.1753-4887.2007.tb00371.x [DOI] [PubMed] [Google Scholar]
- Soltani S, Chauvette S, Bukhtiyarova O, Lina JM, Dube J, Seigneur J, … Timofeev I (2019). Sleep-Wake Cycle in Young and Older Mice. Front Syst Neurosci, 13, 51 10.3389/fnsys.2019.00051 [DOI] [PMC free article] [PubMed] [Google Scholar]
- Sterniczuk R, Antle MC, LaFerla FM, & Dyck RH (2010). Characterization of the 3xTg-AD mouse model of Alzheimer’s disease: Part 2. Behavioral and cognitive changes. Brain Res, 1348, 149–155. 10.1016/j.brainres.2010.06.011 [DOI] [PubMed] [Google Scholar]
- Sterniczuk R, Dyck RH, LaFerla FM, & Antle MC (2010). Characterization of the 3xTg-AD mouse model of Alzheimer’s disease: Part 1. Circadian changes. Brain Res, 1348, 139–148. 10.1016/j.brainres.2010.05.013 [DOI] [PubMed] [Google Scholar]
- Stevens JA, & Adekoya N (2001). Brain injury resulting from falls among elderly persons. JAMA : the journal of the American Medical Association, 286(21), 2665–2666. 10.1001/jama.286.21.2665 [DOI] [PubMed] [Google Scholar]
- Susman M, DiRusso SM, Sullivan T, Risucci D, Nealon P, Cuff S, … Benzil D (2002). Traumatic brain injury in the elderly: increased mortality and worse functional outcome at discharge despite lower injury severity. The Journal of trauma, 53(2), 219–223; discussion 223–214. [DOI] [PubMed] [Google Scholar]
- Torres-Lista V, De la Fuente M, & Gimenez-Llort L (2017). Survival Curves and Behavioral Profiles of Female 3xTg-AD Mice Surviving to 18-Months of Age as Compared to Mice with Normal Aging. J Alzheimers Dis Rep, 1(1), 47–57. 10.3233/ADR-170011 [DOI] [PMC free article] [PubMed] [Google Scholar]
- van de Schoot R, Broere JJ, Perryck KH, Zondervan-Zwijnenburg M, & van Loey NE (2015). Analyzing small data sets using Bayesian estimation: the case of posttraumatic stress symptoms following mechanical ventilation in burn survivors. European Journal of Psychotraumatology, 6 10.3402/ejpt.v6.25216 [DOI] [PMC free article] [PubMed] [Google Scholar]
- Villapol S, Loane DJ, & Burns MP (2017). Sexual dimorphism in the inflammatory response to traumatic brain injury. Glia, 65(9), 1423–1438. 10.1002/glia.23171 [DOI] [PMC free article] [PubMed] [Google Scholar]
- Wei L, Wen YT, Thompson HJ, Liu CY, Su YK, Chen PY, … Chiu HY (2020). Sleep Disturbances Following Traumatic Brain Injury in Older Adults: A Comparison Study. J Head Trauma Rehabil, 35(4), 288–295. 10.1097/HTR.0000000000000563 [DOI] [PubMed] [Google Scholar]
- West BT, Welch KB, Gałecki AT, & Gillespie BW (2015). Linear mixed models : a practical guide using statistical software (Second edition. ed.). Boca Raton: CRC Press, Taylor & Francis Group. [Google Scholar]
- Willie JT, Lim MM, Bennett RE, Azarion AA, Schwetye KE, & Brody DL (2012). Controlled cortical impact traumatic brain injury acutely disrupts wakefulness and extracellular orexin dynamics as determined by intracerebral microdialysis in mice. J Neurotrauma, 29(10), 1908–1921. 10.1089/neu.2012.2404 [DOI] [PMC free article] [PubMed] [Google Scholar]
- Wimmer ME, Rising J, Galante RJ, Wyner A, Pack AI, & Abel T (2013). Aging in Mice Reduces the Ability to Sustain Sleep/Wake States. PLoS One, 8(12). 10.1371/journal.pone.0081880 [DOI] [PMC free article] [PubMed] [Google Scholar]
- Witting W, Kwa IH, Eikelenboom P, Mirmiran M, & Swaab DF (1990). Alterations in the circadian rest-activity rhythm in aging and Alzheimer’s disease. Biol Psychiatry, 27(6), 563–572. 10.1016/0006-3223(90)90523-5 [DOI] [PubMed] [Google Scholar]
- Wu L (2010). Mixed effects models for complex data. Boca Raton: Chapman & Hall/CRC Press. [Google Scholar]
- Yang JT, Wang ZJ, Cai HY, Yuan L, Hu MM, Wu MN, & Qi JS (2018). Sex Differences in Neuropathology and Cognitive Behavior in APP/PS1/tau Triple-Transgenic Mouse Model of Alzheimer’s Disease. Neurosci Bull, 34(5), 736–746. 10.1007/s12264-018-0268-9 [DOI] [PMC free article] [PubMed] [Google Scholar]
- Ziebell JM, & Morganti-Kossmann MC (2010). Involvement of pro- and anti-inflammatory cytokines and chemokines in the pathophysiology of traumatic brain injury. Neurotherapeutics, 7(1), 22–30. 10.1016/j.nurt.2009.10.016 [DOI] [PMC free article] [PubMed] [Google Scholar]
- Zondervan-Zwijnenburg M, Peeters M, Depaoli S, & Van de Schoot R (2017). Where Do Priors Come From? Applying Guidelines to Construct Informative Priors in Small Sample Research. Research in Human Development, 14(4), 305–320. 10.1080/15427609.2017.1370966 [DOI] [Google Scholar]
Associated Data
This section collects any data citations, data availability statements, or supplementary materials included in this article.