

Abstract
Scalp-recorded frequency-following responses (FFRs) reflect a mixture of phase-locked activity across the auditory pathway. FFRs have been widely used as a neural barometer of complex listening skills, especially speech-in noise (SIN) perception. Applying individually optimized source reconstruction to speech-FFRs recorded via EEG (FFREEG), we assessed the relative contributions of subcortical [auditory nerve (AN), brainstem/midbrain (BS)] and cortical [bilateral primary auditory cortex, PAC] source generators with the aim of identifying which source(s) drive the brain-behavior relation between FFRs and SIN listening skills. We found FFR strength declined precipitously from AN to PAC, consistent with diminishing phase-locking along the ascending auditory neuroaxis. FFRs to the speech fundamental (F0) were robust to noise across sources, but were largest in subcortical sources (BS > AN > PAC). PAC FFRs were only weakly observed above the noise floor and only at the low pitch of speech (F0≈100 Hz). Brain-behavior regressions revealed (i) AN and BS FFRs were sufficient to describe listeners’ QuickSIN scores and (ii) contrary to neuromagnetic (MEG) FFRs, neither left nor right PAC FFREEG related to SIN performance. Our findings suggest subcortical sources not only dominate the electrical FFR but also the link between speech-FFRs and SIN processing in normal-hearing adults as observed in previous EEG studies.
Keywords: Auditory event-related potentials (ERPs), auditory brainstem response (ABR), cocktail party scenario, cortical FFR, noise-degraded speech perception
1. INTRODUCTION
The frequency-following response (FFR) has provided considerable insight into how well auditory neural coding relates to perception, particularly speech-in-noise (SIN) listening skills. FFRs are neurophonic potentials generated by a mixture of subcortical and cortical structures along the auditory system that phase-lock to spectrotemporal features of periodic sounds including speech. Links between speech-FFRs (recorded with EEG) and SIN processing have been widely reported over the past decade [e.g., 9, 27, 28, 32, 38, 40]. For instance, Song, et al. [38] showed the magnitude of the speech fundamental frequency (F0) encoded via FFRs was associated with performance on the QuickSIN [17]: “Top SIN” performers on the task had more robust FFRs than “Bottom SIN” performers, who had both weaker neural representation of the speech F0 and poorer perceptual scores. Indeed, poorer (i.e., lower median) SIN listeners experience greater (~0.5–1 ms) noise-related shifts in the timing of their speech FFR than top performing listeners [1]. These findings suggest a relationship between FFRs to complex sounds and SIN perception, whereby faster and more robust speech encoding is associated with better behavioral outcomes.
Though traditionally viewed as a brainstem potential [37], it has long been recognized there are multiple sources of FFRs stemming from throughout the hearing pathway. These include the cochlea [36], auditory nerve [5, 6], upper brainstem (midbrain inferior colliculus) [5, 6, 37], and under some circumstances, primary auditory cortex [6, 12]. EEG studies have interpreted FFR correlates of SIN perception based on how well (brainstem) FFRs encode important acoustic properties of speech (e.g., voice pitch and timbre cues) [9, 27, 28, 38]. Still, acknowledging FFRs likely contain contributions from cortex for low-frequency (~100 Hz) stimuli [6, 12], it is possible the link between this neurophonic and SIN behaviors is at least partially driven by higher-level “cortical FFRs” [cf. 12, 13]. Based on MEG, it has been suggested higher-level cognitive tasks such as SIN perception were dominated by FFRs generated in right auditory cortex [13, see also 15]. This finding is in stark contrast to the brainstem-centric view of the FFR and its relation to auditory perception [19, 28, 32, 38, 41, 42].
We suspect ambiguity of cortical vs. subcortical structures in accounting for perceptual correlates via FFR might be driven by limitations of different neuroimaging modalities. Whereas subcortical structures are among the most significant sources of the scalp FFREEG [5, 6, 30], MEG is more sensitive to superficial neuronal activity [deep brainstem sources become invisible; 14, 19]. Given the differential pickup of deeper brainstem (EEG) vs. shallower cortical (MEG) contributions to the FFR, it is reasonable to assume that imaging modality could bias associations between FFR and behavior. Moreover, phantom simulation studies reveal MEG localization accuracy of deep sources is greater for gradiometer vs. magnetometer recordings [most MEG-FFR studies use the former; 12, 13, 30], suggesting the detection of neuromagnetic brainstem activity depends even on the choice of sensor itself [2]. Because FFRs are recorded more commonly with EEG, we were interested to reevaluate the neural origin(s) of the FFREEG-SIN association to determine which subcortical and/or cortical structure(s) drives this relation.
In light of emerging controversies on sources of the FFR and their relation to complex auditory behaviors [6, 12], we aimed to unravel the link between speech-FFRs and SIN processing using a more comprehensive, systems-level neuroimaging approach. Using high-density EEG, we recorded multichannel FFRs to noise-degraded speech. Source analysis allowed us to parse region-specific activity underlying the electrical FFR and evaluate the relative contributions of each nuclei to SIN perception. Our findings show phase-locked activity peripheral to cortex dominates the EEG-based FFR as well as its link to perceptual speech-in-noise listening abilities.
2. METHODS
2.1. Participants
Data herein represent FFRs originally recorded in n=12 normal-hearing adults (age: 24.7±2.7 years) [7]. All participants were native English speakers with a similar level of education (undergraduate degree or higher) and <3 years formal music training (1.3±1.8 years) that occurred at least five years before the study. Hearing thresholds were normal (≤ 25 dBHL) bilaterally at octave frequencies between 250–8000 Hz in all participants. All gave written informed consent for the study protocol approved by the University of Memphis Institutional Review Board.
2.2. Stimuli
FFRs were elicited by a 300 ms male speech token /ama/ [for details, see 7]. The F0 pitch fell gradually over its duration (F0= 120–88 Hz). The low F0 of the stimulus (~100 Hz) was expected to elicit phase-locked FFRs of both subcortical and cortical origin [6, 12]. In addition to this “clean” stimulus, speech was presented in continuous four-talker babble noise [17] at signal-to-noise ratios (SNRs) of +10 and +5 dB. Listeners heard 2000 trials of each speech token (passive listening) per noise block presented at 81 dB SPL through ER-30 insert earphones (Etymotic Research). Extended acoustic tubing (20 ft) with the headphone transducers placed outside the booth avoided electromagnetic stimulus artifact from contaminating FFRs.
2.3. EEG
EEG recording and preprocessing followed previous reports [7]. EEGs were digitized (5000 Hz sampling rate; online filters = DC-2500 Hz) from 64 electrodes at 10–10 scalp locations. EEGs were then ocular artifact corrected, epoched (−200–550 ms), baseline corrected, common average referenced, and ensemble averaged to obtain FFRs for each noise condition. Responses were bandpass filtered (80–1500 Hz) for subsequent source analysis.
2.3.1. Source waveform derivations.
Scalp FFRs (sensor-level recordings) were transformed to source space using a virtual source montage implemented in BESA® Research v7 (BESA, GmbH) [7]. This digital re-montaging applies a spatial filter to all electrodes (defined by the foci of our dipole configuration) to transform electrode recordings to a reduced set of source signals reflecting the neuronal current (in units nAm) as seen within each anatomical region of interest. We adopted the dipole configuration described in Bidelman [6] to assess the relative contribution of subcortical and cortical FFR sources to SIN processing. Full details of this model, its derivation, and fit accuracy are reported elsewhere [6]. The model consisted of 5 dipoles seeded in bilateral auditory cortex (PAC; source #1–2), the upper brainstem (midbrain inferior colliculus) (BS; source #3), and bilateral auditory nerve (AN; sources #4–5) (Fig. 2, inset). This allowed us to reduce listeners’ electrode recordings (64-channels) to 5 unmixed source waveforms describing their scalp FFR data. For each participant, dipole locations were held fixed and were used as a spatial filter to derive FFR source waveforms [6]. Critically, we fit individual dipole orientations to each participant’s data (anatomical locations remained fixed) to maximize the explained variance of the model at the individual subject level. The model provided a robust fit to the grand averaged (clean) scalp data across subjects in post-stimulus response interval (0–350 ms; goodness of fit: 77%1). Additional latency and spatial sensitivity analysis verified anatomical plausibility and good spatial separability of this dipole model (Fig. S1 and S2).
Figure 2: Source-level FFR waveforms and spectra along the ascending auditory neuroaxis.
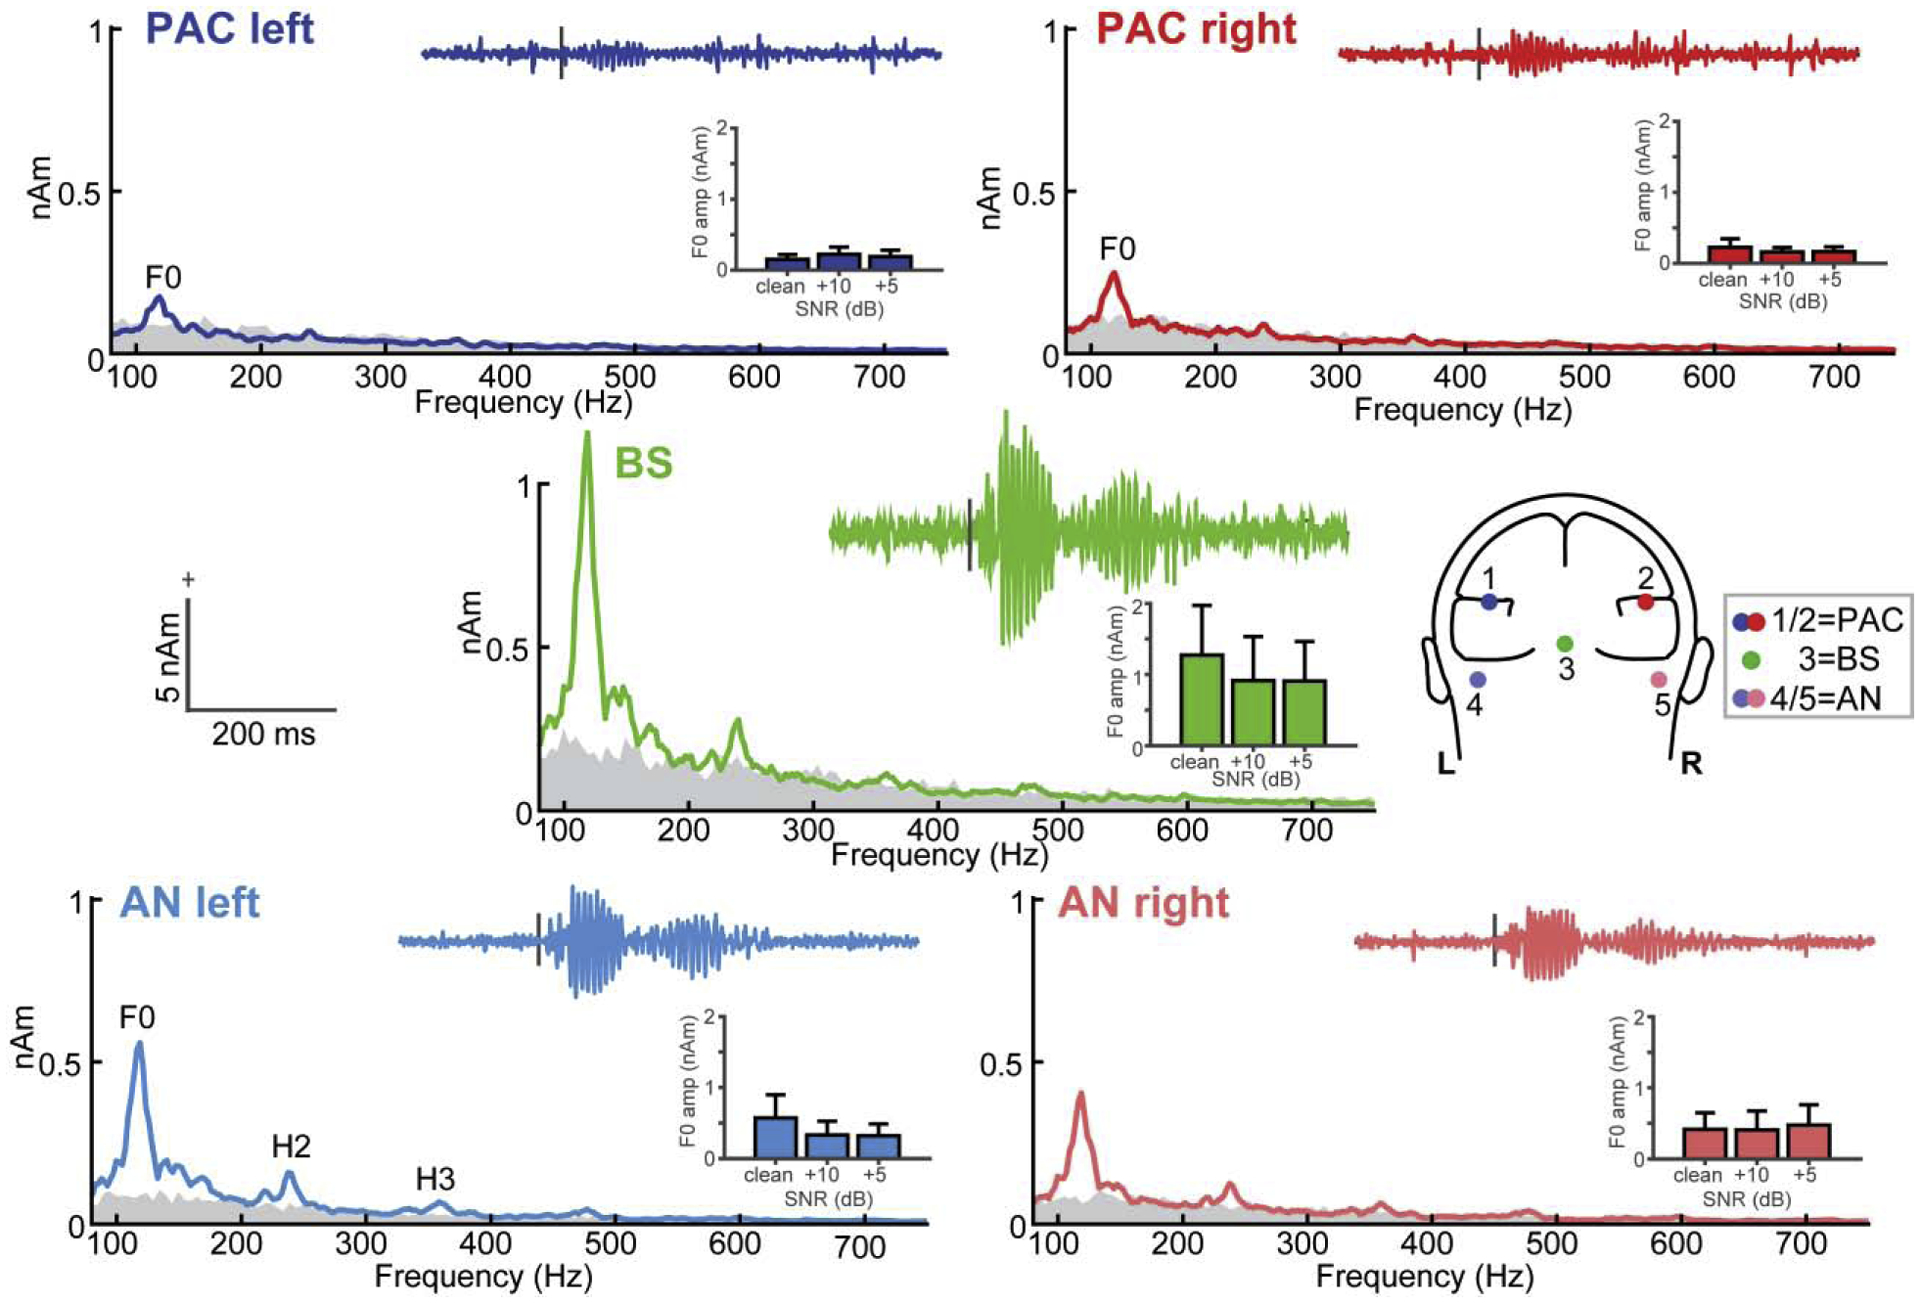
Grand average response spectra and waveforms (insets) at each dipole source of the FFR [head model; 6]. Waveforms and FFRs reflect responses to clean speech. Inset bar charts show noise-related changes in FFR F0. Gray shading = spectral noise floor measured in the pre-stimulus interval. FFRs show strong phase-locking at the speech F0 frequency (~100 Hz) in both subcortical and cortical sources. Subcortical sources (AN, BS) show additional response energy at higher harmonics of speech (H2 and H3). errorbars = ±1 s.e.m.
2.3.2. FFR source waveform analysis.
FFR source waveforms were analyzed in the spectral domain via BESA. From each waveform (per source, SNR, and listener), we first computed Fast Fourier Transforms (FFTs) in the post-stimulus response interval (0–350 ms, cos² windowed; 211 point FFT= 2.4 Hz resolution; see Fig. 1, shading). We then measured the peak amplitude in the F0 frequency bin. We focused on F0 because (i) this component was present across all sources of the FFR (see Fig. 2) and thus could be measured at each anatomical level and (ii) FFR-F0 has been explicitly related to SIN processing in previous EEG studies [7, 9, 29, 31, 34]. F0 amplitude was measured as the maximum spectral peak within the frequency range of 88–120 Hz [i.e., the F0 range of the stimulus pitch prosody; 7], relative to the noise floor [computed via the FFT of the pre-stimulus interval (−200–0ms)—interpolated to match the frequency resolution of the post-stimulus FFT]. Subtracting pre-stimulus from post-stimulus interval amplitudes thus retained only evoked neural responses (i.e., FFRs) above the EEG noise floor. Values below the noise floor where recorded as missing values [28/180 (15%) observations across all subjects, sources, and noise levels, 13 of which were from PAC]. This allowed us to assess the degree to which subcortical and cortical FFR sources showed veridical phase-locked activity (i.e., above noise-floor). For each source/SNR/participant, F0 measurements were scored twice and subsequently averaged. Test-retest reliability was excellent (r = 0.99).
Figure 1: FFR (sensor-level) waveforms and scalp topographies as a function of noise.
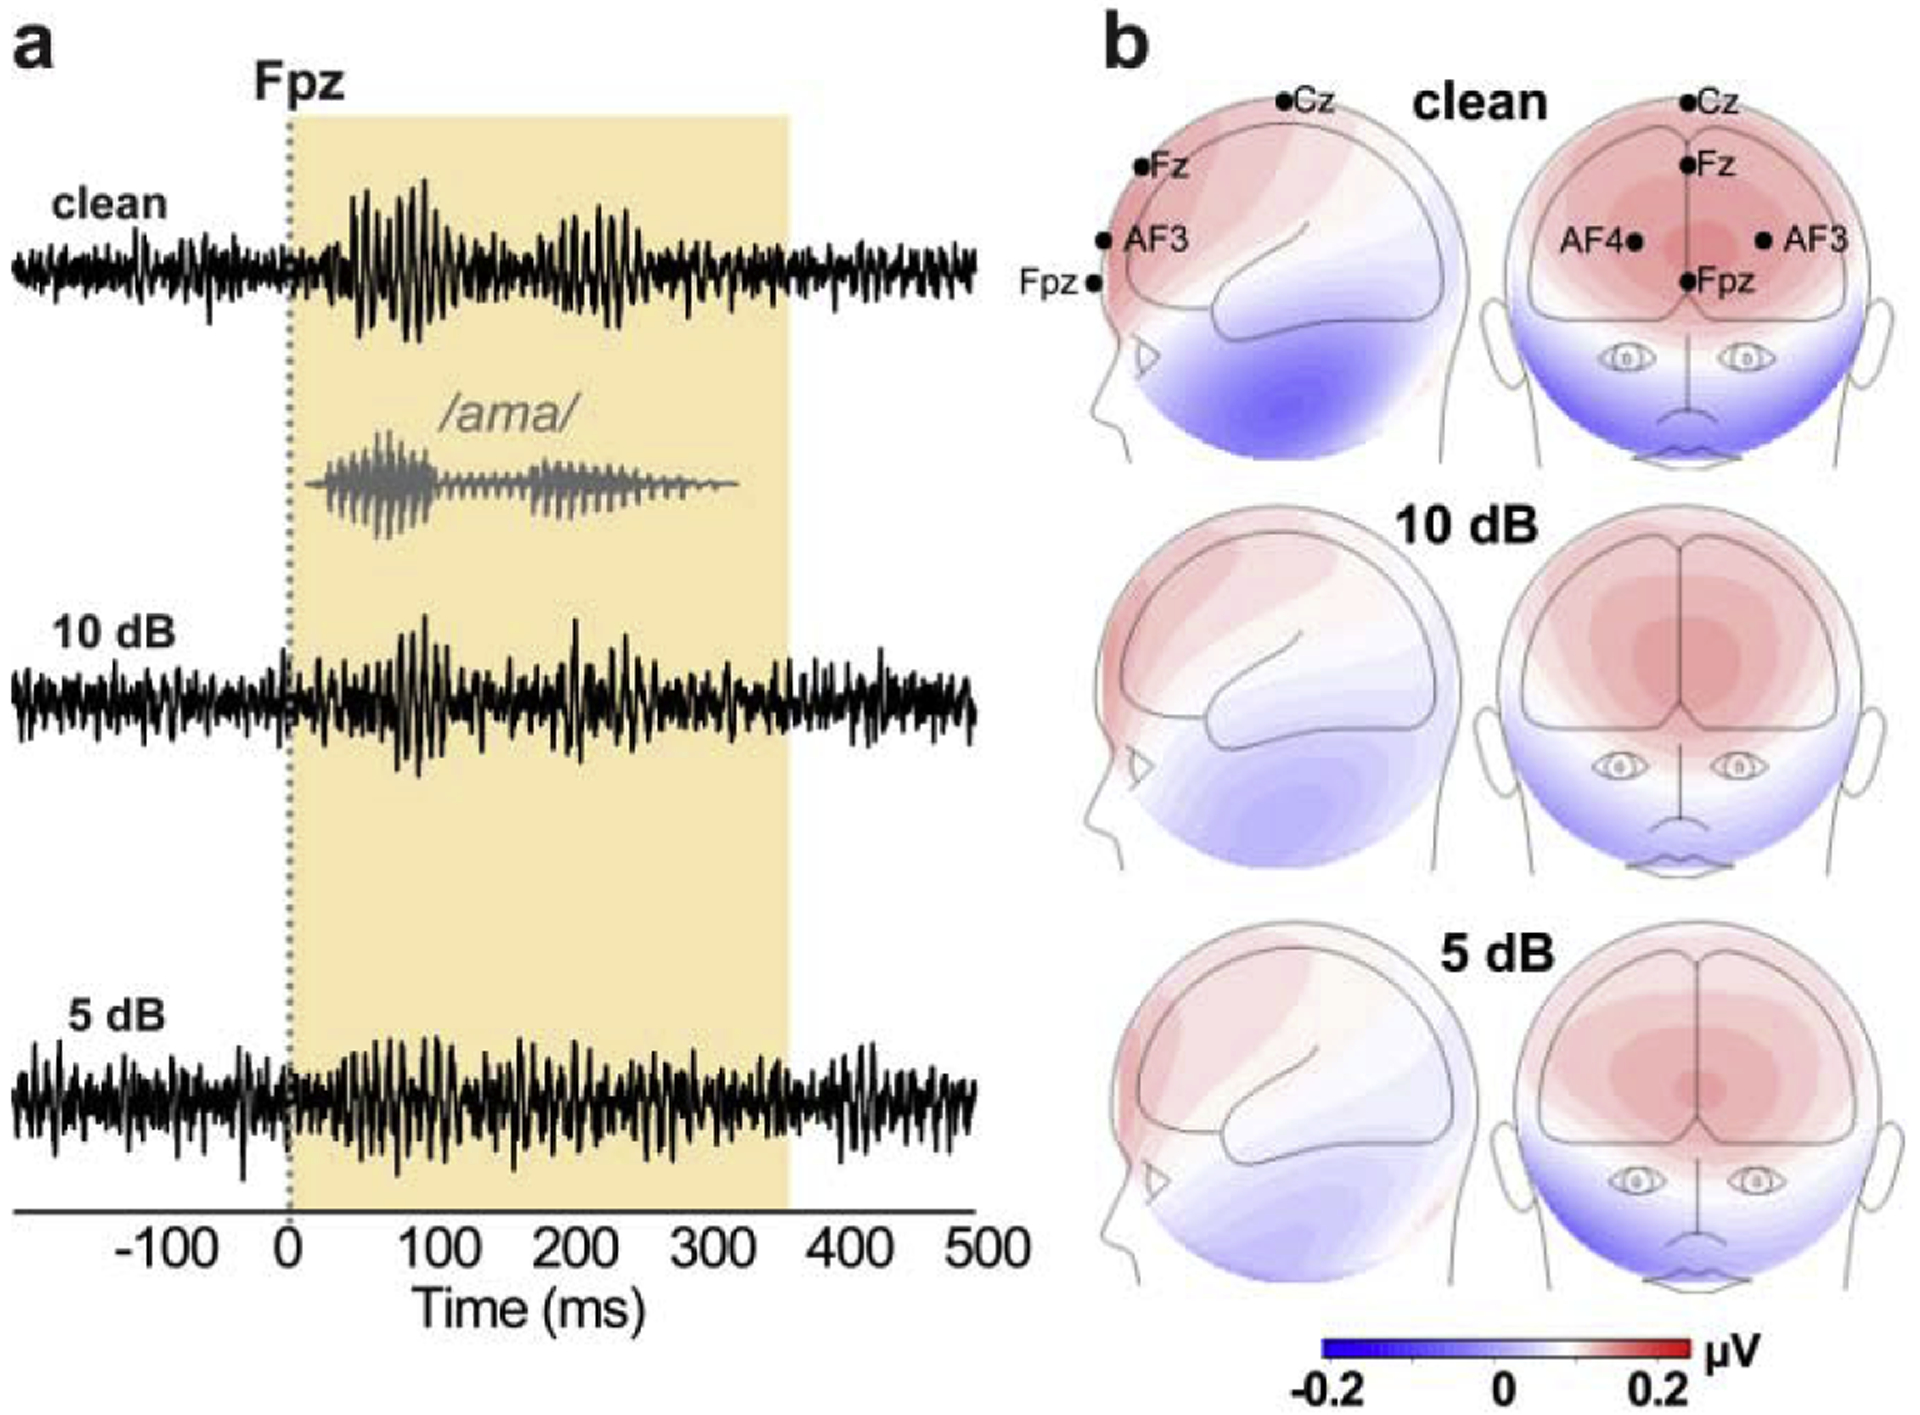
(a) Electrode recordings at channel Fpz across noise levels. Gray trace= stimulus waveform. FFRs appear as phase-locked potentials that mirror the acoustic periodicity of speech. (b) FFR topographies. Maps reflect the voltage distribution on the scalp, averaged across the periodic “wavelets” of the FFR [i.e., 25 most prominent positive peaks; see 5] in the response time window (0–350 ms; yellow shading). Maximal FFR amplitude near frontocentral sites (e.g., Fpz) and polarity inversion at the mastoids are consistent with deep midbrain sources that point obliquely in an anterior orientation to the vertex (parallel to the brainstem) [5, 6]. Red/blue shading = +/− voltage.
2.4. QuickSIN task
Behavioral SIN reception thresholds were measured by QuickSIN [17]. Participants heard two lists of six sentences embedded in four-talker babble noise. Each contained five key words. Sentence presentation was 70 dB SPL amid noise that decreased in 5 dB steps from 25 dB (very easy) to 0 dB SNR (very difficult). “SNR loss” (in dB) was determined as the SNR required to correctly identify 50% key words [17]. Two lists were averaged to obtain a SIN score per listener2.
2.5. Statistical analysis
We used two-way, mixed-model ANOVAs (source × SNR; subjects=random factor) to assess changes in FFR F0 amplitude across anatomical levels and noise conditions. Amplitudes were SQRT-transformed to satisfy normality and homogeneity of variance. Generalized linear mixed effects (GLME) regression evaluated links between behavioral QuickSIN scores and the source FFR F0 amplitudes. Following [7], we pooled across noise conditions (+10, +5 dB SNR) in the regression for data reduction purposes and to avoid multicollinearity. Bilateral sources (PAC, AN) were also collapsed to reduce multicollinearity. Variance inflation factors (VIFs) ranged from 2.8–7.8, indicating tolerable (low-to-moderate) multicollinearity [23]. Subjects were included as a random factor in the regression to model random intercepts per listener [e.g., QuickSIN ~ PAC + BS + AN+ (1| subject)]. This approach allowed us to assess the relative contribution of subcortical and cortical FFR sources to SIN perception.
We assessed reliability of the results using bootstrapping. From the original dataset, participants were randomly resampled N=250 times (with replacement) in a leave one out scenario. That is, on each resample, N-1 participants were drawn from the dataset. The GLME regression between their QuickSIN scores and neural measures were then computed and p-values for each source regressor were logged. Repeating this iteratively resulted in N=250 GLME regression models (i.e., 250 p-values per regressor), which allowed us to evaluate the distribution of the correlations and therefore which were reliable in their significance. Similarly, we used Bayes Factor analysis [21] to assess evidence in favor or against the null hypothesis. Bayes methods do not rely on large-sample theory and thus, are more appropriate for drawing inferences on smaller samples as used here [e.g., 26].
3. RESULTS
FFRs mirrored the periodicity of speech, reflecting robust phase-locking to the auditory input (Fig. 1). Their voltage distribution on the scalp showed maximal amplitude at frontocentral electrode sites (e.g., Fpz) and polarity inversion at the mastoids, consistent with sources in the deep midbrain that point obliquely in an anterior orientation to the vertex (parallel to the brainstem) [5, 6].
3.1. Source FFR waveforms and spectra
Source FFRs showed strong energy at the speech F0 frequency (~100 Hz) in all source foci (Figure 2). However, only subcortical sources (AN, BS) showed response energy above the noise floor at higher harmonics of the speech signal (H2 and H3), consistent with the higher phase-locking limits of more peripheral auditory nuclei [16] that generate FFRs [6]. In contrast, cortical PAC sources showed only weak energy at the F0 and failed to show reliable FFRs above the noise floor at higher frequencies3. Higher harmonic counts were also more frequent in AN/BS compared to PAC; across the two noise conditions there was a larger number of above noise floor H2 and H3 harmonics in AN/BS compared to PAC responses [χ(1)=6.09, p=0.0136]. Raw waveforms similarly showed variation in the strength of the response across the neuroaxis. FFRs were maximal at the level of BS, were robust but to a lesser extent in AN, and reduced dramatically at the level of PAC.
3.2. FFR F0 amplitudes as a function of source level and noise
FFR F0 strength varied across source levels (F4,126= 10.42, p <0.0001, = 0.25) but not with SNR (F2,126= 0.47, p = 0.6286, = 0.007) (SNR × level: F8,126= 0.38, p=0.9313, = 0.02) (Fig. 2, bar insets). Tukey-Kramer comparisons revealed stronger F0 amplitudes in BS vs. PAC (p<0.0001), BS vs. AN (p=0.0002), and AN vs. PAC (p=0.0326). There was no difference between PACright vs. PACleft (p=1.00). Subcortical sources were also collectively stronger than cortical sources (BS/AN > PAC; p<0.0001). Thus, our data did not reveal evidence of a functional asymmetry (i.e., right hemisphere bias) for cortical FFRs as observed in MEG studies [12]. Moreover, we found a midbrain-dominant gradient in F0 amplitudes across levels (BS > AN > PAC), further suggesting BS is the largest contributor to the FFREEG response [6].
3.3. Brain-behavior relations
Following previous channel-based FFR studies, we first evaluated associations between scalp-level recordings (Fpz electrode) and QuickSIN scores. We selected this channel as FFRs are strongest at frontocentral scalp locations (e.g., Fig. 1) [5, 6]. GLME regression revealed FFRs at Fpz were marginally related to better SIN perception (i.e., lower QuickSIN scores) (F1,10=4.75, p=0.054, adj-R2=0.69). Though a weak effect here, these channel-level results parallel studies reporting links between scalp-recorded FFRs and SIN performance [e.g., 9, 27, 28, 38, 40].
We next adjudicated which FFR sources drive this brain-behavior. QuickSIN scores were uniformly good (0.38 ± 0.85 dB SNR loss) but ranged ±2 dB across listeners (Fig. 3a). This is consistent with the typical variability observed in normal-hearing listeners [25]. GLME regression revealed that the quintet of FFR sources correlated with QuickSIN performance [F5,6=12.05, p=0.0159; null hypothesis coefficients=0; adj-R2=0.92) (Fig. 3b). Bayes Factor analysis [21] (http://pcl.missouri.edu/bayesfactor) indicated the alternative hypothesis was 70x more likely than the null of no brain-behaver relation, suggesting strong evidence for an FFR-QuickSIN relation [20]. Scrutiny of individual model terms revealed significant neural regressors in BS (β= −3.12; p=0.007) and bilateral AN (β= −5.11, p=0.0006). Contrary to MEG FFRs [13], PAC did not relate to QuickSIN performance (β= −0.58, p=0.48). Bootstrapping confirmed that among the three levels, only BS and AN were reliable regressors (p<0.05) among the surrogate datasets (Fig. 3c). Collectively, these findings suggest subcortical sources not only dominate the FFREEG but also the link between speech-FFRs and SIN performance [e.g., 9, 27, 28, 32, 38, 40].
Figure 3: Subcortical speech coding is sufficient to explain SIN listening skills.
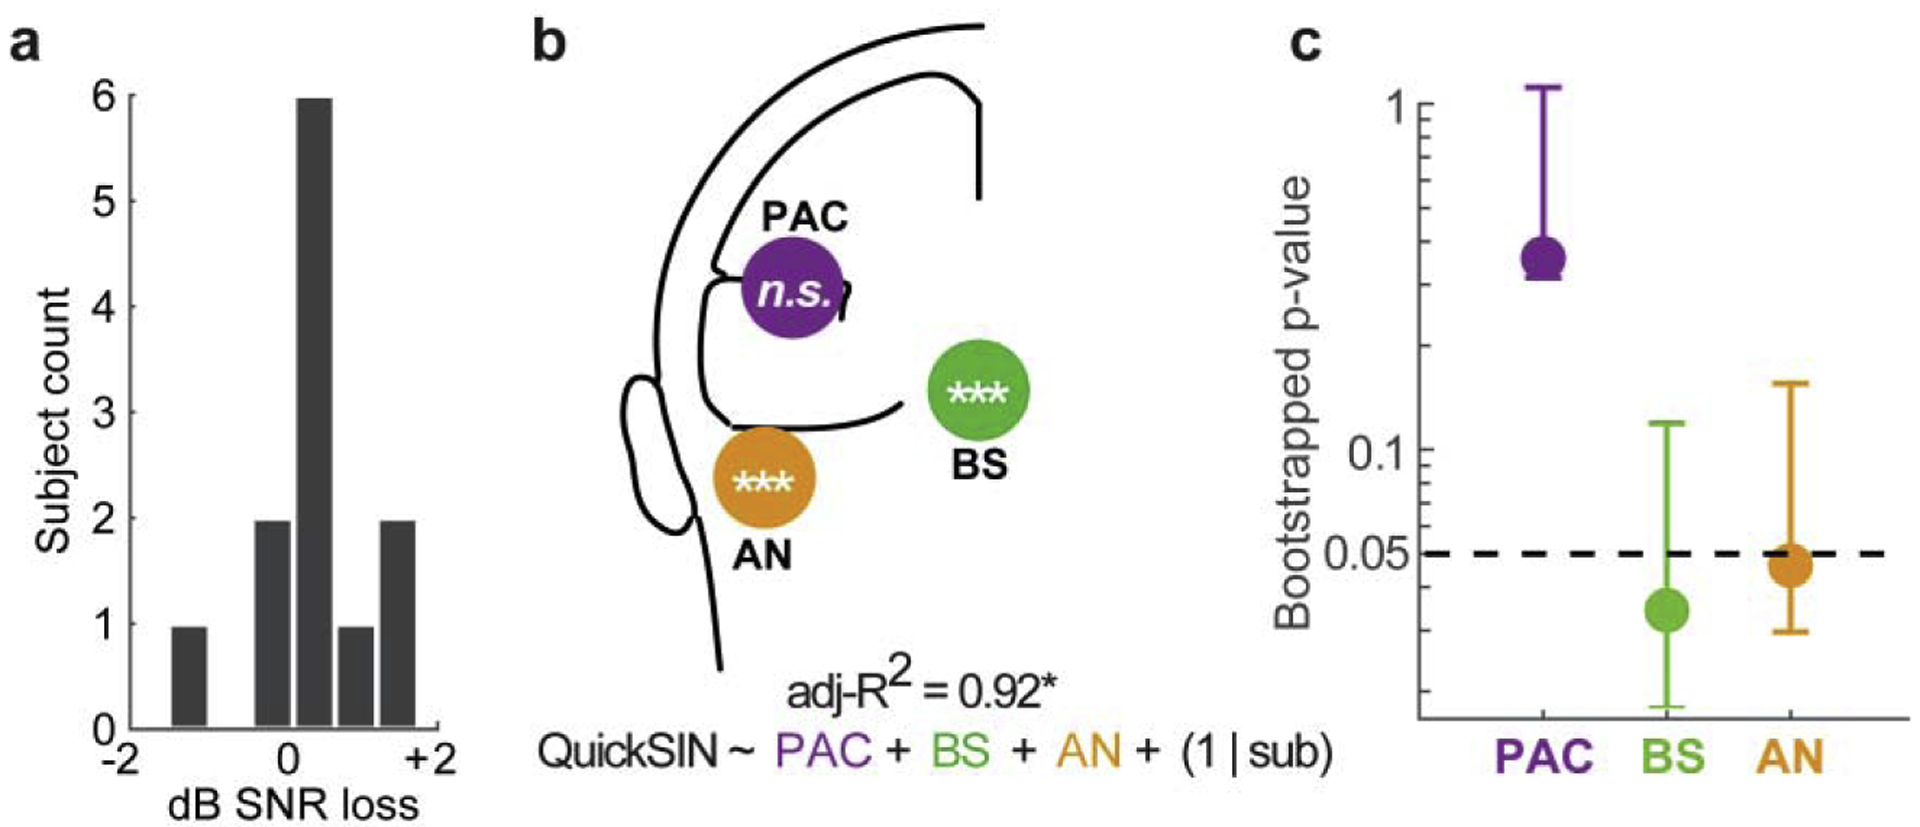
(a) QuickSIN scores. (b) Subcortical and cortical sources of the FFR account for significant variance in behavioral QuickSIN scores. Bilateral sources (PAC, AN) are pooled across hemispheres. Statistical flags mark significant regressors in the GLME model. Subcortical sources (AN, BS) are associated with SIN performance, whereas cortical FFRs (PAC) do not relate to behavior. (c) Bootstrapped p-values for each source regressor. Only BS and AN reach significance among N=250 resamples. Error bars = 95% CI. *p < 0.05; **p < 0.01, ***p < 0.001
4. DISCUSSION
Our results confirm that while a mixture of auditory neural generators contribute to the aggregate FFR [6, 12], midbrain and lower structures dominate the FFREEG [e.g., 5, 6, 18, 35, 37, 39, 41]. Whereas subcortical (AN, BS) FFRs were robust, PAC showed comparably weak responses. In contrast, we find subcortical FFRs are not only larger at F0 than their cortical counterparts but persist at higher spectral frequencies to maintain coding of the harmonics and timbral elements of speech [6]. Our findings imply that previously observed relations between speech-FFRs and SIN perception [e.g., 7, 9, 27, 28, 32, 38] are mediated by subcortical sources, at least in normal-hearing listeners.
4.1. Neural phase locking diminishes along the ascending auditory system
Our findings converge with human and animal studies suggesting subcortex (e.g., inferior colliculus and lower structures) as the primary source(s) of the FFR within the 20–200 Hz frequency bandwidth [6, 18, 35–37]. Diminishing FFRs from sub- to neo-cortex is consistent with the decreasing phase-locking tolerance of nuclei along the ascending auditory pathway [16] (see SI Discussion).
Our data show clear anatomically-dependent changes in FFR coding. Still, voice pitch coding (F0) was surprisingly robust to noise, consistent with prior FFR studies using relatively favorable SNRs (i.e., > 0 dB) [7, 9, 29, 31, 34]. Such resilience (and even increment) of F0 responses in the presence of mild-to-moderate noise is hypothesized to reflect stochastic resonance, the recruitment of low-frequency “tails” of high-frequency cochlear neurons due to high-intensity stimulus levels, and/or across channel integration of F0-related harmonics or intermodulation distortion products [for discussion, see 4]. These mechanisms could lead to more robust neural synchronization and therefore redundancy of pitch-relevant cues carried in FFRs even with additive noise. Collectively, our data suggest the degree to which FFRs maintain the speech F0 in noise is a robust correlate of perceptual SIN performance.
4.2. Subcortical sources drive the link between speech-FFRs and SIN perception
We found SIN processing is governed by a coordinated orchestration of phase-locked activity to the spectrotemporal details of speech generated from different levels of the auditory system. However, multivariate regression showed that subcortical sources (AN, BS) are the best correlates of listeners’ QuickSIN scores. In stark contrast, “cortical FFRs” failed to associate with perception. Moreover, we find PAC responses are eradicated for the most meaningful frequencies in speech (i.e., energy above F0) which carry timbral information on talker identity, including important formant cues [9, 37]. This is not to say cortex is not involved in SIN perception. On the contrary, cortical ERPs suggest auditory and non-auditory brain regions in both hemispheres enable SIN perception [8]. Rather, our data reveal little-to-no involvement of cortex when it comes to the relation between phase-locked speech FFRs and SIN processing.
MEG studies suggest associations between FFR periodicity and SIN perception might be mediated by right PAC [12, 13]. Our EEG findings suggest otherwise. Electrical FFRs failed to show a right hemisphere bias in cortical FFRs as suggested by MEG [12, 15, 30]. Rightward hemispheric bias in cortical responses to SIN have been widely reported in EEG studies [8, 33] and thus, were anticipated in the current study. Yet, we did not observe rightward lateralization of speech-FFRs, consistent with its bilateral symmetric scalp topography and deeper anatomical origin of midbrain responses [Fig 1b; 5, 6]. Instead, subcortical foci (AN, midbrain) more closely related to SIN perception as implied (but never confirmed) in previous FFR reports [e.g., 1, 7, 9, 27, 28, 32, 38]. In fact, despite being weakly observable, cortical FFRs did not relate to QuickSIN scores. Although we find very strong evidence favoring relations between subcortical FFREEG and SIN processing (Bayes factors=70), we acknowledge limitations of our smaller sample size. Additional EEG studies on larger samples are needed to replicate and confirm present findings.
Discrepancies between neuroimaging studies likely reflect differences in the sensitivity of MEG vs. EEG for detecting deep vs. superficial neuronal currents. The bias of MEG to more superficial and tangential brain activity may account for the differential brain-behavior relations between FFRs and SIN perception observed in this (EEG) vs. previous (MEG) FFR studies. Indeed, more recent MEG studies have begun to posit a brainstem locus when describing FFRs [19, 30, 42]. TMS-induced virtual lesions to auditory cortex also fail to eradicate FFRs [22], further suggesting a brainstem locus. Based on EEG and computational modeling, we have suggested the midbrain provides a 3x larger contribution to scalp FFRs (at F0) than cortex [6]. Similar conclusions were recently drawn by Ross, et al. [30], who further suggested cortical FFR sources are weaker when measured with EEG than with MEG. The disparity between MEG- and EEG-based FFRs is further bolstered by phase differences across the two modalities; for frequencies around 100 Hz, FFRMEG group delays are later than those for FFREEG, suggesting magnetic FFRs stem from later source(s) (i.e., cortex) than those measured via EEG [3].
With regard to the FFREEG, we infer that it is subcortical elements of the auditory axis and the degree to which they maintain neural periodicities that are critical for SIN perception. Nevertheless, our data and conclusions are limited to normal-hearing listeners. As implied by prior FFR/ERP work [10, 11, 24], it is conceivable that the relative weighting of subcortical vs. cortical contributions to speech FFRs might change with forms of hearing loss, for example, as a means of central compensation in response to degradations at the sensory input. Future studies are needed to test whether the subcortical dominance and brain-behavior relations in SIN performance observed here also occur in hearing-impaired listeners.
Supplementary Material
Highlights.
Measured speech FFRs via EEG and analyzed at source level.
FFRs decline from auditory nerve to cortex, reflecting reduced phase-locking
Auditory nerve + midbrain FFRs (but not cortex) relate to speech perception
Subcortical generators dominate the electrical FFR and its link to speech processing
Acknowledgments
We thank Dr. Caitlin Price for comments on earlier versions of this manuscript. This work was supported by grants from the NIH/NIDCD (R01DC016267) awarded to G.M.B.
Footnotes
Goodness of fit (GoF) = 1- RV, where RV is the residual variance computed as the sum of squares of the unexplained signal not accounted for by the source model.
One individual’s QuickSIN data was lost due to an error in data logging (EEG data were unaffected). This value was imputed using mean of the remaining participants’ QuickSIN scores.
Small peaks are visible near H2 for the PAC sources. These, however, were not significantly different from the EEG noise floor and thus, are likely some degree of cross-talk (leakage) of activity picked up from the lower midbrain BS source.
Publisher's Disclaimer: This is a PDF file of an unedited manuscript that has been accepted for publication. As a service to our customers we are providing this early version of the manuscript. The manuscript will undergo copyediting, typesetting, and review of the resulting proof before it is published in its final form. Please note that during the production process errors may be discovered which could affect the content, and all legal disclaimers that apply to the journal pertain.
References
- [1].Anderson S, Skoe E, Chandrasekaran B, et al. , Neural timing is linked to speech perception in noise, J. Neurosci 30 (2010) 4922–4926. [DOI] [PMC free article] [PubMed] [Google Scholar]
- [2].Bauer M, Trahms L, Sander T, Magnetoencephalographic accuracy profiles for the detection of auditory pathway sources. Biomedical Engineering / Biomedizinische Technik, Vol. 60, 2015, p. 135. [DOI] [PubMed] [Google Scholar]
- [3].Bharadwaj HM, Mai AR, Simpson JM, et al. , Non-Invasive Assays of Cochlear Synaptopathy – Candidates and Considerations, Neuroscience 407 (2019) 53–66. [DOI] [PMC free article] [PubMed] [Google Scholar]
- [4].Bidelman GM, Communicating in challenging environments: Noise and reverberation In: Kraus N, Anderson S, White-Schwoch T, Fay RR, Popper AN (Eds.), Springer Handbook of Auditory Research: The frequency-following response: A window into human communication, Springer Nature, New York, N.Y., 2017. [Google Scholar]
- [5].Bidelman GM, Multichannel recordings of the human brainstem frequency-following response: Scalp topography, source generators, and distinctions from the transient ABR, Hear. Res 323 (2015) 68–80. [DOI] [PubMed] [Google Scholar]
- [6].Bidelman GM, Subcortical sources dominate the neuroelectric auditory frequency-following response to speech, Neuroimage 175 (2018) 56–69. [DOI] [PubMed] [Google Scholar]
- [7].Bidelman GM, Davis MK, Pridgen MH, Brainstem-cortical functional connectivity for speech is differentially challenged by noise and reverberation, Hear. Res 367 (2018) 149–160. [DOI] [PMC free article] [PubMed] [Google Scholar]
- [8].Bidelman GM, Howell M, Functional changes in inter- and intra-hemispheric auditory cortical processing underlying degraded speech perception, Neuroimage 124 (2016) 581–590. [DOI] [PubMed] [Google Scholar]
- [9].Bidelman GM, Krishnan A, Effects of reverberation on brainstem representation of speech in musicians and non-musicians., Brain Res. 1355 (2010) 112–125. [DOI] [PMC free article] [PubMed] [Google Scholar]
- [10].Bidelman GM, Price CN, Shen D, et al. , Afferent-efferent connectivity between auditory brainstem and cortex accounts for poorer speech-in-noise comprehension in older adults, Hear. Res 382 (2019) 1–12. [DOI] [PMC free article] [PubMed] [Google Scholar]
- [11].Bidelman GM, Villafuerte JW, Moreno S, et al. , Age-related changes in the subcortical-cortical encoding and categorical perception of speech, Neurobiol. Aging 35 (2014) 2526–2540. [DOI] [PubMed] [Google Scholar]
- [12].Coffey EB, Herholz SC, Chepesiuk AM, et al. , Cortical contributions to the auditory frequency-following response revealed by MEG, Nat. Commun 7 (2016) 11070. [DOI] [PMC free article] [PubMed] [Google Scholar]
- [13].Coffey EBJ, Chepesiuk AMP, Herholz SC, et al. , Neural correlates of early sound encoding and their relationship to speech-in-noise perception, Front. Neurosci 11 (2017). [DOI] [PMC free article] [PubMed] [Google Scholar]
- [14].Cohen D, Cuffin BN, Demonstration of useful differences between magnetoencephalogram and electroencephalogram, Electroencephalogr Clin Neurophysiol 56 (1983) 38–51. [DOI] [PubMed] [Google Scholar]
- [15].Hartmann T, Weisz N, Auditory cortical generators of the Frequency Following Response are modulated by intermodal attention, Neuroimage 203 (2019) 116185. [DOI] [PubMed] [Google Scholar]
- [16].Joris PX, Schreiner CE, Rees A, Neural processing of amplitude-modulated sounds, Physiol. Rev 84 (2004) 541–577. [DOI] [PubMed] [Google Scholar]
- [17].Killion MC, Niquette PA, Gudmundsen GI, et al. , Development of a quick speech-in-noise test for measuring signal-to-noise ratio loss in normal-hearing and hearing-impaired listeners, J. Acoust. Soc. Am 116 (2004) 2395–2405. [DOI] [PubMed] [Google Scholar]
- [18].Kiren T, Aoyagi M, Furuse H, et al. , An experimental study on the generator of amplitude-modulation following response, Acta Otolaryng. Suppl. (Stockh.) 511 (1994) 28–33. [PubMed] [Google Scholar]
- [19].Kulasingham JP, Brodbeck C, Presacco A, et al. , High frequency cortical processing of continuous speech in younger and older listeners, Neuroimage 222 (2020) [DOI] [PMC free article] [PubMed] [Google Scholar]
- [20].Lee MD, Wagenmakers EJ, Bayesian cognitive modeling: A practical course, Cambridge University Press, Cambridge:, 2013. [Google Scholar]
- [21].Liang F, Paulo R, Molina G, et al. , Mixtures of g priors for bayesian variable selection, Journal of the American Statistical Association 103 (2008) 410–423. [Google Scholar]
- [22].López-Caballero F, Martin-Trias P, Ribas-Prats T, et al. , Effects of cTBS on the frequency-following response and other auditory evoked potentials, Frontiers in Human Neuroscience 14 (2020). [DOI] [PMC free article] [PubMed] [Google Scholar]
- [23].Lüdecke D, sjPlot: Data visualization for statistics in social science. R package version 2.8.6. https://CRAN.R-project.org/package=sjPlot. 2020. [Google Scholar]
- [24].Mahmud S, Ahmed F, Al-Fahad R, et al. , Decoding hearing-related changes in older adults’ spatiotemporal neural processing of speech using machine learning, Front. Neurosci 14 (2020) 1–15. [DOI] [PMC free article] [PubMed] [Google Scholar]
- [25].McArdle RA, Wilson RH, Homogeneity of the 18 QuickSIN lists, J. Am. Acad. Audiol 17 (2006) 157–167. [DOI] [PubMed] [Google Scholar]
- [26].Muthén B, Asparouhov T, Bayesian structural equation modeling: a more flexible representation of substantive theory, Psychological methods 17 (2012) 313–335. [DOI] [PubMed] [Google Scholar]
- [27].Parbery-Clark A, Marmel F, Bair J, et al. , What subcortical-cortical relationships tell us about processing speech in noise, Eur. J. Neurosci 33 (2011) 549–557. [DOI] [PubMed] [Google Scholar]
- [28].Parbery-Clark A, Skoe E, Kraus N, Musical experience limits the degradative effects of background noise on the neural processing of sound, J. Neurosci 29 (2009) 14100–14107. [DOI] [PMC free article] [PubMed] [Google Scholar]
- [29].Prevost F, Laroche M, Marcoux AM, et al. , Objective measurement of physiological signal-to-noise gain in the brainstem response to a synthetic vowel, Clin. Neurophysiol 124 (2013) 52–60. [DOI] [PubMed] [Google Scholar]
- [30].Ross B, Tremblay KL, Alain C, Simultaneous EEG and MEG recordings reveal vocal pitch elicited cortical gamma oscillations in young and older adults, Neuroimage 204 (2020) 116253. [DOI] [PubMed] [Google Scholar]
- [31].Russo N, Nicol T, Musacchia G, et al. , Brainstem responses to speech syllables, Clin. Neurophysiol 115 (2004) 2021–2030. [DOI] [PMC free article] [PubMed] [Google Scholar]
- [32].Saiz-Alía M, Forte AE, Reichenbach T, Individual differences in the attentional modulation of the human auditory brainstem response to speech inform on speech-in-noise deficits, Sci. Rep 9 (2019) 14131. [DOI] [PMC free article] [PubMed] [Google Scholar]
- [33].Shtyrov Y, Kujala T, Ahveninen J, et al. , Background acoustic noise and the hemispheric lateralization of speech processing in the human brain: Magnetic mismatch negativity study, Neurosci. Lett 251 (1998) 141–144. [DOI] [PubMed] [Google Scholar]
- [34].Smalt CJ, Krishnan A, Bidelman GM, et al. , Distortion products and their influence on representation of pitch-relevant information in the human brainstem for unresolved harmonic complex tones, Hear. Res 292 (2012) 26–34. [DOI] [PMC free article] [PubMed] [Google Scholar]
- [35].Smith JC, Marsh JT, Brown WS, Far-field recorded frequency-following responses: Evidence for the locus of brainstem sources, Electroencephalogr. Clin. Neurophysiol 39 (1975) 465–472. [DOI] [PubMed] [Google Scholar]
- [36].Sohmer H, Pratt H, Identification and separation of acoustic frequency following responses (FFRs) in man, Electroencephalogr. Clin. Neurophysiol 42 (1977) 493–500. [DOI] [PubMed] [Google Scholar]
- [37].Sohmer H, Pratt H, Kinarti R, Sources of frequency-following responses (FFR) in man, Electroencephalogr. Clin. Neurophysiol 42 (1977) 656–664. [DOI] [PubMed] [Google Scholar]
- [38].Song JH, Skoe E, Banai K, et al. , Perception of speech in noise: Neural correlates, J. Cogn. Neurosci 23 (2011) 2268–2279. [DOI] [PMC free article] [PubMed] [Google Scholar]
- [39].White-Schwoch T, Anderson S, Krizman J, et al. , Case studies in neuroscience: Subcortical origins of the frequency-following response, J. Neurophysiol 122 (2019) 844–848. [DOI] [PubMed] [Google Scholar]
- [40].Yellamsetty A, Bidelman GM, Brainstem correlates of concurrent speech identification in adverse listening conditions, Brain Res. 1714 (2019) 182–192. [DOI] [PMC free article] [PubMed] [Google Scholar]
- [41].Zhang X, Gong Q, Frequency-following responses to complex tones at different frequencies reflect different source configurations, Front. Neurosci 13 (2019). [DOI] [PMC free article] [PubMed] [Google Scholar]
- [42].Zhao TC, Kuhl PK, Linguistic effect on speech perception observed at the brainstem, Proc. Natl. Acad. Sci. USA 115 (2018) 8716–8721. [DOI] [PMC free article] [PubMed] [Google Scholar]
Associated Data
This section collects any data citations, data availability statements, or supplementary materials included in this article.