

Abstract
Background:
“Quantile-dependent expressivity” occurs when the effect size of a genetic variant depends upon whether the phenotype (e.g. cholesterol) is high or low relative to its distribution. We have previously shown that the effect of a 52-SNP genetic-risk score was 3-fold larger at the 90th percentile of the total cholesterol distribution than at its 10th percentile. The objective of this study is to assess quantile-dependent expressivity for total cholesterol in 7006 offspring with parents and 2112 sibships from Framingham Heart Study.
Methods:
Quantile-specific heritability (h2) was estimated as twice the offspring-parent regression slope as robustly estimated by quantile regression with nonparametric significance assigned from 1000 bootstrap samples.
Results:
Quantile-specific h2 increased linearly with increasing percentiles of the offspring’s cholesterol distribution (P=3.0×10⁻⁹), i.e. h2=0.38 at the 10th percentile, h2=0.45 at the 25th percentile, h2=0.52 at the 50th, h2=0.61 at the 75th percentile, and h2=0.65 at the 90th percentile of the total cholesterol distribution. Average h2 decreased from 0.55 to 0.34 in 3564 offspring who started cholesterol-lowering medications, but this was attributable to quantile-dependent expressivity and the offspring’s 0.94 mmol/L average drop in total cholesterol. Quantile-dependent expressivity likely explains the reported effect of the CELSR2/PSRC1/SORT1 rs646776 and APOE rs7412 gene loci on statin efficacy. Specifically, a smaller genetic effect size at the lower (post-treatment) than higher (pre-treatment) cholesterol concentrations mandates that the trajectories of the genotypes cannot move in parallel when cholesterol is decreased pharmacologically.
Conclusion:
Cholesterol concentrations exhibit quantile-dependent expressivity, which may provide an alternative interpretation to pharmacogenetic and nutrigenetic interactions.
Keywords: cholesterol, heritability, quantile regression, diet, obesity, precision medicine, pharmacogenetics, nutrigenetics, gene-environment interactions
Graphical Abstract

The effect size of a genetic variant is most often described as a fixed quantity [1]. Expressivity refers to the variable expression of a genetic variant. Quantile regression analysis is a nonparametric method for estimating the regression slope between an independent variable X (e.g., genetic risk score, GRS) and a dependent variable Y (e.g., phenotype) at each percentile of the Y distribution [2,3]. Using this approach, we have shown that the effect of a 52-SNP genetic risk score (GRSTC) on total cholesterol was not constant, rather the genetic effect size increased in association with the percentiles of the phenotype distribution [4]. We labeled this phenomenon “quantile-dependent penetrance or expressivity”, i.e., where the genetic effect size depends upon whether the phenotype is high or low relative to its distribution [4]. Compared to its effect (slope) at the 10th percentile, the effect of the GRSTC was 3.1-fold greater at the 90th percentile of the cholesterol distribution [4]. Quantile-dependent expressivity may arise from the metabolic effects of the polymorphisms on enzymes, transfer proteins, and receptors being concentration dependent. Quantile-dependent expressivity has also been demonstrated for triglycerides [4–6], high-density lipoprotein cholesterol [4,7,8], adiposity [4,9], pulmonary function [10], adiponectin concentrations [11], and coffee [12] and alcohol consumption [13].
The GRSTC used in our previous analysis accounted for only a small proportion of cholesterol heritability [14]. This paper seeks to verify quantile-dependent expressivity using a more inclusive genetic measure in a larger population. To this end we applied quantile regression to sibship and offspring-parent phenotypes from the Framingham Heart Study [15–17] to estimate quantile-specific heritability. We also show that quantile-dependent expressivity is consistent with published examples originally interpreted from the perspective of pharmacogenetics and nutrigenetics. Included among these are the APOE and SORT1 predictors of statin efficacy.
Methods
The Framingham Study data were obtained from the National Institutes of Health FRAMCOHORT, GEN3, FRAMOFFSPRING Research Materials obtained from the National Heart, Lung, and Blood (NHLBI) Biologic Specimen and Data Repository Information Coordinating Center. The hypotheses tested are exploratory and not considered as part of the initial Framingham Study design. Use of the anonymized Framingham Cohort data for analysis was approved by the Lawrence Berkeley National Laboratory Human Subjects Committee (HSC, Approval 107H021–13MR20).
Detailed information on sample selection, age and sex adjustment, Falconer’s formula for heritability, quantile regression, and percentile-percentile (P-P) plots for comparing quantile-specific heritability plots under different conditions is provided as supplementary information. Briefly, quantile regression [2,3] was used to provide a robust estimate of the regression slopes between offspring and parents (βOP) and between full sibs (βFS) at each percentile of the offspring distribution. Theoretically, 2βOP = the ratio of the additive genetic variance to the total phenotypic variance = heritability in the narrow sense (h2) if the spouse correlation negligible [1]. The theoretical expectation of βFS includes dominance and shared environmental effects, but if these and spouse correlation are negligible, then 2βFS = h2. Linear, quadratic, and cubic trends in βOP and βFS were tested using orthogonal contrasts [18]. Probability-probability (P-P) plots [19] were used to compare the quantile-specific βOP of two samples by their actual phenotype values rather than their percentiles. Means and regression slopes are presented ±SE.
Results
3681 subjects in the Framingham Offspring Cohort had one or more parents in the Original Cohort, and 3325 Third Generation Cohort subjects had one or more parent in the Offspring Cohort. There were 1016 sibships with two or more full siblings in the Offspring Cohort, and 1096 sibships with two or more full siblings in the Third Generation Cohort. Average total cholesterol (SD) for subjects used in the analyses were 6.11 (1.26) mmol/L in the Original Cohort, 5.30 (0.84) mmol/L in the Offspring Cohort, and 5.28 (0.84) mmol/L in the Third Generation Cohort.
Classical point estimates
Spouse concordance for cholesterol was negligible (r=0.04) and therefore ignored in estimating heritability. As classically estimated by the offspring-midparental regression slope (βOM) and twice the offspring-parent slope (2•βOP, Supplementary Table 1), total cholesterol heritabilities were 0.49 and 0.53, respectively [1]. The classical regression slope for full sibs (βFS=0.27±0.02) was identical that of offspring-parent (βOP=0.27±0.01). Since under Falconer and Mackay’s formula βFS includes dominance and common environmental effects in addition to additive genetic effects whereas βOP includes additive genetic effects only, the nearly identical βFS and βOP of Supplementary Table 1 suggests the effects of both dominance and common environmental effects are probably negligible. Thus βFS may provide confirmatory evidence for cholesterol heritability.
Quantile-dependent expressivity.
Figure 1A presents the offspring-parent regression slopes (βOP) at the 10th, 25th, 50th, 75th, and 90th percentiles of the offspring’s age- and sex-adjusted cholesterol distribution. The slopes, which theoretically approximate the one-half the heritability at each percentile (h2= 2*βOP), get progressively steeper with increasing percentiles of the distribution. The slope at the 90th percentile was 74% greater than the slope at the 10th percentile (Pdifference=9.9×10⁻⁶). These slopes, along with those of the other percentiles between the 5th and 95th percentiles are presented in the quantile-specific heritability plot in Figure 1B. They show that heritability increased linearly with increasing percentiles of the offspring’s distribution (i.e., slope±SE: 0.0036±0.0006, P=3.0±x10−9) with no evidence of nonlinearity. Quantile-specific heritability was significant (P<10−16) for all individual percentiles between the 5th and 95th percentiles of the offspring’ distribution.
Figure 1.
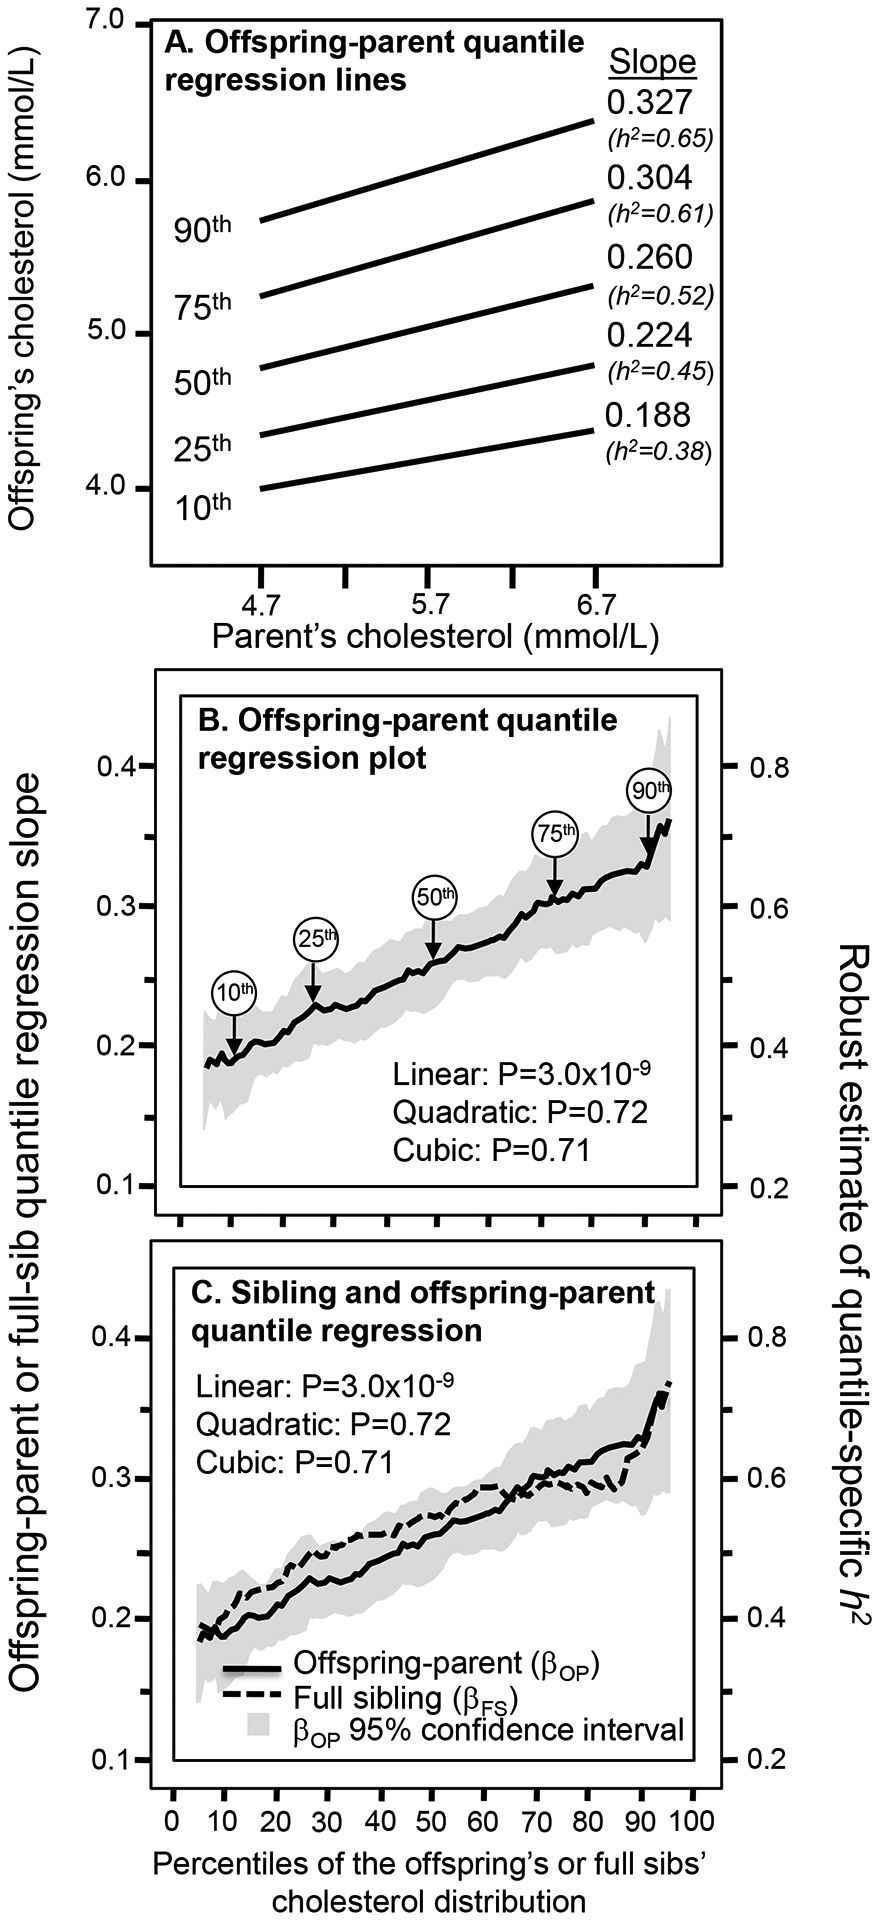
A) Offspring-parent regression slopes (βOP) for selected quantiles of the offsprings’ total cholesterol concentrations, with corresponding estimates of heritability (2βOP=h2). The slopes became progressively greater (i.e., steeper) with increasing quantiles of the cholesterol distribution. B) Quantile-specific heritability function formed by combining the selected quantile-specific regression slopes from above with those of other quantiles. Significance of the linear, quadratic and cubic trends and the 95% confidence intervals (shaded region) were determined by 1000 bootstrap samples. Figure 1C compares the offspring-parent (βOP) and full-sib (βFS) regression slopes for total cholesterol concentrations by quantiles of the offspring and sibling distribution. Theoretically, 2βOP and 2βFS both equal h2 if assortative mating, dominance, and sibling shared environmental effects are negligible, as suggested by their overlap.
Figure 1C shows the quantile-specific regression slopes for full sibs (βFS) increased with increasing percentiles of their distribution (P=0.001). Again, quantile-specific βFS were individually significant at P<10−16 for all individual percentiles between the 5th through the 95th percentiles. The full-sib regression slopes (βFS) were somewhat greater than for βOP between the 15th and 60th percentiles of the cholesterol distribution, but not significantly so. Thus 2*βFS mostly represents h2 and the linear increase in βFS is consistent with the linear increase in cholesterol heritability. βFS for LDL-cholesterol concentrations also increased linearly with its increasing concentration (P=0.008, not displayed).
Drug treatment effect
Included in the sample were 3564 offspring with cholesterol measured before and after going on lipid-lowering medications. The medications decreased cholesterol concentrations by an average of 0.94 mmol/L and decreased the classical point-estimate of heritability (2βOP, from standard regression) from h2=0.55 to h2=0.34. Figure 2 (upper panel) shows that the drug-induced decrease in quantile-specific heritability was consistent throughout the offspring’s cholesterol distribution.
Figure 2.
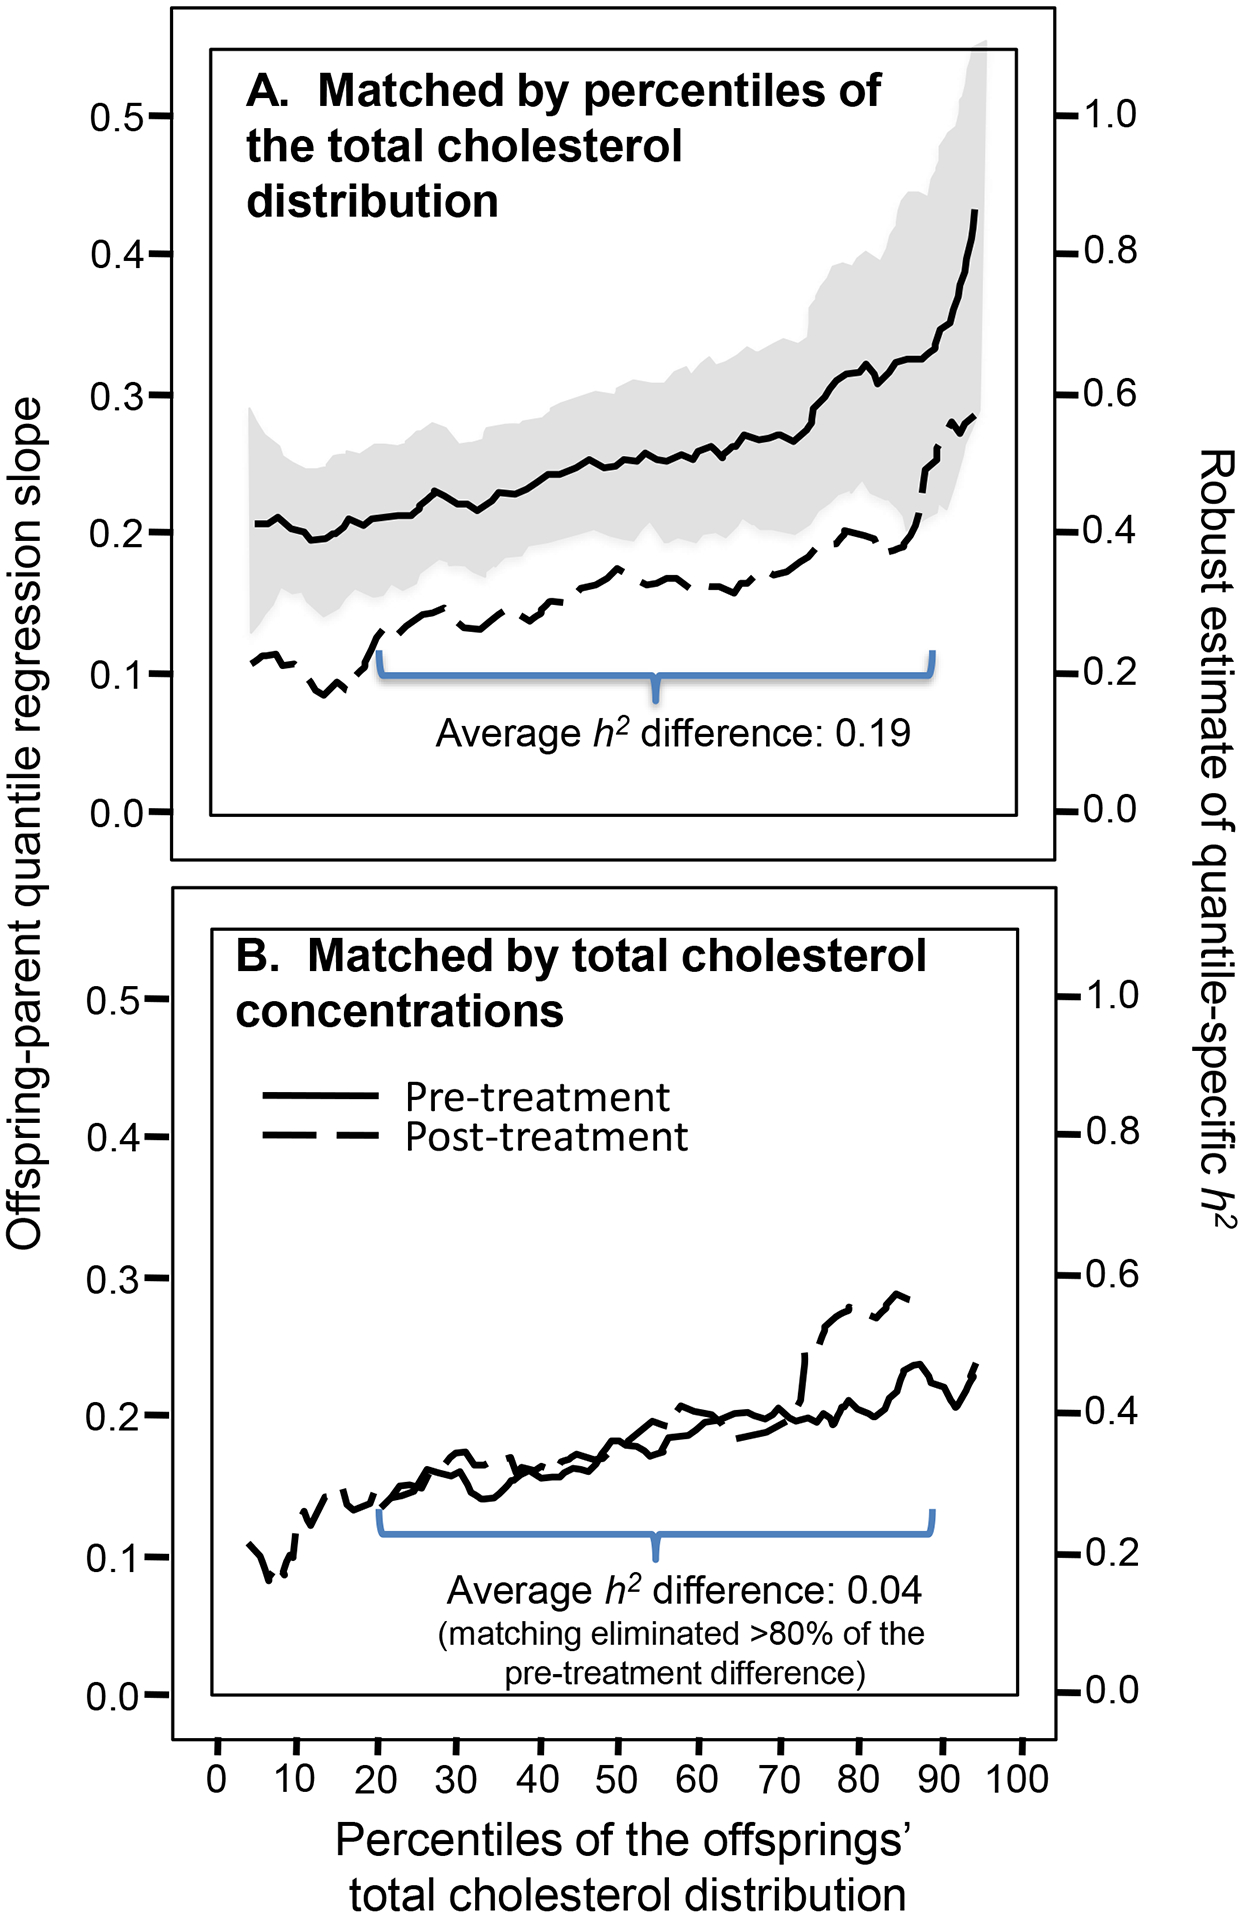
A) Quantile-specific heritability plots before and after starting cholesterol medication when the two plots are displayed together by the percentile of the offspring’s total cholesterol concentrations. B) The heritability plots when they are matched by the offsprings’ total cholesterol concentrations in mmol/L using P-P plots [19]. Note that the heritability difference on and off medications (0.19) in the upper panel is essentially eliminated when matched by cholesterol levels in the lower panel.
Nearly all of the decrease in heritability from treatment is attributable to the 0.94-mmol/L drop in average cholesterol concentrations and quantile-dependent expressivity (i.e., lower heritability at lower cholesterol levels). This is shown when the offspring are matched by their actual cholesterol levels (lower panel) rather than their cholesterol percentiles (upper panel, see methods in the supplementary material). Whereas their difference in heritabilities was substantial when matched by the percentiles of their respective populations (Figure 2A: h2 =0.513 vs. h2 =0.322 when averaged over all percentiles), the difference in h2 was mostly eliminated when matched by cholesterol concentrations (Figure 2B). Specifically, the average difference between the replotted pre-treatment and post-treatment h2 over their overlapping domains (21st to 88th percentiles) was 0.037, which was an 80% reduction in the 0.189 average h2 differences when pre- and post-treatment estimates were matched at their respective percentiles.
Clinical trials consistent with quantile-dependent expressivity.
Figures 3 and 4 present published pharmacogenetic and nutrigenetic examples of genetic variants affecting the total and LDL-cholesterol responses to drug and diet interventions. Their original interpretations are represented by the histograms that show that the changes in cholesterol concentrations differ by genotype. Alternatively, the accompanying line graphs represent their interpretation from the perspective of quantile-dependent expressivity. They show that the histograms could be the consequence of smaller difference between genotypes at the lower average cholesterol concentrations following treatment. Specifically, a smaller genetic effect size at the lower (post-treatment) than higher (pre-treatment) cholesterol concentrations mandates that the genotype-specific cholesterol-reductions cannot move in parallel when cholesterol is decreased pharmacologically or nutrigenetically.
Figure 3.
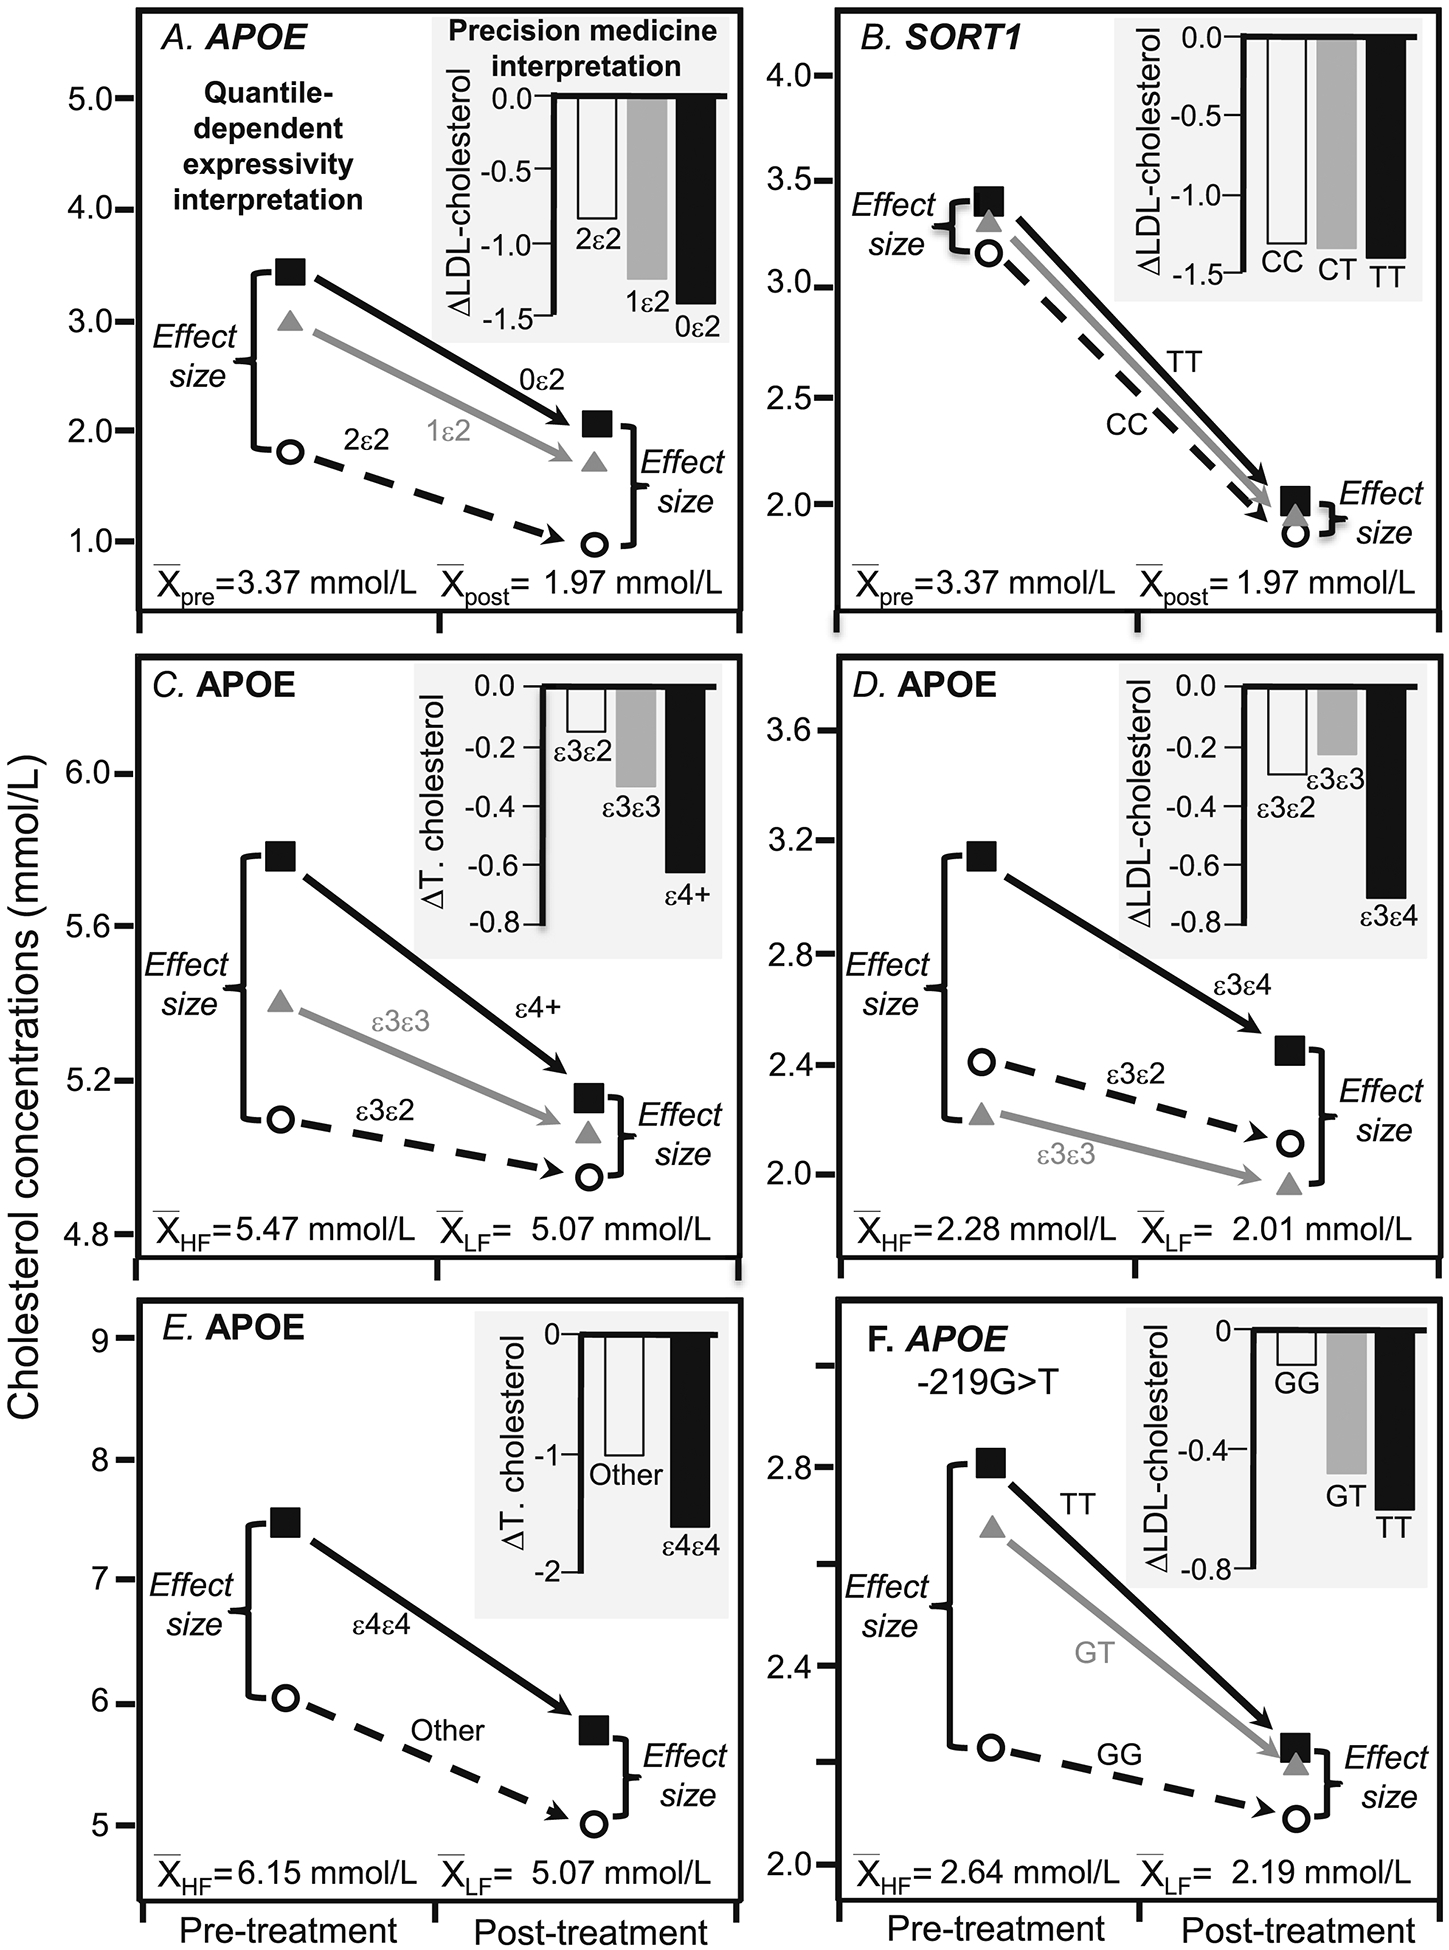
Precision medicine perspective of genotype-specific cholesterol change (histogram inserts) vs. quantile-dependent expressivity perspective of larger genetic effect size when average cholesterol concentrations were high (line graphs) for: A) Hopewell et al.’s 2013 report [20] on LDL-cholesterol before and after being treated with 40 mg/d simvastatin in 185 carriers of two ε2, 2794 carriers of one ε2, and 12,305 carriers of zero ε2 alleles of APOE rs7412 (Pinteraction 2.7×10⁻³⁰); B) Hopewell et al.’s 2013 report [20] on LDL-cholesterol before and after simvastatin treatment in 11,305 TT homozygotes, 6137 CT heterozygotes, and 847 CC homozygotes of CELSR2/PSRC1/SORT1 rs646776 (Pinteraction =9.5×10⁻⁵); C) Dreon et al.’s 1995 report [21] on total cholesterol change in switching from a high-fat to a low-fat diet in 28 APOE ε4-carriers, 65 ε3ε3, and ten ε3ε2 (Pinteraction=0.02), D) Friedlander et al.’s 1995 report [22] on the LDL-cholesterol reduction in switching from basal to treatment diets in four APOE ε2ε3, forty-nine ε3ε3, and three ε3ε4 (Pinteraction≤0.01); E) Tikkanen et al’s 1990 report [23] on total cholesterol change due to switching from a high-fat high-cholesterol diet (average of baseline and switchback diets) to a low-fat low-cholesterol diet in eight APOE ε4ε4 and 102 non-ε4ε4 (Pinteraction=0.01); F) Moreno et al.’s 2004 report [24] on LDL-cholesterol change when switched from a 47% carbohydrate/20% SFA diet to a 55% carbohydrate/<10% SFA diet in 48 carriers of the T allele and seven GG homozygotes of the APOE −219G>T promoter (Pinteraction<0.05).
Figure 4.
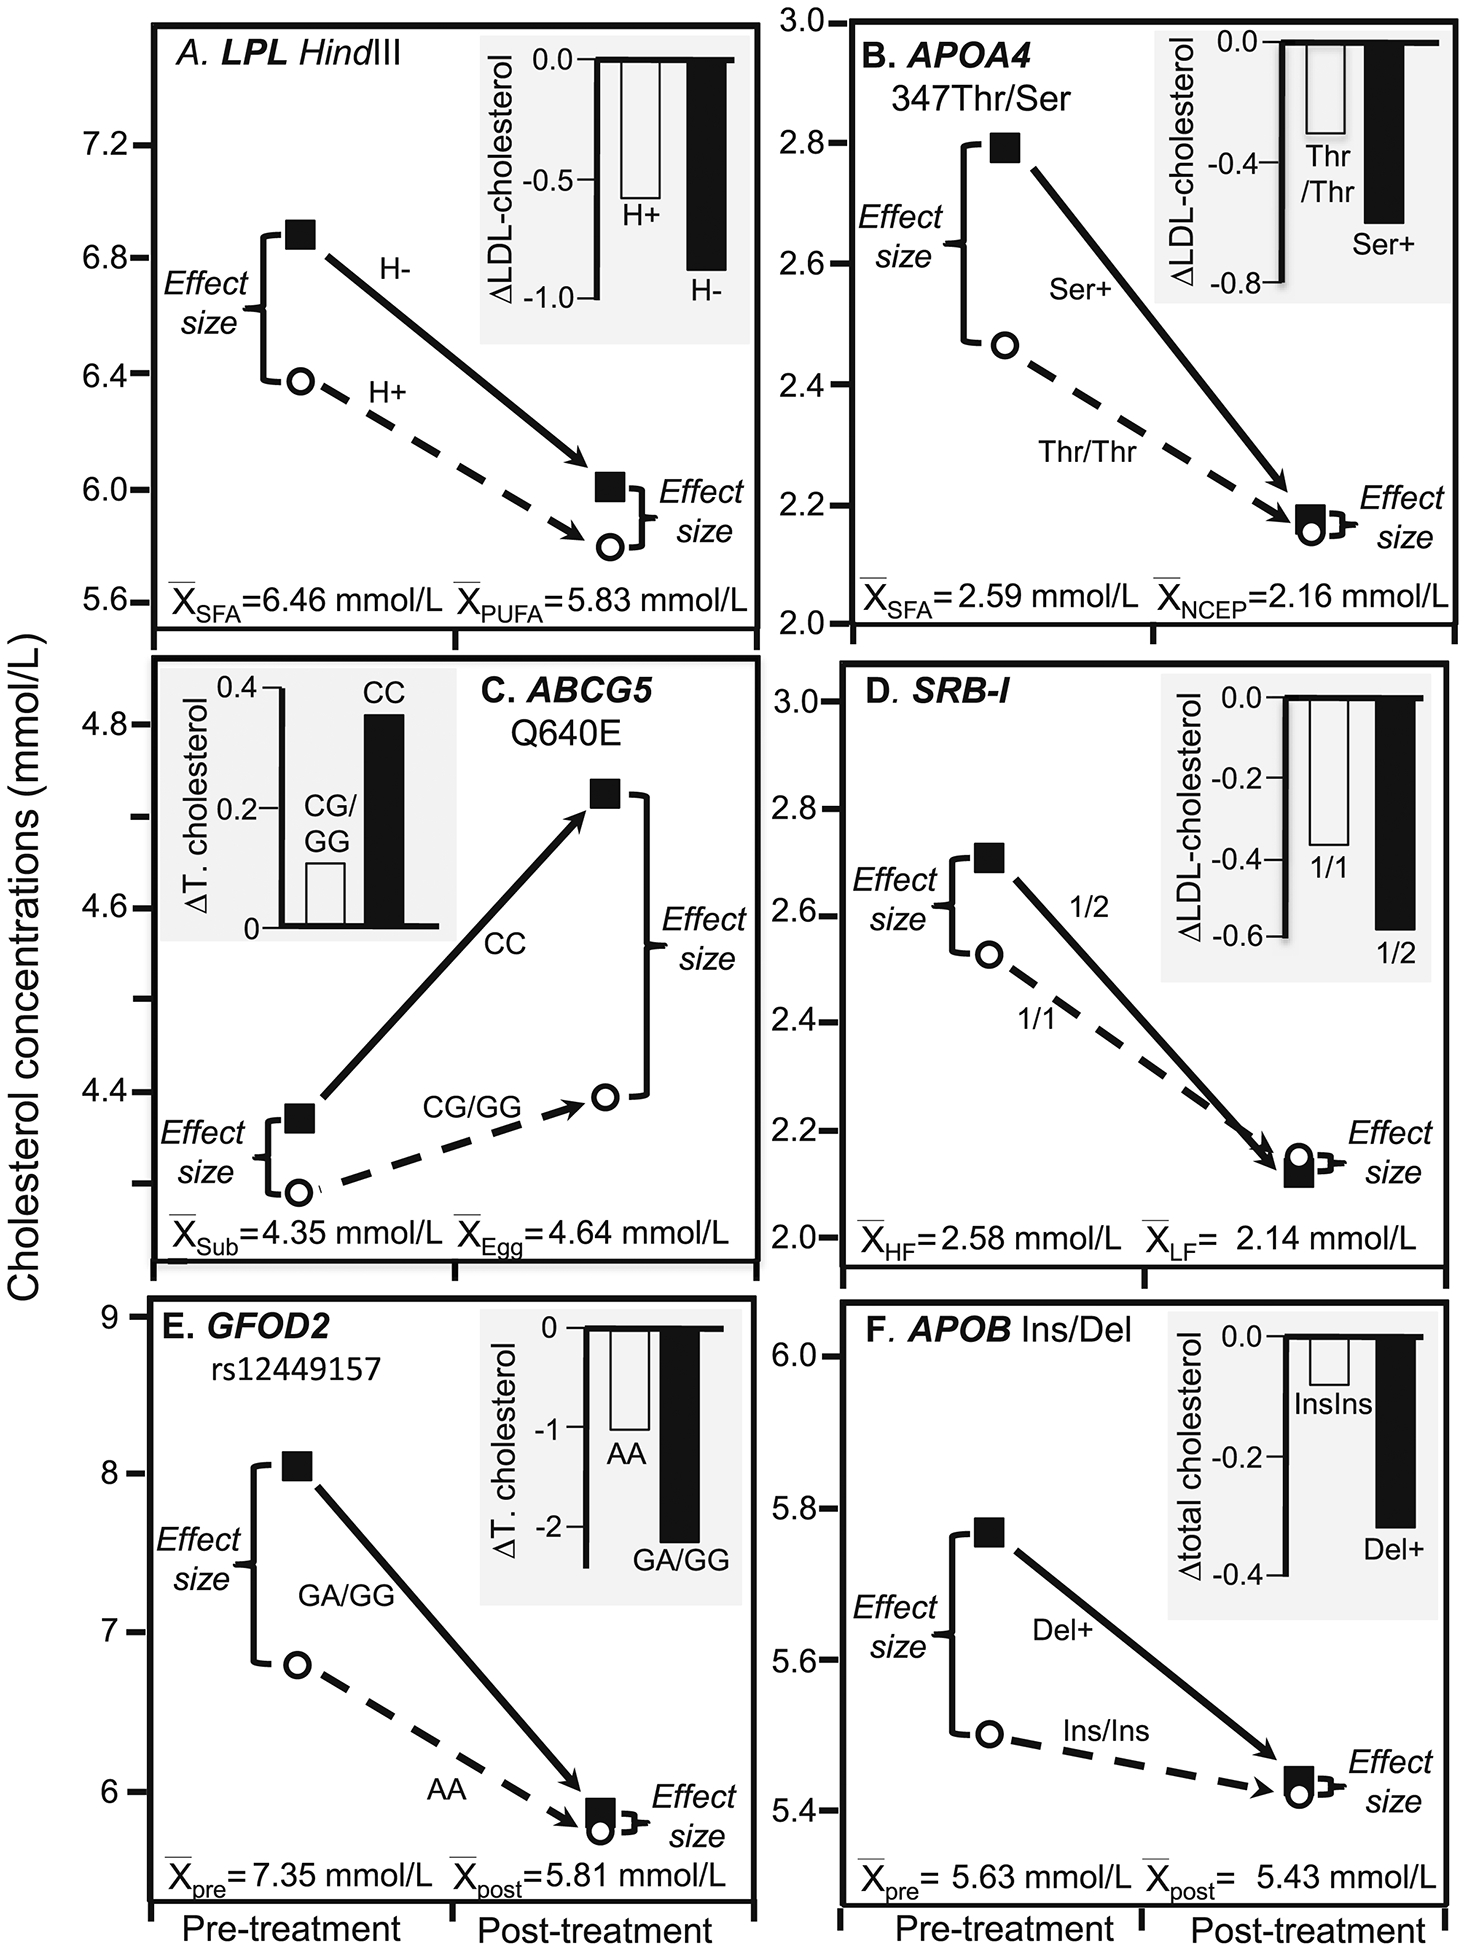
Precision medicine perspective of genotype-specific cholesterol change (histogram inserts) vs. quantile-dependent expressivity perspective of larger genetic effect size when average cholesterol concentrations were high (line graphs) for: A) Humphries et al.’s 1996 report [25] on the total-cholesterol response to a high SFA fat and high PUFA fat diets in 45 H+ and 10 H− genotypes of the Hindlll LPL gene loci (P=0.03); B) Jansen et al.’s 1997 report [26] on the LDL-cholesterol response of switching from an NECP type 1 diet to a high SFA diet in 25 APOA4 347Thr homozygotes and 16 carriers of the 347Ser allele (Pinteraction=0.05); C) Herron et al.’s 2006 reported [27] on the total cholesterol response to switching from egg substitute to one egg/d. for 30 days in 68 CC homozygotes and 23 G-carriers of the ABCG5 polymorphism (Pinteraction<0.05); and D) Perez-Martinez et al.’s 2003 report [28] on LDL-cholesterol concentrations in switching from a SFA-rich diet to high-carbohydrate diet in sixty-five 1/1 homozygotes and thirty-two ½ heterozygotes of SRB-I exon 1 (Pinteraction =0.007); E) Guevara-Cruz et al.’s 2013 report [29] of 23 AA and 18 AG and GG genotypes of rs12449157 in the glucose-fructose oxidoreductase domain containing 2 (GFOD2) locus on pre-treatment basal diet followed by three-month low saturated fat diet with 25 g soy protein and 15 g soluble fiber supplement (Pinteraction=0.0001); F) Jemaa et al.’s 2004 report [30] showing greater total cholesterol reduction with low-calorie weight loss diet in 110 carriers of the Del allele of the APOB Ins/Del signal peptide polymorphism vs. 121 Ins/Ins homozygotes (Pinteraction=0.001).
For example, Hopewell et al. reported LDL-cholesterol concentrations in >14,000 patients before and after being treated with 40 mg/d simvastatin (Figure 3A and 3B) [20]. The histograms present their results from the pharmacogenetic perspective. Figure 3A shows the number of APOE ε2 alleles affected statin-induced LDL-cholesterol reductions, i.e., there was a 0.85±0.066 mmol/L reduction for two copies of the ε2 allele, 1.28±0.014 mmol/L reduction for one copy, and 1.42±0.006 mmol/L reduction for no copies, or 0.159±0.014 mmol/L less cholesterol reduction for each ε2 allele (P=2.7×10⁻³⁰). The line graphs present their results from the perspective of quantile-dependent expressivity. On average, statin decreased LDL-cholesterol levels from a pre-treatment average of 3.37 mmol/L to a post-treatment average of 1.97 mmol/L. There was a smaller difference between genotypes at the lower post-treatment than higher pre-treatment LDL levels, consistent with quantile-dependent expressivity.
The results for the CELSR2/PSRC1/SORT1 rs646776 gene locus are presented in Figure 3B. From the perspective of pharmacogenetics, the histogram shows that LDL-cholesterol was reduced by 1.40±0.006 mmol/L in TT homozygotes, 1.37±0.008 mmol/L in CT heterozygotes, and 1.32±0.022 mmol/L in CC homozygotes, or 0.031±0.008 less reduction in LDL-cholesterol with each C allele (P=9.5×10⁻⁵). As before, the line graph presents the results from the perspective of quantile-dependent expressivity. At the higher baseline concentrations, LDL-cholesterol averaged 3.41±0.008 mmol/L for TT homozygotes, 3.31±0.010 mmol/L for the CT heterozygotes, and 3.17±0.026 mmol/L for CC homozygotes. On statin, however, the effect of the minor C allele was about one-third smaller than its off-statin effect: 2.01 mmol/L for TT homozygotes, 1.94 mmol/L for the CT heterozygotes, and 1.85 mmol/L for CC homozygotes. The effect per dose of the minor C allele was −0.110±0.010 mmol/L per copy before starting statins, vs. −0.074 mmol/L per copy after starting statins. The genotype differences in the histograms are the consequence of the different genetic effect size on and off statins.
The reductions in total cholesterol due to switching from a high-fat to a low-fat diet reported by Dreon et al.’s [21] is displayed in Figure 3C’s histogram from a nutrigenetic perspective (Pinteraction=0.02): i.e., greatest reduction in APOE ε4-carriers (−0.63±0.10 mmol/L), intermediate reduction in ε3/ε3 (−0.34±0.07 mmol/L), and smallest reduction in ε3/ε2 (−0.15±0.16 mmol/L).
Consistent with quantile-dependent expressivity, the reduction in average cholesterol concentrations from 5.47±0.09 to 5.07±0.09 mmol/L diminished the size of the cholesterol difference between genotypes from the high-fat diet (ε3/ε2, ε3/ε3, ε4-carriers: 5.09±0.28, 5.40±0.12, 5.78±0.18 mmol/L) to the low-fat diet (4.94±0.31, 5.06±0.12, 5.15±0.16 mmol/L).
Friedlander et al.’s reported significant differences (Pinteraction≤0.01) in the LDL-cholesterol reduction in switching from a basal diet to treatment diets (33–36% fat, 47–52% carbohydrate, 17% protein) between APOE isoforms (Figure 3D’s histogram) [22]. The associated line graph shows that the switch reduced average LDL-cholesterol concentrations from 2.28 to 2.01 mmol/L while diminishing the genetic effect size, as predicted by quantile-dependent expressivity.
Tikkanen et al. reported [23] a larger total cholesterol reductions in APOE ε4/ε4 homozygotes than other genotypes when subjects switched from a baseline high-fat high-cholesterol diet to a low-fat low-cholesterol diet (ε4/ε4 vs. other: 1.84 vs. 1.13 mmol/L reductions, Pinteraction=0.01) and their larger cholesterol increases when switched back to the high fat diet (ε4/ε4 vs. other: 1.52 vs. 0.92 mmol/L increases, Pinteraction=0.01), see Figure 3E. Average total cholesterol concentrations were higher on the high-fat baseline diet (6.25±0.11 mmol/L) and switchback diet (6.04±0.10 mmol/L) than the low-fat diet (5.07±0.09 mmol/L). Quantile-dependent expressivity would predict larger genotype differences for the high-fat (ε4/ε4 minus other: 1.49±0.48 mmol/L) and the switchback diets (1.37±0.38 mmol/L) than the low fat diet (0.78±0.32 mmol/L), as reported.
Moreno et al.’s reported that the carriers of the T-allele of the APOE −219G>T promoter polymorphism had significantly greater decreases in LDL-cholesterol than GG homozygotes when switching from a 47% carbohydrate/20% SFA diet to a 55% carbohydrate/10% SFA diet (Figure 3F, Pinteraction<0.05) [24]. Average LDL-cholesterol concentrations decreased from 2.64±0.08 to 2.19±0.07 mmol/L when dietary fat decreased, as did the difference between genotypes, thus producing the greater cholesterol decreases associated with the T allele.
Humphries et al. [25] reported significantly greater total cholesterol decreases in H− than H+ genotypes of the Hindlll lipoprotein lipase (LPL) gene loci from switching from a high-SFA diet (26% SFA, 10% MUFA, 2% PUFA) to a high-PUFA fat (9% SFA, 6% MUFA, 23% PUFA) diet (0.88 vs. 0.58 mmol/L decreases, P=0.03), as shown in Figure 4A. The high polyunsaturated fat diet produced lower average cholesterol concentrations than the high saturated fat diet (5.83 vs. 6.46 mmol/L) and in accordance with quantile-dependent expressivity, smaller differences between H− and H+ genotypes (0.21 vs. 0.51 mmol/L).
Jansen et al. [26] reported greater LDL-cholesterol reductions in switching from a high SFA diet (38% total fat, 20% SFA, 47% carbohydrate) to an NCEP type 1 diet (28% total fat, 10% SFA, 47% carbohydrate) in carriers of the APOA4 347Ser allele than 347Thr homozygotes (Pinteraction=0.01). Figure 4B shows that average LDL-cholesterol concentrations decreased from 2.59±0.10 to 2.16±0.08 mmol/L, which was concurrent to a decrease in the effect size (347Ser minus 347Thr) from 0.33±0.21 to 0.02±0.18 to mmol/L.
Herron et al.’s report that eating one egg/d for 30 days produced greater increases in total cholesterol in CC-homozygotes of the ATP binding cassette G5 (ABCG5) polymorphism than carriers of the G-allele (0.354 vs. 0.106 mmol/L, Pinteraction<0.05) [27]. Figure 4C shows that the average total cholesterol concentrations were higher during egg consumption (4.64±0.09 mmol/L) than when egg substitute was consumed (4.35±0.08 mmol/L). Quantile-dependent expressivity would attribute the differential genotype response to a larger genetic effect size when average cholesterol concentrations were elevated by egg consumption (CC minus G-carriers: 0.328±0.180 mmol/L) than when average cholesterol concentrations were reduced during placebo consumption (0.080±0.173 mmol/L). Results for LDL-cholesterol were also consistent with quantile-dependent expressivity (Pinteraction<0.05, results not displayed).
Pérez-Martinez et al. report that changing from a SFA-rich diet to a carbohydrate-rich diet produced significantly greater decreases (Pinteraction=0.007) in LDL-cholesterol concentrations in the exon 1 G>A mutation at the scavenger receptor class B type I (SRB-1) gene (1/2 heterozygotes, 23% reduction) than 1/1 homozygotes (16% reduction) [28]. However, Figure 4D shows that the dietary change decreased average LDL-cholesterol concentrations from 2.58±0.05 to 2.14±0.05 mmol/L and the difference between 1/2 and 1/1 genotypes went from 0.18±0.12 to −0.03±0.12 mmol/L, consistent with quantile-dependent expressivity.
Guevara-Cruz et al.’s [29] report of significantly greater cholesterol reductions in G-carriers than AA homozygotes of rs12449157 in the glucose-fructose oxidoreductase domain containing 2 (GFOD2) locus following a three-month low-saturated-fat diet with 25 g soy protein and 15 g soluble fiber (2.17±0.25 vs. 1.04±0.13 mmol/L reductions, P=0.0001). Figure 4E suggests that the difference between genotypes could also be due to smaller effect size on the treatment than the basal diet (AG/GG-AA: 0.11 vs. 1.24 mmol/L) corresponding to the lower average cholesterol concentration on the treatment vs. the basal diet (5.81 vs. 7.35 mmol/L).
Weight
Jemaa et al.’s [30] report showed that overweight subjects with the Del allele of the APOB Ins/Del signal peptide polymorphism were predisposed to higher total cholesterol levels, and that the polymorphism significantly affected the 2.5-month cholesterol change during a low calorie diet. The diet decreased BMI from 33.27±0.33 to 31.19±0.31 kg/m2. The histogram in Figure 4F shows their results from the precision medicine perspective of the cholesterol decrease being greater in carriers of the Del-allele than InsIns homozygotes (−0.328 vs. −0.08 mmol/L, P=0.001). The line graph in Figure 4F shows their results from the perspective of quantile-dependent expressivity, i.e., that the cholesterol difference between carriers of the Del-allele and InsIns homozygotes decreased from 0.26±0.14 to 0.02±0.13 mmol/L as average total cholesterol decreased from 5.63±0.07 to 5.43±0.07 mmol/L.
Discussion
The preceding analyses showed that total cholesterol heritability in the narrow sense (h2) increased with increasing average cholesterol concentrations (Figures 1B and 1C). This supports our previous report of quantile-dependent expressivity for the effects of GRSTC and GRSLDL on total- and LDL-cholesterol concentrations [4] using a more inclusive genetic measure (h2) in a larger population. The decrease in cholesterol heritability following drug treatment was attributable to quantile-dependent expressivity and the drug-induced 0.94 mmol/L decrease in cholesterol concentrations (Figure 2). Others have also reported that lipid-lowering medications decrease cholesterol heritability [31]. These results have important implications with respect to previous reports on pharmacogenetic, nutrigenetic, and gene-environment interactions of total and LDL-cholesterol.
Pharmacogenetics
Pharmacogenetics seeks to individualize drug prescriptions through the use of genetic markers that identify patients most likely to benefit from specific treatments. Quantile-dependent expressivity postulates, in some cases, that drugs alter the phenotype (e.g., lower cholesterol level), which in turn alters the expressivity of genetic variants. More simply stated, these genetic markers merely track the change in heritability with changing cholesterol concentrations.
Our analyses of Hopewell et al.’s data (Figure 3A and 3B) suggest that two of the four recognized markers of statin efficacy [20] are consistent with quantile-dependent expressivity. Their data did not suggest that the phenomenon accounts for the effects of LPA or SLCO1B1 genotypes on the statin response. SLCO1B1’s effect on statin efficacy has been attributed to delayed hepatic uptake of statins [32]. LPA’s effect has been attributed to its association with Lp(a) particle concentrations, which are unaffected by statin therapy [32]. Quantile-dependent expressivity is a simple explanation for APOE and SORT1/CELSR2/PSRC1’s effects on statin efficacy. Their significance for statin change is because of their strong associations with LDL-cholesterol concentrations cross-sectionally, i.e., P=5×10−241 for SORT1/CELSR2/PSRC1 and P=2×10−178 for APOE [14]. Specifically, APOE and SORT1/CELSR2/PSRC1 are just simply among the strongest genetic signals tracking the change in heritability when average LDL-cholesterol concentrations are reduced. It is unnecessary to hypothesize any direct pharmacologic interaction of these genes with statin.
The histograms of 3A and 3B may seem unfamiliar because it is generally reported that the minor allele of APOE rs445925 (a proxy for rs7412) and SORT1/CLESR2/PSRC1 rs646776 SNPs are associated with larger statin responses [32], but this is true only for the percent change in LDL-cholesterol, where the per variant effect is 2.55±0.29 (P=4.8×10⁻¹⁸) for APOE and 0.47±0.17 (P=6.7×10⁻³) for SORT1. Their effect on the absolute change in LDL is −0.159±0.014 (P=2.7×10⁻³⁰) for APOE and −0.031±0.008 for SORT1 (P=9.5×10⁻⁵). Not only do the SNPs have the opposite effects on the percent LDL-change and absolute LDL-change, but also the relationships are less significant for the percent change. This is not true for the LPA and SLCO1B1 effects reported by Hopewell et al., in which the percent change and absolute change are in the same direction, and the effects of the percent change are more significant than the absolute change
Nutrigenetics
Similarly, studies by Dreon et al. [21], Friedlander et al. [22], Tikkanen et al. [23] and Moreno et al. [24] (Figure 3C–3F, respectively) showed differences in diet-induced cholesterol change between APOE genotypes that could also be attributed to smaller differences between genotypes when mean cholesterol concentrations were reduced. Others report effects of diet on cholesterol concentrations that are modified by LPL [25], APOA4 [26], ABCG5 [27], SRB-1 [28], GFOD2 [29], and APOB [30] polymorphisms (Figures 4A–4F, respectively). In each case, the purported genotype-specific effects of the dietary intervention, represented by the histograms, might be more simply explained by smaller genetic effects at lower post-diet cholesterol concentration vis-à-vis larger genetic effects at the higher pre-diet concentration.
Gene-environment interactions
Other gene-environment interactions potentially attributable to quantile-dependent expressivity include Marques-Vidal et al.’s [33] analysis of APOE isoforms, Zhang et al.’s [34] analysis of TIMD4-HAVCR1 rs1501908, and Surakka et al.’s [35] analysis of PCDH7 and CCKAR rs6448771 affecting the weight-cholesterol relationship; Pisciotta et al.’s [36] analysis of APOE isoforms affecting the exercise-cholesterol relationship; Schaefer et al.’s [37] analysis of APOE isoforms affecting the menopause-cholesterol relationship; Almeida et al.’s [38] analysis of APOE isoforms affecting estrogen-cholesterol relationships; and McCombs et al.’s [39] analysis of APOA4 and Du et al.’s [40] analysis of CETP TaqIB and LDLR PvuII polymorphisms affecting diet-cholesterol relationships. These are illustrated in Supplementary Figure 2 and are discussed in the supplementary material.
Limitations.
It is well recognized that statistical interactions need not imply the existence of biological interactions [41,42]. The interpretation of βOP and βFS as heritability from Falconer and Mackay’s formula assumes a simple genetic model that ignores shared environmental effects. Heritability is not invariant to logarithmic and other data transformations, and may vary from population to population if the variance in the phenotype changes in the presence of a fixed genetic variance [1]. A larger phenotype variance at higher cholesterol concentration would be expected to produce a smaller h2 estimate for a fixed genetic effect, in contrast to the higher h2 at higher quantiles of the cholesterol distribution in Figure 1. The analyses of the current report are based on (untransformed) total cholesterol concentrations because quantile regression does not require normality.
In conclusion, the heritability of total cholesterol and LDL-cholesterol appear to be quantile dependent. From a precision medicine perspective, genetic variants associated with APOA4, APOB, APOE, GFOD2, LPL, SORT1, and SRB-1 could potentially individualize statin, diet, and weight loss recommendations for cholesterol management. Alternatively, the cholesterol reductions produced by these therapies might simply affect a gene’s expressivity. A patient’s cholesterol response might affect a gene’s contribution to their cholesterol level, rather than the gene affecting their cholesterol response. For complex polygenic traits, clinical biomarkers often continue to be the best guide for drug or diet prescription.
Supplementary Material
Highlights.
Heritability (h2) can be estimated from parent-offspring or sibling regression slopes
“Quantile-dependent h2” is when h2 depends on whether the phenotype is high vs. low.
Cholesterol h2 varies from 0.38 at the 10% to 0.65 at the 90% of its distribution
This potentially accounts for the h2 decrease from 0.55 to 0.34 when cholesterol was lowered by drugs.
It may also explain the effects of CELSR2/PSRC1/SORT1 and APOE on statin efficacy.
Acknowledgement
The Framingham Heart Study is conducted and supported by the National Heart, Lung, and Blood Institute (NHLBI) in collaboration with Boston University (Contract No. N01-HC-25195 and HHSN268201500001I). This manuscript was not prepared in collaboration with investigators of the Framingham Heart Study and does not necessarily reflect the opinions or views of the Framingham Heart Study, Boston University, or NHLBI.
This research was supported by NIH grant R21ES020700 from the National Institute of Environmental Health Sciences, and an unrestricted gift from HOKA ONE ONE.
Footnotes
Publisher's Disclaimer: This is a PDF file of an unedited manuscript that has been accepted for publication. As a service to our customers we are providing this early version of the manuscript. The manuscript will undergo copyediting, typesetting, and review of the resulting proof before it is published in its final form. Please note that during the production process errors may be discovered which could affect the content, and all legal disclaimers that apply to the journal pertain.
The author takes responsibility for all aspects of the reliability and freedom from bias of the data presented and their discussed interpretation. The authors report no relationships that could be construed as a conflict of interest
References
- 1.Falconer DS, Mackay TFC. Introduction to Quantative Genetics. 4th edition. 2004. Pearson Education Limited; London: ISBN 978-81-317-2740-9 [Google Scholar]
- 2.Koenker R, Hallock KF. Quantile regression. J Economic Perspectives. 2001;15:143–56. [Google Scholar]
- 3.Gould WW. Quantile regression with bootstrapped standard errors. Stata Technical Bulletin. 1992;9:19–21. [Google Scholar]
- 4.Williams PT. Quantile-specific penetrance of genes affecting lipoproteins, adiposity and height. PLoS One. 2012;7:e28764. doi: 10.1371/journal.pone.0028764 [DOI] [PMC free article] [PubMed] [Google Scholar]
- 5.Williams PT. Gene-environment interactions due to quantile-specific heritability of triglyceride and VLDL concentrations. Sci Rep. 2020;10:4486. doi: 10.1038/s41598-020-60965-9 [DOI] [PMC free article] [PubMed] [Google Scholar]
- 6.Williams PT. Quantile-dependent expressivity of postprandial lipemia. PLoS One. 2020;15(2):e0229495. doi: 10.1371/journal.pone.0229495 [DOI] [PMC free article] [PubMed] [Google Scholar]
- 7.Williams PT. Quantile-specific heritability of high-density lipoproteins with implications for precision medicine. J Clin Lipidol. 2020;14:448–458.e0. doi: 10.1016/j.jacl.2020.05.099. [DOI] [PMC free article] [PubMed] [Google Scholar]
- 8.Williams PT. Quantile-dependent expressivity and gene-lifestyle interactions involving high-density lipoprotein cholesterol. Lifestyle genomics 2020. (in press) [DOI] [PMC free article] [PubMed] [Google Scholar]
- 9.Williams PT. Quantile-dependent heritability of computed tomography, dual-energy x-ray absorptiometry, anthropometric, and bioelectrical measures of adiposity. Int J Obes (Lond). 2020;44:2101–2112. doi: 10.1038/s41366-020-0636-1. [DOI] [PMC free article] [PubMed] [Google Scholar]
- 10.Williams PT. Spirometric traits show quantile-dependent heritability, which may contribute to their gene-environment interactions with smoking and pollution. PeerJ 2020; 8:e9145 10.7717/peerj.9145 [DOI] [PMC free article] [PubMed] [Google Scholar]
- 11.Williams PT. Quantile-dependent expressivity of plasma adiponectin concentrations may explain its sex-specific heritability, gene-environment interactions, and genotype-specific response to postprandial lipemia. PeerJ. 2020;8:e10099. doi: 10.7717/peerj.10099. [DOI] [PMC free article] [PubMed] [Google Scholar]
- 12.Williams PT. Quantile-specific heritability may account for gene-environment interactions involving coffee consumption. Behav Genet. 2020. 50:119–26. doi: 10.1007/s10519-019-09989-0. [DOI] [PMC free article] [PubMed] [Google Scholar]
- 13.Williams PT. Quantile-specific heritability of intakes of alcohol but not other macronutrients. Behav Genet. 2020;50:332–345. doi: 10.1007/s10519-020-10005-z. [DOI] [PMC free article] [PubMed] [Google Scholar]
- 14.Willer CJ, Schmidt EM, Sengupta S, Peloso GM, Gustafsson S, Kanoni S, et al. Discovery and refinement of loci associated with lipid levels. Nat Genet. 2013;45:1274–1283. doi: 10.1038/ng.2797. [DOI] [PMC free article] [PubMed] [Google Scholar]
- 15.Dawber TR, Meadors GF, Moore FE Jr Epidemiological approaches to heart disease: the Framingham Study. Am J Public Health Nations Health 1951;41:279–81. doi: 10.2105/ajph.41.3.279. [DOI] [PMC free article] [PubMed] [Google Scholar]
- 16.Kannel WB, Feinleib M, McNamara PM, Garrison RJ, Castelli WP. An investigation of coronary heart disease in families. The Framingham offspring study. Am J Epidemiol. 2006;110:281–90. doi: 10.1093/oxfordjournals.aje.a112813. [DOI] [PubMed] [Google Scholar]
- 17.Splansky GL, Corey D, Yang Q, Atwood LD, Cupples LA, Benjamin EJ, et al. The Third Generation Cohort of the National Heart, Lung, and Blood Institute’s Framingham Heart Study: design, recruitment, and initial examination. Am J Epidemiol. 2007;165:1328–35. doi: 10.1093/aje/kwm021. [DOI] [PubMed] [Google Scholar]
- 18.Winer BJ, Brown DR, Michels KM. 1991. Statistical principles in experimental design. Third edition. McGraw-Hill; New York. [Google Scholar]
- 19.Wilk MB, Gnanadesikan R. Probability plotting methods for the analysis of data”, Biometrika 1968;55:1–17. [PubMed] [Google Scholar]
- 20.Hopewell JC, Parish S, Offer A, Link E, Clarke R, Lathrop M, Armitage J, Collins R; MRC/BHF Heart Protection Study Collaborative Group. Impact of common genetic variation on response to simvastatin therapy among 18 705 participants in the Heart Protection Study. Eur Heart J. 2013;34:982–92. doi: 10.1093/eurheartj/ehs344. [DOI] [PMC free article] [PubMed] [Google Scholar]
- 21.Dreon DM, Fernstrom HA, Miller B, Krauss RM. Apolipoprotein E isoform phenotype and LDL subclass response to a reduced-fat diet. Arterioscler Thromb Vasc Biol. 1995;15:105–11. doi: 10.1161/01.atv.15.1.105. [DOI] [PubMed] [Google Scholar]
- 22.Friedlander Y, Berry EM, Eisenberg S, Stein Y, Leitersdorf E. Plasma lipids and lipoproteins response to a dietary challenge: analysis of four candidate genes. Clin Genet. 1995;47:1–12. doi: 10.1111/j.1399-0004.1995.tb03913.x [DOI] [PubMed] [Google Scholar]
- 23.Tikkanen MJ, Huttunen JK, Ehnholm C, Pietinen P. Apolipoprotein E4 homozygosity predisposes to serum cholesterol elevation during high fat diet. Arteriosclerosis. 1990;10:285–8. doi: 10.1161/01.atv.10.2.285. [DOI] [PubMed] [Google Scholar]
- 24.Moreno JA, Pérez-Jiménez F, Marín C, Gómez P, Pérez-Martínez P, Moreno R, et al. Apolipoprotein E gene promoter −219G->T polymorphism increases LDL-cholesterol concentrations and susceptibility to oxidation in response to a diet rich in saturated fat. Am J Clin Nutr. 2004;80:1404–9. doi: 10.1093/ajcn/80.5.1404 [DOI] [PubMed] [Google Scholar]
- 25.Humphries SE, Talmud PJ, Cox C, Sutherland W, Mann J. Genetic factors affecting the consistency and magnitude of changes in plasma cholesterol in response to dietary challenge. QJM. 1996;89:671–80. doi: 10.1093/qjmed/89.9.671. [DOI] [PubMed] [Google Scholar]
- 26.Jansen S, Lopez-Miranda J, Salas J, Ordovas JM, Castro P, Marin C, et al. Effect of 347-serine mutation in apoprotein A-IV on plasma LDL cholesterol response to dietary fat. Arterioscler Thromb Vasc Biol. 1997;17:1532–8. doi: 10.1161/01.atv.17.8.1532. [DOI] [PubMed] [Google Scholar]
- 27.Herron KL, McGrane MM, Waters D, Lofgren IE, Clark RM, Ordovas JM, et al. The ABCG5 polymorphism contributes to individual responses to dietary cholesterol and carotenoids in eggs. J Nutr. 2006;136:1161–5. doi: 10.1093/jn/136.5.1161. [DOI] [PubMed] [Google Scholar]
- 28.Pérez-Martínez P, Ordovás JM, López-Miranda J, Gómez P, Marín C, Moreno J, et al. Polymorphism exon 1 variant at the locus of the scavenger receptor class B type I gene: influence on plasma LDL cholesterol in healthy subjects during the consumption of diets with different fat contents. Am J Clin Nutr 2003;77:809–13. doi: 10.1093/ajcn/77.4.809. [DOI] [PubMed] [Google Scholar]
- 29.Guevara-Cruz M, Lai CQ, Richardson K, Parnell LD, Lee YC, Tovar AR, et al. Effect of a GFOD2 variant on responses in total and LDL cholesterol in Mexican subjects with hypercholesterolemia after soy protein and soluble fiber supplementation. Gene. 2013;532:211–5. doi: 10.1016/j.gene.2013.09.055. [DOI] [PubMed] [Google Scholar]
- 30.Jemaa R, Mebazâa A, Fumeron F. Apolipoprotein B signal peptide polymorphism and plasma LDL-cholesterol response to low-calorie diet. Int J Obes Relat Metab Disord. 2004;28:902–5. doi: 10.1038/sj.ijo.0802648. [DOI] [PubMed] [Google Scholar]
- 31.Wu J, Province MA, Coon H, Hunt SC, Eckfeldt JH, Arnett DK, et al. An investigation of the effects of lipid-lowering medications: genome-wide linkage analysis of lipids in the HyperGEN study. BMC Genet. 2007;10;8:60. doi: 10.1186/1471-2156-8-60. [DOI] [PMC free article] [PubMed] [Google Scholar]
- 32.Postmus I, Trompet S, Deshmukh HA, Barnes MR, Li X, Warren HR, et al. Pharmacogenetic meta-analysis of genome-wide association studies of LDL cholesterol response to statins. Nat Commun. 2014;5:5068. doi: 10.1038/ncomms6068. [DOI] [PMC free article] [PubMed] [Google Scholar]
- 33.Marques-Vidal P, Bongard V, Ruidavets JB, Fauvel J, Hanaire-Broutin H, Perret B, et al. Obesity and alcohol modulate the effect of apolipoprotein E polymorphism on lipids and insulin. Obes Res. 2003;11:1200–6. doi: 10.1038/oby.2003.165. [DOI] [PubMed] [Google Scholar]
- 34.Zhang QH, Yin RX, Chen WX, Cao XL, Chen YM. Association between the TIMD4-HAVCR1 variants and serum lipid levels, coronary heart disease and ischemic stroke risk and atorvastatin lipid-lowering efficacy. Biosci Rep. 2018;38:BSR20171058. doi: 10.1042/BSR20171058. [DOI] [PMC free article] [PubMed] [Google Scholar]
- 35.Surakka I, Isaacs A, Karssen LC, Laurila PP, Middelberg RP, Tikkanen E, et al. A genome-wide screen for interactions reveals a new locus on 4p15 modifying the effect of waist-to-hip ratio on total cholesterol. PLoS Genet. 2011;7:e1002333. doi: 10.1371/journal.pgen.1002333 [DOI] [PMC free article] [PubMed] [Google Scholar]
- 36.Pisciotta L, Cantafora A, Piana A, Masturzo P, Cerone R, Minniti G, et al. Physical activity modulates effects of some genetic polymorphisms affecting cardiovascular risk in men aged over 40 years. Nutr Metab Cardiovasc Dis. 2003;13:202–10. doi: 10.1016/s0939-4753(03)80012-1. [DOI] [PubMed] [Google Scholar]
- 37.Schaefer EJ, Lamon-Fava S, Johnson S, Ordovas JM, Schaefer MM, Castelli WP, et al. Effects of gender and menopausal status on the association of apolipoprotein E phenotype with plasma lipoprotein levels. Results from the Framingham Offspring Study. Arterioscler Thromb. 1994;14:1105–13. doi: 10.1161/01.atv.14.7.1105. [DOI] [PubMed] [Google Scholar]
- 38.Almeida S, Fiegenbaum M, de Andrade FM, Osório-Wender MC, Hutz MH. ESR1 and APOE gene polymorphisms, serum lipids, and hormonal replacement therapy. Maturitas. 2006;54:119–26. doi: 10.1016/j.maturitas.2005.09.009. [DOI] [PubMed] [Google Scholar]
- 39.McCombs RJ, Marcadis DE, Ellis J, Weinberg RB. Attenuated hypercholesterolemic response to a high-cholesterol diet in subjects heterozygous for the apolipoprotein A-IV-2 allele. N Engl J Med. 1994;331:706–10. doi: 10.1056/NEJM199409153311104. [DOI] [PubMed] [Google Scholar]
- 40.Du J, Fang DZ, Lin J, Xiao LY, Zhou XD, Shigdar S, Duan W. TaqIB polymorphism in the CETP gene modulates the impact of HC/LF diet on the HDL profile in healthy Chinese young adults. J Nutr Biochem. 2010;21:1114–9. doi: 10.1016/j.jnutbio.2009.09.009. [DOI] [PubMed] [Google Scholar]
- 41.Siemiatycki J, Thomas DC. Biological models and statistical interactions: an example from multistage carcinogenesis. Int J Epidemiol. 1981;10:383–7. doi: 10.1093/ije/10.4.383. [DOI] [PubMed] [Google Scholar]
- 42.Thompson WD. Effect modification and the limits of biological inference from epidemiologic data. J Clin Epidemiol. 1991;44:221–32. doi: 10.1016/0895-4356(91)90033-6. [DOI] [PubMed] [Google Scholar]
Associated Data
This section collects any data citations, data availability statements, or supplementary materials included in this article.