
Figure 2.
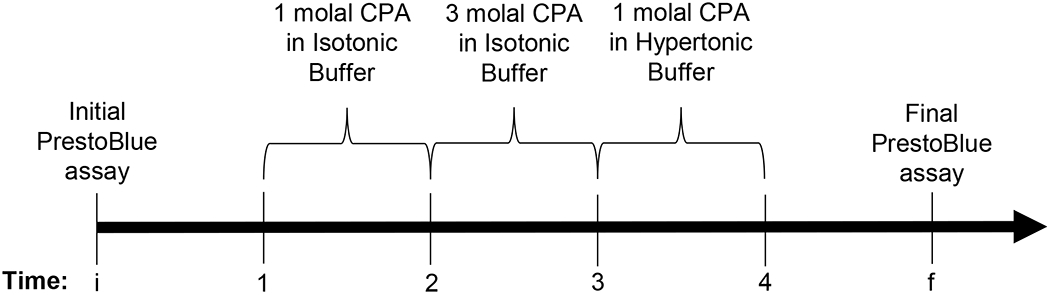
Timeline for an experiment with a maximum CPA concentration of 3 molal, showing the CPA addition and removal steps in relation to the PrestoBlue assays.
Official websites use .gov
A
.gov website belongs to an official
government organization in the United States.
Secure .gov websites use HTTPS
A lock (
) or https:// means you've safely
connected to the .gov website. Share sensitive
information only on official, secure websites.
Timeline for an experiment with a maximum CPA concentration of 3 molal, showing the CPA addition and removal steps in relation to the PrestoBlue assays.