Abstract
Purpose
This study assesses the rate of enhancement of breast fibroglandular tissue after administration of a magnetic resonance imaging (MRI) gadolinium-based contrast agent and determine its relationship with response to neoadjuvant therapy (NAT) in women with breast cancer.
Method
Women with locally advanced breast cancer (N = 19) were imaged four times over the course of NAT. Dynamic contrast-enhanced (DCE) MRI was acquired after administration of a gadolinium-based contrast agent with a temporal resolution of 7.27 sec. The tumor, fibroglandular tissue, and adipose tissue were semi-automatically segmented using a manually drawn region of interest encompassing the tumor followed by fuzzy c-means clustering. The rate and relative intensity of signal enhancement were calculated for each voxel within the tumor and fibroglandular tissue.
Results
The rate of fibroglandular tissue enhancement after contrast agent injection declined by an average of 29% over the course of NAT. This decline was present in 16 of the 19 patients in the study. The rate of enhancement is significantly higher in women who achieve pathological complete response (pCR) after both 1 cycle (68% higher, p < 0.05) and after 3–5 cycles of NAT (58% higher; p < 0.05). The relative intensity of fibroglandular enhancement correlates with the rate of enhancement (R2 = 0.64, p < 0.001) and is higher in women who achieve pCR after both 1 cycle and after 3–5 cycles of NAT (p < 0.05, both timepoints).
Conclusion
The rate of fibroglandular tissue enhancement declines over the course of therapy, provides novel information not reflected by tumoral measures, and may predict pathological response early in the course of therapy, with smaller declines in enhancement in women who achieve favorable response.
Keywords: breast cancer, fibroglandular, ipsilateral, BPE, NAT
INTRODUCTION
Magnetic resonance imaging (MRI) plays a crucial role in both detection of breast cancer and monitoring of therapeutic response [1, 2]. The ability to image tumor alterations due to treatment is of particular importance in neoadjuvant therapy (NAT) [3]. NAT consists of systemic treatment prior to surgery and is performed to downstage the disease, control potential metastases, and reduce tumor size, thereby increasing the odds of breast-conserving surgery [4]. The absence of viable tumor cells at surgery (i.e., pathological complete response (pCR)) correlates with long term survival [5]. Thus, there is great interest in predicting response to NAT to both identify patients who will most benefit from NAT and optimize therapeutic success. MRI has demonstrated potential for predicting the early response of breast tumor to NAT across a range of studies [2, 6, 7].
Dynamic contrast-enhanced MRI (DCE-MRI) is widely used in breast imaging to enhance lesion conspicuity, as the paramagnetic contrast agent accumulates in vascularized tumors. However, the MRI contrast agent also enhances the normal fibroglandular tissue of the breast, a phenomenon known as background parenchymal enhancement (BPE). The degree of BPE is variable between different individuals, is influenced by the hormonal milieu, and can display complex anatomical and kinetic patterns [8]. For further details on BPE, Liao et al. [9] provide a comprehensive review. Importantly, changes in BPE intensity over the course of NAT have been found to correlate with therapeutic efficacy in both the ipsilateral [10] and contralateral [11–13] breast.
While previous studies have demonstrated that the intensity of BPE reflects response to NAT, these studies have not examined the rate of fibroglandular tissue enhancement after contrast agent injection. Examining the kinetics of contrast agent uptake, rather than solely the intensity, has proven fruitful in characterizing breast tumors and their response to therapy [14]. Thus, the purpose of this study was to perform kinetic analysis of ipsilateral fibroglandular tissue acquired at high (7.27 s) temporal resolution. This analysis was performed longitudinally over the course of NAT to predict eventual response to treatment.
MATERIALS AND METHODS
Patient Population
Women with stage II or III locally advanced breast cancer undergoing NAT were recruited from community oncology practices (n = 19). The median patient age was 46 years old (range 25–74). Table 1 summarizes the clinical features of the study population, treatment regimens, and pathological result. For correlation of MRI-derived metrics with treatment response, patients were divided into those who achieved pCR versus those who did not (non-pCR). We further performed subgroup analysis of 11 study participants who received AC-T therapy, the therapeutic regimen which was administered to the majority of our cohort.
Table 1.
Clinical features of the study population
| Patient # | Age | ER | PR | HER2 | Treatment | Pathologic Response |
|---|---|---|---|---|---|---|
| 1 | 54 | + | − | − | ddAC × 4 → Taxol × 12 | Stable Disease |
| 2 | 41 | + | + | + | ddAC × 4 → Taxol/Herceptin/Perjeta × 12 | Pathological Complete Response |
| 3 | 74 | − | − | − | AC × 4 → Taxol × 12 | Progressive Disease |
| 4 | 25 | − | − | - | ddAC × 4 → Taxol × 12 | Near-Pathological Complete Response |
| 5 | 26 | − | − | + | ddAC × 4 → Taxol/Herceptin/Perjeta × 12 | Pathological Complete Response |
| 6 | 41 | + | − | − | ddAC × 4 → Taxol × 12 | Pathological Complete Response |
| 7 | 47 | + | + | − | ddAC × 4 → Taxol × 12 | I’tho.ogical Complete Response |
| 8 | 54 | + | + | − | ddAC × 4 → Taxol × 12 | Stable Disease |
| 9 | 59 | − | − | − | Pembroluzimab (or placebo)/Carboplatin/Taxol × 4 | Stable Disease |
| 10 | 63 | + | + | − | AC × 4 → Taxol × 12 | Stable Disease |
| 11 | 27 | + | + | − | ddAC × 4 → Taxol × 12 | Partial Response |
| 12 | 32 | + | + | + | Taxotere/Carboplatin/Herceptin/Pertuzumab × 6 | Partial Response |
| 13 | 52 | − | − | − | Carboplatin/Taxol × 4 → ddAC × 4 | Partial Response |
| 14 | 38 | − | − | − | Pembroluzimab (or placebo)/Carboplatin/Taxol × 4 → Pembroluzimab (or placebo)/AC × 4 | Pathological Complete Response |
| 15 | 62 | − | − | − | ddAC × 4 → Taxol × 12 | Partial Response |
| 16 | 38 | + | + | + | Taxotere/Carboplatin/Herceptin/Pertuzumab × 6 | Stable Disease |
| 17 | 42 | + | + | − | ddAC × 4 → Taxol × 12 | Partial Response |
| 18 | 58 | − | − | − | Pemboluzimab (or placebo)/Carboplatin/Taxol × 4 → Pembroluzimab (or placebo)/AC × 4 | Stable Disease |
| 19 | 48 | + | + | − | ddAC × 4 → Taxol × 12 | Progressive Disease |
MRI Acquisition
Longitudinal MRI was performed at 4 time points: 1) prior to the start of NAT, 2) after 1 cycle of NAT, 3) after 2–4 cycles of NAT, and 4) 1 cycle after MRI #3. These four time points assess response to the first cycles of each therapeutic regimen for the patients that receive two consecutive regimens (Figure 1A). MRI was performed using 3T Siemens Skyra scanners (Erlangen, Germany) equipped with either 8- or 16-channel receive double breast coil (Sentinelle, Invivo, Gainesville, Florida). Imaging was performed at two different community imaging facilities.
Figure 1.
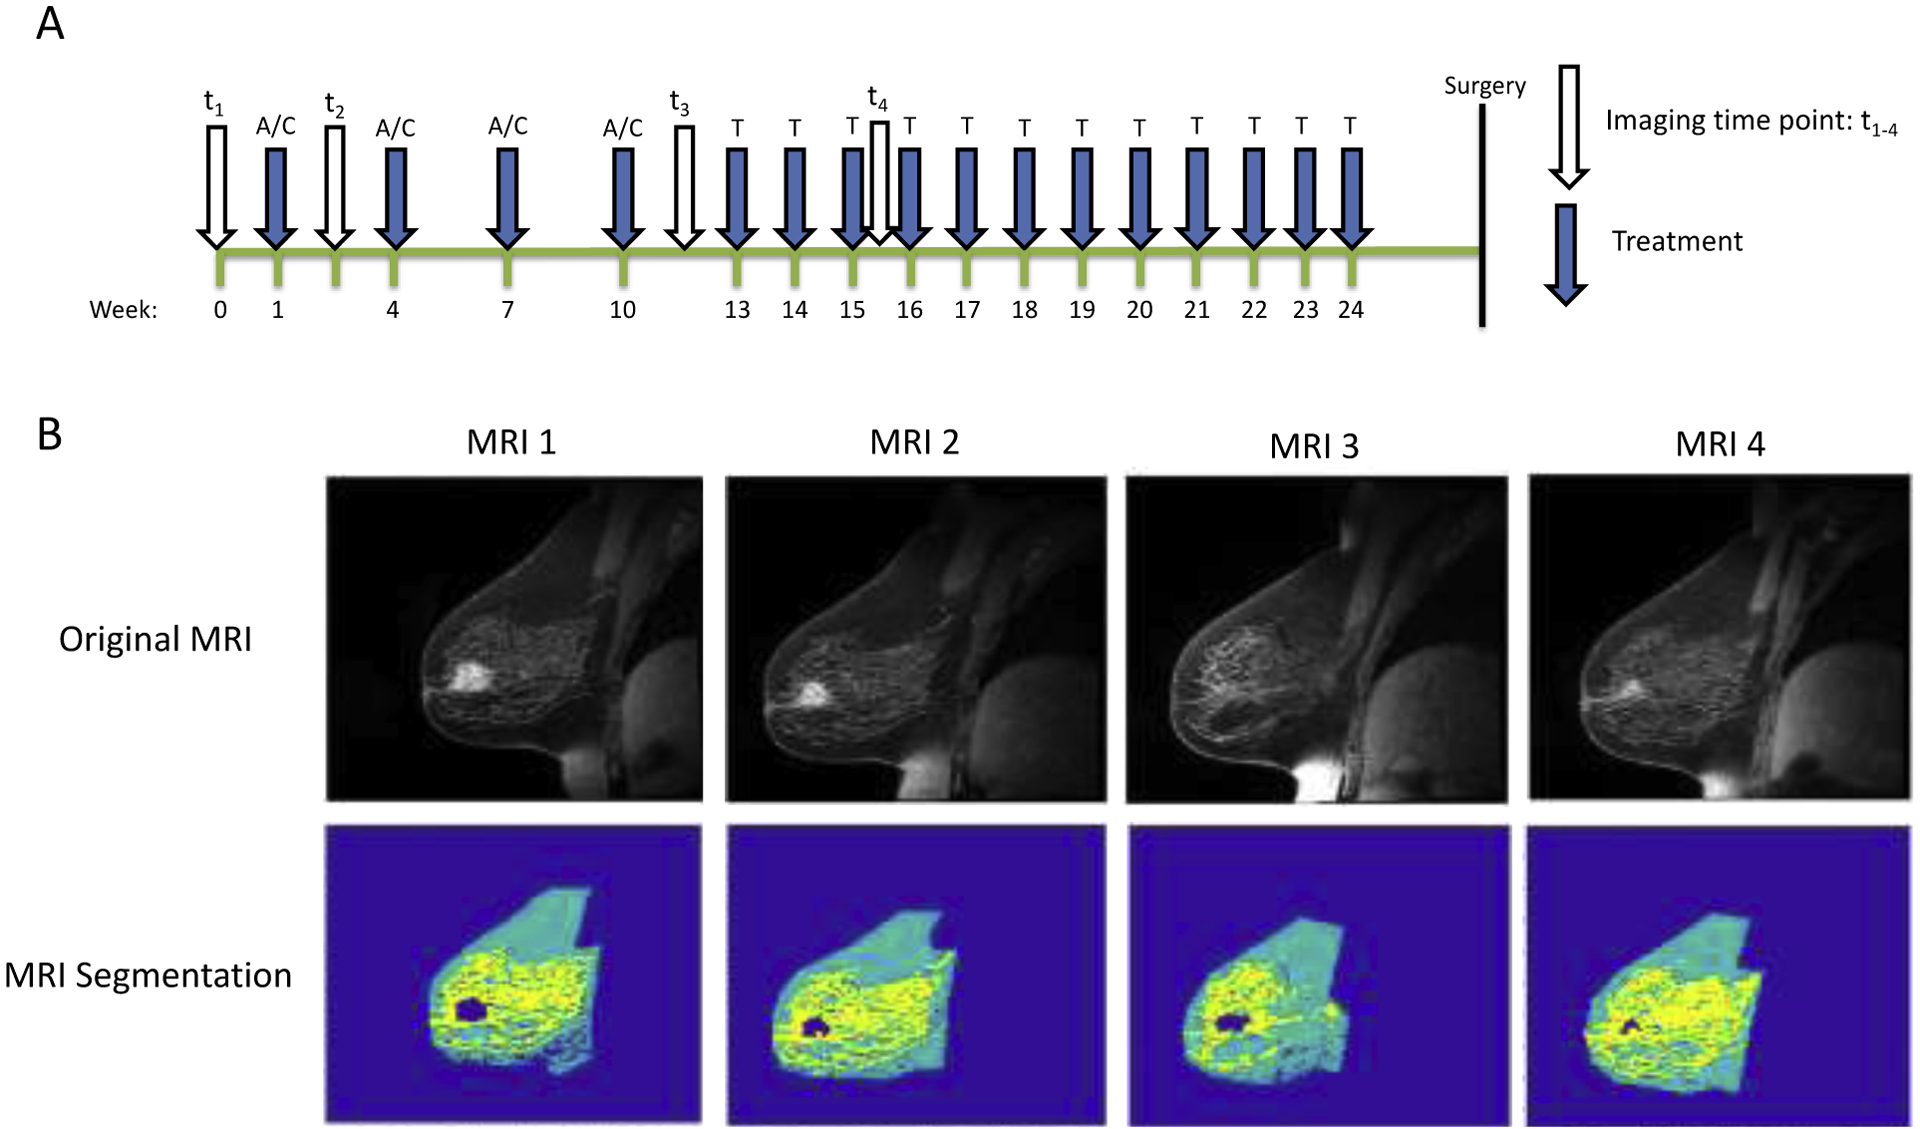
A) Time course demonstrating relative timing of treatment and MRI exams for an individual receiving AC × 4 → Taxol × 12 treatment. B) Example longitudinal MR images from a woman undergoing NAT demonstrating segmentation of tumor (navy), fibroglandular (yellow), and adipose tissue (teal) at each longitudinally-acquired MRI.
All breast MRI data were acquired in the sagittal plane. The DCE-MRI protocol consisted of a T1-weighted, VIBE (Volumetric Interpolated Breath-hold Examination; though no breath-holding was employed in these studies) acquisition with TR/TE = 7.02/4.6 ms, a flip angle of 6°, an acquisition matrix of 192 × 192 over a 256 × 256 mm field of view, with 10 slices of 5 mm thickness each, and GRAPPA (GeneRalized Autocalibrating Partial Parallel Acquisition) acceleration factor of 3. The imaging field of view was centered on the central slice encompassing the tumor. Imaging was performed at 7.27 second temporal resolution for 1 minute prior to and 7 minutes post administration of a gadolinium-based contrast agent (either Multihance (Bracco, Monroe Township, NJ) or Gadovist (Bayer, Leverkusen, Germany)) at standard-of-care concentration via a power injector followed by a saline flush. The MRI protocol also included a high-resolution T1-weighted 3D gradient-echo FLASH (fast low angle shot) acquisition performed at the conclusion of the DCE-MRI acquisition for identifying anatomy and segmentation of tumor, fibroglandular, and adipose tissue. The parameters of this anatomical image were TR/TE = 5.3/2.3 ms, flip angle 20°, acquisition matrix 256 × 256, a 256 × 256 mm field of view, 1 mm slice thickness, GRAPPA acceleration of 2, and SPAIR (SPectral Attenuated Inversion Recovery) fat suppression. Acquisition time for the high-resolution anatomical image was 3 minutes and 11 seconds.
Image Analysis
All image processing was performed in MATLAB (Mathworks, Natick, MA). The tumor was first semi-automatically segmented using a manually drawn region of interest followed by fuzzy c-means clustering of a post-contrast high-resolution anatomical scan. Fibroglandular tissue was segmented from adipose tissue using k-means clustering of the remaining (non-tumor) breast tissue (Figure 1B). Using the kinetic curve for each voxel, the rate of enhancement and relative enhancement from baseline were calculated, as demonstrated in Figure 2. Each voxel’s maximum slope was found using spline fitting. Each voxel’s kinetic curve was fit in five equal subintervals spanning the time course with the first two timepoints excluded due to noise at baseline. The functions were fit using least squares regression using either a zero, first-, second-, or third-degree polynomial function. The degree of polynomial that maximized the goodness of fit for each subinterval was selected. The derivative of each polynomial function was then calculated to find the slope of each subinterval to yield the rate of enhancement for each voxel. The relative enhancement was calculated for each voxel by first calculating the difference between the initial (pre-contrast) and maximum intensity of the fit, and then dividing by the initial intensity. For the purposes of identifying spatial variation in voxels, the Euclidian distance between each fibroglandular voxel and the closest tumor voxel on the same slice was calculated using the MATLAB function ‘bwdist.m’.
Figure 2.
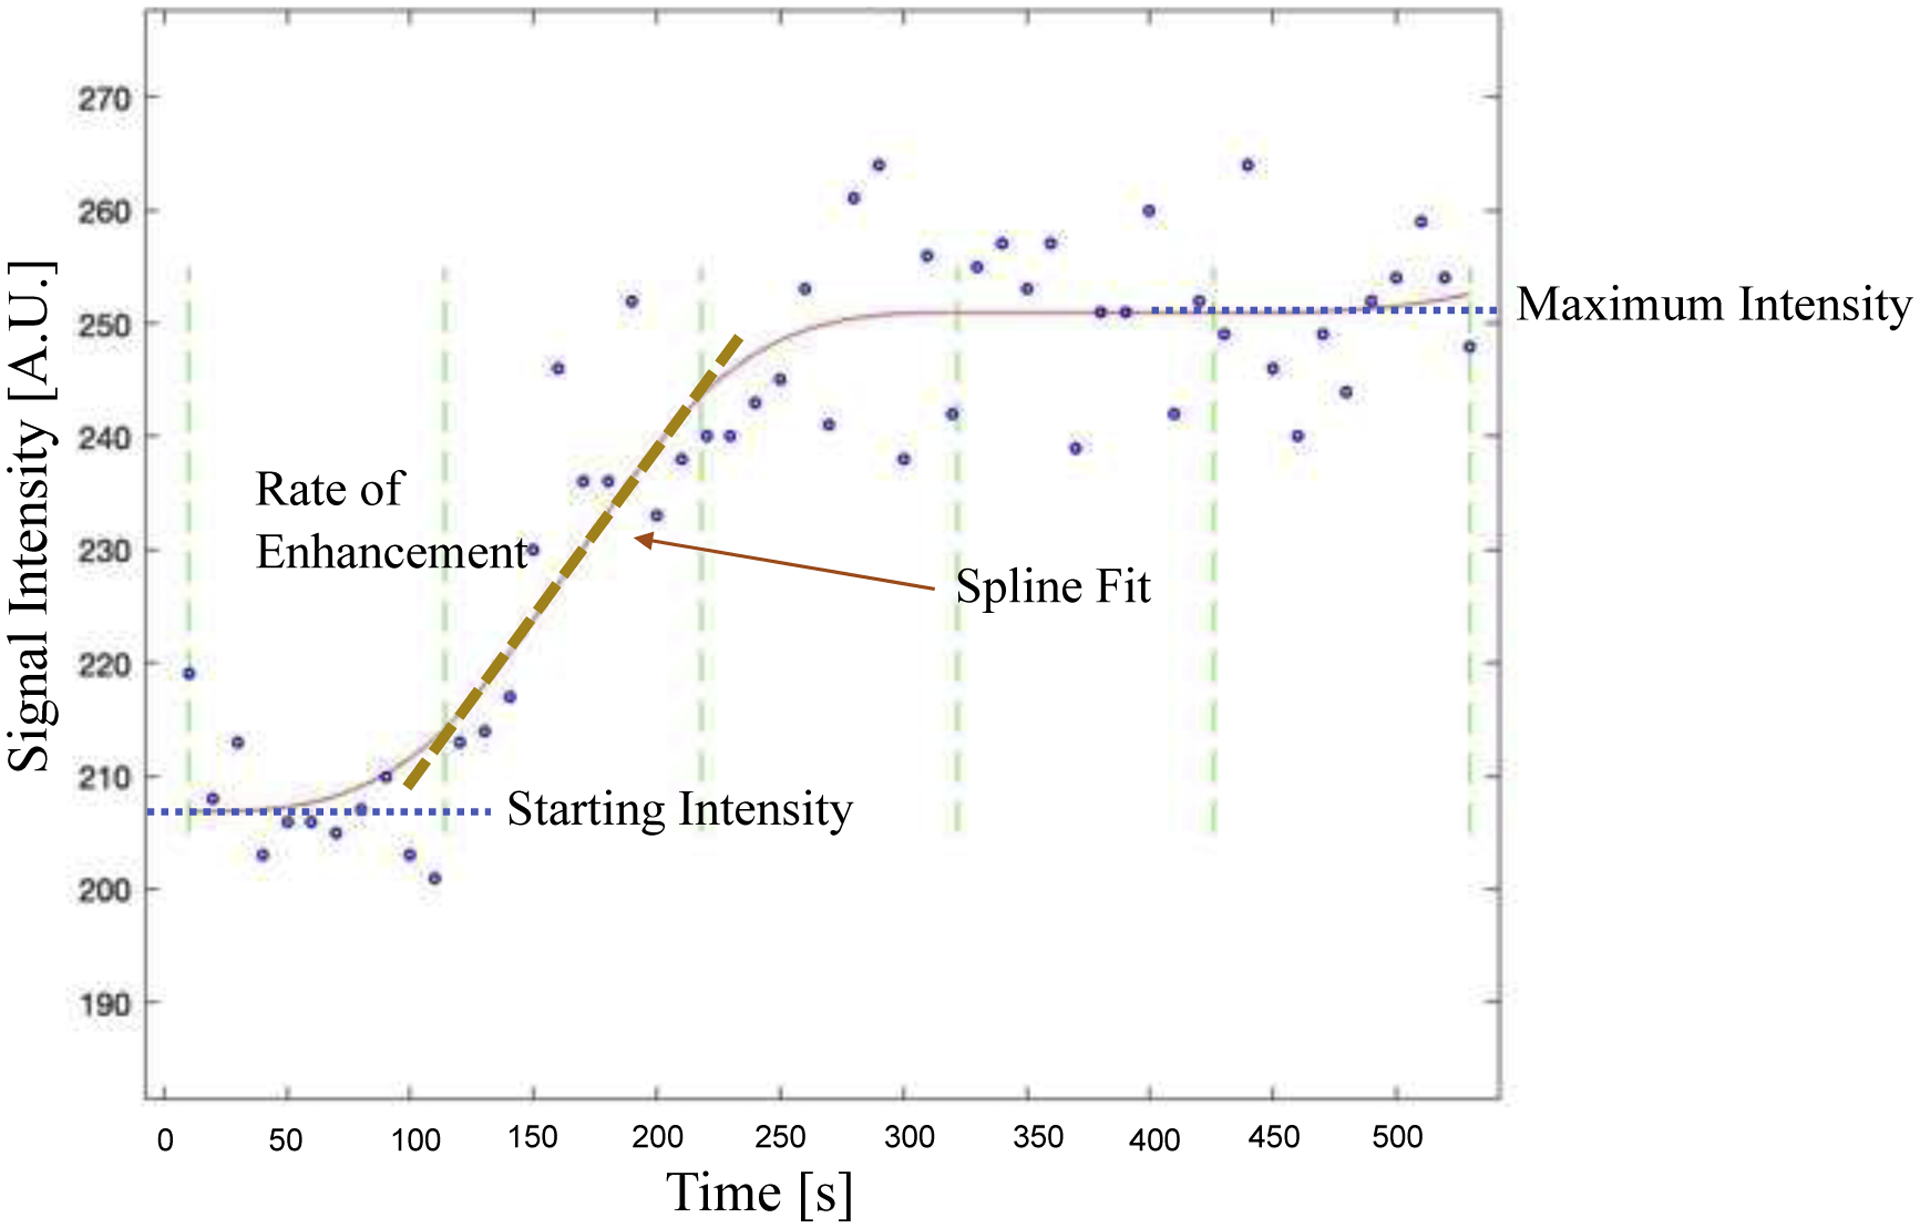
Example kinetic curve of fibroglandular enhancement in a single voxel demonstrating parameters used to calculate the rate of enhancement (slope of the kinetic curve) and relative signal enhancement. The acquired data is shown by blue open circles and the red line indicates the spline fit. Green dashed lines display the five equal subintervals spanning the time course used for spline fitting. The rate of enhancement is shown with the dashed line for the second subinterval. Relative signal enhancement is calculated as the Starting Intensity subtracted from the Maximum Intensity divided by the Starting Intensity.
Statistical Analysis
Statistical analysis was performed using Prism 8 software (Graphpad, San Diego, CA). Associations between two continuous variables were assessed using linear regression. Comparisons between groups (i.e., responders vs. non-responders) were made using a two-tailed unpaired t test. Data are expressed as mean ± standard deviation. A p value of < 0.05 was considered statistically significant.
RESULTS
Fibroglandular Enhancement Does Not Correlate with Tumor Proximity
As this study examined enhancement in the breast containing the tumor, rather than the contralateral breast, we sought to determine whether there was a spatial relationship between the rate or relative intensity of fibroglandular uptake and its proximity to the tumor. There was no discernible correlation between either fibroglandular enhancement rate or intensity and distance from the tumor. Linear regression between the rate of fibroglandular enhancement and the distance from the tumor yielded no significant relationships for any patients, with an average R2 of 0.06. Similarly, linear regression between the intensity of fibroglandular enhancement and the distance from the tumor likewise yielded no significant relationships for any patients, with an average R2 also of 0.06. Given this lack of spatial enhancement patterns, subsequent analyses of enhancement were averaged across all fibroglandular tissue voxels. This averaging across the whole fibroglandular tissue volume smoothed out noisy kinetic curves found in some voxels.
Fibroglandular Enhancement Declines Over the Course of Therapy
After commencing NAT, there was a trend toward slower fibroglandular enhancement across subsequent MRI scans within individual patients (Figure 3A), with considerable variation between patients. When examining relative changes in the rate of BPE (Figure 3B), there was a significant slowing of fibroglandular enhancement over the course of therapy (p < 0.05). The intensity of fibroglandular enhancement similarly showed a trend toward lower values over the course of therapy, with significant variability among patients (Figure 3C). The intensity of enhancment relative to the pre-treatment enhancement trended towards lower values over the course of therapy (Figure 3D), although this decline did not reach statistical significance (p = 0.051). Both the rate and intensity of enhancement declined by 11% on average for each subsequent MRI scan.
Figure 3.
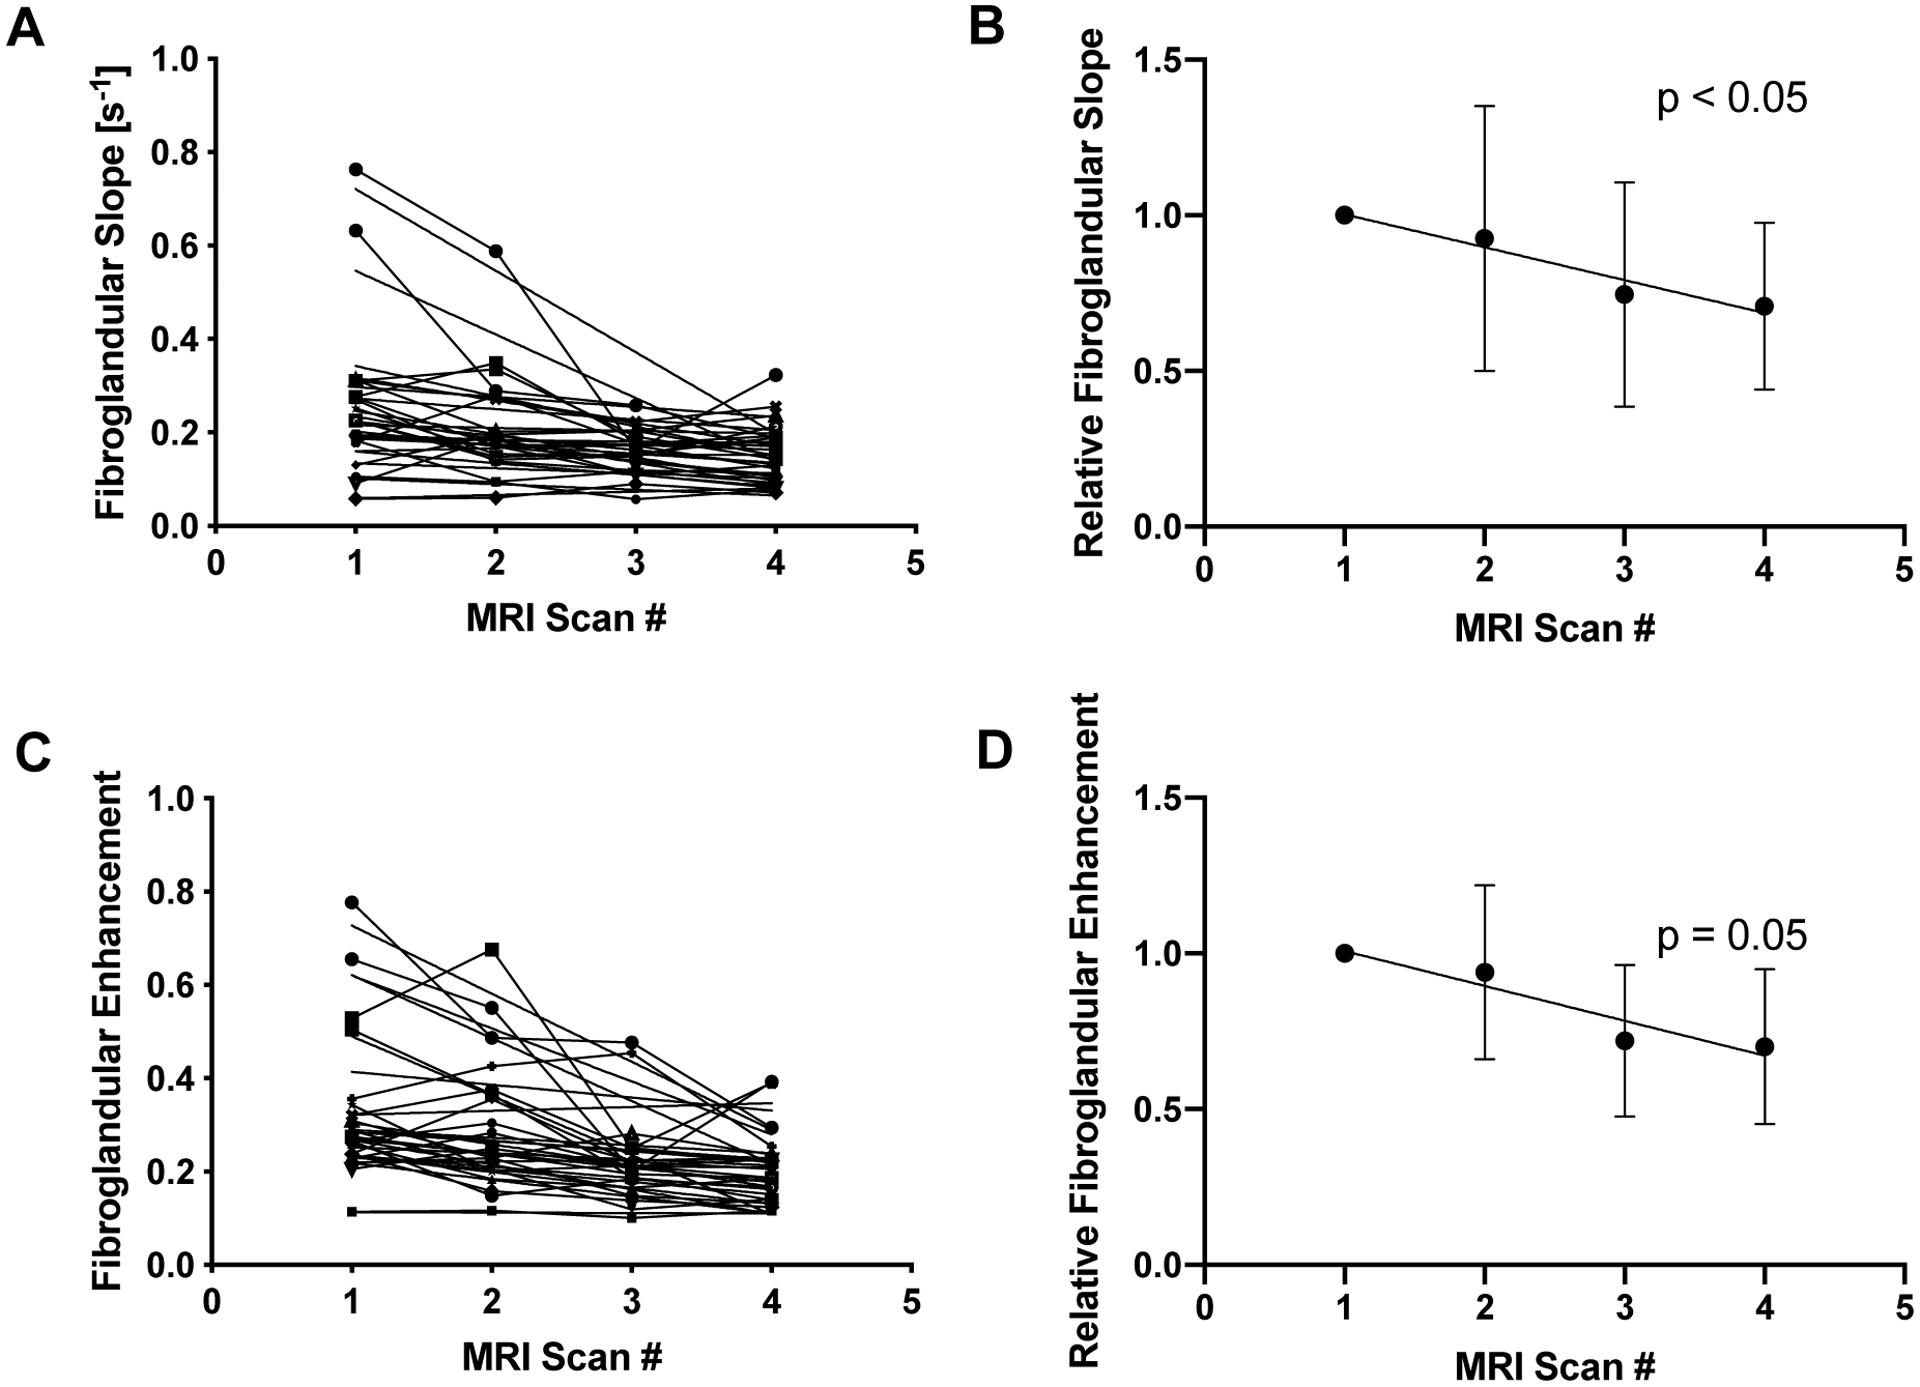
A) Over the course of NAT, the rate of fibroglandular tissue enhancement declined in 17 of 19 patients. B) When normalized to the rate of enhancement prior to therapy, the relative rate of fibroglandular enhancement declined over the treatment period (p < 0.05). C) The relative enhancement of fibroglandular tissue also declined longitudinally over NAT in 17 of 19 patients. D) When normalized to the intensity of enhancement prior to therapy, the relative fibroglandular enhancement trended toward a decline over the treatment period, but did not reach statistical significance (p < 0.05).
There was a direct correlation between the rate and relative intensity of fibroglandular enhancement (p < 0.0001). Prior to commencing NAT, there was a direct correlation between the rate of fibroglandular and tumor enhancement (p < 0.0005; Figure 4A), and the relative intensity of fibroglandular and tumor enhancement (p < 0.005; Figure 4E). However, the correlation between the rate of fibroglandular and tumor enhancement weakened over the course of NAT (Figure 4B, C, D), as the rate of enhancement slowed. Similarly, the correlation between the intensity of fibroglandular enhancement and tumor enhancement lessened over the course of NAT and was no longer significant at the midpoint of therapy (Figure 4F, G, H). We found no correlation between the patient’s age and either the rate or intensity of fibroglandular enhancement. To account for potential differences in contrast agent delivery to the breast, the rate of fibroglandular enhancement was normalized to the rate of tumor uptake. This ratio of the rate of fibroglandular uptake to tumor uptake also did not correlate with age.
Figure 4.
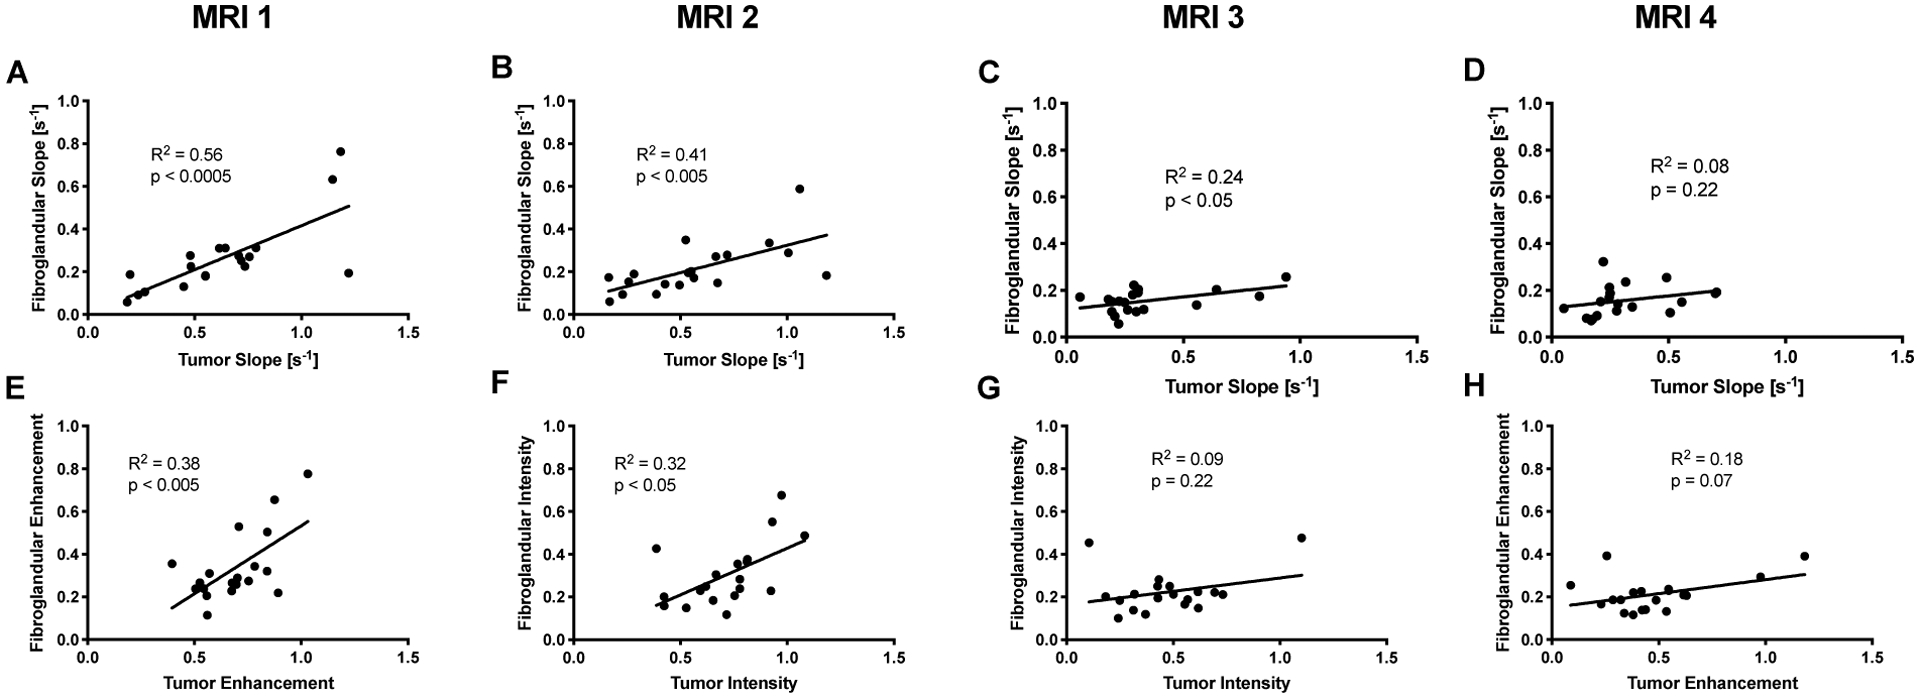
A) Prior to the start of therapy there was a direct correlation between the rate of fibroglandular enhancement and tumor enhancement (p < 0.0005). This relationship weakened progressively over the course of NAT at the B) second, C) third, and D) fourth MRI. E) Similarly, the relative intensity of fibroglandular tissue enhancement correlated with relative tumor enhancement prior to the start of therapy (p < 0.005). However, correlation weakened over the course of therapy at the F) second G) third, and H) fourth MRI.
Fibroglandular Enhancement Predicts Response to Therapy
Patients who achieved favorable response (pCR) had a similar rate of fibroglandular enhancement prior to starting therapy as those who did not achieve pCR (p = 0.18, difference in rates). After starting NAT, the rate of fibroglandular enhancement was 68% higher in women who achieved pCR at the second and 58% higher at the fourth MRI (p < 0.05, Figure 5). The differences in the rate of fibroglandular enhancement were preserved when the rate of fibroglandular uptake was normalized to the rate of tumor uptake (p < 0.05 at both the second and fourth MRI). When examining the relative intensity of enhancement as a percent enhancement over baseline intensity, rather than the rate of enhancement, similar trends were observed. Patients who achieved pCR had a similar relative intensity of fibroglandular enhancement prior to starting therapy as those who did not achieve pCR (p = 0.17, difference in intensities). After starting NAT, the intensity of fibroglandular enhancement was 69% higher in women who achieved pCR at the second MRI and 53% higher at the fourth MRI (p < 0.05, Figure 6). In women who received AC-T therapy, we found a trend of faster fibroglandular uptake in women who achieved pCR at all imaging time points after commencing therapy. However, in this smaller cohort only two patients achieved pCR and we were not powered to reach statistical significance.
Figure 5.
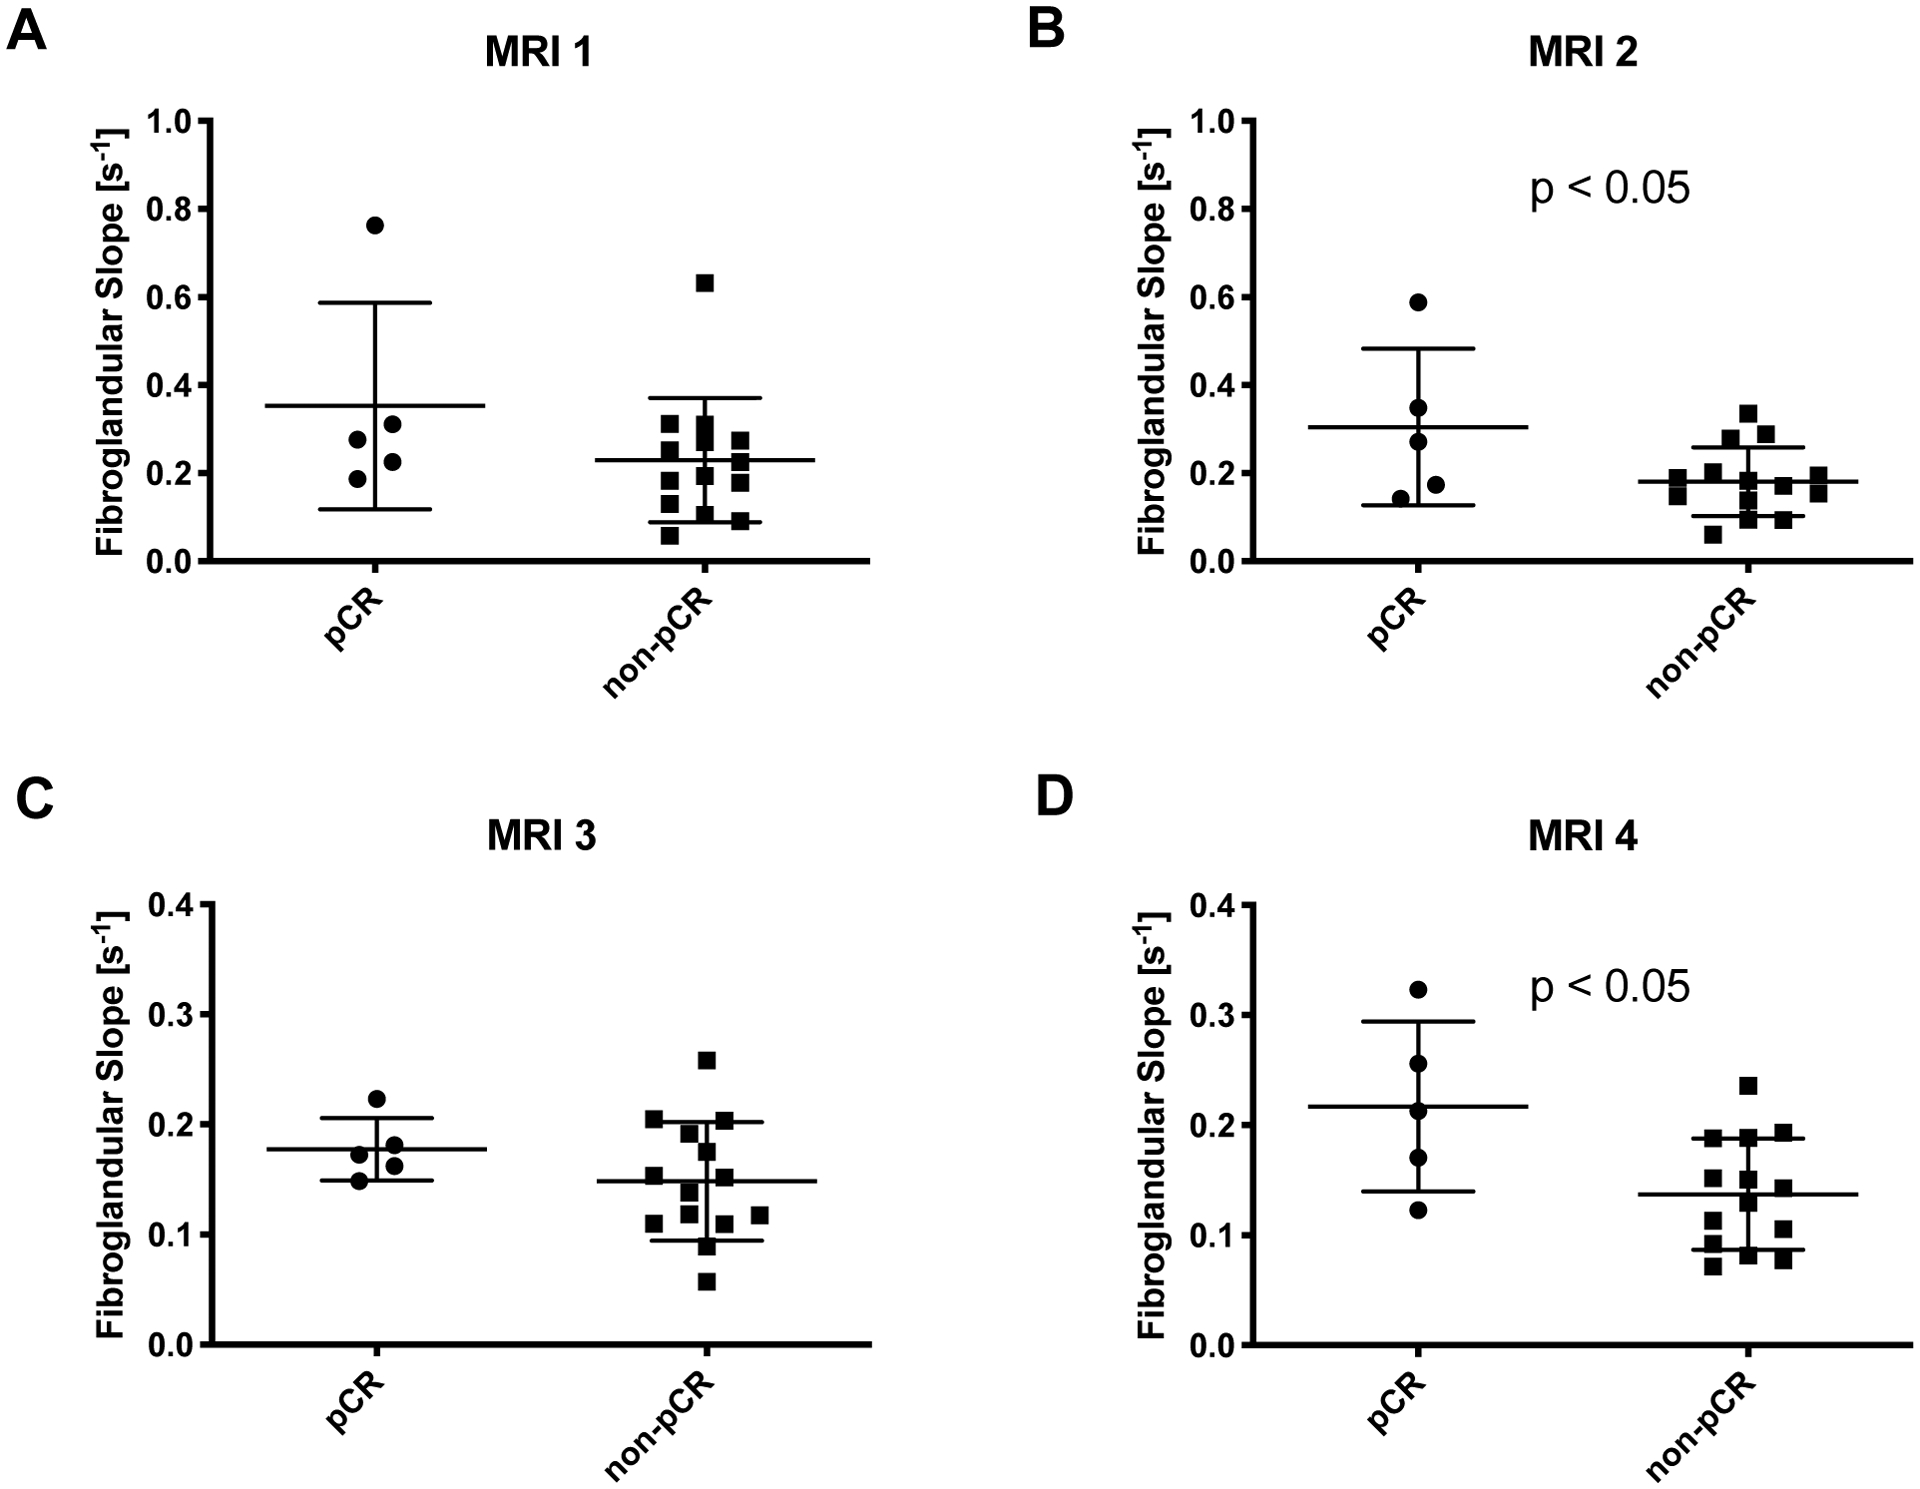
A) Prior to the start of NAT there was no relationship between the rate of fibroglandular enhancement and the eventual pathological response. B) After one cycle of NAT, women who ultimately achieved pCR had a faster rate of fibroglandular enhancement than women who did not achieve pCR (p < 0.05). C) At the midpoint of NAT, there was relationship between the rate of fibroglandular enhancement and the eventual pathological response. D) At the final MRI, women who ultimately achieved pCR had a faster rate of fibroglandular enhancement than women who did not achieve pCR (p < 0.05).
Figure 6.
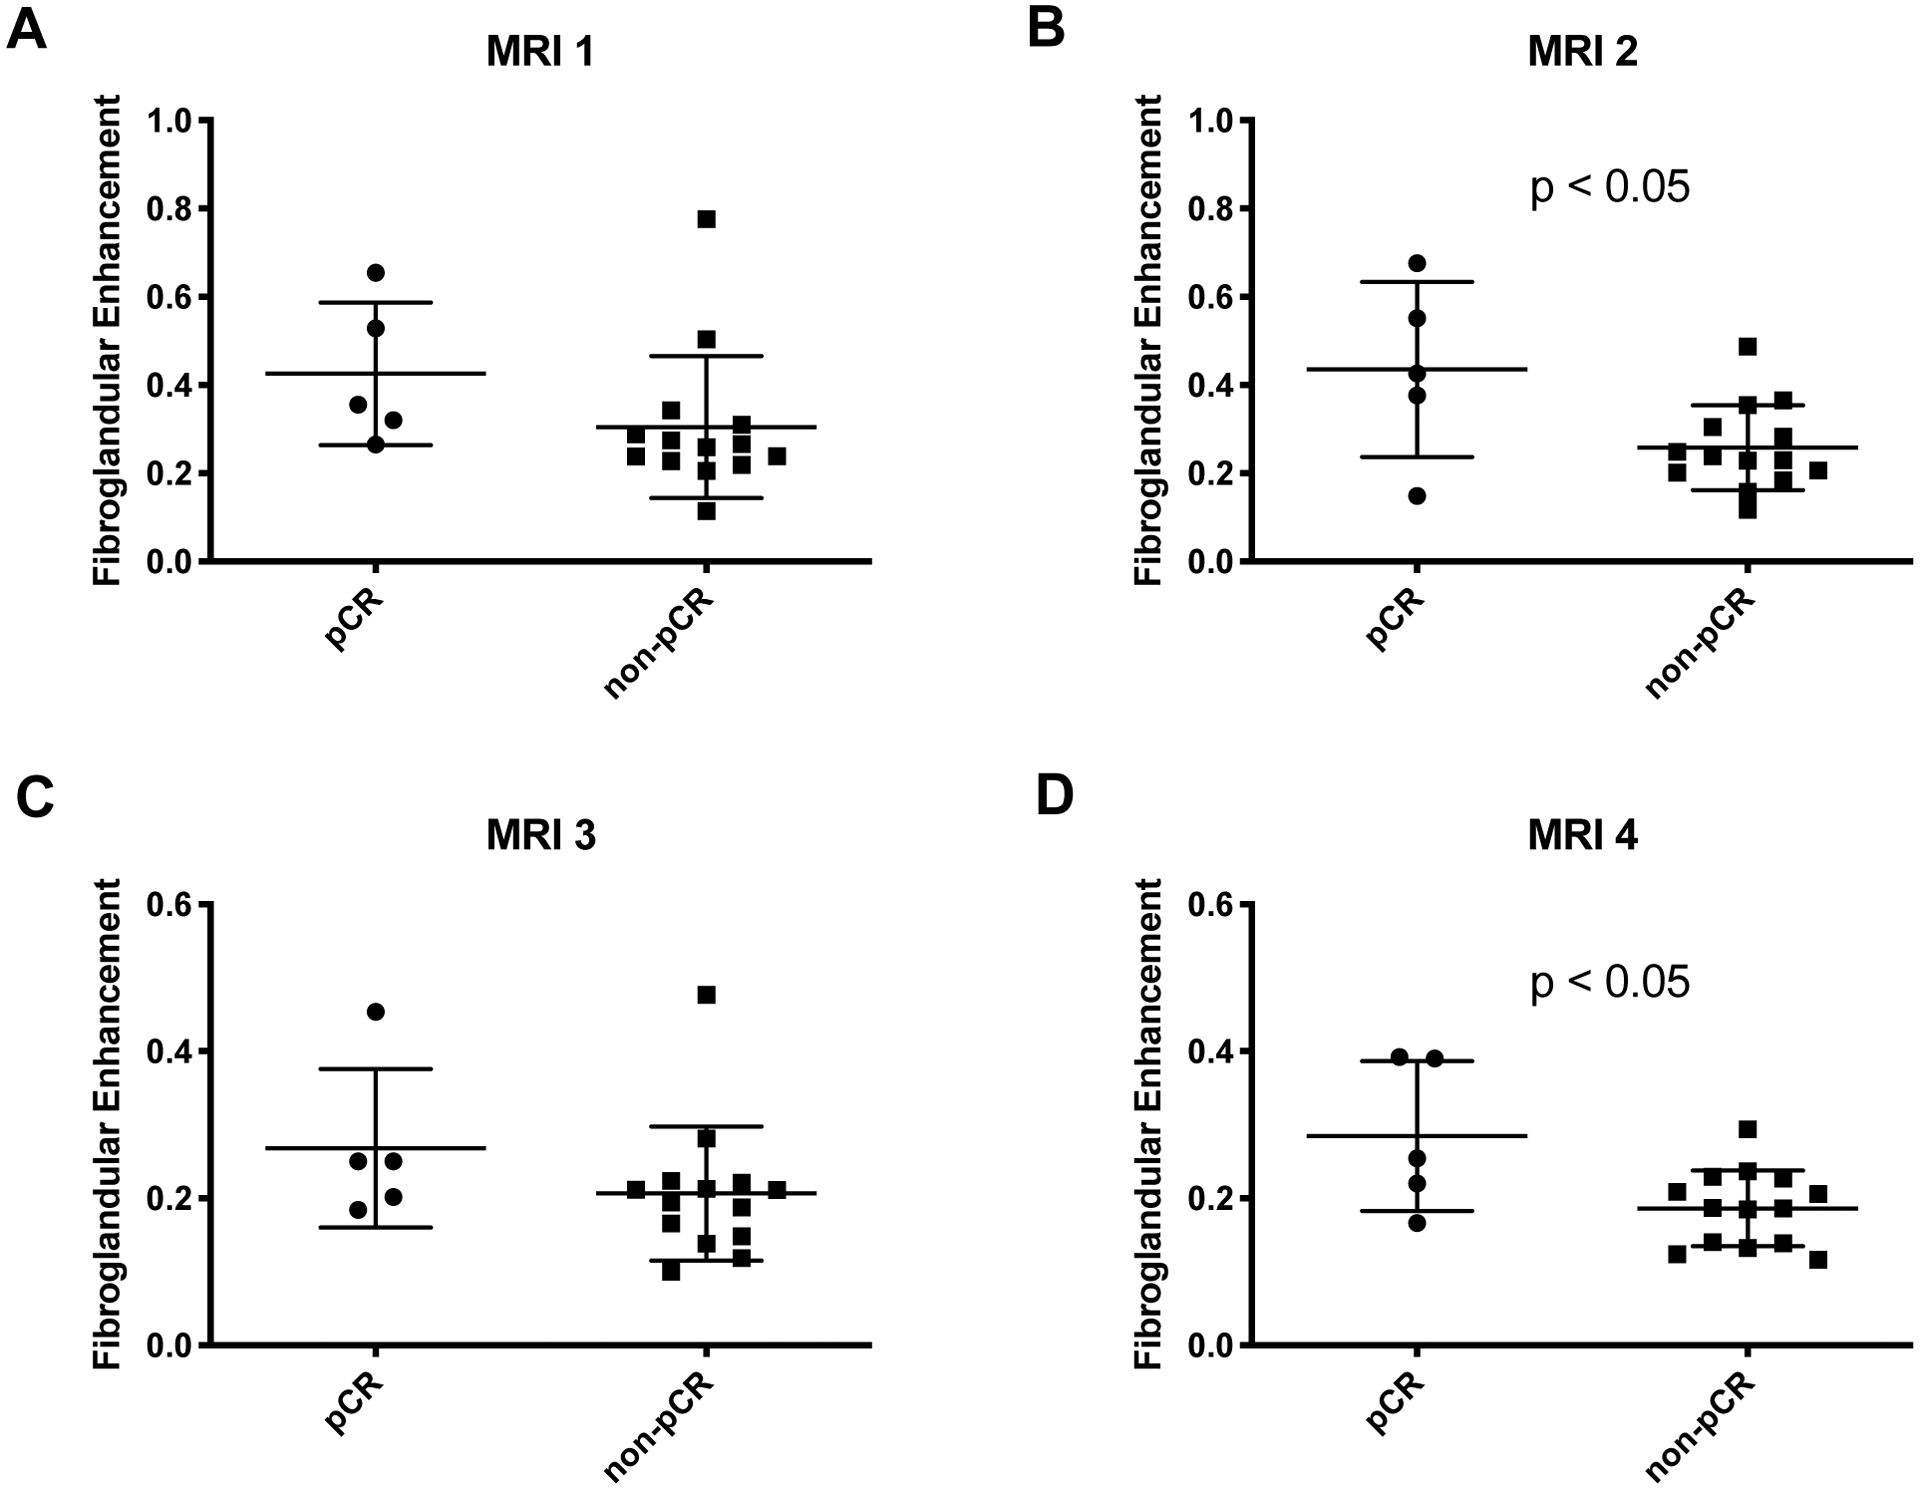
A) Prior to the start of NAT there was no relationship between the relative fibroglandular enhancement and the eventual pathological response. B) After one cycle of NAT, women who ultimately achieved pCR had higher relative fibroglandular enhancement than women who did not achieve pCR (p < 0.05). C) At the midpoint of NAT, there was relationship between the relative fibroglandular enhancement and the eventual pathological response. D) At the final MRI, women who ultimately achieved pCR displayed higher fibroglandular enhancement than women who did not achieve pCR (p < 0.05).
DISCUSSION
We examined the kinetics of MRI contrast agent uptake in the fibroglandular tissue surrounding breast tumors and its relationship with therapy. Our results indicate that both the rate and intensity of fibroglandular enhancement correlate with one another, decrease over the course of NAT, and may be predictive of eventual response to therapy. Women who ultimately achieved complete response to therapy displayed a faster rate and higher relative intensity of fibroglandular enhancement than women who did not after only one cycle of NAT, suggesting that these metrics may be early markers of successful treatment. Importantly, these relationships were preserved at two different timepoints after commencing therapy, suggesting they may be persistent markers of response. Interestingly, while the rate and intensity of fibroglandular enhancement correlated with equivalent measures in the tumor prior to therapy, the correlation between fibroglandular and tumor enhancement declined over the course of therapy. Importantly, these results suggest that analysis of fibroglandular enhancement during therapy provides a metric independent of tumor analysis.
Previous studies which examined the intensity of BPE, rather than the rate, also found a trend toward decreasing BPE over the course of NAT in the contralateral breast [12, 13, 15]. Fewer studies have examined contrast agent uptake in the same breast as the tumor. Of these, one study similarly found higher peritumoral enhancement in women with higher disease-free survival [16]. Another analysis of peritumoral enhancement found weak spatial correlations with proximity to the tumor for some, but not all metrics [10]. We found no spatial pattern using either a relative enhancement ratio or the rate of uptake, suggesting that these parameters do not reflect contrast agent leakage from the tumor into surrounding tissue.
The biological underpinning for BPE has been the subject of previous investigation. One study found that the peak enhancement of parenchymal tissue surrounding the tumor corresponds with microvessel density [17], but not with stromal protein levels [18]. Our finding that the rate and relative intensity of fibroglandular enhancement correlate suggests that the rate of fibroglandular enhancement may also reflect functional microvessel density. The finding of an increased rate of fibroglandular enhancement in women who achieve optimal therapeutic response may correspond with increased vascular delivery of therapeutic agents, which may in turn improve rates of pCR.
This study is subject to a number of limitations. To achieve the relatively fast temporal resolution (~7 s) needed to capture the rate of fibroglandular enhancement our imaging field of view was not able to capture the contralateral breast. Thus, our quantification of enhancement rate in this study is limited to the breast containing the tumor. Similar analysis on contralateral breast tissue is warranted to determine whether fibroglandular tissue uptake kinetics are similar in the non-tumor bearing breast. The fast temporal resolution needed for this analysis also required dedicated research scans, and could not be performed on the typical DCE-MRI data acquired in the standard-of-care setting. This fact, coupled with the need for four MRI scans to follow the course of therapy, limited our enrollment to 19 patients. Previous studies have demonstrated that BPE can be influenced by breast tumor subtype and the class of therapy [19, 20]. Due to the small sample size of this study we were unable to perform subgroup analysis stratifying for tumor type. We did perform subgroup analysis of the 11 study participants who received AC-T therapy and similarly found a trend of faster fibroglandular uptake in women who achieved pCR, although this smaller cohort did not reach statistical significance. This finding suggests that rate of fibroglandular uptake may be a robust marker across treatment regimes, although confirmation in a larger cohort is needed.
This study adds a new parameter, the rate of fibroglandular enhancement, to a growing list of MRI-derived parameters which are being evaluated for predicting response to therapy. The rate of fibroglandular enhancement can be correlated with other quantitative metrics which have now been used to assay fibroglandular tissue, such as diffusion-weighted imaging [21]. Furthermore, the kinetics of BPE may be added to radiomic analysis of breast MRI [22, 23], as recent studies have demonstrated that fibroglandular tissue may amenable to radiomics [24]. The rate of fibroglandular enhancement should be included in predictive models of breast cancer treatment and may provide unique information to complement metrics examining solely the tumor. Importantly, this study was conducted in collaboration with community-care centers (i.e., not research-oriented, academic medical centers), therefore enhancing the capabilities for future dissemination into standard clinical workflow.
CONCLUSIONS
These results demonstrate that the rate of fibroglandular enhancement in patients receiving NAT for breast cancer reflects response to therapy. The higher rate of fibroglandular enhancement in women achieving pCR may reflect treatment-mediated vascular remodeling in healthy breast tissue. The rate and intensity of fibroglandular enhancement diverges from tumoral measurements after treatment, suggesting that analysis of fibroglandular tissue provides unique information not captured by tumor analysis. Quantitative characterization of fibroglandular enhancement kinetics may provide a new metric of treatment response models warrants further investigation.
Highlights:
The rate of fibroglandular enhancement in the ipsilateral breast decreases after treatment
Both the rate and intensity of fibroglandular enhancement predict response to neoadjuvant therapy, with higher rate and intensity of enhancement after treatment in women who achieve favorable response
We found no spatial relationship between the rate or relative intensity of fibroglandular enhancement and proximity to the tumor
ACKNOWLEDGMENTS
We sincerely thank all the women who participate in our studies; your strength and courage are examples for all of us. We thank CPRIT RR160005, and the National Institutes of Health for support through NCI U01CA174706, U01CA142565, U24CA226110. T.E.Y is a CPRIT Scholar in Cancer Research.
Abbreviations:
- MRI
magnetic resonance imaging
- NAT
neoadjuvant therapy
- DCE
dynamic contrast-enhanced
- pCR
pathological complete response
- BPE
background parenchymal enhancement
- VIBE
Volumetric Interpolated Breath-hold Examination
- GRAPPA
GeneRalized Autocalibrating Partial Parallel Acquisition
- SPAIR
SPectral Attenuated Inversion Recovery
- FLASH
fast low angle shot
Footnotes
Publisher's Disclaimer: This is a PDF file of an unedited manuscript that has been accepted for publication. As a service to our customers we are providing this early version of the manuscript. The manuscript will undergo copyediting, typesetting, and review of the resulting proof before it is published in its final form. Please note that during the production process errors may be discovered which could affect the content, and all legal disclaimers that apply to the journal pertain.
Conflict_of_interest: none
REFERENCES
- 1.Orel SG and Schnall MD, MR imaging of the breast for the detection, diagnosis, and staging of breast cancer. Radiology, 2001. 220(1): p. 13–30. [DOI] [PubMed] [Google Scholar]
- 2.Yankeelov TE, et al. , Integration of quantitative DCE-MRI and ADC mapping to monitor treatment response in human breast cancer: initial results. Magn Reson Imaging, 2007. 25(1): p. 1–13. [DOI] [PMC free article] [PubMed] [Google Scholar]
- 3.Virostko J, et al. , Dynamic contrast-enhanced magnetic resonance imaging and diffusion-weighted magnetic resonance imaging for predicting the response of locally advanced breast cancer to neoadjuvant therapy: a meta-analysis. J Med Imaging (Bellingham), 2018. 5(1): p. 011011. [DOI] [PMC free article] [PubMed] [Google Scholar]
- 4.Buchholz TA, et al. , Neoadjuvant chemotherapy for breast carcinoma: multidisciplinary considerations of benefits and risks. Cancer, 2003. 98(6): p. 1150–60. [DOI] [PubMed] [Google Scholar]
- 5.Esserman LJ, et al. , Pathologic complete response predicts recurrence-free survival more effectively by cancer subset: results from the I-SPY 1 TRIAL--CALGB 150007/150012, ACRIN 6657. J Clin Oncol, 2012. 30(26): p. 3242–9. [DOI] [PMC free article] [PubMed] [Google Scholar]
- 6.Hylton NM, et al. , Locally advanced breast cancer: MR imaging for prediction of response to neoadjuvant chemotherapy--results from ACRIN 6657/I-SPY TRIAL. Radiology, 2012. 263(3): p. 663–72. [DOI] [PMC free article] [PubMed] [Google Scholar]
- 7.Tudorica A, et al. , Early Prediction and Evaluation of Breast Cancer Response to Neoadjuvant Chemotherapy Using Quantitative DCE-MRI. Transl Oncol, 2016. 9(1): p. 8–17. [DOI] [PMC free article] [PubMed] [Google Scholar]
- 8.Jung Y, et al. , Quantitative analysis of background parenchymal enhancement in whole breast on MRI: Influence of menstrual cycle and comparison with a qualitative analysis. Eur J Radiol, 2018. 103: p. 84–89. [DOI] [PubMed] [Google Scholar]
- 9.Liao GJ, et al. , Background parenchymal enhancement on breast MRI: A comprehensive review. J Magn Reson Imaging, 2020. 51(1): p. 43–61. [DOI] [PMC free article] [PubMed] [Google Scholar]
- 10.Jones EF, et al. , MRI enhancement in stromal tissue surrounding breast tumors: association with recurrence free survival following neoadjuvant chemotherapy. PLoS One, 2013. 8(5): p. e61969.23667451 [Google Scholar]
- 11.Hilal T, et al. , Breast MRI phenotype and background parenchymal enhancement may predict tumor response to neoadjuvant endocrine therapy. Breast J, 2018. 24(6): p. 1010–1014. [DOI] [PubMed] [Google Scholar]
- 12.Preibsch H, et al. , Background parenchymal enhancement in breast MRI before and after neoadjuvant chemotherapy: correlation with tumour response. Eur Radiol, 2016. 26(6): p. 1590–6. [DOI] [PubMed] [Google Scholar]
- 13.You C, et al. , Decreased background parenchymal enhancement of the contralateral breast after two cycles of neoadjuvant chemotherapy is associated with tumor response in HER2-positive breast cancer. Acta Radiol, 2018. 59(7): p. 806–812. [DOI] [PubMed] [Google Scholar]
- 14.Kuhl CK, et al. , Dynamic breast MR imaging: are signal intensity time course data useful for differential diagnosis of enhancing lesions? Radiology, 1999. 211(1): p. 101–10. [DOI] [PubMed] [Google Scholar]
- 15.You C, et al. , Association Between Background Parenchymal Enhancement and Pathologic Complete Remission Throughout the Neoadjuvant Chemotherapy in Breast Cancer Patients. Transl Oncol, 2017. 10(5): p. 786–792. [DOI] [PMC free article] [PubMed] [Google Scholar]
- 16.Hattangadi J, et al. , Breast stromal enhancement on MRI is associated with response to neoadjuvant chemotherapy. AJR Am J Roentgenol, 2008. 190(6): p. 1630–6. [DOI] [PubMed] [Google Scholar]
- 17.Nabavizadeh N, et al. , Topographic enhancement mapping of the cancer-associated breast stroma using breast MRI. Integr Biol (Camb), 2011. 3(4): p. 490–6. [DOI] [PMC free article] [PubMed] [Google Scholar]
- 18.Olshen A, et al. , Features of MRI stromal enhancement with neoadjuvant chemotherapy: a subgroup analysis of the ACRIN 6657/I-SPY TRIAL. J Med Imaging (Bellingham), 2018. 5(1): p. 011014. [DOI] [PMC free article] [PubMed] [Google Scholar]
- 19.van der Velden BH, et al. , Association between Parenchymal Enhancement of the Contralateral Breast in Dynamic Contrast-enhanced MR Imaging and Outcome of Patients with Unilateral Invasive Breast Cancer. Radiology, 2015. 276(3): p. 675–85. [DOI] [PubMed] [Google Scholar]
- 20.King V, et al. , Impact of tamoxifen on amount of fibroglandular tissue, background parenchymal enhancement, and cysts on breast magnetic resonance imaging. Breast J, 2012. 18(6): p. 527–34. [DOI] [PubMed] [Google Scholar]
- 21.Shin HJ, et al. , Characterization of tumor and adjacent peritumoral stroma in patients with breast cancer using high-resolution diffusion-weighted imaging: Correlation with pathologic biomarkers. Eur J Radiol, 2016. 85(5): p. 1004–11. [DOI] [PubMed] [Google Scholar]
- 22.Gillies RJ, Kinahan PE, and Hricak H, Radiomics: Images Are More than Pictures, They Are Data. Radiology, 2016. 278(2): p. 563–77. [DOI] [PMC free article] [PubMed] [Google Scholar]
- 23.Li H, et al. , MR Imaging Radiomics Signatures for Predicting the Risk of Breast Cancer Recurrence as Given by Research Versions of MammaPrint, Oncotype DX, and PAM50 Gene Assays. Radiology, 2016. 281(2): p. 382–391. [DOI] [PMC free article] [PubMed] [Google Scholar]
- 24.Braman NM, et al. , Intratumoral and peritumoral radiomics for the pretreatment prediction of pathological complete response to neoadjuvant chemotherapy based on breast DCE-MRI. Breast Cancer Res, 2017. 19(1): p. 57. [DOI] [PMC free article] [PubMed] [Google Scholar]


