

Summary
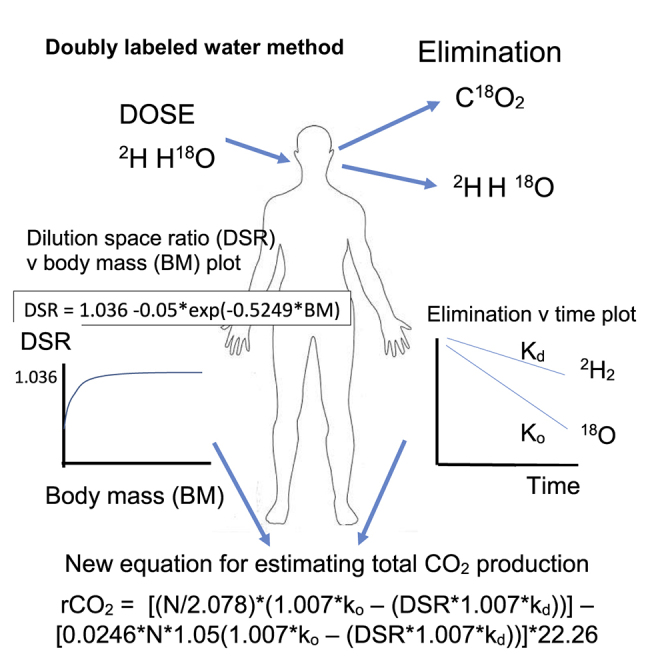
The doubly labeled water (DLW) method measures total energy expenditure (TEE) in free-living subjects. Several equations are used to convert isotopic data into TEE. Using the International Atomic Energy Agency (IAEA) DLW database (5,756 measurements of adults and children), we show considerable variability is introduced by different equations. The estimated rCO2 is sensitive to the dilution space ratio (DSR) of the two isotopes. Based on performance in validation studies, we propose a new equation based on a new estimate of the mean DSR. The DSR is lower at low body masses (<10 kg). Using data for 1,021 babies and infants, we show that the DSR varies non-linearly with body mass between 0 and 10 kg. Using this relationship to predict DSR from weight provides an equation for rCO2 over this size range that agrees well with indirect calorimetry (average difference 0.64%; SD = 12.2%). We propose adoption of these equations in future studies.
Keywords: total energy expenditure, free-living, validation, doubly labeled water
Graphical Abstract
Highlights
5,756 doubly labeled water (DLW) measures highlight variation from calculation equation
We derive here new equations for calculating CO2 production when using DLW
These equations outperform previous equations in validation studies
We recommend these equations should be adopted in future studies using DLW in humans
Speakman et al. use a large database of doubly labeled water measurements to show the choice of equation for the calculation of energy expenditure introduces significant variation into the final estimate. They then derive new equations that outperform previous equations in validation studies against chamber calorimetry.
Introduction
The doubly labeled water (DLW) method1,2 is an isotope-based technique for measuring rCO2 in free-living animals and humans.3 The method is based on the observation that the oxygen in respiratory CO2 is in complete isotopic equilibrium with the oxygen in body water. Hence, isotopically labeled oxygen introduced into the body water is eliminated as both water and CO2. In contrast, a simultaneously introduced label of hydrogen (such as deuterium) will be predominantly eliminated as water. The difference in elimination rates of the two isotopes (hence “doubly labeled” water) gives a measure of rCO2. If the respiratory quotient (RQ) (the ratio of CO2 production to O2 consumption) or food quotient (FQ) (the proportions of fat, protein, and carbohydrate in the diet) is known, the rCO2 can be converted to estimated energy expenditure using standard equations.
The prohibitive cost of the isotopes limited early use of the method to small animals.4 Advances in mass spectrometry, which reduced the required dose, along with the declining cost of the isotopes enabled the first applications to humans in the early 1980s.5, 6, 7 Since then, use of the method has grown steadily with currently approximately 100 papers published using the method annually.8 However, costs continue to keep sample sizes in most studies relatively small (typically less than 50 individuals). There has been an impetus in the last few years, therefore, to combine data across studies to extend or modify conclusions about the main factors driving energy demands.9,10
The simple description of the technique above belies a great deal of complexity in its theoretical basis.2,3,10,11 For example, isotopes fractionate as they leave the body, so that lighter isotopes are preferentially lost. This effect needs to be accounted for in the calculation. Another issue is that the isotopes are assumed to be turning over in the body water pool. The body water pool can be measured from the dilution space of the isotopic doses, but the dilution space of 18oxygen (NO) differs from that of deuterium (Nd), and both differ slightly from the total body water (TBW). The oxygen dilution space is about 1% larger than the TBW although the hydrogen dilution space is about 4% larger. This difference stems primarily from hydrogen in body water exchanging with labile hydrogen in proteins and other organic molecules in the body. The relationship between Nd, No, and TBW affect the calculation of rCO2, and thus, the dilution space ratio (DSR), which is equal to Nd/ NO, turns out to be a critical parameter in DLW studies.
A final complexity that must be considered is the choice of equation used to calculate rCO2. Although there are only four basic parameters that are derived from the isotope elimination measurements (the two elimination constants for 18oxygen [kO] and deuterium [kd] and the two isotope dilution spaces [NO and Nd]), the best approach combining these parameters to estimate rCO2 was a matter of considerable debate throughout the late 1980s and 1990s.3 These discussions never reached a broad consensus, and hence, different studies have subsequently combined the parameters in slightly different ways. Such differences are largely irrelevant if the objective is to compare groups within a single study. However, if absolute values of energy demand are required, such as might be needed if the DLW method is being utilized as a validation method (for example, for measurements of habitual food intake), to compare total energy expenditure (TEE) across cultures and lifestyles, or if comparisons are made to previous studies, the differences in calculation could be significant. The consequences of this variability have never been thoroughly evaluated but have been assumed to be small relative to the biological variation under study. In this paper, we evaluate the impact of using different equations and derive new standard equations based on performance in validation studies for use in future studies. We address this issue first for studies of children, adolescents, and adults and then for studies of small infants and babies.
Results and discussion
Children, adolescents, and adults
We have compiled in the International Atomic Energy Agency (IAEA) DLW database (v3.1; https://www.dlwdatabase.org) individual data from 119 DLW studies comprising a total of 6,246 measurements of individuals aged 2–96 years.8 For 5,756 of these measurements, we have access to the individual values of ko, kd, No, and Nd, allowing us to recalculate rCO2 using a single equation, and compare these to the original estimates made using a diversity of calculation methods. To choose the best equation for the common calculation, we compiled data from six validation studies involving 61 adult humans, where rCO2 by DLW has been compared with simultaneous indirect calorimetry (Table 1).12, 13, 14, 15, 16, 17 This comparison yielded three equations where rCO2 did not differ significantly from the chamber values (Table 1).3,18, 19, 20, 21, 22 The equation with the lowest average deviation was derived from an analysis of dilution space ratios in Sagayama et al.20 Using the average dilution space ratio of 1.036, we modified the original Equation A6 proposed by Schoeller et al.15 and derived a new equation here, for which the average discrepancy between the DLW estimates of rCO2 and simultaneous chamber estimates was −0.4% (SD = 7.6%; Table 1).
Table 1.
Validation results for carbon dioxide production (rCO2) for 61 individuals measured using the doubly labeled water method simultaneous to chamber calorimetry
| Source |
ID |
BM |
VCO2 IC |
Schoeller 1988 |
Racette et al., 1994 |
Sagayama et al., 2016 |
Speakman 1997 |
Speakman et al., 1993 |
Coward and Prentice 1985 |
||||||
|---|---|---|---|---|---|---|---|---|---|---|---|---|---|---|---|
| kg | L/d | L/d | % | L/d | % | L/d | % | L/d | % | L/d | % | L/d | % | ||
| Schoeller and Webb12 | M17 | 67.5 | 566.7 | 579.3 | 2.2 | 571.4 | 0.8 | 567.5 | 0.1 | 548.9 | −3.2 | ||||
| F25 | 72.0 | 439.0 | 448.9 | 2.2 | 440.4 | 0.3 | 436.2 | −0.6 | 417.9 | −4.8 | |||||
| F27 | 57.1 | 436.8 | 382.1 | −12.5 | 374.2 | −14.3 | 370.3 | −15.2 | 353.6 | −19.0 | |||||
| M28 | 67.5 | 611.5 | 608.2 | −0.5 | 596.6 | −2.4 | 590.9 | −3.4 | 565.8 | −7.5 | |||||
| M58 | 88.2 | 486.1 | 521.8 | 7.4 | 514.3 | 5.8 | 510.5 | 5.0 | 493.0 | 1.4 | |||||
| Westerterp et al.13 | 1 | 73.2 | 508.0 | 495.0 | −2.6 | 487.1 | −4.1 | 483.2 | −4.9 | 465.4 | −8.4 | ||||
| 2 | 77.9 | 479.0 | 506.5 | 5.7 | 498.2 | 4.0 | 494.2 | 3.2 | 475.8 | −0.7 | |||||
| 3 | 57.6 | 356.0 | 352.0 | −1.1 | 346.5 | −2.7 | 343.8 | −3.4 | 331.4 | −6.9 | |||||
| 4 | 72.0 | 457.0 | 441.4 | −3.4 | 435.5 | −4.7 | 432.6 | −5.3 | 418.6 | −8.4 | |||||
| 5 | 58.1 | 437.0 | 422.9 | −3.2 | 414.3 | −5.2 | 410.1 | −6.2 | 391.8 | −10.3 | |||||
| 6A | 75.6 | 894.0 | 919.0 | 2.8 | 907.5 | 1.5 | 901.9 | 0.9 | 874.1 | −2.2 | |||||
| 7A | 64.7 | 818.0 | 931.9 | 13.9 | 920.6 | 12.5 | 915.1 | 11.9 | 887.7 | 8.5 | |||||
| 8A | 71.0 | 981.0 | 947.5 | −3.4 | 934.2 | −4.8 | 927.7 | −5.4 | 896.6 | −8.6 | |||||
| 9A | 77.9 | 1,104.0 | 1,085.9 | −1.6 | 1,070.4 | −3.0 | 1,062.8 | −3.7 | 1,026.8 | −7.0 | |||||
| Seale et al.14 | 1 | 100.4 | 531.0 | 550.7 | 3.7 | 538.0 | 1.3 | 531.7 | 0.1 | 505.3 | −4.8 | ||||
| 2 | 50.3 | 392.0 | 407.4 | 3.9 | 398.5 | 1.7 | 394.2 | 0.6 | 375.5 | −4.2 | |||||
| 3 | 59.0 | 331.0 | 343.2 | 3.7 | 336.3 | 1.6 | 333.0 | 0.6 | 318.4 | −3.8 | |||||
| 4 | 52.6 | 451.0 | 442.1 | −2.0 | 427.3 | −5.3 | 420.1 | −6.9 | 391.1 | −13.3 | |||||
| 5 | 82.7 | 530.0 | 545.9 | 3.0 | 535.0 | 0.9 | 529.7 | −0.1 | 506.4 | −4.5 | |||||
| 6 | 86.2 | 550.0 | 545.2 | −0.9 | 530.4 | −3.6 | 523.1 | −4.9 | 493.1 | −10.3 | |||||
| 7 | 87.4 | 515.0 | 531.0 | 3.1 | 522.2 | 1.4 | 517.9 | 0.6 | 498.2 | −3.3 | |||||
| 8 | 47.8 | 403.0 | 395.8 | −1.8 | 383.8 | −4.8 | 378.0 | −6.2 | 354.2 | −12.1 | |||||
| 9 | 79.9 | 494.0 | 511.1 | 3.5 | 503.2 | 1.9 | 499.3 | 1.1 | 481.3 | −2.6 | |||||
| Schoeller et al.15 | ID | 75.3 | 559.0 | 570.6 | 2.1 | 564.5 | 1.0 | 561.1 | 0.4 | 543.4 | −2.8 | ||||
| NM | 75.6 | 614.0 | 598.5 | −2.5 | 591.0 | −3.7 | 587.3 | −4.4 | 568.5 | −7.4 | |||||
| ED | 76.3 | 633.0 | 591.5 | −6.6 | 582.8 | −7.9 | 578.4 | −8.6 | 557.9 | −11.9 | |||||
| MK | 69.5 | 541.0 | 543.6 | 0.5 | 531.5 | −1.8 | 526.5 | −2.7 | 537.2 | −0.7 | 506.1 | −6.5 | 529.3 | −2.2 | |
| JD | 64.1 | 504.0 | 440.0 | −12.7 | 432.7 | −14.1 | 428.8 | −14.9 | 438.3 | −13.0 | 410.7 | −18.5 | 340.5 | −32.4 | |
| DM | 73.3 | 566.0 | 650.1 | 14.9 | 640.7 | 13.2 | 636.9 | 12.5 | 659.6 | 16.5 | 619.8 | 9.5 | 581.6 | 2.8 | |
| AB | 56.7 | 468.0 | 460.2 | −1.7 | 452.6 | −3.3 | 449.5 | −4.0 | 463.3 | −1.0 | 435.4 | −7.0 | 443.6 | −5.2 | |
| LC | 85.2 | 626.0 | 656.6 | 4.9 | 643.1 | 2.7 | 637.9 | 1.9 | 654.6 | 4.6 | 616.8 | −1.5 | 632.3 | 1.0 | |
| DP | 63.1 | 529.0 | 519.6 | −1.8 | 512.0 | −3.2 | 508.7 | −3.8 | 525.5 | −0.7 | 493.4 | −6.7 | 515.4 | −2.6 | |
| Ravussin et al.16 | 1 | 124.6 | 499.0 | 462.1 | −7.4 | 452.6 | −9.3 | 448.6 | −10.1 | 415.0 | −16.8 | 432.0 | −13.4 | 398.7 | −20.1 |
| 2 | 61.4 | 356.0 | 413.3 | 16.1 | 404.7 | 13.7 | 401.2 | 12.7 | 370.9 | 4.2 | 386.2 | 8.5 | 318.8 | −10.5 | |
| 3 | 137.6 | 535.0 | 556.6 | 4.0 | 543.2 | 1.5 | 537.5 | 0.5 | 483.4 | −9.7 | 514.2 | −3.9 | 443.9 | −17.0 | |
| 4 | 80.9 | 393.0 | 503.8 | 28.2 | 489.9 | 24.7 | 483.9 | 23.1 | 422.8 | 7.6 | 459.9 | 17.0 | 321.3 | −18.2 | |
| 5 | 101.8 | 370.0 | 402.3 | 8.7 | 393.6 | 6.4 | 389.9 | 5.4 | 357.8 | −3.3 | 374.8 | 1.3 | 318.5 | −13.9 | |
| 6 | 139.9 | 424.0 | 427.7 | 0.9 | 420.1 | −0.9 | 416.9 | −1.7 | 393.7 | −7.1 | 403.4 | −4.9 | 384.7 | −9.3 | |
| 7 | 190.9 | 711.0 | 733.7 | 3.2 | 718.0 | 1.0 | 711.4 | 0.0 | 653.8 | −8.0 | 683.9 | −3.8 | 541.5 | −23.8 | |
| 8 | 95.8 | 480.0 | 590.9 | 23.1 | 575.0 | 19.8 | 568.0 | 18.3 | 498.8 | 3.9 | 540.4 | 12.6 | 396.9 | −17.3 | |
| 9 | 151.5 | 672.0 | 683.3 | 1.7 | 662.0 | −1.5 | 652.5 | −2.9 | 551.9 | −17.9 | 615.6 | −8.4 | 510.6 | −24.0 | |
| 10 | 68.6 | 373.0 | 406.3 | 8.9 | 390.4 | 4.7 | 383.1 | 2.7 | 300.2 | −19.5 | 355.6 | −4.7 | 277.5 | −25.6 | |
| 11 | 69.4 | 332.0 | 354.2 | 6.7 | 344.4 | 3.7 | 340.0 | 2.4 | 296.4 | −10.7 | 323.0 | −2.7 | 234.7 | −29.3 | |
| 12 | 80.1 | 403.0 | 468.0 | 16.1 | 457.6 | 13.5 | 453.2 | 12.5 | 413.8 | 2.7 | 435.1 | 8.0 | 361.5 | −10.3 | |
| Melanson et al.17 | 1 | 63.0 | 310.6 | 299.4 | −3.6 | 291.7 | −6.1 | 286.6 | −7.7 | 280.0 | −9.8 | 263.8 | −15.1 | 285.1 | −8.2 |
| 2 | 82.8 | 457.4 | 447.0 | −2.3 | 440.4 | −3.7 | 436.6 | −4.6 | 445.0 | −2.7 | 418.1 | −8.6 | 420.4 | −8.1 | |
| 3 | 74.8 | 455.8 | 476.2 | 4.5 | 467.5 | 2.6 | 463.5 | 1.7 | 474.2 | 4.0 | 445.5 | −2.3 | 429.6 | −5.7 | |
| 4 | 61.0 | 346.8 | 361.6 | 4.3 | 354.6 | 2.2 | 351.0 | 1.2 | 356.6 | 2.8 | 335.2 | −3.4 | 324.2 | −6.5 | |
| 5 | 93.8 | 471.3 | 465.4 | −1.2 | 454.0 | −3.7 | 449.0 | −4.7 | 456.0 | −3.2 | 428.7 | −9.0 | 389.9 | −17.3 | |
| 6 | 48.9 | 293.4 | 325.6 | 11.0 | 318.5 | 8.6 | 314.6 | 7.2 | 316.0 | 7.7 | 297.2 | 1.3 | 291.0 | −0.8 | |
| 7 | 53.3 | 349.9 | 352.7 | 0.8 | 343.6 | −1.8 | 339.1 | −3.1 | 340.1 | −2.8 | 320.0 | −8.5 | 298.1 | −14.8 | |
| 8 | 91.5 | 444.2 | 447.8 | 0.8 | 437.8 | −1.4 | 433.7 | −2.4 | 444.1 | 0.0 | 417.3 | −6.1 | 385.0 | −13.3 | |
| 9 | 71.6 | 442.8 | 429.6 | −3.0 | 418.0 | −5.6 | 412.6 | −6.8 | 415.5 | −6.2 | 390.9 | −11.7 | 351.9 | −20.5 | |
| 10 | 111.6 | 514.4 | 550.8 | 7.1 | 539.5 | 4.9 | 533.7 | 3.7 | 540.7 | 5.1 | 508.3 | −1.2 | 489.8 | −4.8 | |
| 11 | 95.0 | 437.1 | 540.4 | 23.6 | 526.7 | 20.5 | 519.7 | 18.9 | 520.7 | 19.1 | 489.9 | 12.1 | 461.6 | 5.6 | |
| 12 | 115.0 | 423.1 | 470.5 | 11.2 | 461.6 | 9.1 | 457.5 | 8.1 | 468.0 | 10.6 | 439.7 | 3.9 | 421.2 | −0.5 | |
| 13 | 101.4 | 433.7 | 433.1 | −0.1 | 423.7 | −2.3 | 419.3 | −3.3 | 426.5 | −1.7 | 400.9 | −7.6 | 376.7 | −13.2 | |
| 14 | 73.9 | 473.4 | 443.0 | −6.4 | 428.9 | −9.4 | 422.8 | −10.7 | 424.5 | −10.3 | 399.5 | −15.6 | 335.1 | −29.2 | |
| 15 | 72.0 | 394.0 | 353.6 | −10.3 | 344.8 | −12.5 | 340.8 | −13.5 | 344.8 | −12.5 | 324.2 | −17.7 | 296.4 | −24.8 | |
| 16 | 61.7 | 353.8 | 345.7 | −2.3 | 335.6 | −5.2 | 331.0 | −6.5 | 332.3 | −6.1 | 312.6 | −11.6 | 274.7 | −22.4 | |
| 17 | 69.6 | 387.9 | 402.2 | 3.7 | 393.9 | 1.5 | 389.9 | 0.5 | 396.5 | 2.2 | 372.6 | −3.9 | 354.4 | −8.6 | |
| All subjects | N | 61 | 61 | 61 | 61 | 61 | 61 | 61 | 61 | 35 | 35 | 61 | 61 | 35 | 35 |
| mean | 80.5 | 497.52 | 509.71 | 2.74 | 499.49 | 0.60 | 494.69 | −0.40 | 440.52 | −2.08 | 473.96 | −4.72 | 392.47 | −12.89 | |
| SD | 26.2 | 152.69 | 155.18 | 7.97 | 153.74 | 7.74 | 153.11 | 7.67 | 98.67 | 9.05 | 149.72 | 7.51 | 95.32 | 9.94 | |
| T | 2.69 | 0.61 | −0.4 | 1.36 | −4.9 | −7.7 | |||||||||
| P | 0.009 | 0.55 | 0.68 | 0.18 | <0.001 | <0.001 | |||||||||
Source is the reference where the original validation data were published. ID is the ID from the original study. BM is the mean body mass of the individual in kg. rCO2 IC is the indirect calorimetry estimate of CO2 production in liters per day. For each DLW equation, the original data were used to calculate rCO2 and the % difference between these estimates and the chamber CO2 production is calculated. At the bottom of the table, the summary statistics across all 61 individuals are shown. Schoeller 1988 refers to Equation A6 in Schoeller et al.15 as modified in Schoeller.18 Racette et al., 1994 refers to Equation A6 in Schoeller et al.15 with the revised dilution space constant provided by Racette et al.19 Sagayama et al., 2016 refers to Equation A6 in Schoeller et al.15 with the revised dilution space constant provided by Sagayama et al.20 and detailed here as Equation 1. Speakman 1997 refers to Equation 17.41 in Speakman.3 Speakman et al., 1993 refers to Equation 3 in Speakman et al.,21 and Coward and Prentice 1985 refers to the two-pool equation in Coward and Prentice.22 For some of the studies, Nd was not available from the original validations. Because the equations by Speakman 1997 and Coward 1985 require individual estimates of Nd, a comparison was not possible for these subjects, and the total statistics are based on n = 35. The t and p values refer to the difference of the mean difference from an expectation of 0 (single sample t test). Three equations produced estimates that were not significantly different to the chamber calorimetry data.
The new equation is as follows:
| (Equation 1) |
where
| (Equation 2) |
N is total body water. Using the dilution spaces of both isotopes to estimate N reduces the error due to analytical variation in the derivation of either isotope space alone. However, if it is felt that the analytical variation stems mostly from evaluation of the deuterium dilution space Nd, then it is also acceptable to calculate N from the oxygen dilution space alone (N = No /1.007). The value 22.26 in Equation 1 is the gas constant for carbon dioxide. Note that this differs from the value used previously in all DLW equations for calculation of rCO2 of 22.4, which is erroneously high (by 0.7%) because CO2 does not show ideal gas behavior.23
Equation 1 can be simplified for calculation purposes to
| (Equation 3) |
or
| (Equation 4) |
where ko and kd are in units of d−1, No and Nd are in mols, and rCO2 is in L/d.
We used the original RQ estimates from the publications to convert rCO2 to TEE using the Weir equation.24
| (Equation 5) |
Figure 1A shows the estimates of rCO2 from the original publications, plotted against estimates using Equation 1. Although there is a strong association between the estimates (r2 = 0.987), they do not yield identical rCO2 values. Because the equation based on Sagayama et al.20 was derived here, none of the studies in the database used this equation. Of the 5,756 individual data, the rCO2 of 1,024 (17.7%) was made using the equation of Coward and Prentice,22 883 (15.3%) were made using the Schoeller et al.15 Equation A6 as modified in 1988,18 3,770 (65.3%) were made using the Racette et al.19 equation, and 77 (1.3%) did not state the equation they used. The Racette et al.19 equation produces estimates very similar to those derived from Equation 1 (Table 1), and the discrepancy in the sample of 3,770 using this equation averaged 1.1% (SD 1.2). On average, the discrepancy when using the Schoeller et al.15 A6 equation was 1.8% (SD 1.6), and for the studies using the Coward and Prentice22 equation, it was 4.4% (SD 4.6).
Figure 1.

Comparison of published CO2 production by doubly labeled water to that by standard method
(A) Relationship between CO2 production (L/d) for 5,756 individuals extracted from the original studies and the recalculated estimates using Equation 1.
(B–D) Bland-Altman plots25 comparing the published rCO2 for studies using (B) the Coward and Prentice22 equation, (C) the Schoeller et al.15 A6 equation, and (D) the Racette et al.19 compared with the standard Equation 1 derived from Sagayama et al.20 In all plots, dotted line is average difference, and solid blue lines are plus and minus 2 SDs. The red lines define the boundary for plus and minus 10% difference between methods. Data refer to 5,756 adult individuals uploaded into the IAEA DLW database (v3.1).
We compared the rCO2 values calculated using the three main equations compared to Equation 1 using Bland-Altman plots (Figures 1B–1D).25 For all three equations, there was no systematic bias. However, the Coward and Prentice22 equation generated far more variable estimates than the other two equations. This is expected because that calculation utilizes individual values for No and Nd instead of using an average Nd/No ratio, which is used in the other two equations and Equation 1. Indeed, of the 1,024 estimates using the Coward equation, 103 (10.0%) differed by more than 10% from the standard, compared to 1/883 (0.1%) for the Schoeller et al.15 equation and 12/3,770 (0.3%) for the Racette19 equation.
A second source of variation can be introduced by using alternative equations to convert rCO2 to TEE. This variation occurs even when the RQ is known. To evaluate the variation introduced from this source, we took the original rCO2 and converted this to TEE using the Weir equation. We then compared the recalculated TEE with the published values. The relationship between the recalculated and original TEE values (Figure 2A) was very good (r2 = 0.99), and the average discrepancy between estimates was only 0.08 MJ/d (SD = 0.19) or 0.8% (SD = 0.19). The absolute discrepancy excluding the sign of the difference was 0.11 MJ (1.1%; SD = 0.17). There was no significant trend in the discrepancy with the magnitude of the TEE (Figure 2B). When RQ is not known, the routine procedure is to approximate the RQ using the FQ. The errors involved in this approximation are beyond the scope of this paper and are not addressed here.
Figure 2.

Comparison of published energy expenditure by DLW to that calculated by standard method
(A) Relationship between the TEE (MJ/d) for 4,571 individual adults extracted from the original studies and the recalculated TEE using the Weir equation.
(B) Bland-Altman plot25 comparing the published TEE with those generated using the recommended equation. Dotted line is average difference. Data refer to data for 4,571 adult individuals uploaded into the IAEA DLW database (v3.1). The sample size is lower than in Figure 1, because for some individuals, estimates of RQ or FQ were not available.
These data show that selection of the calculation method can introduce substantial variation into the individual and to a lesser extent average estimates of rCO2, as well as to variation in conversion of rCO2 to TEE. For comparisons made within studies, this discrepancy is unimportant. However, it may introduce problems when comparisons are attempted between studies or when the DLW method is used to validate other techniques, particularly when small sample sizes are employed. With some equations in common use, more than 10% of estimates are greater than 10% divergent from the equation that performs best in validation studies. Such differences between calculation methods across studies might be erroneously attributed to biological factors. This potential problem is compounded by the fact that some studies do not indicate the exact calculation methods they employed to derive rCO2 and TEE estimates. To overcome these issues, we recommend adoption of Equation 1 in future studies of children, adolescents, and adults to derive rCO2 and use of Equation 5 to convert this to TEE.
Small infants and babies
The recommendation above refers to subjects aged ≥2 years. We have shown that the choice of equation has a significant impact on the resultant calculation of rCO2 and TEE and that the major factor driving this variation is the relative dilutions spaces of No and Nd (the dilution space ratio DSR = Nd/No; Figure 3). There is evidence that, at younger ages, the DSR is below the observed average of 1.036 in individuals aged >2 years.20,26 In a review of 36 studies of 1,131 young children, the weighted dilution space ratio averaged 1.031,20 which means that application of Equation 1 to younger individuals may yield underestimates of rCO2 and TEE.
Figure 3.

Dilution space ratio as a function of body mass and performance of new equation against indirect calorimetry
(A) Dilution space ratios (the hydrogen dilution space Nd divided by the oxygen dilution space No) of 332 babies weighing <10 kg from the IAEA DLW database v 3.1 (open circles) combined with data from validation studies in preterm and full-term babies (gray circles). For the sample from the database, there was a linear relationship (blue dotted line that marginally failed to reach significance p = 0.08). We fitted an asymptotic exponential to the combined dataset (red line; r2 = 6.4%; p < 0.03).
(B) The results of validation studies of the DLW method in babies comparing the DLW estimates of CO2 production (rCO2) derived from a combination of Equations 9 and 10 presented here and rCO2 measured by indirect calorimetry. There was a strong linear relationship fitted by least-squares regression—dotted blue line, with r2 = 0.90.
There is a problem, however, in choosing the best equation to use in young children, and that is the limitation on performing validation experiments in this age group against gas exchange measurements by indirect calorimetry (chamber respirometry). Validation studies of DLW against indirect calorimetry will probably never be performed in young children because it would require the child to be isolated within a respirometry chamber for a protracted period lasting up to a week.
Nevertheless, a number of validation studies have been performed in preterm babies and small neonates (<2 kg), comparing continuous gas exchange with DLW.27, 28, 29 The problem, however, is that such very small children weighing less than 2 kg have an even lower DSR,30 averaging around 1.019, significantly lower than in infants weighing >2 kg.26,31 Hence, an equation based on this DSR might work well for small babies weighing less than 2 kg, but it might be unsuitable for infants weighing 2–10 kg. Fortunately, there is a single validation study of babies weighing 2–4.2 kg,32 which can assist in selection of the best equation in this size range.
We compiled data from the four available validation studies in babies and used the published data in these studies on isotope elimination rates of 18oxygen (ko) and deuterium (kd) and the respective dilution spaces (No and Nd) to recalculate the rCO2 using five different alternative equations. We then derived two new equations in which we replaced the DSR in Equation 1 with either the value 1.019 or the value 1.031. These are, respectively, when the DSR = 1.019,
| (Equation 6) |
and when the DSR = 1.031,
| (Equation 7) |
In all the above cases, we used
| (Equation 8) |
Although there have been relatively few validation studies of humans weighing less than 4 kg, there have been a large number of validation studies in small mammals and birds in this weight range (reviewed in Speakman3). Although such animals have dilution space ratios that do not differ from adult humans (around 1.036), the best equation in validation studies of such animals turns out to be based on a DSR of 1.0. This is because these animals have a significant efflux of deuterium in addition to water turnover that offsets the impact of the slightly different DSRs.33 Because this might also pertain in babies, we added into the evaluation the most widespread equation in use for small mammals and birds, which is Equation 7.17 from Speakman.3 Finally, we also added into the evaluation the equation of Coward and Prentice,22 which uses individual dilution spaces rather than a population average in the calculation.
Table 1 shows the results of the different equations when compared to indirect calorimetry for preterm infants (≤2 kg) and infants weighing >2 kg. The data show that, in the size range 0–2 kg, the best equation was based on the dilution space ratio 1.019 (Equation 6 above). The average difference between the rCO2 by indirect calorimetry and DLW using this equation was 0.5%. This was much better than the equation derived for children and adults (Equation 1), which gave an estimate 13.5% too low, and Equation 7 above, which gave an estimate 8.4% too low. The equation that performs best in validation studies of small mammals gave an estimate 10.1% too high, clearly indicating the physiological basis for this equation, although appropriate for birds and small non-human mammals, does not apply to neonatal humans and young infants.
In the size range 2–4 kg, the best equation was that based on the DSR of 1.031 (Equation 7). Equation 1 gave an estimate 8.5% too low. Equation 6 gave an estimate 6.5% too high, although the small animal equation gave an estimate 16.8% too high. These validation data therefore suggest that adoption of three different equations over different size ranges corresponding to different DSRs might be a possible solution to the issue of how to measure rCO2 by DLW. For individuals weighing <2 kg, the suggested equation would be Equation 6; for individuals weighing 2–10 kg, it would be Equation 7, and for individuals weighing >10 kg, it would be Equation 1.
This approach, however, is not very satisfactory, because it leads to confusion at the boundaries of the weight ranges. For example, for a 2-kg child, rCO2 calculated using Equation 6 differs from that calculated by Equation 7 by about 10%. To further explore the choice of DSR in the size range 0–10 kg, we extracted data from the IAEA DLW database8 for individuals in this size range. In fact, none of the individuals in the database weighed less than 2 kg, but there were 336 records of children weighing between 2.4 and 10 kg. The DSR for these individuals is plotted against the body weight in Figure 1A. The average DSR in this interval was 1.032 (SD = 0.0122), consistent with the previous suggestion of 1.031 (Sagayama et al.20). This DSR was significantly lower than the ratio established for heavier individuals of 1.036 (t = −5.72; p < 0.0001) and significantly higher than the ratio of 1.019 for preterm babies and neonates30 weighing less than 2 kg (t = 22.26; p < 0.001). There was a trend for a positive association between weight and DSR through the size range (regression r2 = 0.9%; p = 0.08). When we combined these data with those from the validation studies,27, 28, 29,32 there was a significant non-linear relationship between body mass (BM) (kg) and DSR. We fitted an asymptotic exponential model to these data constraining the asymptote to be 1.036 using a non-linear fitting function in the program MINITAB to estimate the unknown parameters. The resultant equation was
| (Equation 9) |
where BM is in kg.
A different approach then is to create an equation that combines this weight dependency with the standard equation, yielding
| (Equation 10) |
where N = No and DSR is defined in Equation 9 by the BM in kg.
For calculation purposes, this simplifies to
| (Equation 11) |
The results of using this equation are shown in Table 2 (Equation 10), and a plot of the predicted rCO2 from Equation 10 and the observed rCO2 across all the validation studies across the entire weight range in Table 2 is shown in Figure 2B. This shows a linear relationship with an r2 of 90.1% and a least-squares fit gradient of 0.954 (reduced major axis = 1.005). The average % difference across all 34 individuals in the validation studies (in Table 2) using this equation was 0.64% (SD = 11.9). This combined equation based on the weight dependency of the DSR in the range 0–10 kg therefore performs better than the individual equations for the ranges 0–2 kg (Equation 6) and 2–10 kg (Equation 7; Table 2).
Table 2.
Validation results for carbon dioxide production (rCO2) for 34 preterm and neonatal babies measured using the doubly labeled water method simultaneous to chamber calorimetry
| Study | ID | BM | rCO2 IC | Equation 1 | Equation 6 | Equation 7 | Coward 1985 | Speakman 7.17 | Equation 10 | ||||||
|---|---|---|---|---|---|---|---|---|---|---|---|---|---|---|---|
| g | L/d | L/d | %diff | L/d | %diff | L/d | %diff | L/d | %diff | L/d | %diff | L/d | %diff | ||
| D | 3 | 1,090.00 | 12.50 | 9.09 | −27.27 | 11.4 | −8.5 | 9.94 | −20.49 | 12.80 | 2.40 | 12.85 | 2.81 | ||
| B | 3 | 1,115.00 | 11.37 | 10.00 | −12.08 | 11.4 | 0.3 | 10.51 | −7.63 | 8.53 | −25.04 | 12.44 | 9.36 | 12.22 | 7.44 |
| B | 7 | 1,195.00 | 14.58 | 13.60 | −6.74 | 15.3 | 4.8 | 14.20 | −2.57 | 11.91 | −18.32 | 16.60 | 13.85 | 16.16 | 10.82 |
| D | 2 | 1,378.00 | 13.70 | 13.64 | −0.45 | 15.9 | 15.8 | 14.44 | 5.40 | 17.39 | 26.93 | 16.72 | 22.07 | ||
| A | 10 | 1,414.85 | 17.72 | 13.48 | −23.91 | 15.8 | −10.8 | 14.32 | −19.18 | 14.59 | −17.65 | 17.37 | −1.98 | 16.65 | −6.02 |
| D | 4 | 1,496.00 | 17.00 | 14.99 | −11.85 | 17.8 | 4.7 | 16.00 | −5.87 | 19.63 | 15.47 | 18.68 | 9.87 | ||
| A | 1 | 1,520.65 | 18.29 | 13.13 | −28.24 | 15.4 | −15.7 | 13.95 | −23.71 | 12.90 | −29.50 | 16.96 | −7.29 | 16.10 | −11.97 |
| B | 1 | 1,545.00 | 14.83 | 13.94 | −6.03 | 16.2 | 9.2 | 14.75 | −0.55 | 9.86 | −33.50 | 17.74 | 19.63 | 16.82 | 13.40 |
| A | 5 | 1,596.45 | 19.74 | 19.16 | −2.95 | 21.6 | 9.6 | 20.05 | 1.58 | 17.70 | −10.36 | 23.53 | 19.22 | 22.25 | 12.73 |
| B | 4 | 1,600.00 | 15.52 | 14.61 | −5.85 | 17.2 | 11.0 | 15.55 | 0.21 | 11.80 | −24.00 | 18.94 | 22.07 | 17.86 | 15.08 |
| B | 6 | 1,640.00 | 18.70 | 17.48 | −6.53 | 19.8 | 5.9 | 18.31 | −2.04 | 15.12 | −19.15 | 21.56 | 15.31 | 20.32 | 8.69 |
| B | 2 | 1,660.00 | 17.76 | 16.77 | −5.58 | 19.5 | 9.7 | 17.75 | −0.08 | 13.71 | −22.79 | 21.35 | 20.21 | 20.05 | 12.88 |
| A | 8 | 1,692.15 | 20.01 | 18.01 | −10.00 | 20.9 | 4.2 | 19.04 | −4.87 | 18.38 | −8.15 | 22.85 | 14.15 | 21.41 | 6.96 |
| A | 7 | 1,702.70 | 22.88 | 26.77 | 16.98 | 29.3 | 28.0 | 27.68 | 20.96 | 26.82 | 17.18 | 31.58 | 37.99 | 29.76 | 30.06 |
| A | 9 | 1,709.20 | 21.17 | 13.92 | −34.24 | 16.5 | −21.9 | 14.87 | −29.79 | 15.35 | −27.49 | 18.23 | −13.89 | 17.01 | −19.65 |
| A | 11 | 1,783.30 | 22.61 | 18.81 | −16.79 | 21.6 | −4.4 | 19.83 | −12.31 | 19.35 | −14.44 | 23.63 | 4.50 | 22.01 | −2.64 |
| A | 12 | 1,824.10 | 21.17 | 18.87 | −10.85 | 21.4 | 1.2 | 19.79 | −6.50 | 19.78 | −6.55 | 23.33 | 10.25 | 21.72 | 2.64 |
| B | 8 | 1,830.00 | 21.23 | 19.09 | −10.09 | 21.8 | 2.6 | 20.06 | −5.52 | 18.06 | −14.93 | 23.75 | 11.89 | 22.09 | 4.04 |
| B | 5 | 1,860.00 | 18.97 | 15.54 | −18.08 | 18.4 | −3.2 | 16.56 | −12.70 | 14.00 | −26.19 | 20.22 | 6.60 | 18.65 | −1.71 |
| A | 6 | 1,862.40 | 18.44 | 14.19 | −23.06 | 16.8 | −9.0 | 15.12 | −17.99 | 14.76 | −19.98 | 18.48 | 0.21 | 17.03 | −7.63 |
| A | 4 | 1,880.70 | 25.36 | 22.30 | −12.06 | 25.1 | −0.9 | 23.32 | −8.03 | 22.64 | −10.74 | 27.32 | 7.74 | 25.39 | 0.10 |
| A | 3 | 1,894.95 | 25.47 | 12.37 | −51.44 | 16.4 | −35.7 | 13.81 | −45.77 | 15.32 | −39.84 | 18.53 | −27.24 | 16.69 | −34.47 |
| C | 6 | 1,920.00 | 21.95 | 21.99 | 0.16 | 25.7 | 17.3 | 23.34 | 6.33 | 28.27 | 28.77 | 25.99 | 18.40 | ||
| A | 2 | 1,996.80 | 23.04 | 19.40 | −15.79 | 22.5 | −2.5 | 20.50 | −10.98 | 19.33 | −16.09 | 24.60 | 6.81 | 22.56 | −2.08 |
| Mean | 1,633.64 | 18.92 | 16.30 | −13.45 | 18.9 | 0.5 | 17.24 | −8.42 | 15.99 | −18.38 | 20.71 | 10.12 | |||
| SD | 252.89 | 4.07 | 13.54 | 4.30 | 13.40 | 4.15 | 13.45 | 4.37 | 11.97 | 4.60 | 14.07 | ||||
| C | 1 | 2,570.00 | 27.55 | 25.42 | −7.75 | 30.7 | 11.4 | 27.32 | −0.85 | 33.97 | 23.30 | 29.56 | 7.28 | ||
| D | 1 | 2,575.00 | 27.90 | 21.67 | −22.33 | 25.7 | −7.9 | 23.12 | −17.14 | 28.31 | 1.45 | 24.82 | −11.04 | ||
| C | 4 | 2,590.00 | 25.98 | 22.39 | −13.83 | 25.7 | −1.1 | 23.58 | −9.24 | 28.08 | 8.05 | 24.97 | −3.92 | ||
| C | 5 | 2,790.00 | 28.00 | 27.36 | −2.28 | 31.9 | 13.8 | 28.98 | 3.50 | 34.93 | 24.75 | 30.55 | 9.11 | ||
| C | 8 | 2,980.00 | 32.70 | 27.02 | −17.37 | 32.0 | −2.3 | 28.80 | −11.94 | 35.19 | 7.59 | 30.23 | −7.55 | ||
| C | 9 | 3,390.00 | 33.82 | 33.14 | −2.02 | 38.3 | 13.3 | 35.01 | 3.51 | 41.96 | 24.05 | 35.96 | 6.31 | ||
| C | 3 | 3,440.00 | 34.27 | 32.11 | −6.32 | 36.9 | 7.6 | 33.83 | −1.30 | 40.29 | 17.55 | 34.64 | 1.08 | ||
| C | 2 | 3,890.00 | 41.22 | 42.11 | 2.16 | 47.7 | 15.9 | 44.14 | 7.09 | 51.99 | 26.13 | 44.58 | 8.17 | ||
| C | 7 | 4,030.00 | 37.18 | 34.56 | −7.04 | 41.5 | 11.7 | 37.08 | −0.28 | 45.93 | 23.53 | 37.46 | 0.73 | ||
| C | 2b | 4,160.00 | 50.40 | 46.29 | −8.16 | 51.9 | 2.9 | 48.30 | −4.17 | 56.27 | 11.65 | 48.48 | −3.81 | ||
| Mean | 3,241.50 | 33.90 | 31.21 | −8.49 | 36.2 | 6.5 | 33.02 | −3.08 | 39.69 | 16.81 | 34.12 | 0.64 | |||
| SD | 627.09 | 8.49 | 8.69 | 12.00 | 8.8 | 8.1 | 9.08 | 11.99 | 10.67 | 12.82 | 8.63 | 12.17 | |||
The top half of the table refers to children weighing less than 2 kg (n = 24) and the bottom half those weighing more than 2 kg (n = 10). Study is the reference where the original validation data were published. A is Jensen et al.,28 B is Westerterp et al.,27 C is Jones et al.,32 and D is Roberts et al.26 ID is the ID from the original study. BM is the mean body mass of the individual in g. rCO2 IC is the indirect calorimetry estimate of CO2 production in liters per day. For each DLW equation, the original data were used to calculate rCO2 and the % difference between these estimates and the chamber CO2 production. At the bottom of each part of the table, the summary statistics across all individuals in each sub-group are shown. The summary statistics for Equation 10 refer to the whole sample of n = 34. Equations 1, 6, 7, and 10 refer to the equations derived in the text here. Coward 1985 refers to the two-pool equation in Coward and Prentice.22 Speakman 7.17 refers to Equation 7.17 in Speakman,3 which is the most widely adopted and validated equation for use in small mammals and birds. For some of the studies, Nd was not available from the original validations. Because the equation Coward 1985 requires individual estimates of Nd, a comparison was not possible for these subjects.
Using the combination of Equations 9 and 10 (or 11) eliminates the boundary discontinuities of using three separate equations and provides a general equation for the estimation of rCO2 from DLW studies, the adult equation (Equation 1) being a special case of this more general solution where body mass is greater than 10 kg. A further benefit of this equation combination is that, if more refined analyses in the future result in equations that are better able to predict the DSR, these could be adopted by replacing Equation 9 with an updated prediction model.
We see considerable future benefits in studies using these new equations because they will improve the accuracy of the derived estimates of energy expenditure. Moreover, by having a single equation set that spans all body sizes, it will be easier for researchers to select the best calculation solution to get the most accurate outcomes. Finally, they will enormously facilitate the compilation and comparison of data across different studies. Indeed, we have already prepared a number of manuscripts based on these equations that consider diverse aspects of energy demands, including global aspects of nutrition, energy demands through the lifespan H.P. et al., unpublished data, impacts of physical activity on lean body mass and energy compensation strategies (V. Careau et al., unpublished data; K.R.W. et al., unpublished data, and trends in energy demands over time (J.R.S. et al., unpublished data To facilitate the adoption of these equations, we have also developed a dedicated website that is free to use where users can input isotope data to derive the rCO2 and TEE using the recommended procedures (http://dlw.som.cuanschutz.edu/).
We suggest that future studies using the DLW method should consider adopting a standard approach for calculating rCO2 and its conversion to TEE. For this purpose, we recommend in adults the equations adopted here (Equation 1 and its calculation forms in Equations 3 and 4) for calculating rCO2 and the Weir equation for the conversion of rCO2 to TEE (Equation 5). This recommendation is based on the performance of the rCO2 equation in adult validation studies (Table 1). In babies (<10 kg), we suggest adoption of Equation 10, where the dilution space ratio is calculated from body weight. This equation performs best in validation studies of babies. Alternatively, if these standards are not adopted, then we suggest users should make available in supplemental materials the values of ko, kd, No, and Nd for each individual subject, so that the published estimates can be easily converted to the standard, thereby improving future comparisons. Moreover, we strongly advocate users to upload their DLW data into the IAEA DLW database8 and make their standardized data widely available to the scientific community.
Limitations of study
The main advantage of the DLW method is that it allows a measure of free-living energy demands unencumbered by any measurement apparatus. The main advantage of the chamber indirect calorimetry approach is its verified precision and accuracy based on sound physiological and engineering principles. However, chamber calorimetry has the disadvantage that the range of activities that individuals can engage in is more limited than free-living subjects can perform. When the two techniques are brought together in a validation, it is expected because of the restricted activity that the energy expenditure of most subjects would sit at the low end of the spectrum of free-living demands, and hence, the validation may be biased to low levels of expenditure. However, the average CO2 production across all subjects in the validation study was 497.5 L/day (Table 1), which is comparable to the expected average CO2 production of adult free-living individuals weighing 80 kg in the IAEA database of 494 L/day. Hence, this is unlikely to be a serious source of bias. Perhaps the biggest weakness is the fact that, although on average, the new equations perform well at the individual level, there are still considerable discrepancies at the individual level. This variation limits utility of the method to measure individual levels of energy expenditure. The cause of this variation remains unclear and is generally presumed to reflect random errors in isotope enrichment determinations. However, the validation studies have generally not recorded the diets consumed by the subjects. Because, in theory, different dietary constituents may provide different opportunities for hydrogen isotope exchange and may stimulate different levels of de novo lipogenesis, this could contribute to isotope dilution spaces and fluxes that are not accounted for in the standard calculation, contributing to the individual discrepancies. Further validation work with individuals consuming known and quantified diets might contribute to lowering this error. As a final word of caution, there are no validation studies for individuals aged >70 years, and the dilution space ratio may decline at older ages.20 We suggest Equation 1 should be used in this age group with caution.
Consortia
This consortia authorship contains the names of people whose data were contributed into the IAEA DLW database by the analysis laboratory, but they later could not be traced or they did not respond to emails to assent inclusion among the authorship. The list also includes some researchers who did not assent inclusion to the main authorship because they felt their contribution was not sufficient to merit authorship: Stefan Branth; Niels C. De Bruin; Lisa H. Colbert; Alice E. Dutman; Simon Eaton; Sölve Elmståhl; Mikael Fogelholm; Tamara Harris; Rik Heijligenberg; Hans U. Jorgensen; Christel L. Larsson; Margaret McCloskey; Gerwin A. Meijer; Daphne L. Pannemans; Renaat M. Philippaerts; John J. Reilly; Elisabet M. Rothenberg; Sabine Schulz; Amy Subar; Minna Tanskanen; Ricardo Uauy; Rita Van den Berg-Emons; Wim G. Van Gemert; Erica J. Velthuis-te Wierik; Wilhelmine W. Verboeket-van de Venne; and Jeanine A. Verbunt.
STAR★Methods
Key Resources Table
| REAGENT or RESOURCE | SOURCE | IDENTIFIER |
| Deposited data | ||
| The data on which the analyses were based is available in the International Atomic Energy Agency Doubly labeled water database. | International Atomic Energy Agency | https://www.dlwdatabase.org/ |
| Software and algorithms | ||
| Software for calculating results of DLW experiments | University of Colorado | http://dlw.som.cuanschutz.edu/ |
Resource availability
Lead contact
Further information and requests for resources and reagents should be directed to and will be fulfilled by the Lead Contact. John R Speakman (jspeakman@abdn.ac.uk)
Materials availability
This study did not generate new unique reagents.
Data and code availability
The data presented here pertain to the IAEA DLW database (v3.1) which is a repository of almost 7000 measurements of daily energy expenditure in humans made using the DLW method. Full details of the aims and scope of the database can be found in reference 8.
Experimental model and subject details
The analysis here includes data for 5756 children, adolescents and adults and 1021 babies and infants extracted from the IAEA database v3.1. These data have all been published previously and are extracted from relevant publications for inclusion in the database by authors of those papers.
Method details
This study is based on recalculation of previously published data concerning use of the DLW method in free-living subjects and in experiments involving DLW and simultaneous chamber indirect calorimetry. There is no standard approved protocol for the use of the DLW technique and hence studies vary in the exact methods employed. In general however subjects are dosed with 18Oxygen and deuterium in drinking water at a dose rate aiming to produce an excess enrichment of 18Oxygen between 150 and 300 ppm above background levels, and an enrichment of deuterium about half that. A background urine sample is taken prior to dosing and an equilibrium sample commonly 3-4 hours afterward (3rd void) but in some protocols 10-12h later. The measurement duration can vary between 7 and 21 days and during that period samples may be collected only at the start and end, or on multiple occasions throughout the washout period. Measurement durations are generally shorter for children and dosing can be higher than for adults. The isotope washout is normally calculated from the log converted isotope enrichments above background. When multiple samples are collected it may also be evaluated from a non-linear exponential model fit to the data. Isotope dilution spaces may be calculated from the back extrapolated washout to the dose time, or from the equilibrium samples. During free-living studies individuals continue their daily routines as normal. Full details of the practical aspects of the method can be found in ref 3. During chamber validation studies the subjects live continuously or semi-continuously inside a room calorimeter. Semi-continuous occupancy is for 23.5h per day with 30 mins allowed outside for chamber calibration and for subjects to shower. Gas exchange from the chamber is measured using gas analysers and CO2 production calculated from the difference in CO2 content between incurrent and excurrent air and the flow rate.
Quantification and statistical analysis
Measurements using different methods were compared in a pairwise fashion using the Bland-Altman methodology26. Comparisons between the simultaneous DLW and chamber respirometry values were made by calculating the absolute differences (precision) and summed differences including the sign (accuracy) between DLW estimates of CO2 production derived from different equations and the chamber indirect calorimetry estimates.
Acknowledgments
The DLW database, which can be found at https://www.dlwdatabase.org/, is generously supported by the IAEA (Vienna, Austria), Taiyo Nippon Sanso, and SERCON. We are grateful to these companies for their support and especially to Takashi Oono for his tremendous efforts at fund raising on our behalf. The authors also gratefully acknowledge funding from the US National Science Foundation (BCS-1824466) awarded to Herman Pontzer. The funders played no role in the content of this manuscript.
Author contributions
J.R.S., Y.Y., D.A.S., H.S., W.W.W., A.H.L., J.R., K.R.W., H.P., C.U.L., and A.J.M.-A. conceived the study. J.R.S., Y.Y., and H.S. performed the calculations, analyzed the data, and derived the equations. E.S.F.B., S.A.C., and E.L.M. programmed the website to perform the calculations. All the other authors contributed data to the analysis. J.R.S. wrote the first draft. All authors contributed to the manuscript and assented to submission.
Declaration of interests
The authors declare no competing interests.
Published: February 16, 2021
Contributor Information
John R. Speakman, Email: j.speakman@abdn.ac.uk.
Yosuke Yamada, Email: yyamada831@gmail.com.
Hiroyuki Sagayama, Email: hiroyuki.sagayama.ka@u.tsukuba.ac.jp.
Amy H. Luke, Email: aluke@luc.edu.
Herman Pontzer, Email: pontzer@gmail.com.
Jennifer Rood, Email: jennifer.rood@pbrc.edu.
Dale A. Schoeller, Email: dschoell@nutrisci.wisc.edu.
Klaas R. Westerterp, Email: k.westerterp@maastrichtuniversity.nl.
William W. Wong, Email: wwong@bcm.edu.
References
- 1.Lifson N., Gordon G.B., McCLINTOCK R. Measurement of total carbon dioxide production by means of D2O18. J. Appl. Physiol. 1955;7:704–710. doi: 10.1152/jappl.1955.7.6.704. [DOI] [PubMed] [Google Scholar]
- 2.Lifson N. Theory of use of the turnover rates of body water for measuring energy and material balance. J. Theor. Biol. 1966;12:46–74. doi: 10.1016/0022-5193(66)90185-8. [DOI] [PubMed] [Google Scholar]
- 3.Speakman J.R. Chapman and Hall; 1997. Doubly Labelled Water: Theory and Practice. [Google Scholar]
- 4.Nagy K.A. Laboratory of Biomedical and Environmental Sciences, University of California; 1983. The Doubly Labeled Water (3HH18O) Method: A Guide to Its Use. [Google Scholar]
- 5.Schoeller D.A., van Santen E. Measurement of energy expenditure in humans by doubly labeled water method. J. Appl. Physiol. 1982;53:955–959. doi: 10.1152/jappl.1982.53.4.955. [DOI] [PubMed] [Google Scholar]
- 6.Westerterp K.R., Saris W.H.M., van Es M., ten Hoor F. Use of the doubly labeled water technique in humans during heavy sustained exercise. J Appl Physiol (1985) 1986;61:2162–2167. doi: 10.1152/jappl.1986.61.6.2162. [DOI] [PubMed] [Google Scholar]
- 7.Klein P.D., James W.P., Wong W.W., Irving C.S., Murgatroyd P.R., Cabrera M., Dallosso H.M., Klein E.R., Nichols B.L. Calorimetric validation of the doubly-labelled water method for determination of energy expenditure in man. Hum. Nutr. Clin. Nutr. 1984;38:95–106. [PubMed] [Google Scholar]
- 8.Speakman J.R., Pontzer H., Rood J., Sagayama H., Schoeller D.A., Westerterp K.R., Wong W.W., Yamada Y., Loechl C., Murphy-Alford A.J. The International Atomic Energy Agency International Doubly Labelled Water Database: aims, scope and procedures. Ann. Nutr. Metab. 2019;75:114–118. doi: 10.1159/000503668. [DOI] [PubMed] [Google Scholar]
- 9.Dugas L.R., Harders R., Merrill S., Ebersole K., Shoham D.A., Rush E.C., Assah F.K., Forrester T., Durazo-Arvizu R.A., Luke A. Energy expenditure in adults living in developing compared with industrialized countries: a meta-analysis of doubly labeled water studies. Am. J. Clin. Nutr. 2011;93:427–441. doi: 10.3945/ajcn.110.007278. [DOI] [PMC free article] [PubMed] [Google Scholar]
- 10.Schoeller D.A., Allison D.B. In: Advances in the Assessment of Dietary Intake. Schoeller D.A., Westerterp-Plantenga M.S., editors. CRC; 2017. pp. 185–197.Use of doubly-labeled water measured energy expenditure as a biomarker of self-reported energy intake [Google Scholar]
- 11.International Atomic Energy Agency . Vienna International Centre; 2009. IAEA Human Health Series No. 3. Assessment of Body Composition and Total Energy Expenditure in Humans Using Stable Isotope Techniques. [Google Scholar]
- 12.Schoeller D.A., Webb P. Five-day comparison of the doubly labeled water method with respiratory gas exchange. Am. J. Clin. Nutr. 1984;40:153–158. doi: 10.1093/ajcn/40.1.153. [DOI] [PubMed] [Google Scholar]
- 13.Westerterp K.R., Brouns F., Saris W.H., ten Hoor F. Comparison of doubly labeled water with respirometry at low- and high-activity levels. J. Appl. Physiol. 1988;65:53–56. doi: 10.1152/jappl.1988.65.1.53. [DOI] [PubMed] [Google Scholar]
- 14.Seale J.L., Conway J.M., Canary J.J. Seven-day validation of doubly labeled water method using indirect room calorimetry. J Appl Physiol (1985) 1993;74:402–409. doi: 10.1152/jappl.1993.74.1.402. [DOI] [PubMed] [Google Scholar]
- 15.Schoeller D.A., Ravussin E., Schutz Y., Acheson K.J., Baertschi P., Jéquier E. Energy expenditure by doubly labeled water: validation in humans and proposed calculation. Am. J. Physiol. 1986;250:R823–R830. doi: 10.1152/ajpregu.1986.250.5.R823. [DOI] [PubMed] [Google Scholar]
- 16.Ravussin E., Harper I.T., Rising R., Bogardus C. Energy expenditure by doubly labeled water: validation in lean and obese subjects. Am. J. Physiol. 1991;261:E402–E409. doi: 10.1152/ajpendo.1991.261.3.E402. [DOI] [PubMed] [Google Scholar]
- 17.Melanson E.L., Swibas T., Kohrt W.M., Catenacci V.A., Creasy S.A., Plasqui G., Wouters L., Speakman J.R., Berman E.S.F. Validation of the doubly labeled water method using off-axis integrated cavity output spectroscopy and isotope ratio mass spectrometry. Am. J. Physiol. Endocrinol. Metab. 2018;314:E124–E130. doi: 10.1152/ajpendo.00241.2017. [DOI] [PMC free article] [PubMed] [Google Scholar]
- 18.Schoeller D.A. Measurement of energy expenditure in free-living humans by using doubly labeled water. J. Nutr. 1988;118:1278–1289. doi: 10.1093/jn/118.11.1278. [DOI] [PubMed] [Google Scholar]
- 19.Racette S.B., Schoeller D.A., Luke A.H., Shay K., Hnilicka J., Kushner R.F. Relative dilution spaces of 2H- and 18O-labeled water in humans. Am. J. Physiol. 1994;267:E585–E590. doi: 10.1152/ajpendo.1994.267.4.E585. [DOI] [PubMed] [Google Scholar]
- 20.Sagayama H., Yamada Y., Racine N.M., Shriver T.C., Schoeller D.A., DLW Study Group Dilution space ratio of 2H and 18O of doubly labeled water method in humans. J Appl Physiol (1985) 2016;120:1349–1354. doi: 10.1152/japplphysiol.01037.2015. [DOI] [PMC free article] [PubMed] [Google Scholar]
- 21.Speakman J.R., Nair K.S., Goran M.I. Revised equations for calculating CO2 production from doubly labeled water in humans. Am. J. Physiol. 1993;264:E912–E917. doi: 10.1152/ajpendo.1993.264.6.E912. [DOI] [PubMed] [Google Scholar]
- 22.Coward W.A., Prentice A.M. Isotope method for the measurement of carbon dioxide production rate in man. Am. J. Clin. Nutr. 1985;41:659–663. doi: 10.1093/ajcn/41.3.659. [DOI] [PubMed] [Google Scholar]
- 23.Shanthini R. Thermodynamics for Beginners with Worked Examples. Peradeniya University; Peradeniya, Sri Lanka: 2006. Working with ideal gas; pp. 35–68. [Google Scholar]
- 24.Weir J.B. New methods for calculating metabolic rate with special reference to protein metabolism. J. Physiol. 1949;109:1–9. doi: 10.1113/jphysiol.1949.sp004363. [DOI] [PMC free article] [PubMed] [Google Scholar]
- 25.Bland J.M., Altman D.G. Statistical methods for assessing agreement between two methods of clinical measurement. Lancet. 1986;1:307–310. [PubMed] [Google Scholar]
- 26.Wells J.C., Ritz P., Davies P.S., Coward W.A. Factors affecting the 2H to 18O dilution space ratio in infants. Pediatr. Res. 1998;43:467–471. doi: 10.1203/00006450-199804000-00005. [DOI] [PubMed] [Google Scholar]
- 27.Roberts S.B., Coward W.A., Schlingenseipen K.H., Nohria V., Lucas A. Comparison of the doubly labeled water (2H2(18)O) method with indirect calorimetry and a nutrient-balance study for simultaneous determination of energy expenditure, water intake, and metabolizable energy intake in preterm infants. Am. J. Clin. Nutr. 1986;44:315–322. doi: 10.1093/ajcn/44.3.315. [DOI] [PubMed] [Google Scholar]
- 28.Westerterp K.R., Lafeber H.N., Sulkers E.J., Sauer P.J.J. Comparison of short term indirect calorimetry and doubly labeled water method for the assessment of energy expenditure in preterm infants. Biol. Neonate. 1991;60:75–82. doi: 10.1159/000243391. [DOI] [PubMed] [Google Scholar]
- 29.Jensen C.L., Butte N.F., Wong W.W., Moon J.K. Determining energy expenditure in preterm infants: comparison of 2H(2)18O method and indirect calorimetry. Am. J. Physiol. 1992;263:R685–R692. doi: 10.1152/ajpregu.1992.263.3.R685. [DOI] [PubMed] [Google Scholar]
- 30.Ritz P., Johnson P.G., Coward W.A. Measurements of 2H and 18O in body water: analytical considerations and physiological implications. Br. J. Nutr. 1994;72:3–12. doi: 10.1079/bjn19940004. [DOI] [PubMed] [Google Scholar]
- 31.de Bruin N.C., Degenhart H.J., Gàl S., Westerterp K.R., Stijnen T., Visser H.K. Energy utilization and growth in breast-fed and formula-fed infants measured prospectively during the first year of life. Am. J. Clin. Nutr. 1998;67:885–896. doi: 10.1093/ajcn/67.5.885. [DOI] [PubMed] [Google Scholar]
- 32.Jones P.J.H., Winthrop A.L., Schoeller D.A., Swyer P.R., Smith J., Filler R.M., Heim T. Validation of doubly labeled water for assessing energy expenditure in infants. Pediatr. Res. 1987;21:242–246. doi: 10.1203/00006450-198703000-00007. [DOI] [PubMed] [Google Scholar]
- 33.Speakman J.R. How should we calculate CO2 production in doubly labeled water studies of animals? Funct. Ecol. 1993;7:746–750. [Google Scholar]
Associated Data
This section collects any data citations, data availability statements, or supplementary materials included in this article.
Data Availability Statement
The data presented here pertain to the IAEA DLW database (v3.1) which is a repository of almost 7000 measurements of daily energy expenditure in humans made using the DLW method. Full details of the aims and scope of the database can be found in reference 8.