Abstract
Background
Immunoglobulin A nephropathy (IgAN) is the most frequent primary glomerulonephritis. The role of the microbiota and mucosal immunity in the pathogenesis of IgAN remains a key element. To date, the hypothetical relationship between commensal bacteria, elevated tumour necrosis factor (TNF) superfamily member 13 [also known as B-cell activating factor (BAFF)] levels, perturbed homoeostasis of intestinal-activated B cells and intestinal IgA class switch has not been clearly shown in IgAN patients.
Methods
We studied the intestinal–renal axis connections, analysing levels of BAFF, TNF ligand superfamily member 13 (APRIL) and intestinal-activated B cells in IgAN patients, healthy subjects (HSs) and patients with non-IgA glomerulonephritides.
Results
IgAN patients had increased serum levels of BAFF cytokine, correlating with higher amounts of five specific microbiota metabolites, and high APRIL cytokine serum levels. We also found that subjects with IgAN have a higher level of circulating gut-homing (CCR9+ β7 integrin+) regultory B cells, memory B cells and IgA+ memory B cells compared with HSs. Finally, we found that IgAN patients had high levels of both total plasmablasts (PBs) and intestinal-homing PBs. Interestingly, PBs significantly increased in IgAN but not in patients with other glomerulonephritides.
Conclusions
Our results demonstrate a significant difference in the amount of intestinal-activated B lymphocytes between IgAN patients and HSs, confirming the hypothesis of the pathogenic role of intestinal mucosal hyperresponsiveness in IgAN. The intestinal–renal axis plays a crucial role in IgAN and several factors may contribute to its complex pathogenesis and provide an important area of research for novel targeted therapies to modulate progression of the disease.
Keywords: B cells, commensal bacteria, glomerulonephritis, gut microbiota, IgA nephropathy
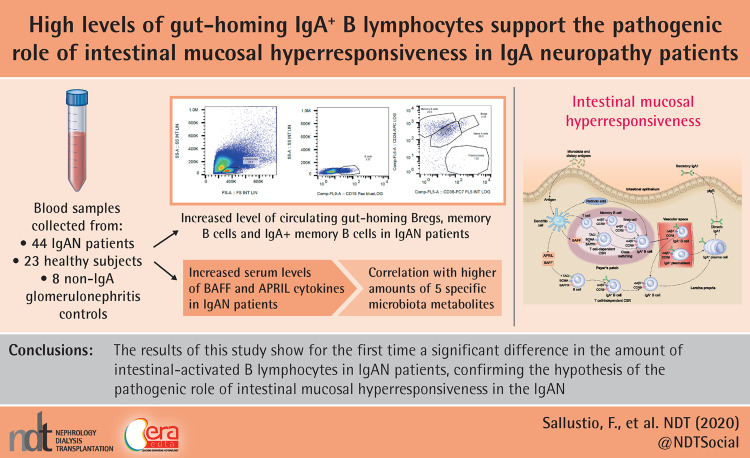
Graphical Abstract
KEY LEARNING POINTS
What is already known about this subject?
Immunoglobulin A nephropathy (IgAN) is the most frequent primary glomerulonephritis.
To date, the relationship between gut microbiota, perturbed homoeostasis of intestinal-activated B cells and intestinal IgA class switch in IgAN patients has been hypothesized but not demonstrated.
What this study adds?
IgAN patients have a higher frequency of intestinal-activated B cells than healthy subjects. Our study shos for the first time that circulating gut-homing (CCR9+ β7 integrin+) regulatory B cells, memory B cells and plasmablasts were increased in IgAN patients compared with controls.
This mucosal hyperresponsiveness, resulting also from high serum B-cell activating factor levels associated with specific faecal microbiota metabolites, results in an abnormal production of galatose-deficient IgA, which pases into the bloodstream, depositing as immune complexes in the kidney.
What impact this may have on practice or policy?
These findings corroborate the role of the intestinal–renal axis in the pathogenesis of IgAN and offer novel opportunities to seek therapeutic targets and modulate progression of the disease in the medical practice.
INTRODUCTION
Immunoglobulin A nephropathy (IgAN) is the most frequent primary glomerulonephritis. In recent years, the role of mucosal immunity in IgAN has gained increasing importance stemming from the clinical observation of episodes of macrohaematuria concomitant with infections of the upper respiratory tract (tonsillitis) or intestinal mucous membranes and the fact that IgA is the most represented immunoglobulin in mucosal secretions. Associations with celiac disease and herpetiform dermatitis also support the relationship between IgAN and mucous membranes, perhaps due to increased intestinal permeability and high levels of IgA against gliadin [1].
Gut microbiota controls the recruitment, differentiation and function of innate and adaptive immune cells in mucosa-associated lymphoid tissue (MALT), acting both locally and systemically [2]. The intestinal immune system is a unique environment that protects against pathogens through the production of IgA, probably contributing to maintain tolerance to dietary proteins and commensal microbiota [1]. IgA is the most represented antibody isotype in the gastrointestinal tract. The prevalence in the production of IgA by intestinal plasma cells is due in part to the isotype switch towards IgA that occurs in gut-associated lymphoid tissues (GALTs) and in mesenteric lymph nodes [1, 3].
IgA production can be induced by T-cell-dependent (TD) or -independent pathways, which occur in MALT [4]. TD IgA production occurs in the lymphoid follicles of Peyer’s patches and mesenteric lymph nodes, while T-cell-independent (TI) IgA class switching of B cells can occur, also in the lamina propria, and is induced by various cytokines, but mainly by tumour necrosis factor (TNF) ligand superfamily member 13 (APRIL), a proliferation-inducing ligand and B-cell activating factor (BAFF; also known as TNF superfamily member 13) [4, 5]. Moreover, BAFF has been shown to promote proliferation of human mesangial cells [6].
The role of microbiota and intestinal immunity in IgAN is particularly interesting due to the activity of secretory IgA in the intestinal mucosa. In a transgenic mouse model overexpressing BAFF, elevated serum levels of galactose-deficient IgA (Gd-IgA) and mesangial deposits of IgA were found, but for the development of this phenotype, the presence of intestinal microbiota was necessary. Moreover, specific commensal bacteria-reactive IgA antibodies were found in the blood [7]. Some studies suggest that a similar mechanism could occur in humans: high levels of BAFF and APRIL were found in patients with IgAN [8]. Moreover, a different profile was observed both in the composition of the faecal microbiota and in the metabolomic profile between patients with IgAN and healthy subjects (HSs) [9].
However, to date, the hypothetical relationship between commensal bacteria, elevated BAFF levels and perturbed homoeostasis of intestinal IgA class switch has not been demonstrated in IgAN patients. In particular, this process may include anomalous hyperactivation and spreading of gut-derived IgA-secreting cells and may culminate in an abnormal diffusion of IgA+ plasma cells from mucosal lamina propria and increased release of polymeric IgA [1, 3].
Here we dissected the role of the complex intestinal immune network in the pathogenesis of IgAN by characterizing circulating B cells activated at the intestinal level and determining the levels of B cells and plasmablasts (PBs) expression of β7 integrin and C-C motif chemokine receptor 9 (CCR9) intestinal homing receptors in IgAN patients compared with HSs and in non-IgA glomerulonephritides.
MATERIALS AND METHODS
Study design and patients
The study was carried out in accordance with the Helsinki Declaration and the European Guidelines for Good Clinical Practice and approved by our institutional ethics review board (protocol no. 606). Written consent was obtained from all subjects. Three groups of Caucasian volunteers were included in the study: 44 primary IgAN patients, 23 HSs without known diseases and 22 controls with non-IgA glomerulonephritis (patients with membranous glomerulonephritis and minimal change disease), matched to cases by age and gender. We analysed B-cell subpopulations by flow cytometry analysis [fluorescence-activated cell sorting (FACS)] in 36 IgAN patients, 13 HSs and 22 controls. Exclusion criteria are detailed in the Supplementary Materials.
The main clinical features of enrolled patients and HSs included in the study are summarized in Table 1. The main pathological features of IgAN patients, according to the Oxford classification MEST-C score were reported in Table 2. All patients were enrolled before receiving drug administrations. No significant difference in age and sex distribution was observed among the three groups.
Table 1.
Clinical features of studied IgAN patients and healthy controls
| Variable | HSs (n = 23) |
IgAN patients (n = 44) |
Non-IgAN glomerulonephritis (controls, n = 22) |
|---|---|---|---|
| Age (years), mean ± SD | 37 ± 11 | 41 ± 10 | 46 ± 15 |
| Male, % | 56 | 62 | 40 |
| Serum creatinine (mg/dL), mean ± SD | 0.88 ± 0.24 | 1.14 ± 0.41 | 0.98 ± 0.30 |
| Proteinuria (g/day), mean ± SD | 0.05 ± 0.01 | 1.36 ± 1.18 | 0.93 ± 0.74 |
| GFR (mL/min/1.73 m2), mean ± SD | 96.1 ± 7.0 | 86.4 ± 27.9 | 87.0 ± 32.7 |
| Body mass index (kg/m2), mean ± SD | 25 ± 4 | 25 ± 4 | 26 ± 3 |
Table 2.
Frequency of pathologic features (%) according to the Oxford classification of IgAN patients (n = 44)
| Mesangial hypercellularity |
Endocapillary hypercellularity |
Segmental glomerulosclerosis |
Tubular atrophy/interstitial fibrosis |
Crescents |
|||||||
|---|---|---|---|---|---|---|---|---|---|---|---|
| (M) | (E) | (S) | (T) | (C) | |||||||
| M0 | M1 | E0 | E1 | S0 | S1 | T0 | T1 | T2 | C0 | C1 | |
| 30 | 70 | 67 | 33 | 47 | 53 | 56 | 32 | 12 | 77 | 23 | |
Faecal microbiome analysis and IgA characterization
The faecal microbiome and urinary and faecal metabolome of all subjects were previously characterized [9]. Total IgA content in serum from each participant was measured in duplicate using an enzyme-linked immunosorbent assay (ELISA) as previously described [10] and as detailed in the Supplementary Materials. Galatose-deficient IgA1 (Gd-IgA1) was detected by a Helix aspersa agglutinin lectin-binding assay (Sigma-Aldrich, St. Louis, MO, USA), as reported elsewhere [11–13]. Additional information is provided in the Supplementary Materials.
ELISA for soluble human BAFF and APRIL
Human BAFF and APRIL serum levels were quantified by using eBioscience (San Diego, CA, USA) ELISA kits according to the manufacturer’s instructions. Each sample was analysed in duplicate and results were expressed in nanograms per millilitre.
Flow cytometry analysis
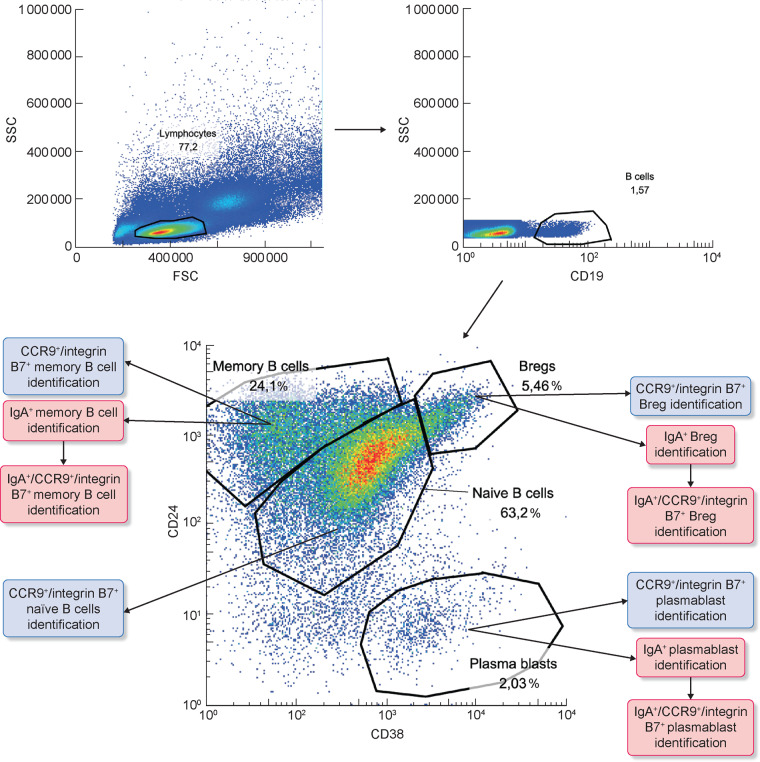
Peripheral blood mononuclear cells (PBMCs) were isolated by gradient centrifugation with Ficoll-Hypaque. PBMCs were then stained with the following monoclonal antibodies (mAbs) for FACS: Vio Blue-conjugated anti-CD19, APC-conjugated anti-CD24, PECy7-conjugated anti-CD38, PerCP vio700-conjugated anti-IgA, phycoerythrin(PE)-conjugated anti-integrin β7 and FITC-conjugated anti-CCR9 (or their corresponding isotype controls). PBMCs were incubated for 20 min with the antibody mixes in the dark at 4°C, washed twice and resuspended in FACS buffer. All mAbs and their respective isotypes were purchased from Miltenyi Biotec (Bologna, Italy). The anti-CD19 antibody was used to identify total B cells (CD19+ cells), then anti-CD38 and anti-CD24 were used to distinguish B-cells subsets: naïve B cells (CD24+dim CD38+ dim B cells), memory B cells (CD24+ CD38− B cells), PBs (CD24− CD38+ B cells) and Bregs (CD24+ high CD38+ high B cells). Within each of these subsets we detected the presence of IgA and analysed the expression of integrin β7 and CCR9 (two gut-homing receptors). Stained cells were then acquired on a Navios cytometer (Beckman Coulter, Milan, Italy) and analysed using Flowjo software (TreeStar, Ashland, OR, USA). About 500 000 cells for each sample were analysed (Supplementary data, Table S2).
Statistical analysis
A two-tailed t test or one-way analysis of variance (ANOVA) test with Tukey’s multiple comparison test was used to compare groups. The Pearson correlation test was used to test the linear association between variables. All values were expressed as the mean ± standard error of the mean. Results were considered statistically significant at P < 0.05. Analyses were performed using GraphPad Prism statistical software version 5.01 for Windows (GraphPad Software, San Diego, CA, USA).
RESULTS
IgAN patients have high serum BAFF levels associated with specific faecal microbiota metabolites
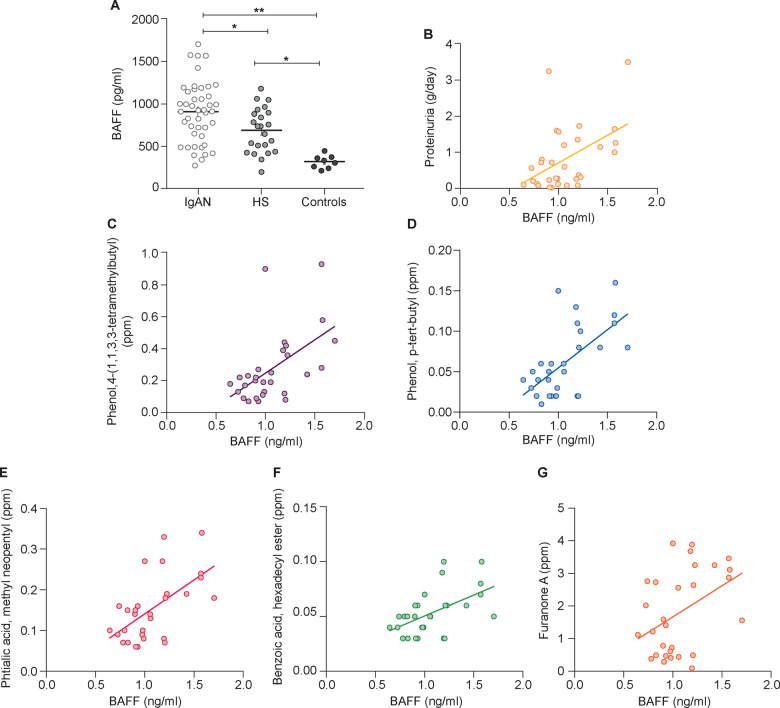
As a first step in studying the intestinal–renal axis, we measured the serum expression levels of BAFF and APRIL cytokines [3, 6, 14] in 44 IgAN patients and 23 HSs and 8 patients with non-IgA glomerulonephritis (membranous glomerulonephritis and minimal change disease patients), whose clinical and demographic characteristics are reported in Table 1. We found a significantly increased level of BAFF cytokine in IgAN patients compared with HSs (P = 0.012). Moreover, BAFF levels were higher compared with the control group of patients with non-IgA glomerulonephritis (P < 0.0001; Figure 1A). Serum BAFF levels correlated positively with 24-h proteinuria in IgAN patients (r2 = 0.2269, P < 0.001; Figure 1B). BAFF did not correlate with serum creatinine and estimated glomerular filtration rate (eGFR).
FIGURE 1.
Serum BAFF levels were higher in IgAN patients and correlated with proteinuria and faecal metabolites. (A) Serum BAFF levels were determined by ELISA in 44 IgAN patients, 23 HSs and 8 controls. BAFF levels were significantly higher in IgAN patients with respect to HSs (P = 0.012) and non-IgA glomerulonephritis patients (controls; P < 0.0001). Serum BAFF levels in 30 IgAN patients correlated with (B) proteinuria (P < 0.001) and with different faecal metabolites: (C) 4-(1,1,3,3-tetramethylbutyl) phenol (P = 0.0027), (D) p-tert-butyl-phenol (P = 0.0003), (E) methyl neopentyl phthalic acid (P = 0.0007), (F) hexadecyl ester benzoic acid (P = 0.003) and (G) furanone A (0.024) in IgAN patients (Spearman’s correlation). *P ≤ 0.05, **P ≤ 0.005.
We then correlated serum BAFF levels with faecal concentrations of a series of metabolites in a subset of 30 IgAN patients whose faecal microbiota was available and previously analysed (Supplementary data, Table S1). These organic compounds had been found at significantly higher levels in the faeces and/or urine of IgAN patients compared with HSs [9]. We found that serum BAFF levels correlated positively with levels of the following faecal metabolites: 4-(1,1,3,3-tetramethylbutyl) phenol (r2 = 0.2882, P = 0.0027; Figure 1C), p-tert-butyl-phenol (r2 = 0.386, P = 0.0003; Figure 1D), methyl neopentyl phthalic acid (r2 = 0.3491, P = 0.0007; Figure 1E), hexadecyl ester benzoic acid (r2 = 0.2832, P = 0.003; Figure 1F) and furanone A (r2 = 0.1743, P = 0.024; Figure 1G).
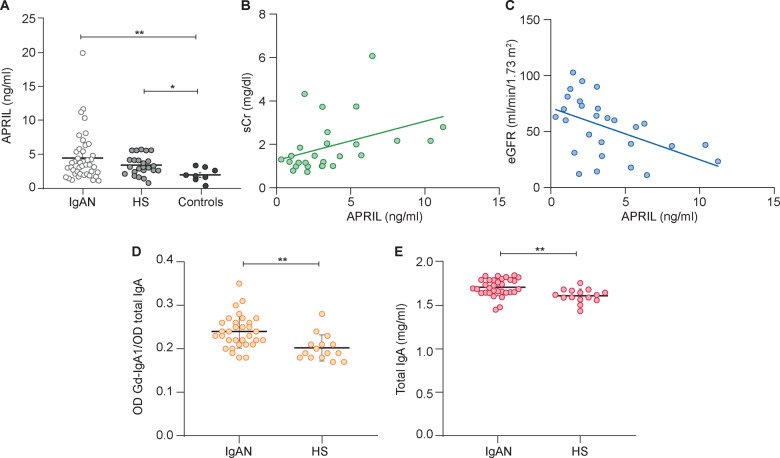
Next we measured serum levels of APRIL. IgAN patients were characterized by a slight but not significant increase of APRIL levels compared with HSs. Instead, APRIL was significantly increased in IgAN patients with respect to non-IgA glomerulonephritis patients (P = 0.0014; Figure 2A).
FIGURE 2.
Serum APRIL levels were significantly higher in IgAN patients and correlated with creatinine serum level. (A) Serum levels of APRIL were determined by ELISA in 44 IgAN patients, 23 HSs and 8 controls and were significantly higher in IgAN patients and HSs than non-IgA glomerulonephritis patients (controls). APRIL IgAN patient serum levels correlated with (B) serum creatinine (P = 0.04) and (C) eGFR determined by the Modification of Diet in Renal Disease equation (P = 0.008) (Spearman’s correlation). (D) Serum levels of Gd-IgA were evaluated in IgAN patients and HSs. The relative lectin binding per unit of IgA1 was calculated as the optical density (OD) value of lectin over the OD value of total IgA. The results showed that serum levels of Gd-IgA1 were higher in IgAN patients than HSs. (E) Serum total IgA levels in IgAN patients and HSs were determined by ELISA and were significantly higher in IgAN patients (P = 0.001). *P ≤ 0.05, **P ≤ 0.005.
Serum levels of APRIL did not correlate with levels of faecal metabolites or with 24-h proteinuria. However, we found a positive correlation with serum creatinine (r2 = 0.159, P = 0.04; Figure 2B) and a negative correlation with eGFR (r2 = 0.2395, P = 0.0082; Figure 2C).
Finally, we measured Gd-IgA1 levels in IgAN patients and HSs. As reported in previous studies [11, 15], we confirmed that Gd-IgA1 serum levels were significantly higher in IgAN patients compared with HSs (P = 0.0015; Figure 2D). Moreover, in our cohort, total IgA levels were also significantly higher in IgAN patients compared with HSs (P = 0.0016; Figure 2E).
Reduced levels of naïve B cells and increased presence of intestinal homing Bregs in IgAN patients
We characterized the percentage of circulating B lymphocytes activated at the intestinal level and expressing the β7 integrin and CCR9 receptors in order to evaluate the differences between patients with IgAN and HSs. B-cell subsets (naïve B cells, memory B cells, Bregs and PBs) were analysed by flow cytometry in a subset of 36 IgAN patients, 13 HSs and 22 controls whose blood samples were available for the analysis. The gating strategy is shown in Figure 3 and in Supplementary data, Figures S1 and S2.
FIGURE 3.
Naïve B subsets analysis in IgAN patients compared with HSs and controls. PBMCs were isolated from the peripheral blood of 36 IgAN patients, 13 HSs and 22 patients with non-IgA glomerulonephritis (controls) and analysed by flow cytometry. The gating strategy used to identify lymphocytes (A, left panel), CD19+ B cells (A, right panel) and B-cell subsets (A, lower panel) is shown for one representative IgAN patient. For each B-cell subset we then analysed the expression of IgA and/or CCR9 and integrin β7 as shown in the panels.
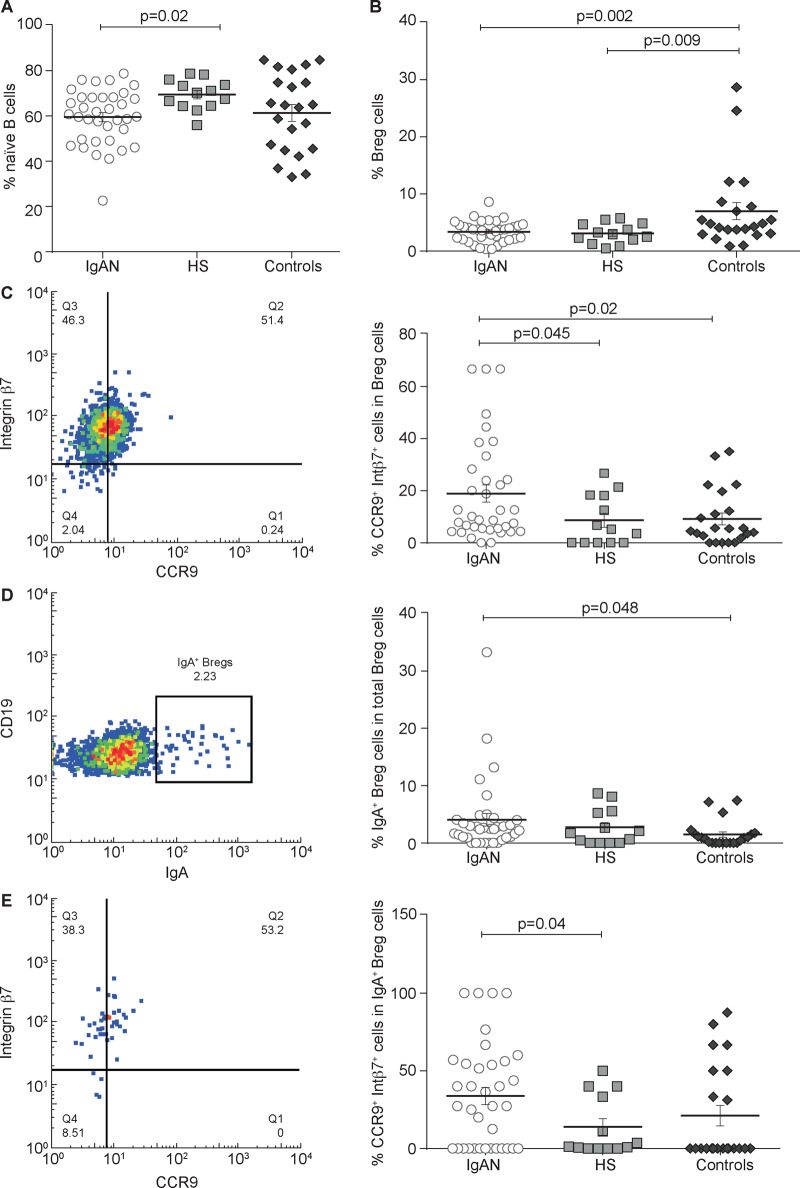
We found a lower percentage of naïve B cells in IgAN patients compared with HSs (P = 0.02; Figure 4A), suggesting an increased inflammatory state in these patients. Representative experiments of the HS and control groups are shown in Supplementary data, Figures S1B and S2B, respectively.
FIGURE 4.
Bregs subset analysis in IgAN patients compared with HSs and controls. PBMCs were isolated from 36 IgAN patients, 13 HSs and 22 non-IgA glomerulonephritis patients (controls) and the naïve B cells subpopulation was analysed by flow cytometry. (A) The naïve B cells were lower in IgAN patients and in non-IgA glomerulonephritis controls compared with HSs. (B) Total Breg subpopulation was analysed in IgAN patients, HSs and controls. There was no significant difference between IgAN patients and HSs. Instead, total Bregs frequency was higher in controls compared with IgAN patients (P = 0.002) and HSs (P = 0.009). (C) Gut-homing (CCR9+ integrin β7+) Breg frequencies in IgAN patients, HSs and controls. Gut-homing Breg cells were increased in IgAN patients compared with HSs and controls (P = 0.045 and P = 00.02, respectively). (D) IgA+ Bregs frequencies in IgAN patients, HSs and controls. IgA+ Bregs were increased in IgAN patients compared with controls (P = 0.048). (E) Gut-homing (CCR9+ integrin β7+) IgA+ Bregs frequencies in IgAN, HSs and controls. Gut-homing IgA+ Bregs were higher in IgAN patients compared with HSs and controls (P = 00.04). One-way ANOVA test was used to compare groups.
We then studied the total Breg subpopulation and did not find any significant difference between IgAN patients and HSs but found a significant decrease when compared with non-IgAN controls (Figure 4B). Instead, a significant difference was found by comparing the subpopulation of Bregs expressing CCR9 and integrin β7. IgAN patients showed a significantly increased presence of CCR9+ integrin β7+ Bregs compared with HSs and controls (P = 0.045 and P = 0.02, respectively; Figure 4C). This difference was quite important considering that it was more than twice that of HSs. Moreover, we found significant differences in frequencies of IgAN IgA+ Bregs compared with controls (P = 0.048; Figure 4D). However, CCR9+ integrin β7+ IgA+ Breg percentages were higher in IgAN patients as compared with HSs (P = 0.04; Figure 4D). Representative experiments of HS and control groups are shown in Supplementary data, Figures S1C and S2C, respectively.
IgAN patients have increased levels of gut-homing memory B cells producing IgA
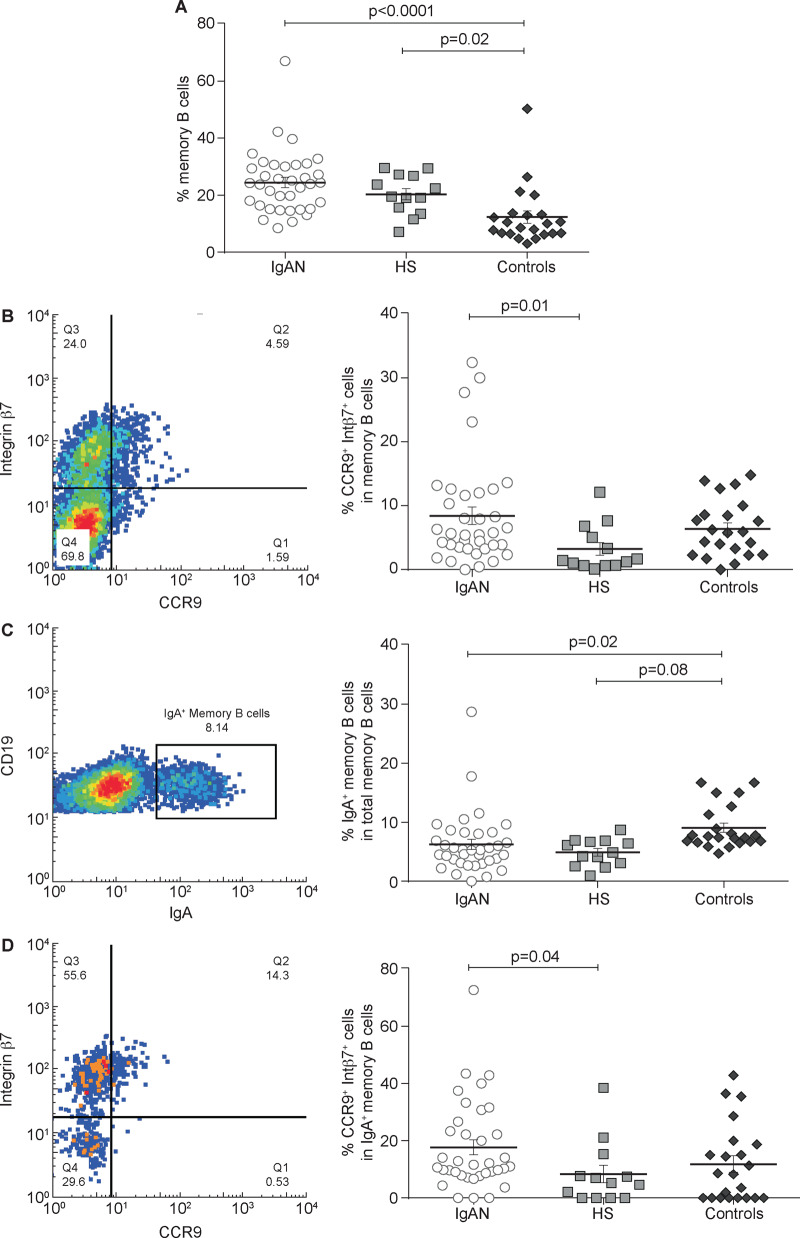
When we studied memory B cells, we found that in non-IgA glomerulonephritis controls the percentage of these cells was lower than in IgAN patients and HSs (P = 0.0001 and P = 0.02, respectively; Figure 5A). However, the number of CCR9+ integrin β7+ memory B cells was significantly higher in IgAN patients compared with HSs (P = 0.001; Figure 5B). Then we calculated the percentage of memory B cells expressing IgA, showing no significant difference between IgAN patients and HSs (Figure 5C). Conversely, IgA+ memory B cells expressing CCR9 and integrin β7 were significantly higher in IgAN patients (P = 0.04) but not in non-IgA glomerulonephritis controls as compared with HSs (Figure 5D). These results suggest that IgA+ memory B cells, particularly those expressing gut-homing markers, are involved in the pathophysiology of the disease. Representative experiments of HS and control groups are shown in Supplementary data, Figures S1D and S2D, respectively.
FIGURE 5.
Total memory B-cell subsets analysis in IgAN patients compared with HSs and controls. PBMCs were isolated from the peripheral blood of 36 IgAN patients, 13 HSs and 22 patients with non-IgA glomerulonephritis (controls) and analysed by flow cytometry. (A) The total memory B-cell subpopulation was analysed in IgAN patients, HSs and controls. The total memory B cells percentage was highest in IgAN patients compared with controls (P < 0.0001) and HSs. Controls had a lower percentage of memory B cells compared with both IgAN patients and HSs (P = 0.02). (B) Mucosa-activated (CCR9+ integrin β7+) memory B cell frequencies in IgAN patients, HSs and controls. Percentages of mucosa-activated memory B cells were increased in both IgAN (P = 0.01) and controls compared with HSs, indicating an involvement of mucosal immune response in glomerulonephritis. (C) IgA+ memory B cell frequencies in IgAN patients, HSs and controls. No difference was found between IgAN patients and HSs, whereas controls had a higher percentage of IgA+ memory B cells compared with IgAN patients (P = 0.08) and HSs (P = 0.02). (D) Mucosa-activated (CCR9+ integrin β7+) IgA+ memory B cells frequencies in IgAN patients, HSs and controls. The intestinal-derived IgA+ memory B cells were significantly increased in IgAN patients but not in patients with non-IgA glomerulonephritis compared with HSs (P = 0.04). One-way ANOVA was used to compare groups.
Higher PB and gut-homing PB levels in IgAN patients
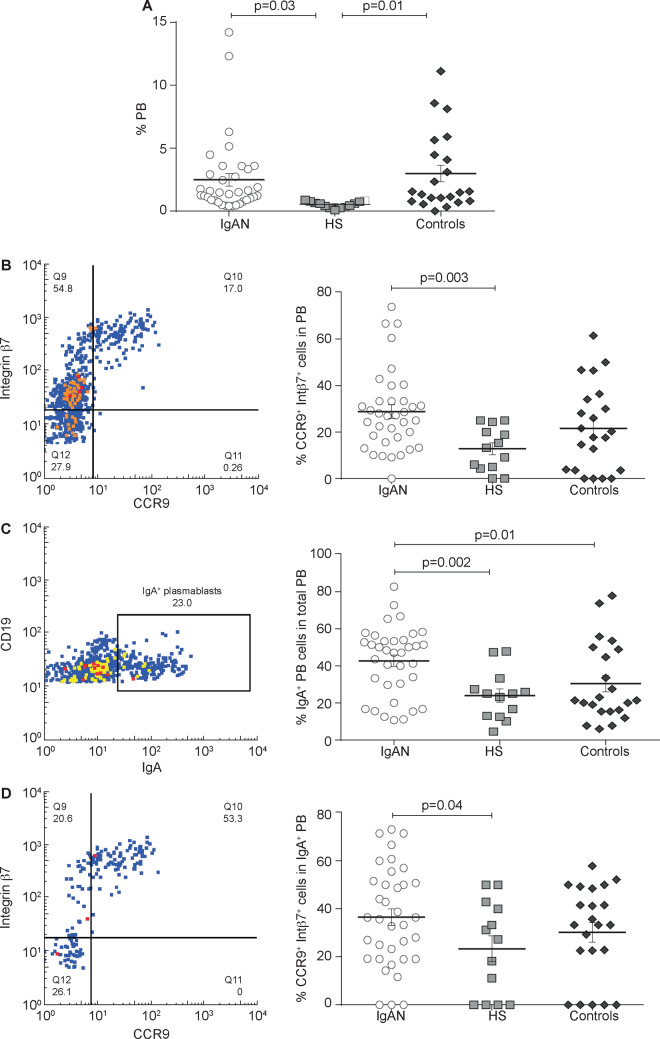
We found a significantly higher percentage of circulating total PBs in IgAN patients as compared with HSs (P = 0.03; Figure 6A) and PB levels doubled in non-IgA glomerulonephritis controls compared with HSs (P = 0.01; Figure 6A). We then investigated the CCR9+ integrin β7+ PB subpopulation and we found increased percentages in IgAN patients compared with HSs (P = 0.003) but not compared with non-IgA glomerulonephritis controls (Figure 6B). Also, IgA+ PBs were significantly higher in IgAN patients compared with HSs and non-IgAN controls (P = 0.002 and P = 0.01, respectively; Figure 6C). However, CCR9+ integrin β7+ PBs expressing IgA were higher in IgAN patients compared with HSs (P = 0.02, Figure 6D). These data are particularly relevant considering that levels of intestinal-activated PBs were significantly higher in IgAN patients compared with HSs. Representative experiments of HS and control groups are shown in Supplementary data, Figures S1E and S2E, respectively.
FIGURE 6.
Total PB cells analysis in IgAN patients compared with HSs and controls. PBMCs were isolated from the peripheral blood of 36 IgAN patients, 13 HSs and 22 patients with non-IgA glomerulonephritis (controls) and analysed by flow cytometry. (A) The total PB subpopulation was analysed in IgAN patients, HSs and controls. IgAN patients had a higher percentage of total PBs compared with HSs (P = 0.03). (B) Mucosa-activated (CCR9+ integrin β7+) PB frequencies in IgAN patients, HSs and controls. Mucosa-activated PBs were increased in IgAN patients compared with HSs (P = 0.003). (C) IgA+ PB frequencies in IgAN patients, HSs and controls. IgA+ PBs were significantly higher in IgAN patients compared with HSs and non-IgAN controls (P = 0.002 and P = 0.01, respectively). (D) Mucosa-activated (CCR9+ integrin β7+) IgA+ PB frequencies in IgAN patients, HSs and controls. Intestinal-derived IgA+ PB cells were increased in IgAN patients compared with HSs (P = 0.04) and non-IgA glomerulonephritis. One-way ANOVA was used to compare groups.
DISCUSSION
In the gut, the adaptive immune responses start in organized functional structures called Peyer’s patches that are associated with the mucosal epithelial layer and include lymphocytes and antigen-presenting cells as well as mesenteric lymph nodes. Naive lymphocytes are exposed to antigens at these sites and differentiate into effector cells. The main function of humoral immunity in the gut is the neutralization of luminal microbes. It is also mediated by the action of IgA secreted in the lumen through the mucosal epithelium and that can return to the intestinal lamina propria and Peyer’s patches. The production of TI IgA is mainly induced by interleukin (IL)-6, IL-10, transforming growth factor β, BAFF, retinoic acid and APRIL produced by the intestinal epithelium, dendritic cells and stromal cells in response to signals triggered by Toll-like receptors activated by commensal bacteria in the intestinal lumen [3].
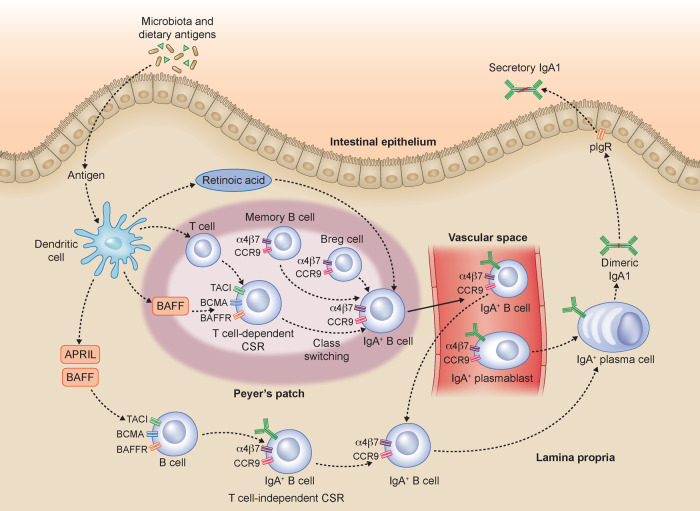
In a TD response, the activation of lymphocytes in GALT follows their migration to the draining mesenteric lymph nodes and their return through the lymphatic vessels and blood vessels to the lamina propria of the intestinal mucosa (Figure 7). It is possible to transiently find intestinal lymphocytes in the peripheral blood. Therefore the presence of circulating cells expressing the intestinal homing receptors CCR9 and integrin β7 allows us to study indirectly the mucosal immune response. Our results show that subjects with IgAN have a higher frequency of Bregs expressing CCR9+ integrin β7+ than in HSs. However, no significant differences compared with the control group in the Bregs expressing CCR9+ and intergrin B7+ were present. Our data suggest Breg involvement in IgAN pathogenesis, which will open new avenues for further investigation of other Breg phenotypes. Furthermore, recent studies have shown that Bregs represent a highly dynamic cellular subset whose differentiation is induced by the microenvironment in which the B cell is located [16] and that the intestinal microbiota can control the production of pro-inflammatory cytokines inducing B-cell differentiation [17]. In addition to the higher CCR9+ Integrin β7+ Breg levels, we found that IgAN patients also showed increased levels of BAFF cytokine, correlating with higher levels of five specific microbiota metabolites.
FIGURE 7.
Gut microbiota influences the immune response in IgAN. In the intestinal mucosa, dietary antigens can contribute to B-cell class switching and IgA1 production. In the lamina propria, dietary antigens are recognized by immune cells that can mediate B-cell class switch recombination (CSR) both in a TD and TI manner. The TD mechanism occurs in Peyer’s patches and mesenteric lymph nodes (data not shown). It is mediated by T cells and involves several factors, including BAFF. The resulting TD IgA+ B cells relocate in the lamina propria. The TI CSR, occurring in the lamina propria, is mediated by several factors: BAFF and APRIL produced by intestinal epithelial, dendritic and stromal cells. Both TD and TI IgA+ B cells, together with IgA+ B cells and IgA+ PBs coming from the blood, can differentiate into IgA1- or IgA2-producing plasma cells. The dimeric IgA is then transported to the intestinal lumen by the polymeric immunoglobulin receptor as secretory IgA. According to our data, we hypothesize that IgAN patients establish a mucosal hyperresponsiveness to the pathogens and commensal bacteria of the intestinal tract. This mucosal hyperresponsiveness in genetically predisposed subjects results in an abnormal production of Gd-IgA that passes into the bloodstream, depositing as immune complexes in the kidneys. In the figure, some simplifications are present in order to facilitate the reader's comprehension of the proposed pathogenesis mechanisms.
It is well known that the intestinal microbiota shapes the immune response in the GALT [1, 2]. The aberrant O-glycosylation of the hinge regions of IgA1 is strongly linked to IgAN [18] and represents the first step in the multihit pathogenesis of IgAN and shows high heritability [3, 19].
However, family-based studies also demonstrate that an elevated level of Gd-IgA1 alone is not sufficient to produce IgAN, as additional co-factors are required to trigger the formation of immune complexes [20, 21]. IgA secretion is clearly induced by both food antigens and the intestinal microbiota and the majority of abundant surface-exposed antigens on commensal microbes are glycans (e.g. O-antigens, teichoic acids/lipoteichoic acids and polysaccharide capsules). These glycans could affect IgA function in several ways [22]. BAFF-overexpressing transgenic mice (BAFF-Tg mice) developed an IgA-driven nephritis, and the development of this condition, which is commensal dependent, involves a breakdown in the normal barrier between the mucosal and peripheral compartments. Interestingly, serum IgA in BAFF-Tg mice was aberrantly glycosylated and polymeric and was not associated with the secretory component. In these mice, serum IgA originated from IgA+ plasmacells in the gut can ‘spill over’ into the periphery [7]. In the a1KICD89Tg humanized IgA1 mouse model, prevention of IgAN was observed by depletion of the microbiota, supporting a causal role of an intestinal microbial dysbiosis in IgAN. In these mice, changes in microbiota composition performed by oral antibiotic administration led to a reduction of proteinuria, suggesting that the microbiota is a candidate therapeutic target [23].
Our results confirm the hypothesis that the perturbation of mucosal immunity, due to an alteration of the intestinal microbiota, plays a central role in the pathogenesis of IgAN. Moreover, in our study we showed that IgAN patients have high mean levels of Gd-IgA and have higher mean levels of CCR9+/integrin β7+ memory B cells and of gut-homing IgA-expressing memory B cells (CCR9+ integrin β7+ IgA+). Memory B cells maintain the memory of their cognate antigen for decades and, upon a second encounter, differentiate more rapidly to antibody-producing PBs than naïve B cells. They can also home back to the tissues or draining lymph nodes where they were generated [24–26].
Hence our data further support the hypothesis that in IgAN there is a mucosal hyperresponsiveness to the pathogens and commensal bacteria of the intestinal tract. Such mucosal hyperresponsiveness in genetically predisposed subjects results in an abnormal production of Gd-IgA, which spills over into the bloodstream, ultimately depositing as immune complexes in the kidney. Interestingly, the intestinal IgA+ memory B cells were significantly increased in IgAN patients but not in patients with non-IgA glomerulonephritis, thus strengthening our hypothesis. Further experimental confirmation of this hypothesis derives from our data on PBs.
We found that IgAN patients had high levels of total PBs, IgA+ PBs and CCR9+ integrin β7+ PBs. Moreover, levels of CCR9+ integrin β7+ IgA+ PBs tended to be higher compared with HSs and controls. Considering that the studied PBs represent the precursors of IgA-secreting plasma cells and that their differentiation derives from the isotype switch towards IgA occurring in GALT in response to TLR activation by mucosal antigens, higher CCR9+ integrin β7+ IgA+ PB levels in IgAN corroborate the hypothesis of amplified mucosal production of secretory IgA due to a dysregulation of the intestinal immune network.
Indeed, in this microenvironment, intestinal B cells make the class switch from IgM to IgA1. Furthermore, the production of IgA by intestinal plasma cells is also increased by the selective properties of intestinal homing of IgA-producing cells that are present in large numbers in GALT and mesenteric lymph nodes. Data on higher levels of intestinal B cells and PBs in IgAN patients are supported from our study and others showing high levels of BAFF in IgAN subjects. Also, APRIL is involved in TI generation of IgA-secreting plasma cells [27–29] and was highly increased in the serum of our IgAN patients compared with non-IgAN controls. BAFF and APRIL are members of the TNF family and their main function is to support the survival and class switching of B cells [30, 31] (Figure 7). Moreover, we previously found a different profile both in the composition of the faecal microbiota and in the metabolomic profile between IgAN patients and HSs [9] and several genome-wide association studies have shown an association with genetic risk loci involved in the maintenance of the intestinal epithelial barrier and in the response of MALT to intestinal pathogens [3, 32]. The correlation of elevated BAFF levels with specific faecal metabolites of IgAN patients, especially with phenols, further highlights these relationships. Individuals consuming high-beef diets had increased populations of phenol-producing anaerobic Bacteroides compared with individuals on vegetarian diets [33, 34]. Toxicity of phenol to the lumen was demonstrated by showing increased permeability and reduced barrier function in a human colon carcinoma cell line (Caco-2) treated with phenol at concentrations detected in faecal samples [35, 36]. An increase in cell permeability begins to occur at very low phenol concentrations, leading to a decrease in cell viability, which could be a consequence of prolonged, increased passage of solutes into cells [36, 37]. Increased intestinal permeability and small bowel inflammation, despite normal morphology, was observed in IgAN patients [38]. It is thus conceivable that a defective immune tolerance might favour an abnormal response to microbiota, with alteration of the intestinal barrier, increased antigen absorption and subclinical intestinal inflammation [39]. However, our results cannot distinguish between the rate of BAFF and APRIL secretion by gut-derived PBs and that secreted by total plasmabasts. This is a key point in understanding the complex IgAN pathogenesis, as it may also have therapeutic implications. Any treatment that is focused in the bone marrow and the kidney and not in the gut could be partial, and vice versa. Further studies will be needed to address this point. Moreover, we analysed only Caucasian patients, but in other in ethnicities the results, depending on diet, may vary.
In conclusion, the results of our study show for the first time a significant difference in the amount of intestinal-activated B lymphocytes in IgAN patients, confirming the hypothesis of the pathogenic role of intestinal mucosal hyperresponsiveness in IgAN. The intestinal–renal axis plays a crucial role in Berger’s glomerulonephritis, in which several factors (e.g. genetics [27, 40, 41], pathogens [32, 39, 42] and food antigens [43, 44]) may contribute to the complex pathogenesis and provide important areas to seek novel targeted therapies to modulate the progression of the disease.
SUPPLEMENTARY DATA
Supplementary data are available at ndt online.
FUNDING
This work was supported by grants from the Italian Ministry of Education, University and Research, PON 2014-2020 BIOMIS - Costituzione della biobanca del microbiota intestinale e salivare umano: dalla disbiosi alla simbiosi, Cod. ARS01_01220.
AUTHORS’ CONTRIBUTIONS
F.S., C.C. and F.P. planned the research, coordinated the study, designed and performed most experiments, analysed the data and drafted the manuscript. N.C. carried out the FACS experiments and assisted in manuscript preparation. G.F., G.L., A.P., C.D. and V.D.L. participated in the design of the study and assisted in in vitro experiments. M.D.A. performed correlation between serum BAFF levels with faecal concentrations. S.B.M., R.C.M. and L.M. participated in the coordination of the study and assisted in manuscript preparation. A.G. and L.G. designed and supervised the research and drafted the manuscript. All authors read and approved the final manuscript.
CONFLICT OF INTEREST STATEMENT
The authors declare that there are no conflicts of interest regarding the publication of this article. The results presented in this article have not been published previously in whole or part, except in abstract format.
Supplementary Material
REFERENCES
- 1.Floege J, Feehally J. The mucosa–kidney axis in IgA nephropathy. Nat Rev Nephrol 2016; 12: 147–156 [DOI] [PubMed] [Google Scholar]
- 2.Belkaid Y, Hand TW. Role of the microbiota in immunity and inflammation. Cell 2014; 157: 121–141 [DOI] [PMC free article] [PubMed] [Google Scholar]
- 3.Magistroni R, D’Agati VD, Appel GB et al. New developments in the genetics, pathogenesis, and therapy of IgA nephropathy. Kidney Int 2015; 88: 974–989 [DOI] [PMC free article] [PubMed] [Google Scholar]
- 4.Cerutti A. The regulation of IgA class switching. Nat Rev Immunol 2008; 8: 421–434 [DOI] [PMC free article] [PubMed] [Google Scholar]
- 5.Jung Y, Wen T, Mingler MK et al. IL-1β in eosinophil-mediated small intestinal homeostasis and IgA production. Mucosal Immunol 2015; 8: 930–942 [DOI] [PMC free article] [PubMed] [Google Scholar]
- 6.Zheng N, Wang D, Ming H et al. BAFF promotes proliferation of human mesangial cells through interaction with BAFF-R. BMC Nephrol 2015; 16: 72. [DOI] [PMC free article] [PubMed] [Google Scholar]
- 7.McCarthy DD, Kujawa J, Wilson C et al. Mice overexpressing BAFF develop a commensal flora-dependent, IgA-associated nephropathy. J Clin Invest 2011; 121: 3991–4002 [DOI] [PMC free article] [PubMed] [Google Scholar]
- 8.Xin G, Shi W, Xu LX et al. Serum BAFF is elevated in patients with IgA nephropathy and associated with clinical and histopathological features. J Nephrol 2013; 26: 683–690 [DOI] [PubMed] [Google Scholar]
- 9.De Angelis M, Montemurno E, Piccolo M et al. Microbiota and metabolome associated with immunoglobulin A nephropathy (IgAN). PLoS One 2014; 9: e99006. [DOI] [PMC free article] [PubMed] [Google Scholar]
- 10.Serino G, Sallustio F, Cox SN et al. Abnormal miR-148b expression promotes aberrant glycosylation of IgA1 in IgA nephropathy. J Am Soc Nephrol 2012; 23: 814–824 [DOI] [PMC free article] [PubMed] [Google Scholar]
- 11.Moldoveanu Z, Wyatt RJ, Lee JY et al. Patients with IgA nephropathy have increased serum galactose-deficient IgA1 levels. Kidney Int 2007; 71: 1148–1154 [DOI] [PubMed] [Google Scholar]
- 12.Moore JS, Kulhavy R, Tomana M et al. Reactivities of N-acetylgalactosamine-specific lectins with human IgA1 proteins. Mol Immunol 2007; 44: 2598–2604 [DOI] [PMC free article] [PubMed] [Google Scholar]
- 13.Serino G, Pesce F, Sallustio F et al. In a retrospective international study, circulating MIR-148b and let-7b were found to be serum markers for detecting primary IgA nephropathy. Kidney Int 2016; 89: 683–692 [DOI] [PubMed] [Google Scholar]
- 14.Shang L, Fukata M, Thirunarayanan N et al. Toll-like receptor signaling in small intestinal epithelium promotes B-cell recruitment and IgA production in lamina propria. Gastroenterology 2008; 135: 529–538 [DOI] [PMC free article] [PubMed] [Google Scholar]
- 15.Serino G, Sallustio F, Curci C et al. Role of let-7b in the regulation of N-acetylgalactosaminyltransferase 2 in IgA nephropathy. Nephrol Dial Transplant 2015; 30: 1132–1139 [DOI] [PubMed] [Google Scholar]
- 16.Rosser EC, Mauri C. Regulatory B cells: origin, phenotype, and function. Immunity 2015; 42: 607–612 [DOI] [PubMed] [Google Scholar]
- 17.Wu HJ, Ivanov II, Darce J et al. Gut-residing segmented filamentous bacteria drive autoimmune arthritis via T helper 17 cells. Immunity 2010; 32: 815–827 [DOI] [PMC free article] [PubMed] [Google Scholar]
- 18.Suzuki H, Kiryluk K, Novak J et al. The pathophysiology of IgA nephropathy. J Am Soc Nephrol 2011; 22: 1795–1803 [DOI] [PMC free article] [PubMed] [Google Scholar]
- 19.Coppo R. The gut–kidney axis in IgA nephropathy: role of microbiota and diet on genetic predisposition. Pediatr Nephrol 2018; 33: 53–61 [DOI] [PubMed] [Google Scholar]
- 20.Gharavi AG, Moldoveanu Z, Wyatt RJ et al. Aberrant IgA1 glycosylation is inherited in familial and sporadic IgA nephropathy. J Am Soc Nephrol 2008; 19: 1008–1014 [DOI] [PMC free article] [PubMed] [Google Scholar]
- 21.Kiryluk K, Moldoveanu Z, Sanders JT et al. Aberrant glycosylation of IgA1 is inherited in both pediatric IgA nephropathy and Henoch-Schönlein purpura nephritis. Kidney Int 2011; 80: 79–87 [DOI] [PMC free article] [PubMed] [Google Scholar]
- 22.Pabst O, Slack E. IgA and the intestinal microbiota: the importance of being specific. Mucosal Immunol 2020; 13: 12–21 [DOI] [PMC free article] [PubMed] [Google Scholar]
- 23.Chemouny JM, Gleeson PJ, Abbad L et al. Modulation of the microbiota by oral antibiotics treats immunoglobulin A nephropathy in humanized mice. Nephrol Dial Transplant 2019; 34: 1135–1144 [DOI] [PubMed] [Google Scholar]
- 24.Weisel F, Shlomchik M. Memory B cells of mice and humans. Annu Rev Immunol 2017; 35: 255–284 [DOI] [PubMed] [Google Scholar]
- 25.Kugelberg E. B cell memory: making sense in humans. Nat Rev Immunol 2015; 15: 133–133 [DOI] [PubMed] [Google Scholar]
- 26.Kurosaki T, Kometani K, Ise W. Memory B cells. Nat Rev Immunol 2015; 15: 149–159 [DOI] [PubMed] [Google Scholar]
- 27.Castigli E, Scott S, Dedeoglu F et al. Impaired IgA class switching in APRIL-deficient mice. Proc Natl Acad Sci USA 2004; 101: 3903–3908 [DOI] [PMC free article] [PubMed] [Google Scholar]
- 28.Stein JV, López-Fraga M, Elustondo FA et al. APRIL modulates B and T cell immunity. J Clin Invest 2002; 109: 1587–1598 [DOI] [PMC free article] [PubMed] [Google Scholar]
- 29.He B, Xu W, Santini PA et al. Intestinal bacteria trigger T cell-independent immunoglobulin A2 class switching by inducing epithelial-cell secretion of the cytokine APRIL. Immunity 2007; 26: 812–826 [DOI] [PubMed] [Google Scholar]
- 30.Mecklenbräuker I, Kalled SL, Leitges M et al. Regulation of B-cell survival by BAFF-dependent PKCδ-mediated nuclear signalling. Nature 2004; 431: 456–461 [DOI] [PubMed] [Google Scholar]
- 31.Xin G, Cui Z, Su Y et al. Serum BAFF and APRIL might be associated with disease activity and kidney damage in patients with anti-glomerular basementmembrane disease. Nephrology 2013; 18: 209–214 [DOI] [PubMed] [Google Scholar]
- 32.Kiryluk K, Li Y, Scolari F et al. Discovery of new risk loci for IgA nephropathy implicates genes involved in immunity against intestinal pathogens. Nat Genet 2014; 46: 1187–1196 [DOI] [PMC free article] [PubMed] [Google Scholar]
- 33.Hentges DJ. Does diet influence human fecal microflora composition? Nutr Rev 2009; 38: 329–336 [DOI] [PubMed] [Google Scholar]
- 34.McDonald TA, Holland NT, Skibola C et al. Hypothesis: phenol and hydroquinone derived mainly from diet and gastrointestinal flora activity are causal factors in leukemia. Leukemia 2001; 15: 10–20 [DOI] [PubMed] [Google Scholar]
- 35.Hughes R, Kurth MJ, McGilligan V et al. Effect of colonic bacterial metabolites on caco-2 cell paracellular permeability in vitro. Nutr Cancer 2008; 60: 259–266 [DOI] [PubMed] [Google Scholar]
- 36.Nyangale EP, Mottram DS, Gibson GR. Gut microbial activity, implications for health and disease: the potential role of metabolite analysis. J Proteome Res 2012; 11: 5573–5585 [DOI] [PubMed] [Google Scholar]
- 37.Pedersen G, Brynskov J, Saermark T. Phenol toxicity and conjugation in human colonic epithelial cells. Scand J Gastroenterol 2002; 37: 74–79 [DOI] [PubMed] [Google Scholar]
- 38.Rostoker G, Wirquin V, Terzidis H et al. Mucosal immunity in primary glomerulonephritis. III. Study of intestinal permeability. Nephron 1993; 63: 286–290 [DOI] [PubMed] [Google Scholar]
- 39.Coppo R. The intestine-renal connection in IgA nephropathy. Nephrol Dial Transplant 2015; 30: 360–366 [DOI] [PubMed] [Google Scholar]
- 40.Osman W, Okada Y, Kamatani Y et al. Association of common variants in TNFRSF13B, TNFSF13, and ANXA3 with serum levels of non-albumin protein and immunoglobulin isotypes in Japanese. PLoS One 2012; 7: e32683. [DOI] [PMC free article] [PubMed] [Google Scholar]
- 41.Sallustio F, Cox SN, Serino G et al. Genome-wide scan identifies a copy number variable region at 3p21.1 that influences the TLR9 expression levels in IgA nephropathy patients. Eur J Hum Genet 2015; 23: 940–948 [DOI] [PMC free article] [PubMed] [Google Scholar]
- 42.Yamanaka T, Tsukaguchi H, Narita I et al. Toll-like receptor 9 affects severity of IgA nephropathy. J Am Soc Nephrol 2008; 19: 2384–2395 [DOI] [PMC free article] [PubMed] [Google Scholar]
- 43.Papista C, Lechner S, Ben Mkaddem S et al. Gluten exacerbates IgA nephropathy in humanized mice through gliadin-CD89 interaction. Kidney Int 2015; 88: 276–285 [DOI] [PubMed] [Google Scholar]
- 44.Smerud HK, Fellström B, Hällgren R et al. Gluten sensitivity in patients with IgA nephropathy. Nephrol Dial Transplant 2009; 24: 2476–2481 [DOI] [PubMed] [Google Scholar]
Associated Data
This section collects any data citations, data availability statements, or supplementary materials included in this article.


