Abstract
This research work explored the synthesis and characterization of magnetic manganese ferrites using a simple combustion method. The purpose of creating the magnetic manganese ferrites was for their planned use as ozonation catalysts. Their magnetic properties allow for their recovery from the treatment system. Magnetic manganese ferrites were prepared by mixing manganese nitrate and iron nitrate in a stoichiometric ratio of 1:2. Polyvinyl alcohol was added to the mixed metal salt solution and the ratio of PVA: total nitrate salt added was varied from 1:1 up to 1:2 by weight. The resulting particles were characterized by X-ray diffraction (XRD), X-ray photoelectron spectroscopy (XPS), scanning electron microscope (SEM), tunneling electron microscope (TEM), and Ultraviolet–Visible spectroscopy (UV/Vis).
Keywords: Synthesis, Magnetic particles, Water treatment
1. Introduction
Manganese ferrite particles are of interest because of their large surface to volume ratio and their many uses in the areas of biosensors [1], electronics [2], and pharmaceutical delivery [3]. Because the structural characteristics of manganese ferrite particles are controlled by their synthesis approach, different preparation methods have been explored. Reported synthesis methods include ceramic, co-precipitation, sol-gel, spray drying, freeze drying, and high temperature and pressure hydrothermal methods [4–7]. In the ceramic method, metal oxides are mixed by mechanical milling. This method does not yield fine particles and results in a wide distribution of particle sizes. Also, significant impurities are introduced due to the process of milling. Co-precipitation methods result in creating particles that are homogeneous, have defined stoichiometry, and a narrow distribution of particle size. Sol-gel techniques control particle size and size-distribution, but also help to control the shape of the particle. Spray-drying involves precipitation of concentrated cation solution by solvent evaporation, whereas in free-drying the concentrated solution is atomized into fine droplets [8]. Hydrothermal methods are very promising methods to create manganese ferrites where particles are made from much smaller particles, such as clusters, molecules, ions, and atoms [9].
Manganese ferrite belongs to the class of ferrospinel, which are represented by the general formula AB2O4. Manganese ferrites also occur naturally as jacobsite. Different electrical, magnetic, and catalytic properties of ferrospinels are governed by the distribution of metals between the octahedral and tetrahedral sites. Manganese-based ferrospinels show interesting catalytic properties in the oxidative dehydrogenation of hydrocarbons [10], oxidative gas phase CO oxidation [11], decomposition of peroxides [12], and oxidation of alkenes [13].
The purpose of this research was to synthesize and characterize manganese ferrite using a novel combustion method. This paper reports on the developed synthesis method involved mixing Mn and Fe salts with PVA followed by calcination. Polyvinyl alcohol (PVA) has been utilized as an efficient fuel for synthesis of manganese ferrite [14]. Characterization of the created manganese ferrites is also reported. Finally, the application of these particles in dye removal as well as a catalyst during ozonation has also been depicted.
2. Methods and materials
2.1. Preparation of magnetic manganese ferrites
Magnetic manganese ferrite was prepared by mixing Mn(NO3)2 and Fe(NO3)3 in the stoichiometric ratio of 1:2 within a ceramic crucible. Poly-vinyl alcohol (PVA) was added to the mixture according to NO3:PVA ratios of 10:1; 5:1; 10:3; 2:1; 1:1; 1:1.5 and 1:2. The total weight of NO3 in each NO3:PVA composition was 10 g. Therefore, a prepared manganese ferrite with a label ‘MnFe2O4 PVA10’ refers to a composition prepared with 10 g of total nitrate salts, a Mn:Fe ratio of 1:2, and 10 g of added PVA. 100 mL DI water was added to dissolve the nitrate salts. The solution was allowed to stand for 8 h to ensure dissolution. 20 mL DI water was then added, and the solution was mixed. The mixture was fired in a muffle furnace at 773 K for 60 min. After 60 min the furnace was turned off and allowed to cool. Once the furnace cooled down, the crucible was removed, and the particles within the crucible were transferred into a 40 mL glass vial, capped, and stored at room temperature. Particles with different stoichiometric ratios of the two nitrate salts were also created by varying the Mn percentage.
2.2. Characterization of magnetic manganese ferrites
All prepared samples were characterized using X-Ray Diffraction (XRD), X-ray photoelectron spectroscopy (XPS), Scanning electron microscope (SEM), Tunnelling electron microscope (TEM), magnetic analysis, X-ray photoelectron spectroscopy (XPS), carbon analysis, pHzpc and BET surface area.
A PANalytical Xpert Pro theta-two theta diffractometer with Cu Kα radiation at 45 kV and 40 mA (λ = 1.5406 Å) was used to identify the crystal phase of the created manganese ferrites. XRD pattern analysis was performed using the Jade+ software (version 7, MDI, Inc., Livermore, CA) according to ASTM D934–80 and using ICDD reference patterns (2002 PDF-2 release, International Center for Diffraction Data, Newtown Square, PA). The Brunauer-Emmett-Teller (BET) surface area, porosity and pore size distribution of ferrite nanoparticles were measured using a Tristar 3000 BET surface analyzer (Micromeritics). The isoelectric point was determined with a zetasizer (3000HSA, Malvern).
A high-resolution transmission electron microscopy (HR-TEM, JEM-2010F, JEOL) with field emission-transmission gun at 200 kV was applied to analyze the morphology and crystallinity of the nanoparticles. The particles were dispersed in Milli-Q water using an ultrasonicator (2510R-DH, Bransonic) for more than 15 min and fixed on a carbon-coated copper grid (FCF400-Cu, EMS). Surface morphology of the ferrites was assessed using an environmental scanning electron microscope (ESEM, Philips XL 30 ESEM-FEG) at an accelerating voltage of 10–30 kV.
Magnetic measurements were performed using a Quantum Design SQUID magnetometer MPMS-XL in an applied field of 100 Oe in the 5–300 K temperature range. Magnetization data were measured at 300 K with the magnetic field varies from 0 to 7 T. Hysteresis were measured at 5 K with the magnetic field varies from 2 to −2 T. AC measurements were performed at 5 Oe oscillating magnetic field 5–300 K temperature range.
2.3. Proof-of-concept dye removal studies
A stock solution of 40 mg/L MB in DI water was used throughout the proof-of-concept experiments. Experiments were conducted in a 250 mL Erlenmeyer flask. 90 mL of DI water was placed in each flask and spiked with 10 mL of MB stock solution to achieve a 4 mg/L MB concentration in solution. 0.2 g of created manganese ferrite was added to each flask and reactions for individual manganese ferrite composition were completed in triplicate. Flasks containing DI water, MB, and manganese ferrite were sealed with parafilm and placed on a gyratory shaker. Multiple samples were pulled from each flask within two hours and observed for MB removal. Each withdrawn sample was immediately passed through a 0.2 μm Iso-Disc Teflon filter to ensure manganese ferrites were removed from solution to stop the reaction. Absorbance of each sample was measured using a UV-Spectrophotometer at a wavelength of 665 nm.
Based upon the resulting absorbance data, MB removal percentage within a reactor was calculated as:
where: t = reaction duration at the time of sample withdrawal and quenching; Ct = concentration of the dye solution at time t, and Co = the initial dye concentration (4 mg/L).
3. Results and discussion
3.1. X-ray diffraction
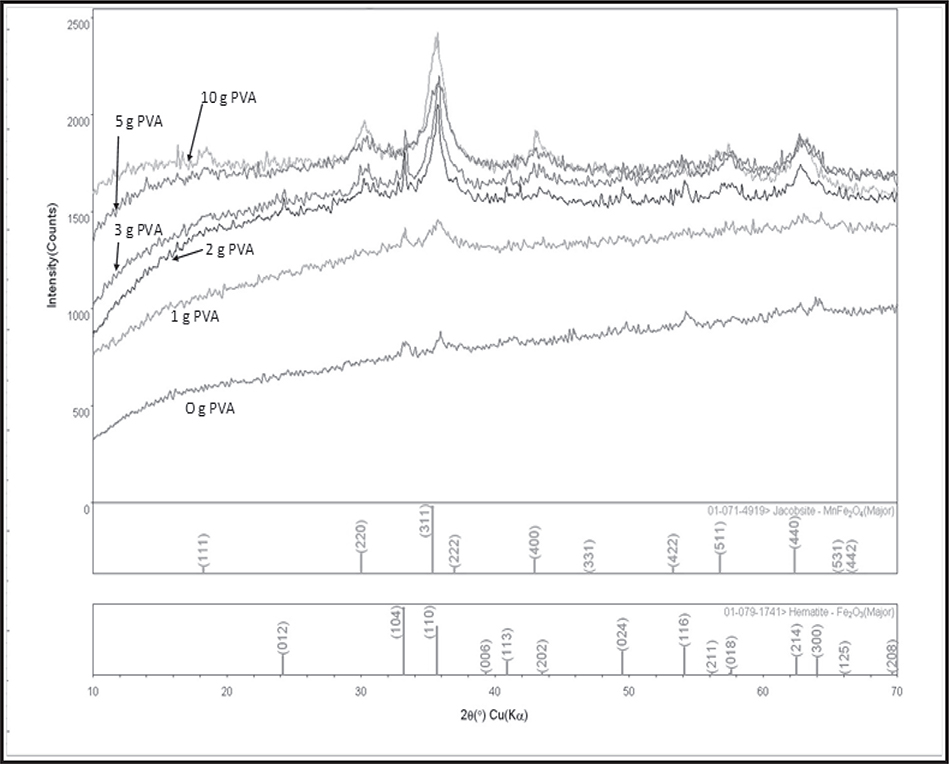
X-ray diffraction (Fig. 1) indicates that PVA was required to form pure manganese ferrite.
Fig. 1.
XRD Patterns at different PVA compositions.
PVA acts as fuel during synthesis helping to crystallize the manganese ferrite structure. At nitrates: PVA ratios above 1:1 peaks of a mixture of Fe2O3 and Mn-oxides were observed. Nitrates: PVA ratios below 1:1 resulted in complete conversion to MnFe2O4. Above this ratio (i.e., MnFe2O4 PVA10, MnFe2O4 PVA15 and MnFe2O4 PVA20), the XRD pattern observed matches Jacobsite. Observed peaks occur at 2θ = 30.195°, 35.543°, 43.217°, 53.60°, 57.067°, 62.665° and 71.15° which represent the Bragg reflections from the (2 2 0), (3 1 1), (4 0 0), (4 2 2), (5 1 1), (4 4 0) and (5 3 3) planes, respectively.
Carbon composition and BET surface areas of synthesized manganese ferrites
The carbon content analysis showed a slight increase in the percentage of carbon as PVA content increased. However, the carbon content was always less than 0.2% by weight.
| Catalyst | %Carbon | BET Area |
|---|---|---|
| MnFe2O4 10PVA | Non Detectable | 48.8 |
| MnFe2O4 15PVA | 0.14 | 57.4 |
| MnFe2O4 20PVA | 0.22 | 39.9 |
The BET surface area ranged from 46 m2/g to 58 m2/g depending upon the PVA amounts used during synthesis.
| Catalyst | BET Area (m2/g) |
|---|---|
| MnFe2O4 10PVA | 48.8 |
| MnFe2O4 15PVA | 57.4 |
| MnFe2O4 20PVA | 39.9 |
| Mn0.5Fe2.5O4 15PVA | 46.4 |
| Mn2.5Fe0.5O4 15PVA | 50.9 |
3.2. SEM-EDX analysis
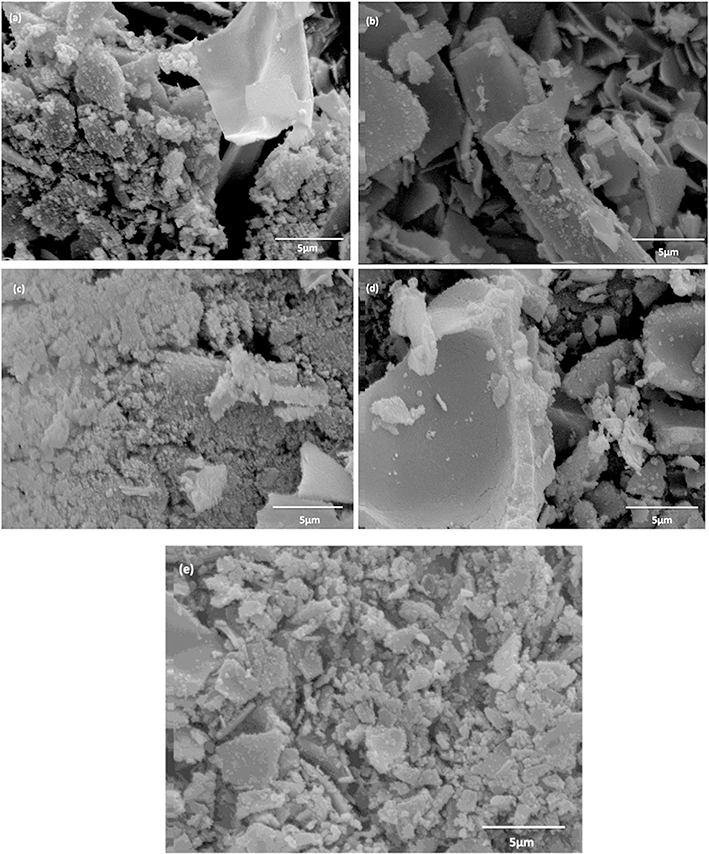
Fig. 2 shows the SEM images of (a) MnFe2O4 10PVA (b) MnFe2O4 15PVA (c) MnFe2O4 20PVA (d) Mn0.5Fe2.5O4 15PVA (e) Mn2.5Fe0.5O4. 15PVA. Prepared manganese ferrites were agglomerated and formed dense, flake-like structures ranging in size from nanometers to micrometers.
Fig. 2.
SEM images of prepared catalysts. The different catalyst images are (a) MnFe2O4 10PVA, (b) MnFe2O4 15PVA, (c) MnFe2O4 20PVA, (d) Mn0.5Fe2.5O4 15PVA, and (e) Mn2.5Fe0.5O4 15PVA. The formation of MnxFe3-xO4 was again confirmed with energy dispersive x-ray analysis (EDX) and the results showed that the peak heights of manganese and iron varied according to the different stoichiometric ratios used in their preparation as expected.
3.3. TEM analysis
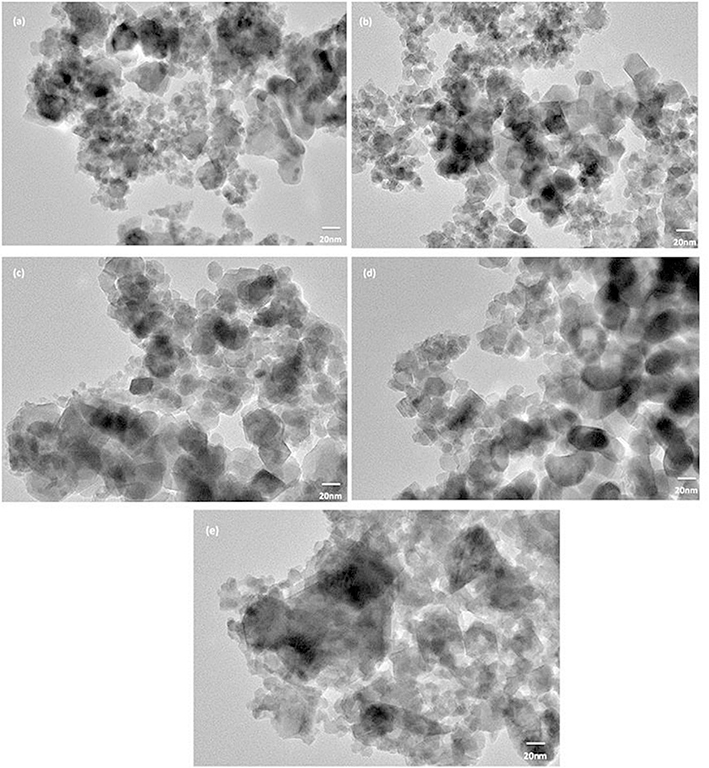
TEM was used to analyze the particle size and shape. TEM images of the catalysts produced for this study are shown in Fig. 3. While the catalysts were variable in shape and size, the majority were spherical in nature with size ranging from 20 to 100 nm.
Fig. 3.
TEM images of prepared catalysts. The different catalysts shown are (a) MnFe2O4 10PVA, (b) MnFe2O4 15PVA, (c) MnFe2O4 20PVA, (d) Mn0.5Fe2.5O4 15PVA, and (e) Mn2.5Fe0.5O4 15PVA.
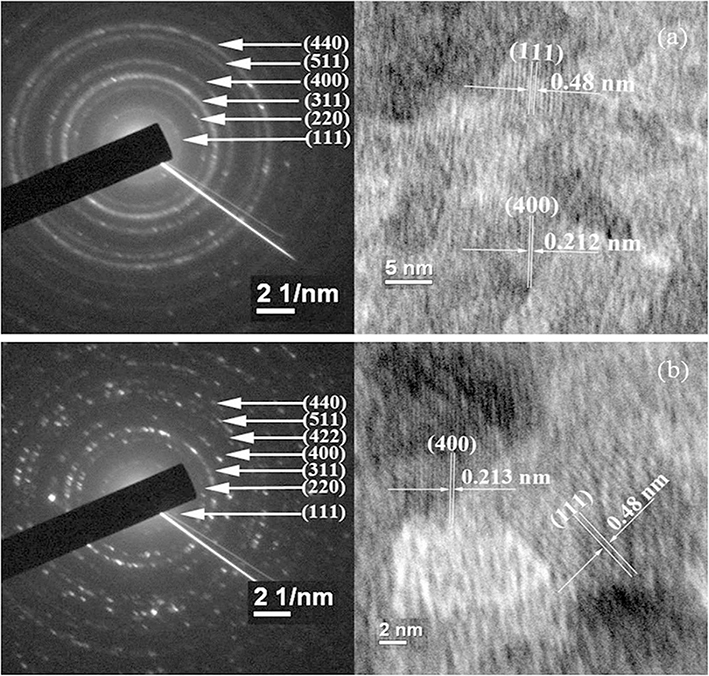
For both MnFe2O4 PVA10 and MnFe2O4 PVA15 samples, diffraction patterns of (1 1 1), (2 2 0), (3 1 1), (4 0 0), (4 1 1), and (4 4 0) plane for MnFe2O4 were observed by selected area electron diffraction (SAED) analysis. Therefore, the formation of magnetic MnFe2O4 nanoparticles is confirmed [15]. The lattice spacing of the synthesized materials was investigated with HR-TEM analysis (Fig. 4). The measured lattice spacing was 0.48 nm for (1 1 1) plane and 0.212 nm for (4 0 0) plane of MnFe2O4 PVA15 which provides another confirmation of the SAED analysis findings [16].
Fig. 4.
HR-TEM and diffraction pattern of catalysts. The two catalysts shown are (a) MnFe2O4 10PVA, (b) MnFe2O4 15PVA.
3.4. X-ray photoelectron spectroscopy
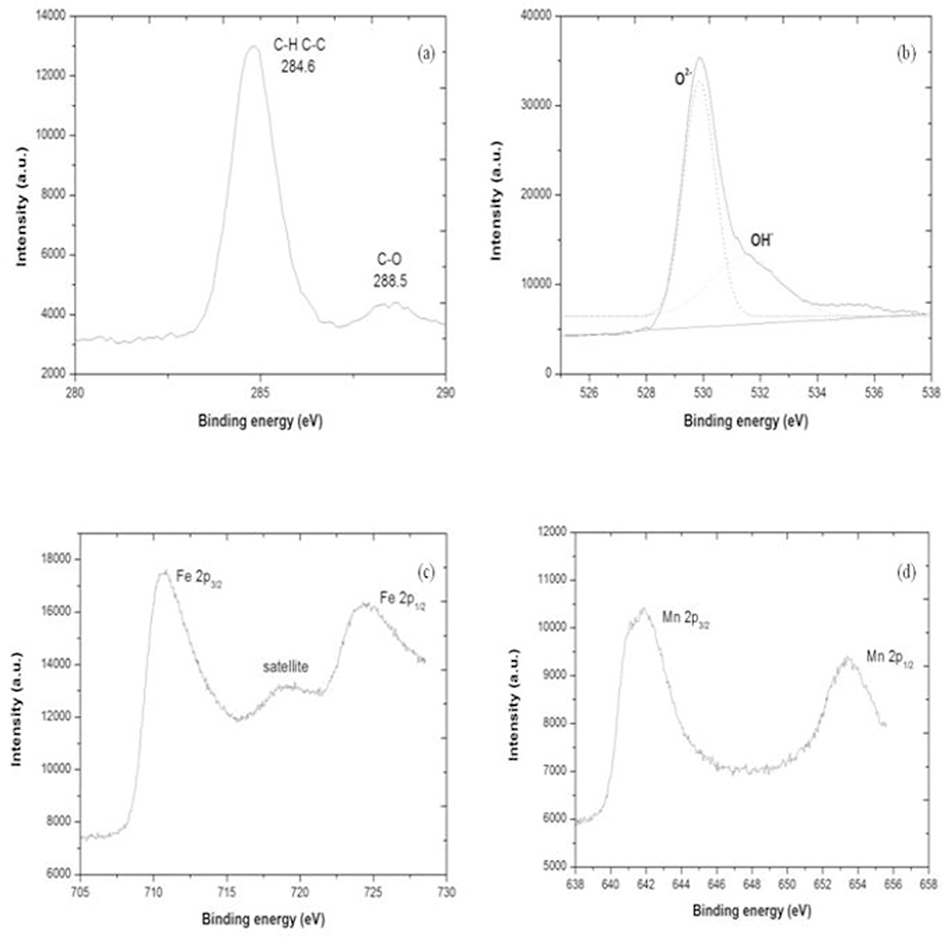
The presented results are characteristic of the XPS analysis observed for all samples. Fig. 5 shows the XPS spectra for a representative sample of MnFe2O4 PVA15 catalyst. Two main peaks appeared at 284.6 and 288.5 eV for C–C/C–H bonds and C–O bonds, respectively [17]. Figs. 2–5(b) shows two peaks of the O1s spectra at 529.9 and 531.5 eV corresponding to O2– and OH–, respectively. For MnFe2O4 PVA10, three peaks of the O1 spectra at 529.7, 530.5, and 532.5 eV were observed which indicate the binding energies of O2–, O–, and O22–, respectively [18].
Fig. 5.
XPS analysis of MnFe2O4 15PVA catalyst. The peaks for 4 different elements shown are a) C(1s), b) O(1s), c) Fe(2p), and d) Mn(2p).
The peak of Fe (2p3/2) at 710.5 eV was observed for all samples. The satellite peak between Fe(2p3/2) (710.9 eV) and Fe(2p1/2) (724.8 eV), indicates Fe2O3 [19]. The Mn (2p3/2) peak was observed for all samples around 641.7 eV of Mn3+ spectrum [20]. The Fe(2p) and Mn(2p) spectra in Figs. 2–4 show defined peaks associated with the MnFe2O4 formation. The Fe(2p3/2) and Fe(2p1/2) binding energies appear at 711.9 eV and 725.1 eV in the XPS spectra, respectively. Furthermore, the Mn(2p3/2) and Mn(2p1/2) binding energies appear at 641.7 eV and 654.0 eV, respectively. These results are consistent with those in a previous study [21] and support the MnFe2O4 formulation. Furthermore, the presence of both Mn and Fe in the nanoparticles is confirmed by the results from energy dispersive X-ray (EDX) analysis.
3.5. Magnetic analysis
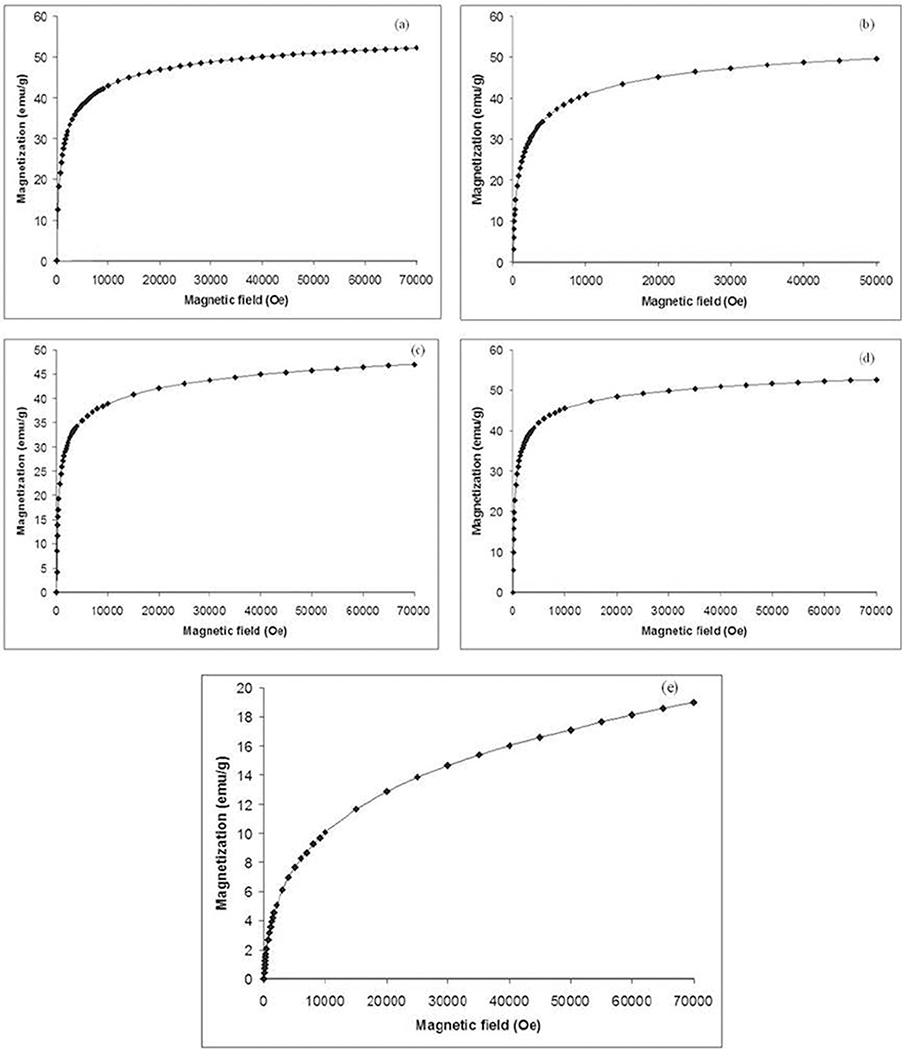
The plot of magnetization versus field at T = 300 K shown in Fig. 6 reveals superparamagnetism for all the particles.
Fig. 6.
Magnetization versus magnetic field (Oe) at T = 300 K. The different catalysts shown are (a) MnFe2O4 10PVA, (b) MnFe2O4 15PVA, (c) MnFe2O4 20PVA, (d) Mn0.5Fe2.5O4 15PVA, and (e) Mn2.5Fe0.5O4 15PVA.
The saturation magnetization values (Table 1) show that the values for most particles range between 46 and 52 emu/g except the Mn2.5Fe0.5O4 15PVA composition which shows lower saturation magnetization (19.6 emu/g). This indicates a lower concentration of metal ion in this catalyst than in previous ones.
Table 1.
Saturation Magnetization.
| Catalyst | Saturation |
|---|---|
| MnFe2O4 10PVA | 52 |
| MnFe2O4 15PVA | 49.6 |
| MnFe2O4 20PVA | 46.9 |
| Mn0.5Fe2.5O4 15PVA | 52 |
| Mn2.5Fe2.5O4 10PVA | 19.6 |
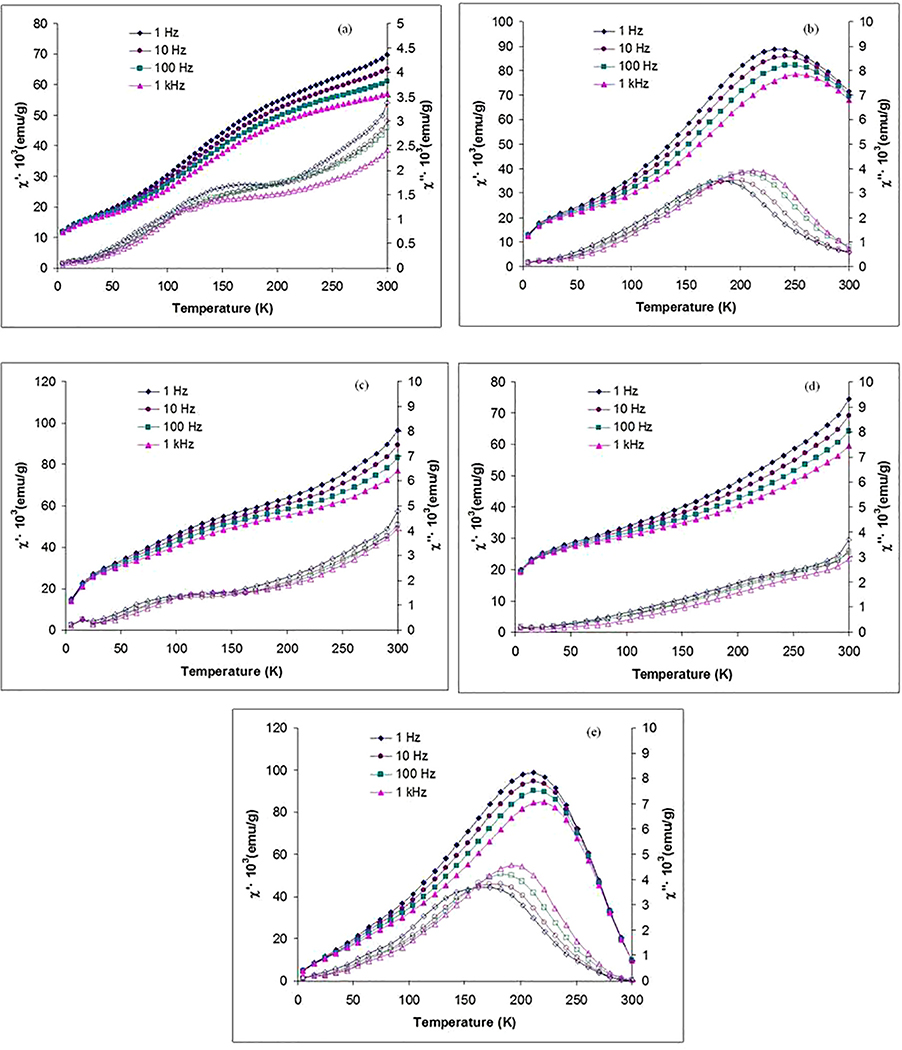
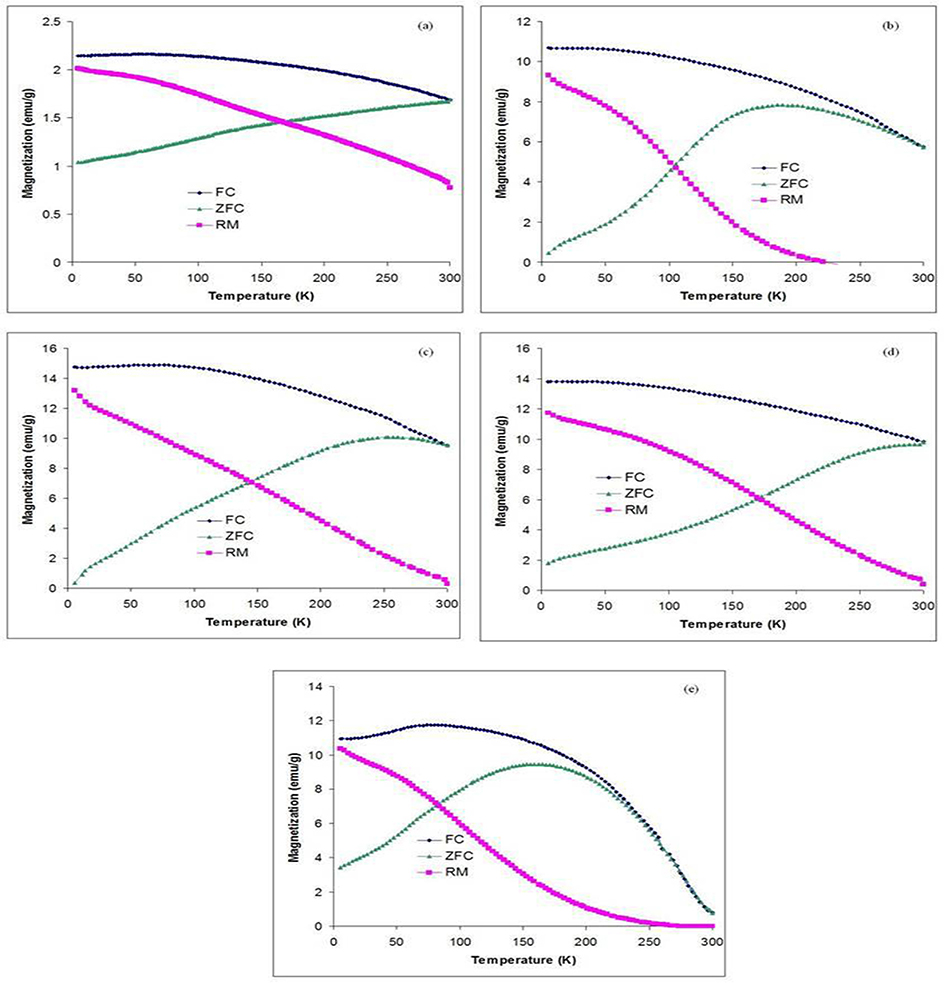
The AC magnetic measurement in which an AC field is applied to a sample and the resulting AC moment is measured indicates the presence of two types of nanoparticle for the MnFe2O4 10PVA sample with blocking temperature 150 K and over 300 K (Figs. 2–7). This is visible from the temperature dependent AC susceptibility which shows a peak at about 150 K and the continual increase of χ′′ (an imaginary component of AC magnetic susceptibility) over 300 K (Fig. 7).
Fig. 7.
Temperature dependence of the real v0 (full symbols) and imaginary v00 (open symbols) components of the AC susceptibility with oscillating field of 5 Oe at different frequencies. The different catalyst shown are (a) MnFe2O4 10PVA, (b) MnFe2O4 15PVA, (c) MnFe2O4 20PVA, (d) Mn0.5Fe2.5O4 15PVA, (e) Mn2.5Fe0.5O4 15PVA Non-zero remnant magnetization and non-superposition of field-cooling (FC) and zero field-cooling (ZFC) curves also indicate the existence of nanoparticles with blocking temperature over 300 K (Figs. 3–10).
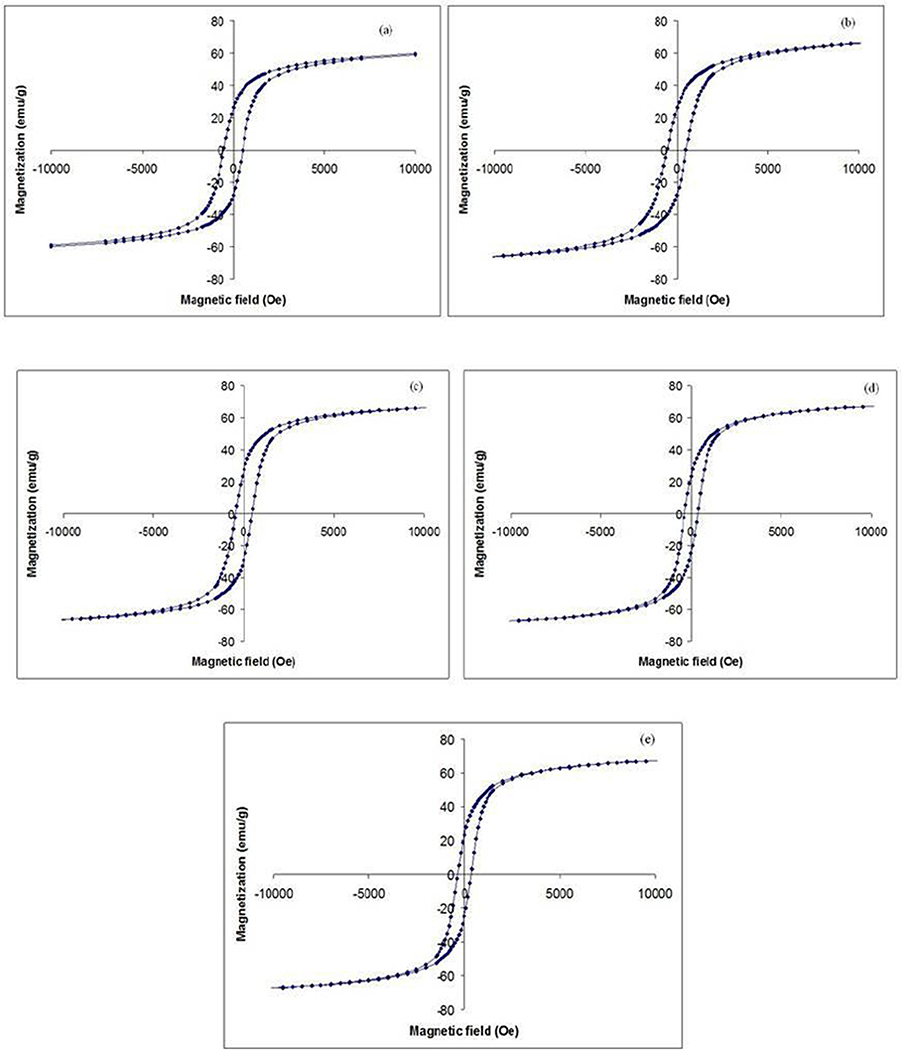
No hysteresis has been found at 300 K for the catalysts. Such behavior is attributed to the formation of ferro/ferri-magnetic nanoparticles. The MnFe2O4 10PVA catalyst shows a hysteresis at 5 K with coercive field 520 Oersted (Oe) (Figs. 7–9).
Fig. 9.
Hysteresis at 5 K of the prepared catalysts. The different catalyst shown are (a) MnFe2O4 10PVA, (b) MnFe2O4 15PVA, (c) MnFe2O4 20PVA, (d) Mn0.5Fe2.5O4 15PVA, and (e) Mn2.5Fe0.5O4 15PVA. The Mn2.5Fe0.5O4 15PVA particles contain one type of nanoparticles with blocking temperature at about 200 K. This is clearly visible from the peak at about 200 K on temperature-dependent AC susceptibility and around maximum on ZFC curve. The sample shows a hysteresis at 5 K with coercive field 400 Oe.
According to AC measurements of the MnFe2O4 15PVA samples, the data indicates that it contains one type of nanoparticles with blocking temperature at about 200 K. This is clearly visible from the peak at about 200 K on temperature-dependent AC susceptibility plot and a maximum on ZFC curve. The sample also shows a hysteresis at 5 K with coercive field 520 Oe.
The AC measurements of the MnFe2O4 20PVA catalyst indicates that it contains three types of nanoparticles with blocking temperature 10 K, 100 K and over 300 K. This is visible as two peaks at about 10 and 100 K on temperature dependent AC susceptibility and the continual increase of χ′′ over 300 K. Non-zero remnant magnetization and non-superposition of FC and ZFC curves also indicate the existence of nanoparticles with blocking temperature over 300 K. The sample shows a hysteresis at 5 K with coercive field 500 Oe.
The Mn0.5Fe2.5O4 15PVA contains one type of nanoparticles with blocking temperature over 300 K. There is no peak observed on the temperature dependent AC susceptibility, but just a continual increase of χ′′ over 300 K. Non-zero remnant magnetization and non-superposition of FC and ZFC curves also indicate the existence of nanoparticles with blocking temperature over 300 K. The sample shows a hysteresis at 5 K with coercive field 400 Oe.
3.6. Proof-of-concept MB dye removal
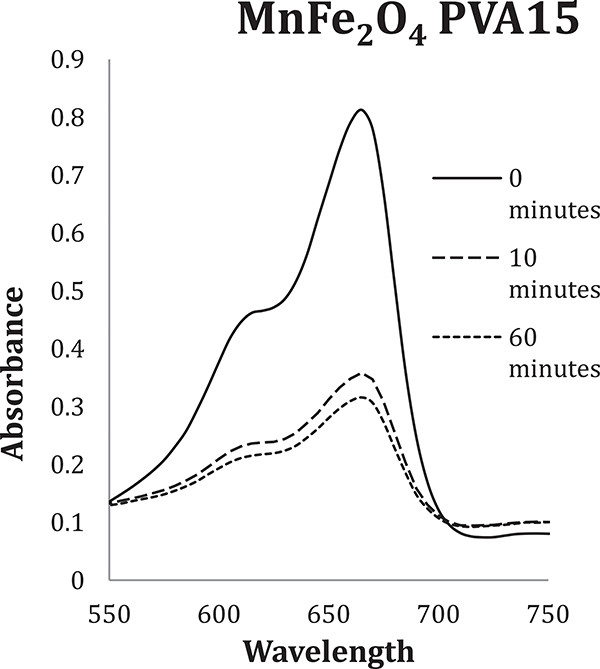
MB was removed from each reactor when manganese ferrite was present. Fig. 10 presents a characteristic absorbance spectrum observed when MB is reacted with MnFe2O4 PVA15. The absorbance caused by MB within samples decreased as a function of reaction time in all cases. MB removal observed within the reactors was greater than 90% within one hour. The magnetic MnFe2O4 PVA15 catalyst showed better reactivity within 1 h of reaction as compared with previous reports on the removal of MB dye [22–24].
Fig. 10.
Typical removal pattern for MB in the presence of prepared manganese ferrites observed as a decrease of absorbance within reactor samples.
4. Conclusions
A simple combustion method was developed and verified to create magnetic manganese ferrite. It was clear that only above total nitrates: PVA ratios of 1:1, a total conversion of particles to manganese ferrites is observed. Moreover, PVA is essential in making the particles magnetic. The created manganese ferrites were thoroughly characterized using XRD, SEM, TEM techniques. BET surface area, carbon content and, pHzpc of the particles were also determined. The magnetic property of the prepared catalysts has been obtained by field dependent magnetization measurements. The particles were created for the purpose to create surfaces that could easily be separated within by a magnetic field when used within water and water treatment processes. The simplified combustion method used to make manganese ferrites results in the creation of reactive surfaces that offer a wide range of applications while being easily scalable.
5. Disclaimer
The U.S. Environmental Protection Agency, through its Office of Research and Development, funded and managed, or partially funded and collaborated in, the research described herein. It has been subjected to the Agency’s administrative review and has been approved for external publication. Any opinions expressed in this paper are those of the author(s) and do not necessarily reflect the views of the Agency. Therefore, no official endorsement should be inferred. Any mention of trade names or commercial products does not constitute endorsement or recommendation for use.
Fig. 8.
Temperature dependence of magnetization in the zero-field-cooling (ZFC) and field-cooling (FC) regime at a magnetic field of 100 Oe, and remnant magnetization measurements (RM) of the prepared catalyst. The different catalysts shown are (a) MnFe2O4 10PVA, (b) MnFe2O4 15PVA, (c) MnFe2O4 20PVA, (d) Mn0.5Fe2.5O4 15PVA, and (e) Mn2.5Fe0.5O4 15PVA.
6.
Declarations of interest
This research was supported in part by an appointment to the Research Participation Program for the U.S. Environmental Protection Agency, Office of Research and Development, administered by the Oak Ridge Institute for Science and Education through an interagency agreement between the U.S. Department of Energy and EPA.
References
- [1].Haun JB, Yoon T-J, Lee H, Weissleder R, Wiley Interdisciplinary Rev.: Nanomed. Nanobiotechnol 2 (2010) 291–304. [DOI] [PubMed] [Google Scholar]
- [2].Ahmed S, Ogale S, Papaefthymiou G, Ramesh R, Kofinas P, Appl. Phys. Lett 80 (2002) 1616–1618. [Google Scholar]
- [3].Brigger I, Dubernet C, Couvreur P, Adv. Drug Deliv. Rev 64 (2012) 24–36. [DOI] [PubMed] [Google Scholar]
- [4].Goodarz Naseri M, Saion EB, Ahangar HA, Hashim M, Shaari AH, J. Magn. Magn. Mater 323 (2011) 1745–1749. [Google Scholar]
- [5].Amighian J, Mozaffari M, Nasr B, Phys. Status Solidi (c) 3 (2006) 3188–3192. [Google Scholar]
- [6].Li J, Yuan H, Li G, Liu Y, Leng J, J. Magn. Magn. Mater 322 (2010) 3396–3400. [Google Scholar]
- [7].Zhang D, Zhang X, Ni X, Song J, Zheng H, Chem. Phys. Lett 426 (2006) 120–123. [Google Scholar]
- [8].Nishamol K, Cochin University of Science and Technology (2002). [Google Scholar]
- [9].Rozman M, Drofenik M, J. Am. Ceram. Soc 78 (1995) 2449–2455. [Google Scholar]
- [10].United States Pat. (1975).
- [11].Oliveira LCA, Lago RM, Rios RVRA, Augusti R, Sousa PP, Mussel WN, Fabris JD, in: Avelino Corma FVMSM, José Luis GF (Eds.), Studies in Surface Science and Catalysis, Elsevier, 2010, pp. 2165–2170. [Google Scholar]
- [12].Lahiri P, Sengupta S, J. Chem. Soc., Faraday Trans 91 (1995) 3489–3494. [Google Scholar]
- [13].Menini L, Pereira MC, Parreira LA, Fabris JD, Gusevskaya EV, Catal J. 254 (2008) 355–364. [Google Scholar]
- [14].Thorat ND, Shinde KP, Pawar SH, Barick KC, Betty CA, Ningthouja RS, Dalton Trans. 41 (2012) 3060–3071. [DOI] [PubMed] [Google Scholar]
- [15].Mohapatra J, Mitra A, Bahadur D, Aslam M, CrystEngComm 15 (2013) 524–532. [Google Scholar]
- [16].Zeng H, Rice PM, Wang SX, Sun S, J. Am. Chem. Soc 126 (2004) 11458–11459. [DOI] [PubMed] [Google Scholar]
- [17].Liu G, Han C, Pelaez M, Zhu D, Liao S, Likodimos V, Ioannidis N, Kontos AG, Falaras P, Dunlop PS, Nanotechnology 23 (2012) 294003. [DOI] [PubMed] [Google Scholar]
- [18].Phani A, Manorama S, Rao V, J. Phys. Chem. Solids 61 (2000) 985–993. [Google Scholar]
- [19].Yamashita T, Hayes P, Appl. Surf. Sci 254 (2008) 2441–2449. [Google Scholar]
- [20].Nesbitt H, Banerjee D, Am. Mineral 83 (1998) 305–315. [Google Scholar]
- [21].Hu J, Lo IM, Chen G, Langmuir 21 (2005) 11173–11179. [DOI] [PubMed] [Google Scholar]
- [22].Dawood S, Sen TK, Phan C, Desalin. Water Treat 57 (2016) 28964–28980. [Google Scholar]
- [23].Tju H, Shabrany H, Taufik A, Saleh R, AIP Conf. Proc 1862 (2017) 030037. [Google Scholar]
- [24].Yang C, Dong W, Cui G, Zhao Y, Shi X, Xia X, Tang B, Wang W, Sci. Rep 7 (2017) 3973. [DOI] [PMC free article] [PubMed] [Google Scholar]


