Abstract
Read-across approaches continue to evolve as does their utility in the field of risk assessment. Previously we presented our generalised read-across (GenRA) approach (Shah et al., 2016), which utilises chemical descriptor and/or in vitro bioactivity data to make read-across predictions on the basis of the similarity weighted average of nearest neighbours. The current public version of GenRA predicts 574 apical outcomes as a binary call from repeat dose toxicity studies available in ToxRefDB (Helman et al., 2019). Here we investigated the application of GenRA to quantitative values, specifically using a large dataset of rat oral acute LD50 toxicity data (LD50 values for 7011 discrete chemicals) that had been collected under the auspices of the ICCVAM acute toxicity workgroup (ATWG). GenRA LD50 predictions were made based on the following criteria – chemicals were characterised by Morgan chemical fingerprints with a minimum similarity threshold of 0.5 and a maximum of 10 nearest neighbours over the entire dataset. An R2 value of 0.61 and RMSE of 0.58 was achieved based on these parameters. Monte Carlo cross validation was then used to estimate confidence in the R2. Cross validated R2 values were found to fall in the range of 0.47 to 0.62. However, when evaluating GenRA locally to clusters of mechanistically or structurally-similar chemicals, average R2 values improved up to 0.91. GenRA can be extended to make reasonable quantitative predictions of acute oral rodent toxicity with improved performance exhibited for specific local domains.
Keywords: Generalized read-across (GenRA), acute oral toxicity, quantitative predictions
1. Introduction
Analogue and category approaches have been in use in chemical evaluation for the last 2 decades, but the application of read-across as a convenient and efficient data gap filling technique experienced significant momentum during the development of the EU’s REACH regulation [1]. The United States’ use of read-across in a regulatory context [2] has been primarily in the evaluation of pre-manufacturing notices (PMN), but interest in its application increased when amended TSCA legislation passed in 2016 [3]. Many thousands of chemicals lack data that would inform risk-based evaluation, and the idea that read-across approaches can add significant value in lieu of in vivo testing is finally being realised. One of the major challenges of evaluating large numbers of chemicals by read-across is that the approach is currently anchored in a subjective expert-driven domain and utilised on a chemical by chemical basis [4]. However, if read-across is to meet expectations of increasing efficiencies in chemical prioritisation and further assessment of risk, that is broadly applicable to the chemical inventories of interest to US Federal Agencies, a transition to an objective data-driven approach is needed. From a practical sense, this will entail characterising the uncertainties of the read-across predictions made and assessing performance relative to an established baseline. Over the last few years, automated data-driven approaches have started to gain traction with examples such as ToxRead [5] and Chemical-Biological Read-across (CBRA) [6]. Our approach, Generalised Read-across (GenRA) [7], builds upon the CBRA approach, relies on chemical structural and/or bioactivity information as characterised by fingerprints and uses a similarity index to derive a weighted average of ‘structurally similar’ analogues. GenRA was first developed to establish a baseline in read-across performance [7]. The GenRA approach has been described in the context in the current workflow of read-across [4, 8] and is implemented as a web-based module within the EPA CompTox Chemicals Dashboard (https://comptox.epa.gov/dashboard/; [9, 10]). Several papers describing the GenRA approach [7], its positioning relative to the overall workflow [2, 4, 10] and the evolution of the approach have since been published [11]. The objective of this study was to investigate how GenRA could be extended to make quantitative predictions of toxicity. For the purposes of this case study, a dataset of acute oral rat lethality data that had been collected as part of a collaborative effort between the US National Toxicology Program’s Interagency Center for the Evaluation of Alternative Toxicological Methods (NICEATM), the organisation coordinating ICCVAM and the National Center for Computational Toxicology (NCCT) under the auspices of the ICCVAM acute toxicity workgroup (ATWG) was used. This workgroup is charged with implementing the ICCVAM strategic plan [12] for acute toxicity which includes the development and evaluation of alternatives (including in silico models) that can be used to address regulatory needs of different US Federal Agencies [13], such as the requirements of the EPA’s ‘six pack’ toxicity tests that are conducted on pesticide products (https://ntp.niehs.nih.gov/pubhealth/evalatm/test-method-evaluations/acute-systemic-tox/index.html). This dataset also formed the basis of an international modelling project, organised under the guidance of the ATWG, which solicited modellers in the scientific community to develop models targeted towards US regulatory needs for acute toxicity [13, 14].
A number of QSAR models have been developed for the prediction of acute toxicity over several decades using a variety of different techniques such as multiple linear regression and support vector machines [15–17]. Some of these models have also been captured in expert systems such as TOPKAT [18], TEST [19] and OASIS acute oral toxicity (http://oasis-lmc.org/products/models/human-health-endpoints/acute-oral-toxicity.aspx). The reader is referred to reviews including Lapenna et al. [15], the National Academies Science (NAS) report [17] which provide an overview of the current status for modelling acute toxicity endpoints pre-dating the ATWG modelling project itself. Read-across models for acute toxicity have since been published including references [20, 21]. A comparison of the respective performance of GenRA relative to some of these recent models and the underlying acute toxicity data is briefly noted to provide additional context.
2. Materials and Methods
2.1. Toxicity data
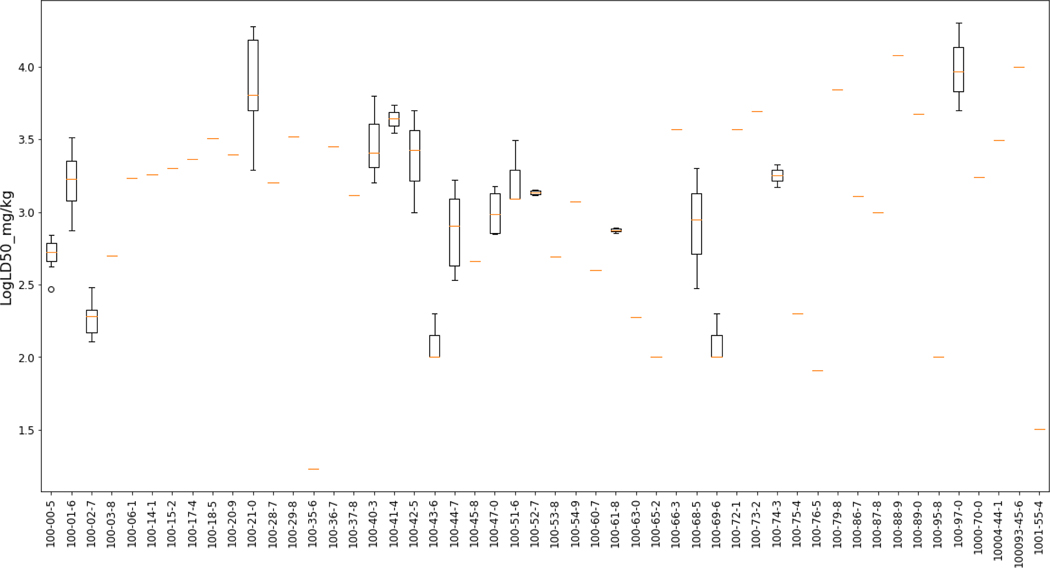
The acute oral lethality dataset was a product of a collaboration between NICEATM and NCCT to address the charges of the ATWG. The acute rodent oral toxicity dataset was a compilation from a number of sources including data extracted from ECHA’s registrations using OECD’s eChemPortal, the JRC’s AcutoxBase, National of Library’s Medicine (NLM) Hazardous Substances DataBank (HSDB), data underlying the TEST expert system [19]. For more information regarding the dataset and its processing, the reader is encouraged to consult Kleinstreuer et al., (2018) [14] and https://ntp.niehs.nih.gov/pubhealth/evalatm/test-method-evaluations/acute-systemic-tox/models/index.html. The preparation of the data and its underlying variability are to be discussed in a separate paper that is under preparation by Kleinstreuer et al. (see https://ntp.niehs.nih.gov/iccvam/meetings/at-models-2018/ppt/4-karmaus.pdf for an overview of the analysis that has been performed to date). In brief, the starting ATWG dataset had been filtered to exclude duplicate study values (as far as they could be rationalised e.g. same CAS and same LD50 value reported), correct obvious transcription errors and retain only discrete organic substances which could be QSAR modelled for the purposes of the international modelling project (which is described in [14]). This processed dataset comprised 16173 studies for 11992 unique substances. The 16173 studies consisted of 11618 point estimates (distinct LD50 value) and 4555 limit tests (typically reported as LD50>2000 or LD50 5000 mg/kg). Figure 1 shows the first 50 substances in the dataset and their associated LD50 values.
Figure 1.
First 50 substances in the dataset to illustrate the variability in their LD50 values
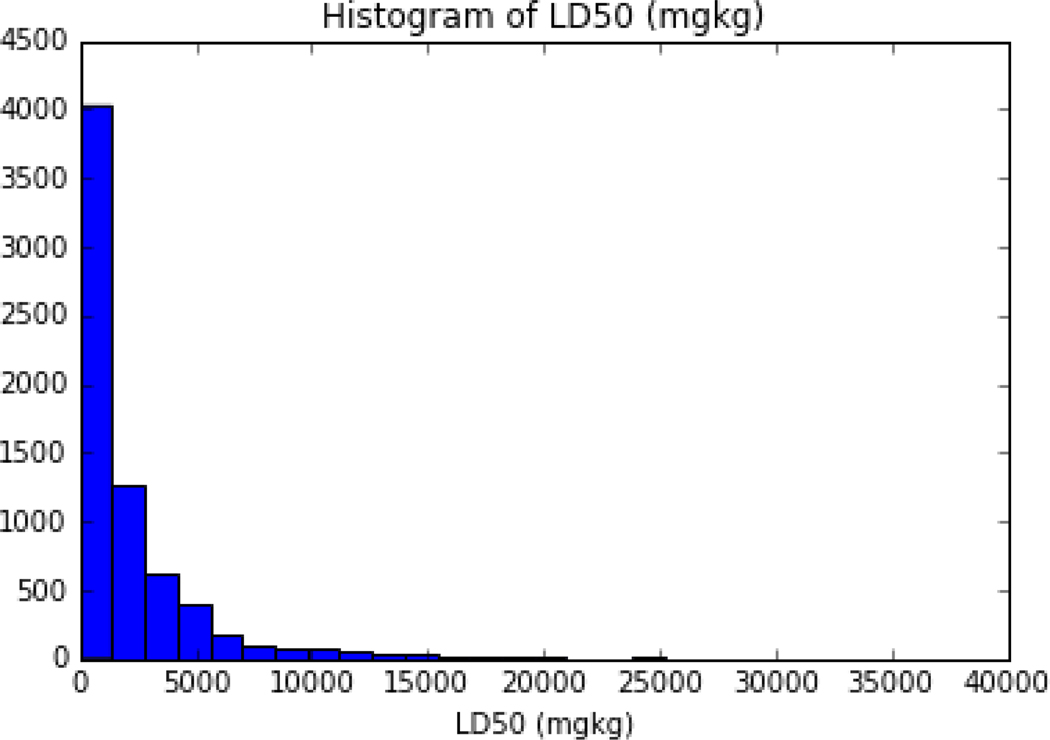
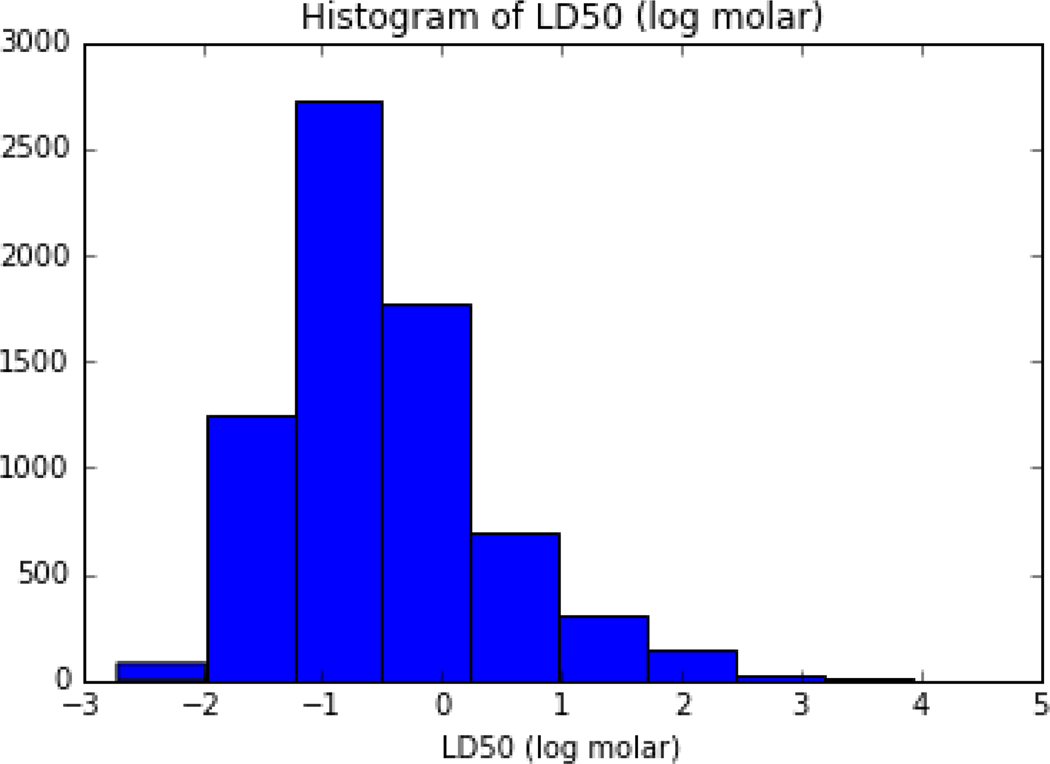
Based on the recommendations of the ATWG, for chemicals with multiple LD50 values (as point estimates), the median of the lower quartile was computed to provide a single LD50 value. In practice, for a substance with more than 1 LD50 point estimate, any value that exceeded 1.5*Interquartile range (IQR) was first removed and the median of the remaining values below the rederived 25th percentile was then calculated. The final processed dataset for modelling purposes comprised 11,992 substances with LD50 values. To ensure even higher consistency and quality of the data, only substances as having a record in the EPA Distributed Structure-Searchable Toxicity (DSSTox) Database were used ([9]; Grulke et al., under review). DSSTox chemical content is subject to strict quality controls to enforce consistency among chemical substance-structure identifiers. For the GenRA analysis undertaken in this study, this set of substances was mapped to DTXSID identifiers (DSSTox substance IDs) and molecular weight (MW) values as extracted from the EPA CompTox Chemicals Dashboard [9] to result in a final dataset of 7011 unique substances with a single representative LD50 value. The LD50 values were then converted to their log molar equivalents using the MW values extracted. Distributions of the LD50s (and their log molar equivalents) for the chemicals are depicted in Figures 2 and 3.
Figure 2:
Histogram of the LD50 values in the acute oral toxicity dataset of 7011 chemicals
Note: x axis has been truncated to 40,000 for ease of visualization even though the max LD50 value in the dataset was 70000 mg/kg
Figure 3:
Histogram of the acute toxicity dataset where LD50 values have been transformed to their log molar equivalents
2.2. Chemical structure data
Morgan fingerprints [22] were calculated using the freely available python library RDKit (http://www.rdkit.org) [23] and represented as binary (bit) vectors where the elements themselves represented presence (1) or absence (0) of a certain structural feature. This matched the procedure in the original manuscript [7]. ToxPrints [24] were downloaded using the batch search (ChemoTyper format) from the EPA CompTox Chemicals dashboard as needed [9].
2.3. Predicting LD50 values using GenRA
GenRA uses the similarity-weighted activity of the source analogues (nearest neighbours) selected during the analogue identification/evaluation steps (equation 1):
| (1) |
where k is the number of source analogues in our neighborhood, j is an index of our source analogues (j=1,...,k), Sj is the Jaccard similarity [25, 26] of the Morgan fingerprints between the target and the source analogue, and Aj is its associated activity. In equation (1), Aj is represented by the LD50 value. Thus, the LD50 read-across prediction of a target substance is defined as the similarity-weighted LD50 value of the source analogues. There are two tuning parameters in the algorithm expressed in equation (1): the number of source analogues (k) and the similarity threshold (s) of the source analogues considered. The default parameter settings of s = 0.5 and k = 10 (up to k source analogues) were used in this analysis.
2.4. Performance evaluation
Linear regression was used to fit the predicted LD50 and observed LD50 for all chemicals for k nearest neighbours (where k ranged from 1 to 10 chemicals in the neighbourhood), and with a similarity threshold, s (where s ranged from the minimum 0.5 across all unique pairwise comparisons in the neighbourhood). The quality of the fit was evaluated using the coefficient of determination (R2) which captures the percentage of variance explained by the model and the RMSE which is the square root of the variance of the residuals. The confidence in R2 was evaluated using Monte Carlo cross validation [27] for values k=10 and s=0.5. Briefly 25% of the data was randomly sampled without replacement as the hold out set to select targets whereas the other 75% was used to search for analogues. Performance of the holdout set predictions was calculated using R2 and the process was repeated 100 times to estimate the variability in the R2.
A grid search was also performed over k (1–15 neighbours) and s (0.05–0.95) to evaluate how the overall fit varied with k and s as well as to explore the coverage. This overall performance evaluation is termed ‘global’ for the purposes of this manuscript.
2.5. Performance evaluation in local neighborhoods
2.5.1. OECD Toolbox pre-defined Acute toxicity MOAs profiles
Chemical structure-based clusters were identified using the acute oral toxicity profiler as available within the OECD Toolbox 4.3 [28]. Briefly, all target chemicals and their corresponding analogues (k up to 10) were processed through the acute oral toxicity profiler. This profiler had been developed from a dataset of approximately 2800 chemicals as taken from the National Library of Medicine’s ChemIDplus database. The profiler comprises 99 toxicological categories, each of which purports to be associated with a known or hypothetical interaction mechanism. For the chemicals in the dataset for which predictions could be made, 91 of the 99 profiling categories were flagged. Examples of these categories were used to explore the ‘local’ performance of GenRA predictions.
2.5.2. Clustering
Chemotype Toxprints [24] were extracted from the EPA Chemicals Dashboard for the chemicals in the dataset that yielded feasible predictions. Toxprints are a set of 729 pre-defined fingerprints that were specifically tailored to provide good coverage of environmentally, regulatory and commercial use chemical space [24]. Zero constant ToxPrints were removed from the dataset to leave 430 Toxprints for the 3978 chemicals for which ToxPrints were available. K-means clustering was performed on this set using the sklearn Kmeans package (https://scikit-learn.org/stable/) and the number of clusters was identified by using the Elbow method (https://en.wikipedia.org/wiki/Elbow_method_(clustering)). The procedure followed was to derive a plot of the ‘within cluster sum of squares’ (WCSS) as a function of the number of clusters (K). The ‘elbow’ in this line plot was used to facilitate the identification of a suitable number of clusters. The optimal outcome is to identify the smallest value of K that has the lowest WCSS, where the elbow usually represents the point at which this balance is reached. Briefly, within cluster sum of squares can be explained as follows: if there are 3 clusters, there are 3 centre points (C1, C2, C3) and each data point will fall into the zone of C1, C2 or C3. The sum of squares of the distance of each data point in cluster 1 from its centre point C1 is then calculated – this is defined as the cluster 1 sum of squares. The same calculation is repeated for all the cluster centres and their respective data points. The sum of all the clusters sum of squares, in this case 3 clusters, is hence termed the WCSS.
Examples of these clusters were also used to explore the ‘local’ performance of GenRA predictions.
2.5.3. Activity cliff generation
Pairwise similarities using the Jaccard index were calculated using the chemotype ToxPrints [24] as well as Morgan fingerprints [22] for the chemicals in the acute oral toxicity dataset. Different chemical fingerprints represent the same chemical differently, hence to provide some complementary perspective for the pairwise comparisons, two different fingerprinting approaches were used. Pairwise activity differences corresponding to each possible pair of chemicals in the dataset were calculated from the following equation (1):
| (1) |
Where A(T) i and A(T) j are the Log molar LD50 (pLD50) values of the ith and jth chemicals.
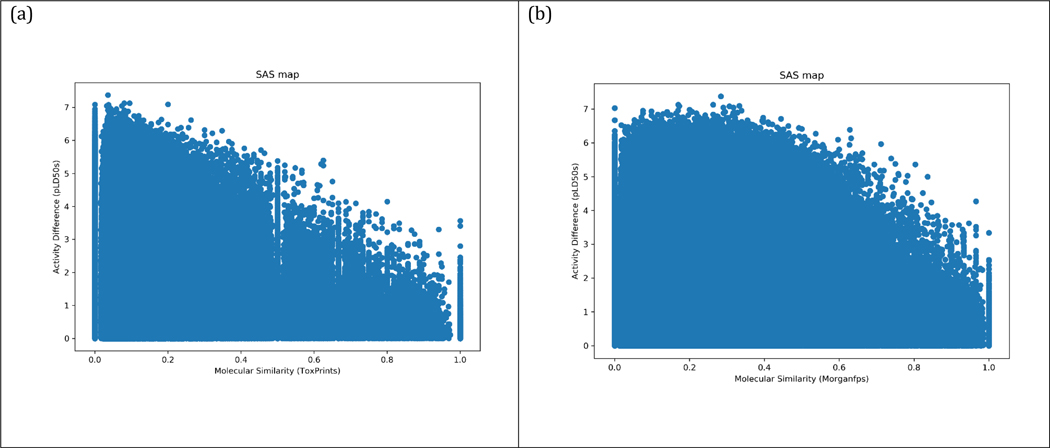
Structure-Activity similarity (SAS) maps were generated by plotting the pairwise structural similarity in the X axis against the absolute value of the pLD50 difference in the Y axis for each pair of chemicals. SAS maps can roughly be divided into four zones by imposing activity difference and molecular similarity threshold values to aid their interpretation. Chemical pairs that correspond to activity cliffs are those that have a high structure similarity and a high pLD50 difference [29]. Thresholds for similarity and pLD50 difference were arbitrarily set to help identify a reasonable number of chemical pairs in the region of activity cliffs. Illustrative chemical pairs were identified and briefly discussed.
2.6. Software
Data processing and analysis was conducted in the Python programming language (2.7.12, 3.6 Python Software Foundation) using RDKit and the matplotlib package (v2.0.2) [30] for visualisation. Notebooks, input, output files are available as part of the supplementary information.
3. Results and Discussion
3.1. GenRA ‘global’ predictions of LD50
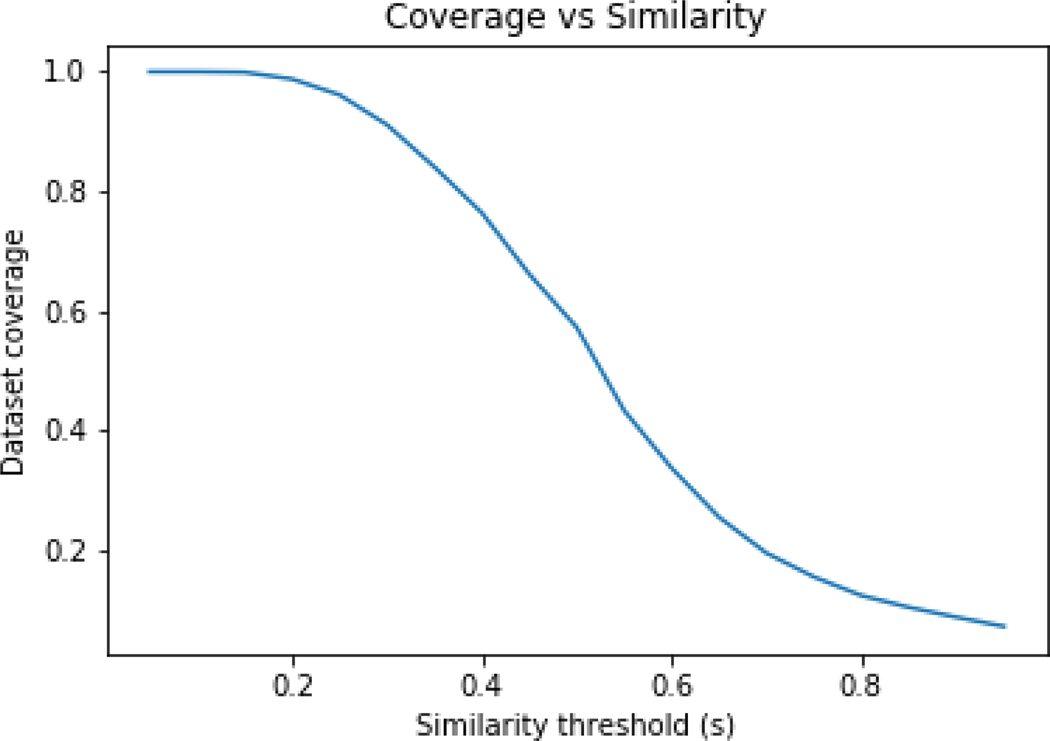
GenRA is impacted by the availability of source analogues (k) and the similarity (s) of those source analogues, as both will have a bearing on how well the LD50 value can be predicted. For low values of s, there may be many source analogues but the confidence in the GenRA prediction may be poor. On the other hand, with high values of s, there may be few or insufficient source analogues from which a GenRA prediction can even be made. The percentage of the acute toxicity dataset for which at least 1 source analogue could be identified when varying for the Jaccard similarity, s from a minimum of 0.05 was explored. Figure 4 shows the coverage of the dataset based on s. The coverage of the dataset approaches 100% for values of s < 0.2 whereas the coverage drops dramatically for s > 0.8.
Figure 4:
Coverage of dataset on the basis of similarity threshold
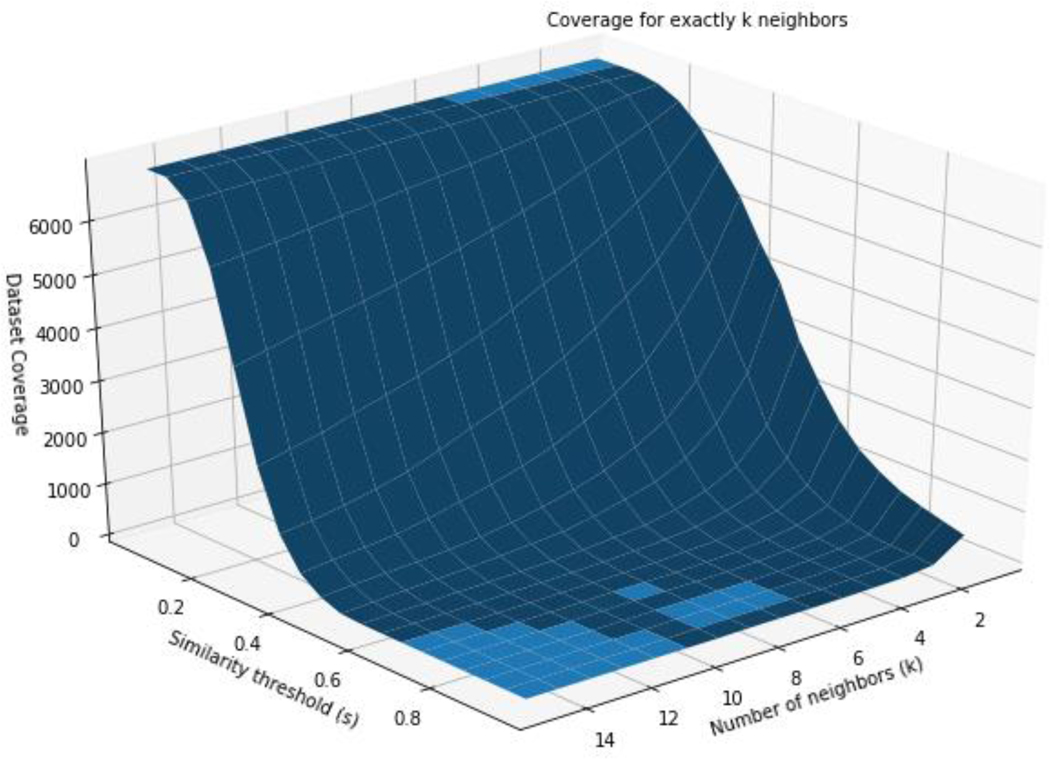
The coverage was also explored on the basis of varying k and s, where exactly k source analogues could be identified (Figure 5).
Figure 5:
Coverage on the basis of exactly k source analogues
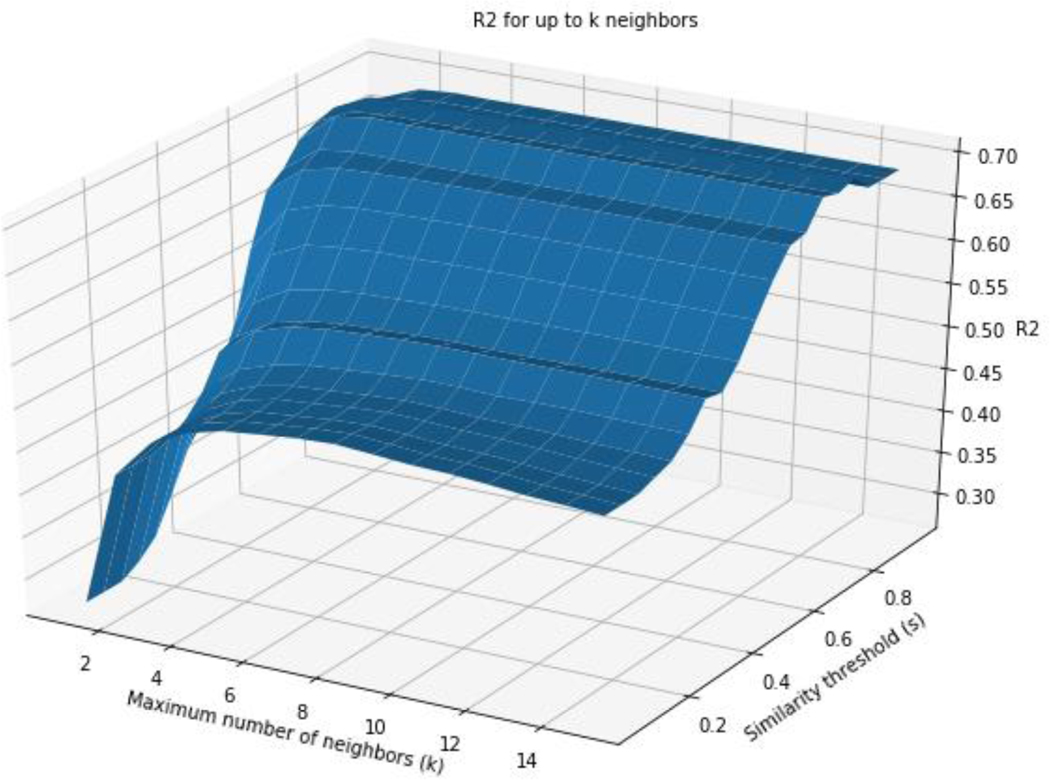
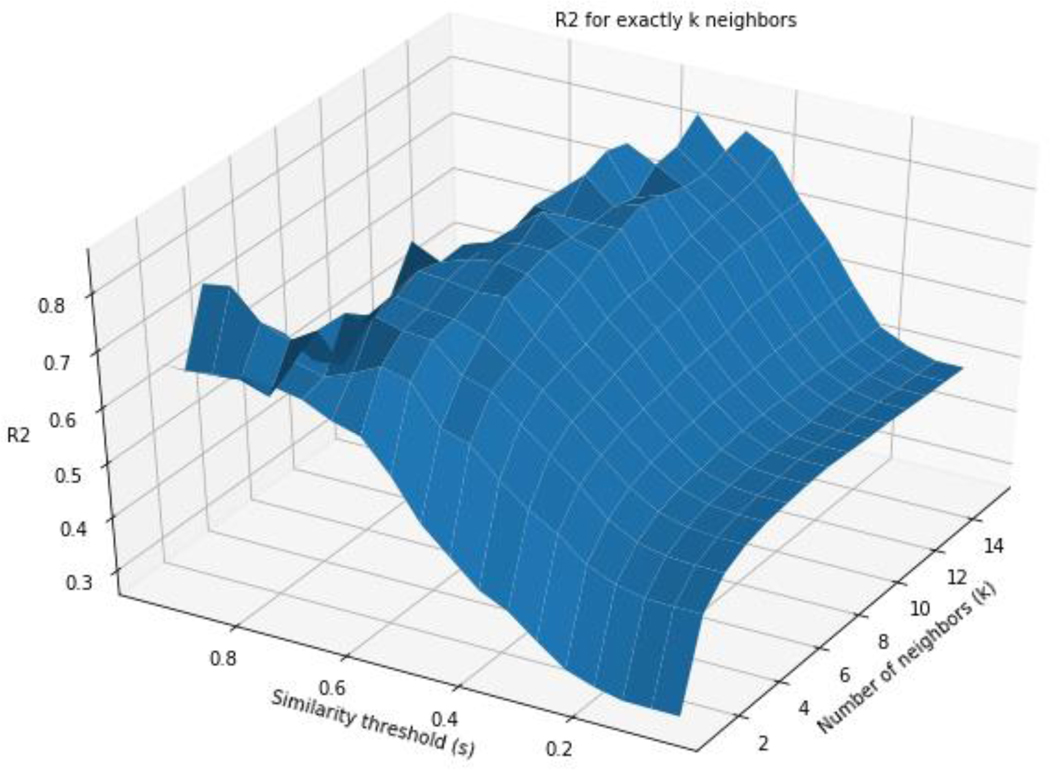
The performance in terms of R2 was also explored when varying k and s using chemicals with up to k source analogues (Figure 6) and in Figure 7 for exactly k source analogues. Both figures illustrate the impact that k and s play in GenRA performance as well as coverage. Source analogues with a higher similarity threshold result in an improved GenRA prediction but at the expense of coverage. The optimal value of k is a tradeoff between accuracy and dataset coverage. In Figure 6, as more similar source analogues are added to neighbourhoods, GenRA predictions improve. Since each point of the grid search includes predictions for neighbourhoods that have less than k neighbours (because k neighbours could not be found above the similarity threshold set by s), increasing k while holding s constant adds additional source analogues to existing neighbourhoods. Increasing s while holding k constant shrinks existing neighbourhoods to only contain higher quality analogues as well as removing predictions that no longer have any valid source analogues at the higher similarity threshold. In general, increasing s or k at any point in the plot improves the R2 value though s appears to have a more pronounced impact. On the other hand, Figure 7 shows R2 values only using predictions that have exactly k source analogues at a given similarity threshold s. For high values of k and s, there may be few chemicals in the dataset to find neighbourhoods for. This causes local cliffs due to data sparsity. Combinations of k and s that have less than 30 predictions are also not plotted. Increasing both k and s increases the fit as denoted by R2 value at the expense of data coverage. The results of the grid searches are available in the supplementary information.
Figure 6:
R2 for up to k source analogues
Figure 7:
R2 for exactly k source analogues
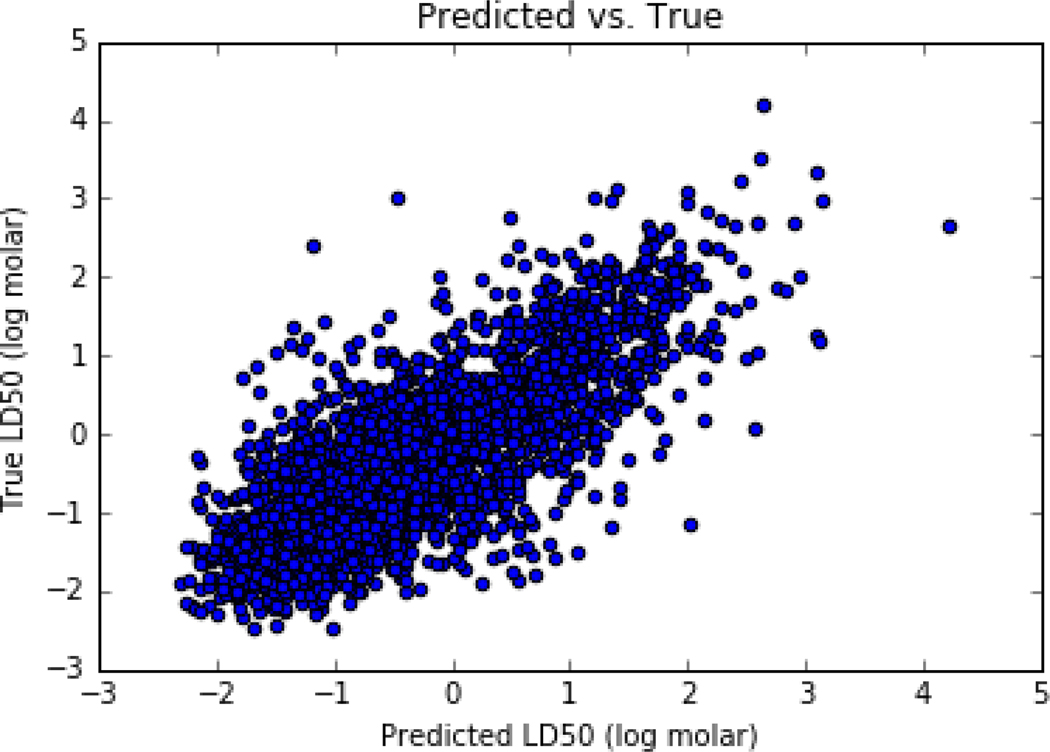
For the purposes of this study, the tuning parameters were as follows: k up to 10 and s at least 0.5. A satisfactory performance in terms of R2 of 0.61 and RMSE of 0.58 covering 57% of the dataset (predictions could be made for 3998 chemicals out of a total of 7011 chemicals) was found. Figure 8 is a plot showing the fit with these combinations.
Figure 8:
Fit of GenRA predictions vs LD50 log molar experimental values using k up to 10 and s = 0.5
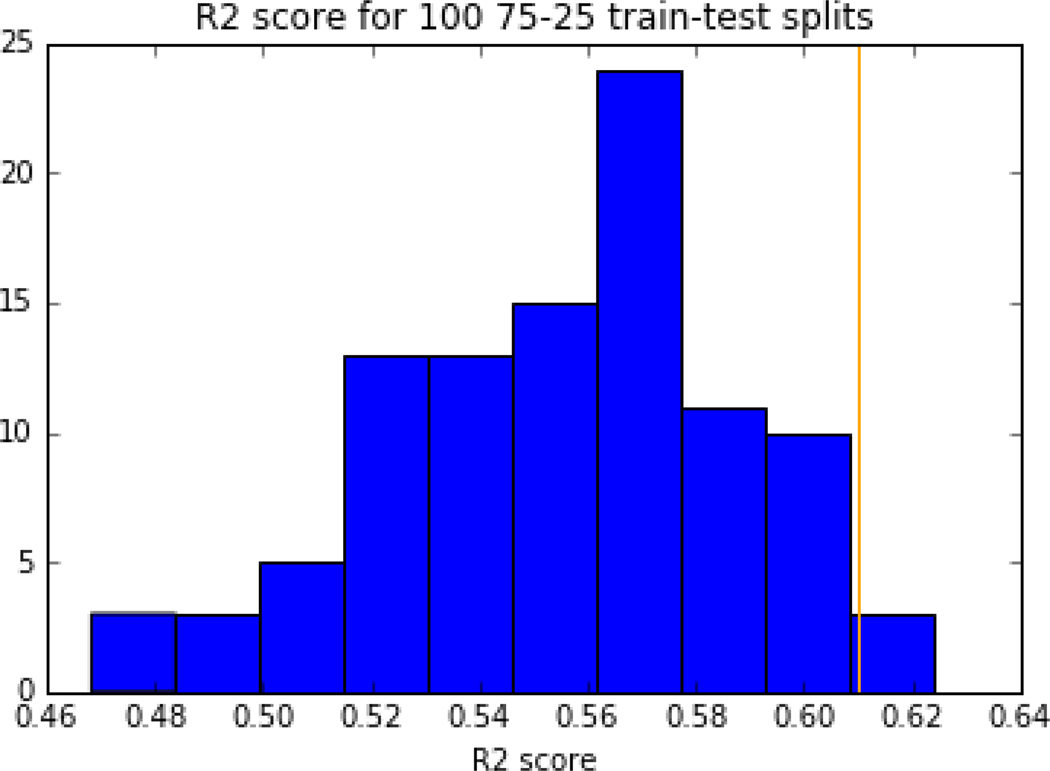
A cross-validation was performed using k up to 10 and minimum s=0.5 by performing 100 25–75 train-test splits of the data and recording the R2 value for each iteration’s test predictions. The results can be seen in Figure 9. For 100 cross-validation iterations, R2 values varied from 0.47 to 0.62 which provided confidence in the variability of the R2 reported for the full dataset.
Figure 9:
R2 value for the 100 75–25 train test splits
3.2. Comparison with other similar LD50 in silico models
As described earlier, similar approaches have been attempted to predict LD50, Table 1 highlights a handful of recent models published, and their associated performance and coverage if reported. Although the primary aim of the study was to illustrate the extension of the GenRA approach towards quantitative predictions of toxicity, the overall global performance for acute oral toxicity was very comparable to other studies in terms of R2 and chemical coverage.
Table 1.
Performance reported for recent models
| Model | Dataset | Reported performance metrics |
|---|---|---|
| Zhu et al. (2009) [19] | LD50 data for 7385 chemicals Various approaches used to model the dataset. Performance was compared with the TOPKAT expert system for a validation set of 3913 chemicals |
Various approaches including kNN, random forest, hierarchical clustering, neural networks R2 values ranged from 0.24 to 0.66 with coverage ranging from 19% to 97% |
| Raevsky OA et al. (2010) [31] | Prediction of acute toxicity to mice by the arithmetic mean toxicity (AMT) modelling approach. A total of 10,241 neutral organic compounds with reported mouse LD50 values from intravenous injection were selected from a SYMYX database. Arithmetic Mean Toxicity (AMT) modelling approach was applied which uses one or a few pairs of nearest structural neighbours. | 4.79% (491 chemicals) corresponded to the highest threshold of structural similarity (0.8) and 2 neighbour pairs. Performance metrics were R2 = 0.762, SD = 0.33 8.12% (832 chemicals) corresponded to the next threshold, 2 pairs of structural neighbours with a similarity of 0.7 or greater. R2 = 0.673 SD = 0.39 For similarity threshold of 0.6, R2 = 0.673 SD = 0.38. For substances without structural neighbours the AMT model was calculated but the performance was poor R2 = 0.337 SD = 0.64 |
| Sazonovas et al. (2010) [16] | Global Adjusted Locally According to Similarity (GALAS) approach applied to acute toxicity in rat and mouse by various routes of entry. Acute rat oral data comprised 6464 chemicals for training and 2167 for testing purposes. | Reported rat oral model performance for test set was R2 = 0.56 and RMSE = 0.59 |
| Lagunin et al. (2011) [32] | QSAR modelling based on three approaches: using quantitative neighbourhoods of atoms descriptors, Prediction of Activity Spectra (PASS) as descriptors and self-consistent regression (SCR). The final prediction reported for a given chemical is based on a weighted average of predictions from the each QSAR model taking into account the respective applicability domains. Dataset was selected from the SYMYX MDL Toxicity database for all routes of administration including oral. | Accuracy of predictions for test sets were reported at different thresholds of applicability domain. For the oral route of exposure, an applicability domain (AD) threshold of >0.9 gave rise to a R2 of 0.611 with a coverage of 84.7% whereas an AD threshold > 0.7 resulted in a R2 of 0.585 and a coverage of 97.4%. |
| Lu et al. (2014) [33] | Lazy learning approach applied to rat oral toxicity based on a dataset of 9617 chemicals. | Reported consensus model yielded R2 of 0.712 on a test set of 2896 substances. |
| Lei et al. (2016) [34] | Relevance Vector Machine techniques were used to build regression models, in addition to other machine learning approaches. Models were then combined into a consensus model. Dataset of rat oral LD50 values for 7314 substances was constructed. | Prediction metrics reported for the different models ranged from R2 of 0.572 – 0.659. Consensus model R2 values were reported as 0.669–0.689. Test set comprised 2376 substances. |
| Xu et al. (2017) [35] | Deep learning approach to predict acute oral toxicity, relying on molecular graph encoding convolutional neural networks. Various models developed for both prediction of LD50 and classification outcomes. | Consensus deep learning NN model (constructed by averaging the 10 models developed) to predict LD50 had a R2 of 0.864, RMSE (0.268) and MAE of 0.195 on a test set of 1678 chemicals taken from a dataset compiled by Li et al (2014). |
| Alberga et al. (2018) [20] | Training set of LD50 data for 8944 chemicals Validation set comprised 2896 chemicals Models derived for different endpoints including LD50 |
kNN using 19 different chemical fingerprints For the validation set, performance reported in terms of R2 of 0.737, RMSE 0.408 and coverage of 34.7% |
3.3. GenRA local predictions of LD50
3.3.1. Acute Mode of Action profiler from the OECD Toolbox
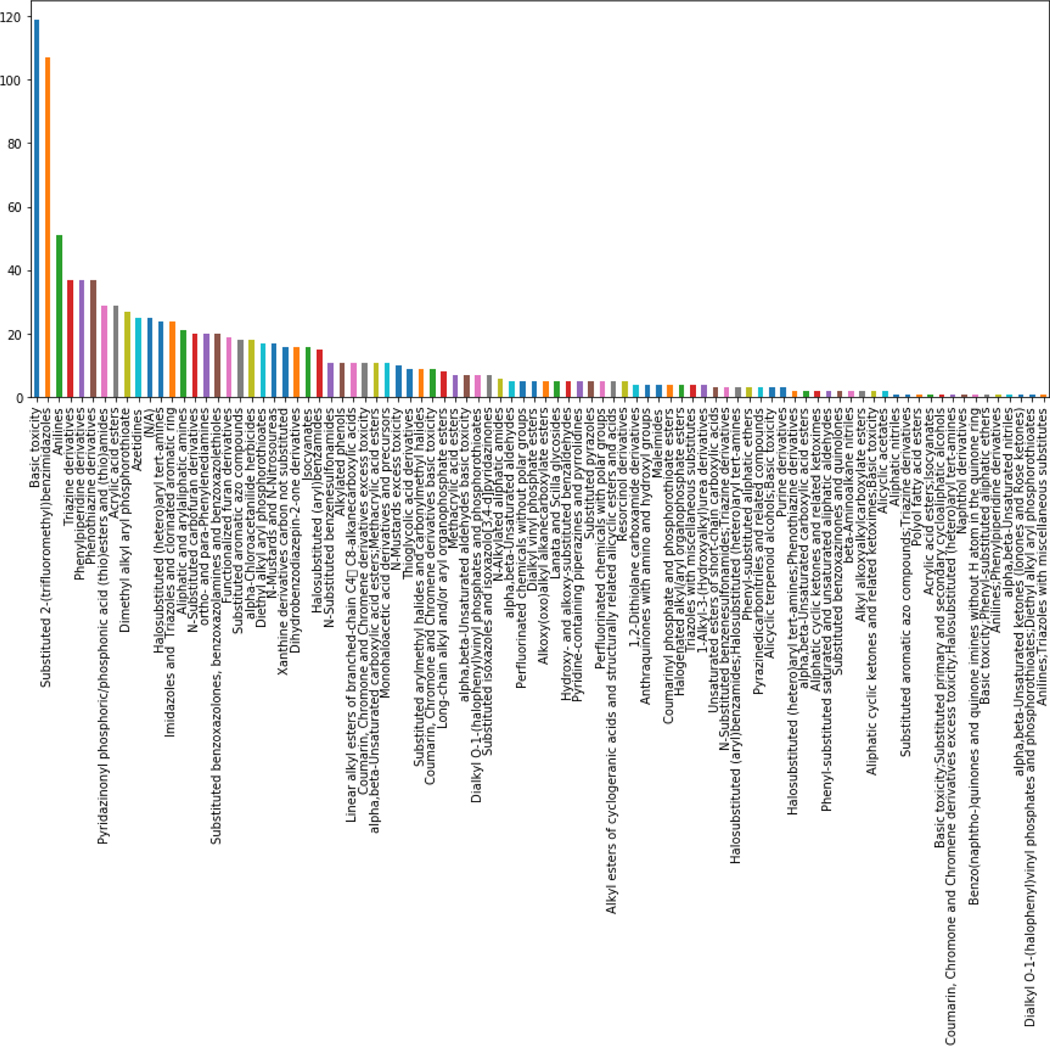
For the 3998 chemicals for which predictions could be made, the acute toxicity profiling outcomes were extracted from the OECD Toolbox. 72% (2913 out of 3998) of the chemicals were assigned as ‘Not categorised’. The remaining chemicals were assigned to one of 90 other categories. Figure 10 shows the distribution of chemicals across these 90 categories.
Figure 10.
Barplot of the 1085 chemicals categorized across the 90 OECD Toolbox Acute Mode of Action toxicity profiler categories.
The plot represents the number of chemicals that were assigned into one of the acute mode of action categories. The majority of chemicals (72%) for which predictions could be made were designated as not categorized. The remaining chemicals 28%, could be assigned into a category (e.g. anilines). Arguably, chemicals that fell into the category of anilines would be expected to exert their acute toxicity by a similar mode of action. The basic toxicity category is a misnomer but could be likened to the baseline narcosis category that is used in acute aquatic toxicity – i.e. substances that are neutral organics and exert their toxicity based on a simple narcosis mechanism (general depression of biological activity from exposure to a nonspecifically acting toxicant) that can be modelled using water solubility or the log of the octanol water partition coefficient.
The fit for the entire set of 3998 was found to have a R2 of 0.61. The fits were computed within the categories to identify whether there were specific chemical categories where the fit was substantially higher. Only 3 categories were found to have a higher R2 but the number of chemicals in each case was less than 10 members (Table 2).
Table 2.
OECD Toolbox MOA Categories with better performance relative to the global GenRA performance
| Toolbox_MOA_category | Number of chemicals | R2 |
|---|---|---|
| Aliphatic cyclic ketones and related ketoximes | 2 | 1 |
| N-Alkylated aliphatic amides | 6 | 0.82 |
| Substituted pyrazoles | 5 | 0.81 |
| Xanthine derivatives carbon not substituted | 16 | 0.56 |
| Halosubstituted (aryl)benzamides | 15 | 0.45 |
The high fits were misleading given the low number of chemicals in each category as exemplified by the substituted pyrazoles category (Figure 11). For this dataset, the coverage of the acute toxicity profiler was concluded to be too narrow in scope to be able to highlight regions of chemical space where the performance was significantly improved.
Figure 11.
Predicted vs experimental Log molar LD50 values for chemicals belonging to the substituted pyrazoles category. Identifying the chemicals that were assigned as substituted pyrazoles appeared to have a better fit than the ‘global’ performance based on the R2 but the performance was inflated.
3.3.2. Clustering
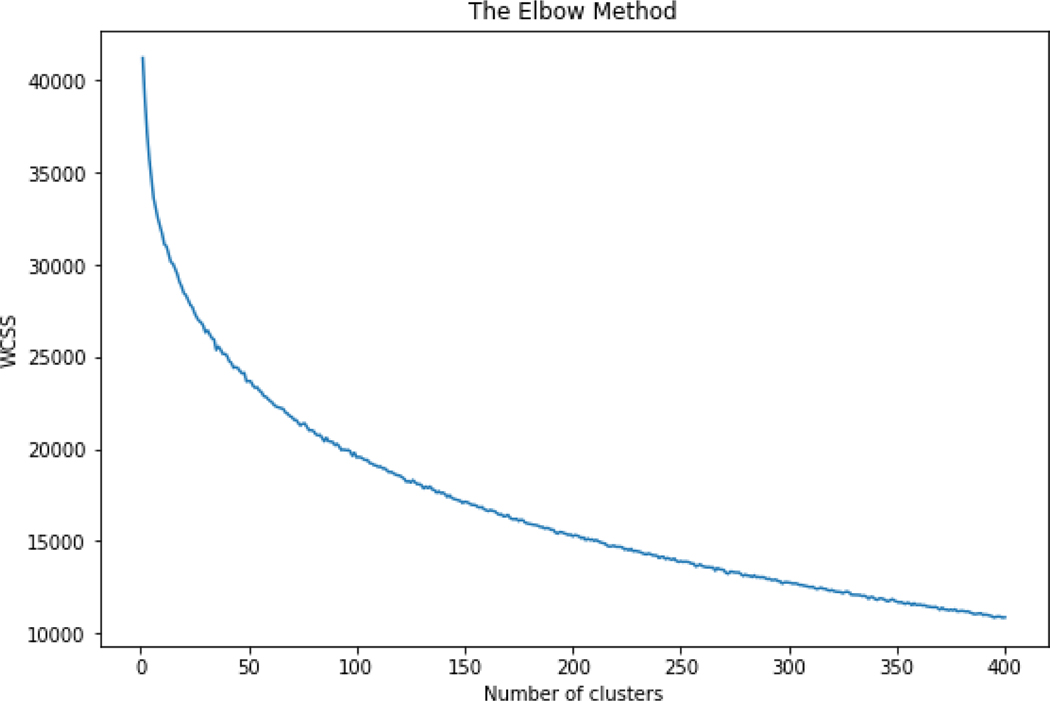
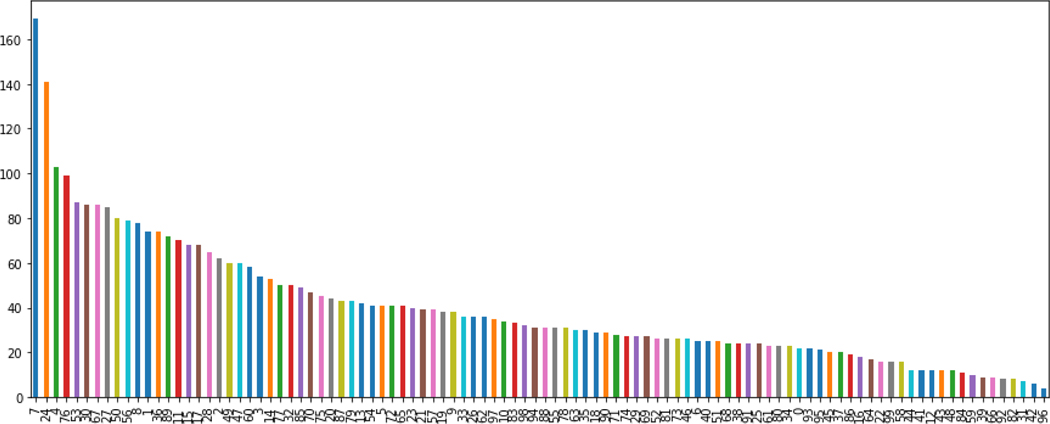
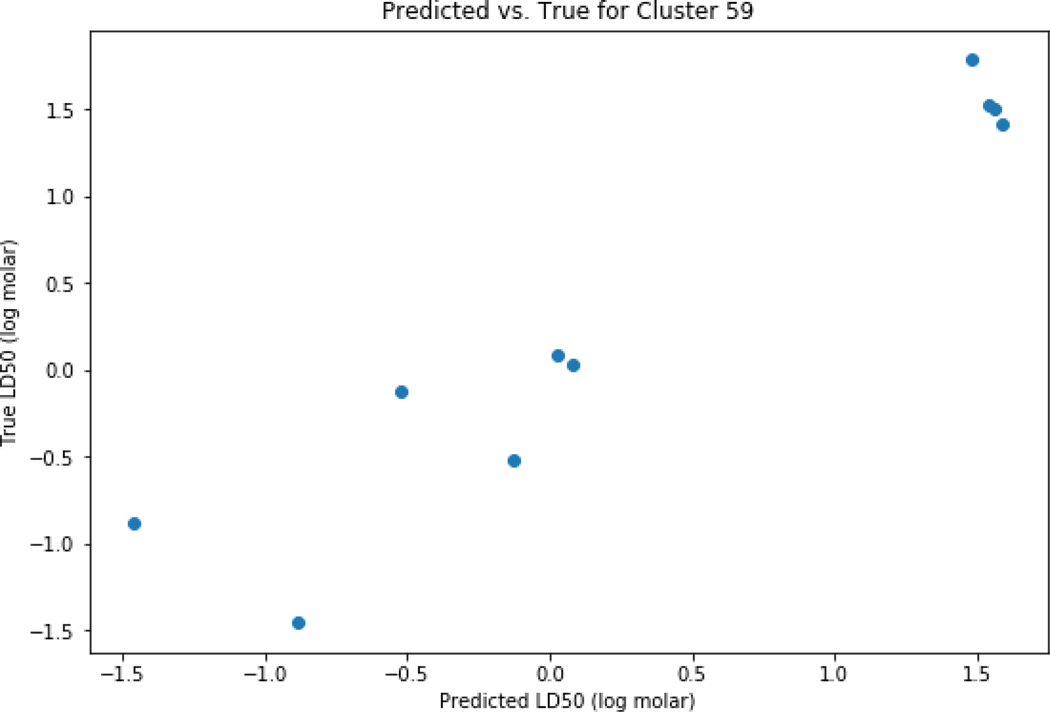
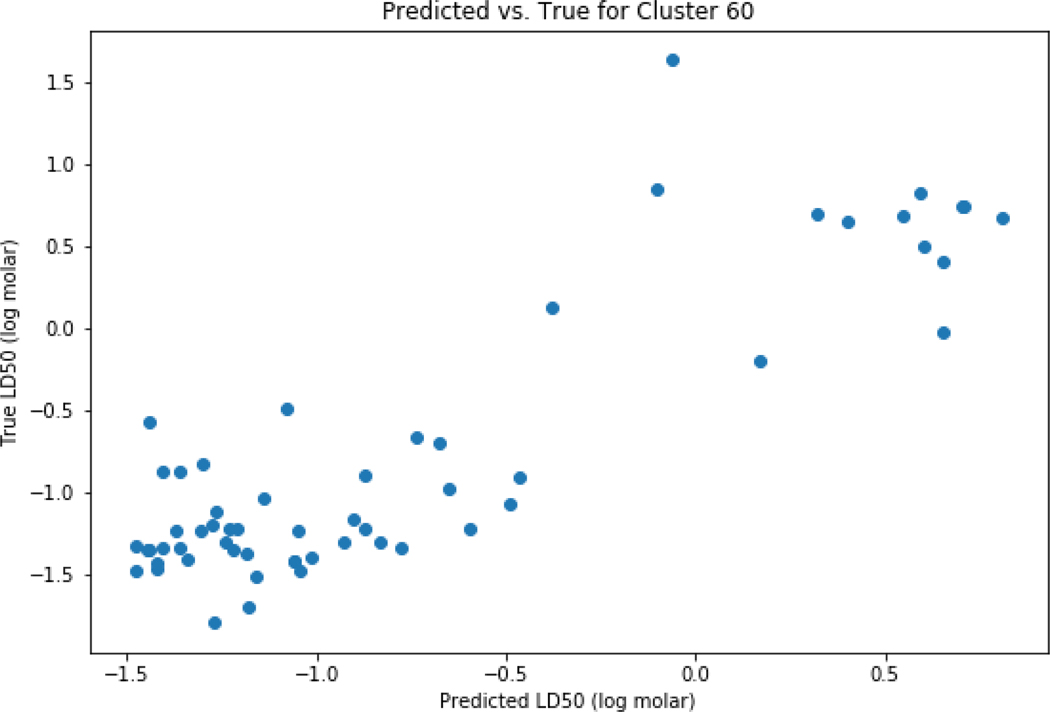
Clustering using K-means was performed for the set of chemicals where predictions were possible. Based on the elbow plot (Figure 12), 100 clusters appeared to be a pragmatic number to categorise the dataset. The distribution of chemicals across the 100 clusters is reflected in Figure 13. There were 19 out of 100 clusters that showed improved performance relative to the global performance as summarised in Table 3. As an example, cluster 59 comprising a set of 10 carbamates was extracted (Figure 14). Cluster 60 comprised 58 chemicals that contained an ester and phenyl moiety (Figure 15).
Figure 12.
Elbow plot of the number of clusters against the ‘within cluster sum of squares’ (WCSS)
Figure 13.
Count of chemicals per cluster for all 100 clusters identified.
Based on the elbow method, 100 clusters was selected as the ‘optimal’ number of clusters. The coverage across the 100 clusters was less skewed than with the OECD Toolbox acute toxicity profiler hence the expectation was that these clusters of structurally related chemicals would provide a useful ‘local’ perspective on the GenRA predicted performance.
Table 3.
Clusters with performance better than the global GenRA
| cluster# | Number of chemicals | R2 |
|---|---|---|
| 59 | 10 | 0.91 |
| 41 | 12 | 0.88 |
| 93 | 22 | 0.89 |
| 49 | 60 | 0.84 |
| 52 | 26 | 0.79 |
| 37 | 20 | 0.77 |
| 62 | 36 | 0.76 |
| 14 | 53 | 0.75 |
| 60 | 58 | 0.75 |
| 26 | 36 | 0.72 |
| 92 | 8 | 0.68 |
| 87 | 43 | 0.67 |
| 68 | 24 | 0.66 |
| 50 | 80 | 0.65 |
| 43 | 12 | 0.65 |
| 51 | 25 | 0.64 |
| 17 | 68 | 0.63 |
| 91 | 24 | 0.62 |
| 23 | 40 | 0.62 |
Figure 14.
Predicted vs experiment predictions for cluster 59
Figure 15.
Predicted vs experiment predictions for cluster 60
Though overall global performance is reasonable and comparable to other published models, performance is still context dependent on the chemistry. Local clusters exhibited improved performance relative to global performance in 19 out of 100 clusters.
3.3.3. Structure-activity similarity (SAS) plot generation
SAS plots (Figure 16a,b) were constructed for the dataset using chemotype ToxPrints and Morgan fingerprints as chemical fingerprints and an absolute difference of the molar LogLD50 value. Chemical pairs that fall into the upper right quadrant would be categorised as ‘Activity Cliffs’. Chemical pairs on the basis of ToxPrints or Morgan fingerprints that were at the extreme ends of the activity cliff quadrant were identified on the basis of a similarity >0.8 and an activity difference > 2 (Tables 5 and 6 highlight 20 example pairs using the 2 different fingerprints, the full set of chemical pairs are available in the supplementary information).
Figure 16.
SAS plots using ToxPrints (a) and Morgan Fingerprints (b)
Table 5.
Twenty activity cliff pairs identified based on ToxPrints
| DTXSID | Structure | DTXSID | Structure | Pairwise_Similarity | Activity_difference |
|---|---|---|---|---|---|
| DTXSID00162733 | 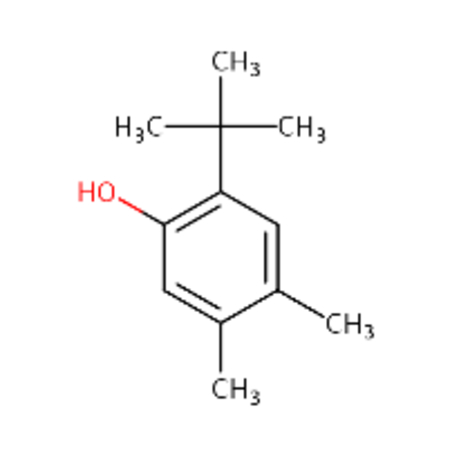 |
DTXSID3040691 | 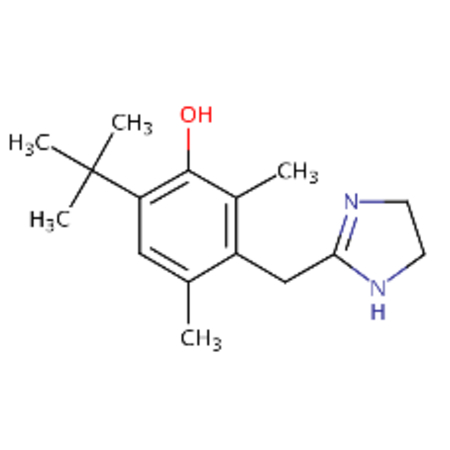 |
0.87 | 3.27 |
| DTXSID0020315 | 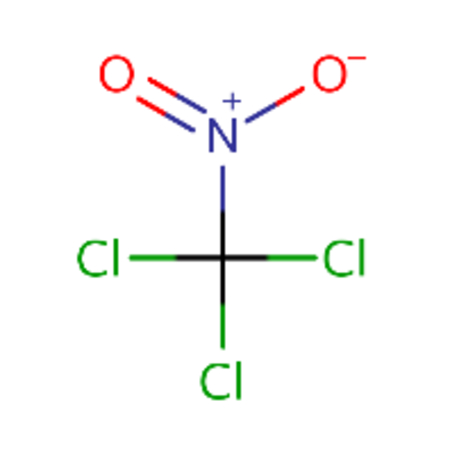 |
DTXSID0021381 | 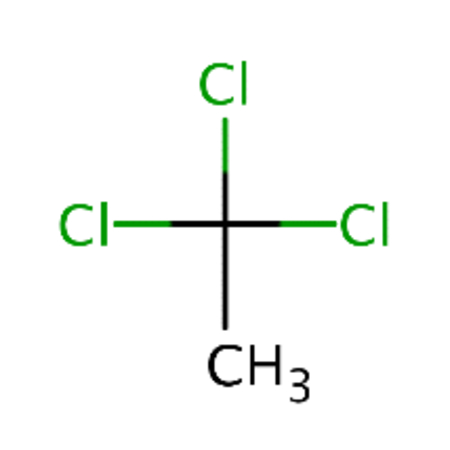 |
0.86 | 2.5 |
| DTXSID0021381 | 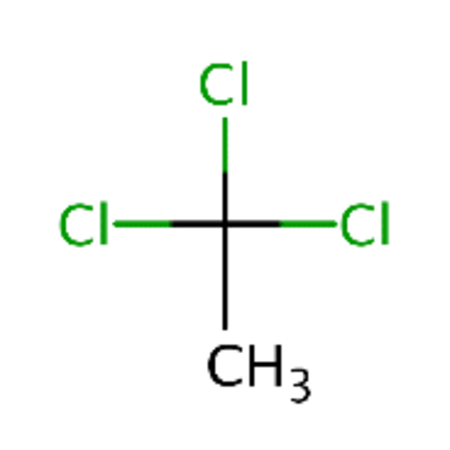 |
DTXSID0020315 | 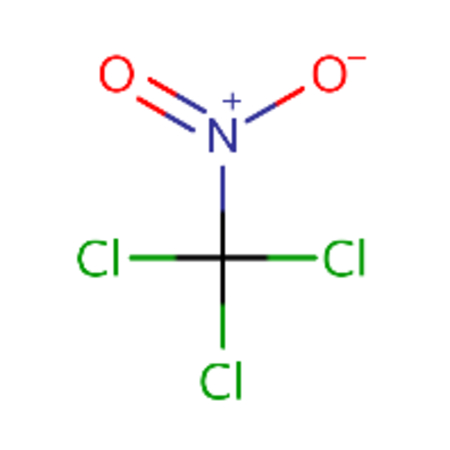 |
0.86 | 2.5 |
| DTXSID0021888 | 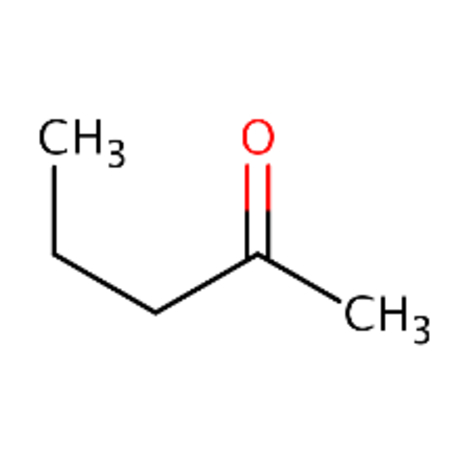 |
DTXSID4021927 |  |
0.9 | 2.42 |
| DTXSID0022068 | 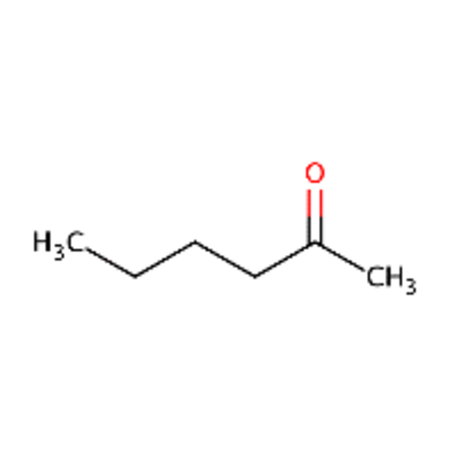 |
DTXSID4021927 | 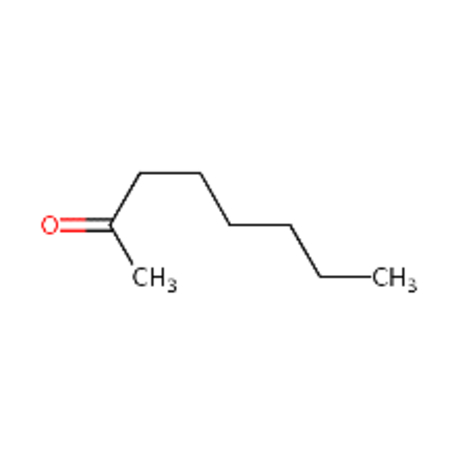 |
0.9 | 2.57 |
| DTXSID0026961 | 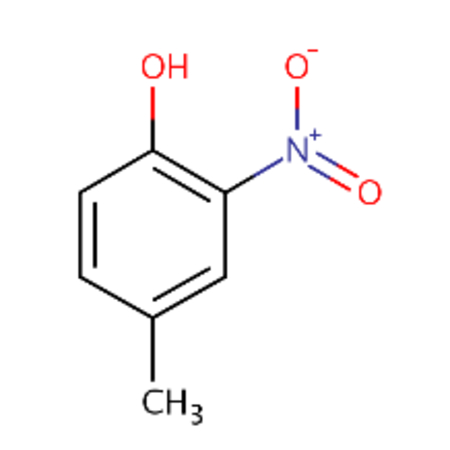 |
DTXSID1022053 | 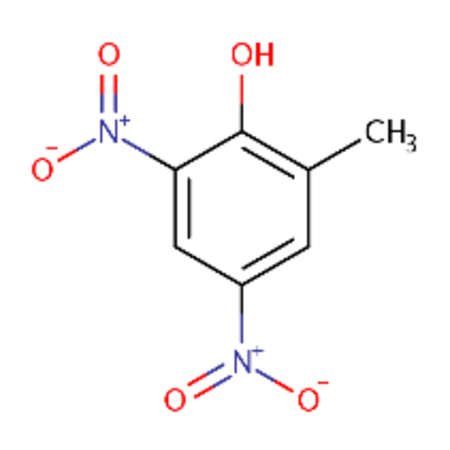 |
1 | 2.79 |
| DTXSID0026961 | 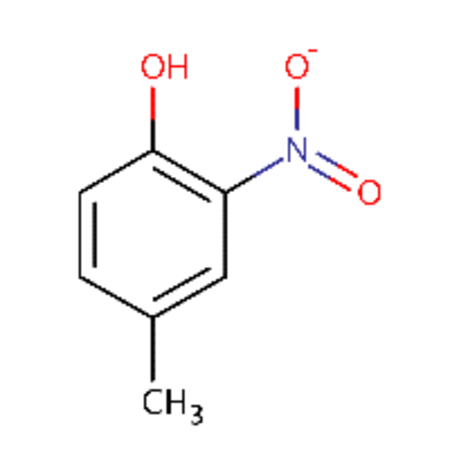 |
DTXSID2075423 | 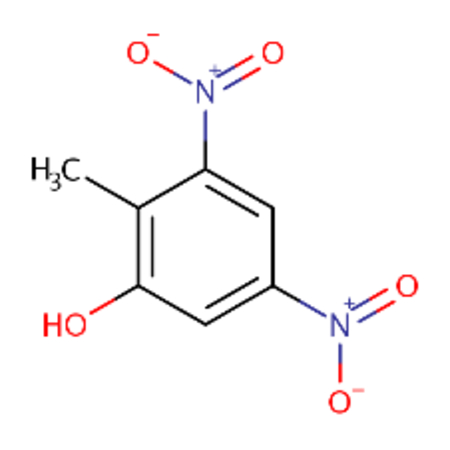 |
0.9 | 2.24 |
| DTXSID0039223 | 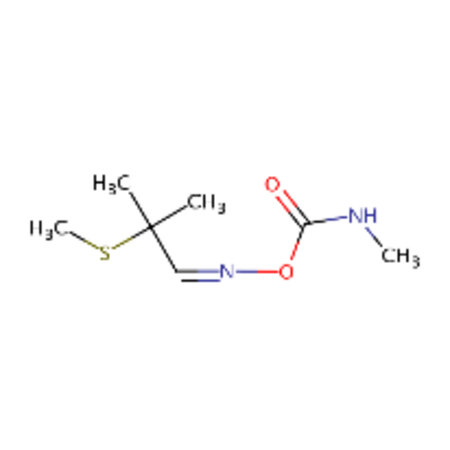 |
DTXSID5058062 | 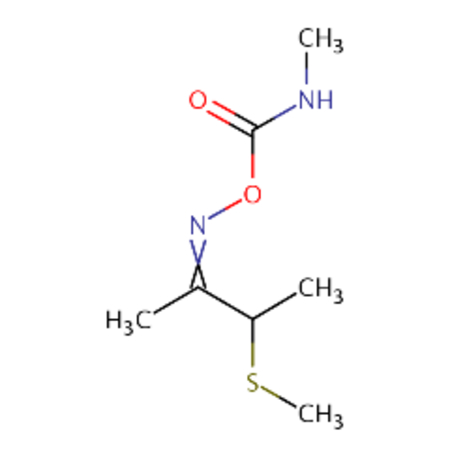 |
0.86 | 2.49 |
| DTXSID0041773 | 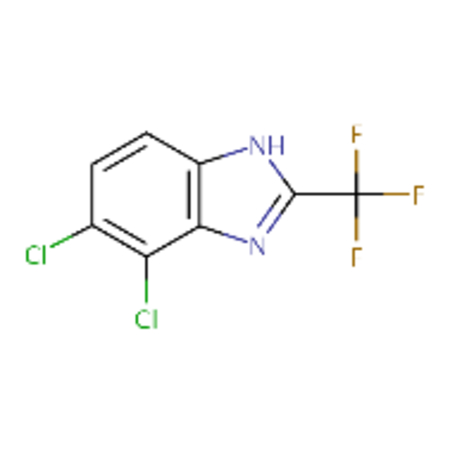 |
DTXSID30237685 | 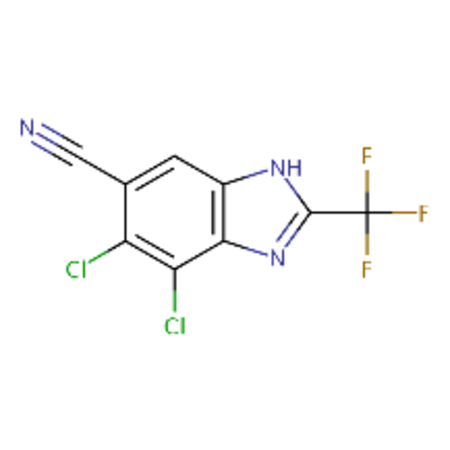 |
0.81 | 2.44 |
| DTXSID0060220 | 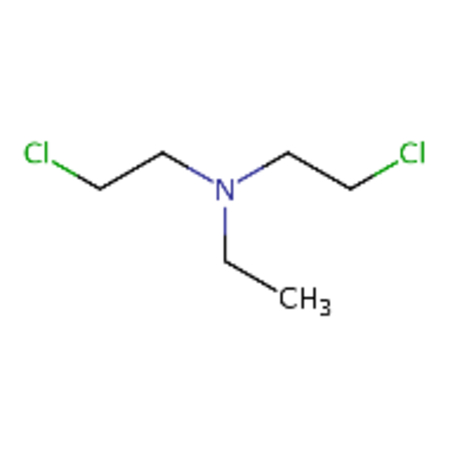 |
DTXSID7052109 | 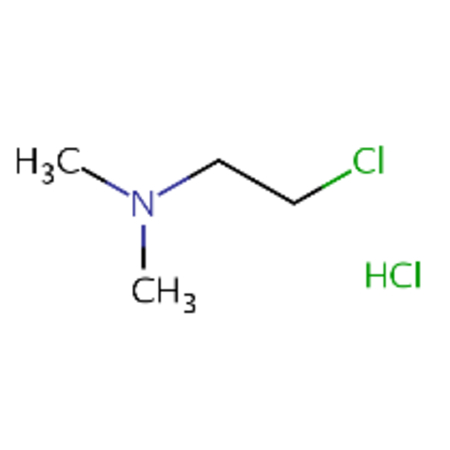 |
0.83 | 2.05 |
| DTXSID10143331 |  |
DTXSID8020206 | 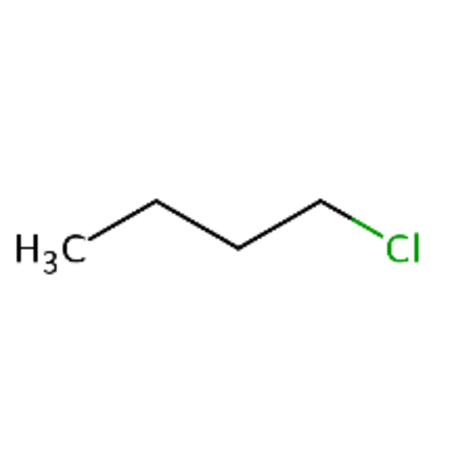 |
0.83 | 2.44 |
| DTXSID10177934 | 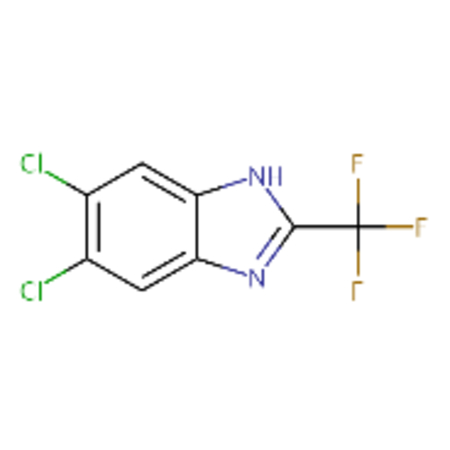 |
DTXSID30237685 | 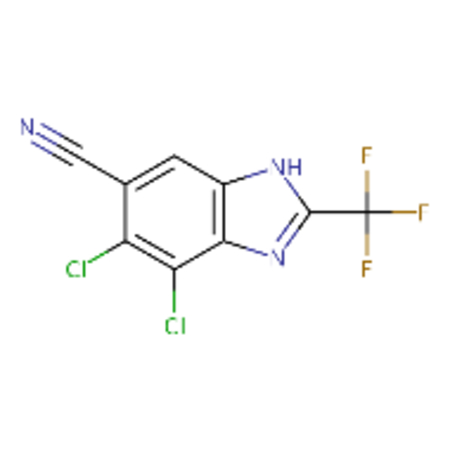 |
0.81 | 2.66 |
| DTXSID1020221 | 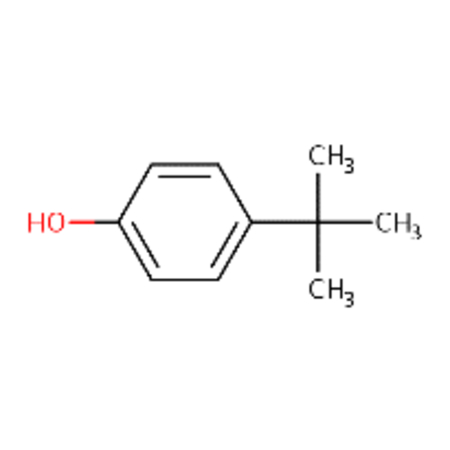 |
DTXSID7041883 | 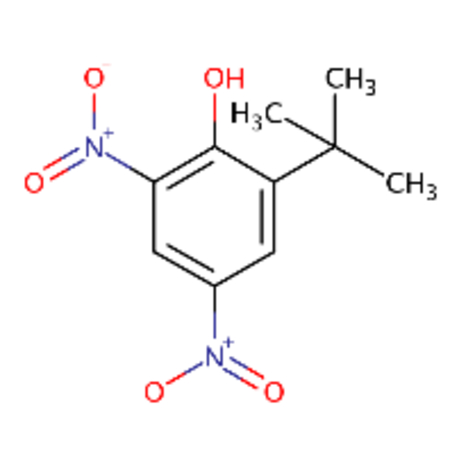 |
0.82 | 2.35 |
| DTXSID1020560 | 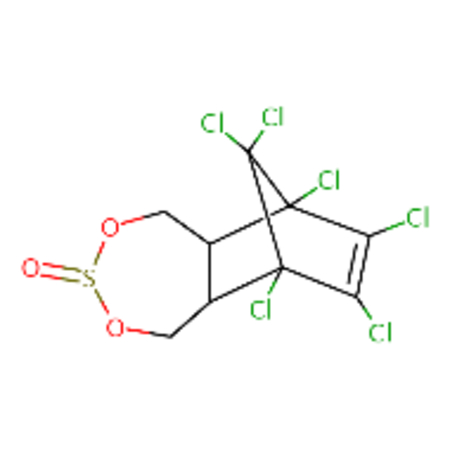 |
DTXSID4057974 | 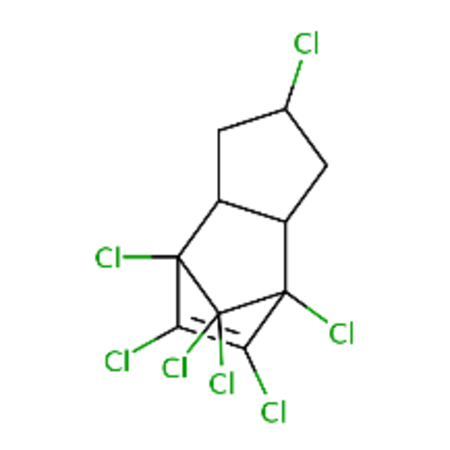 |
0.84 | 2.48 |
| DTXSID1020560 | 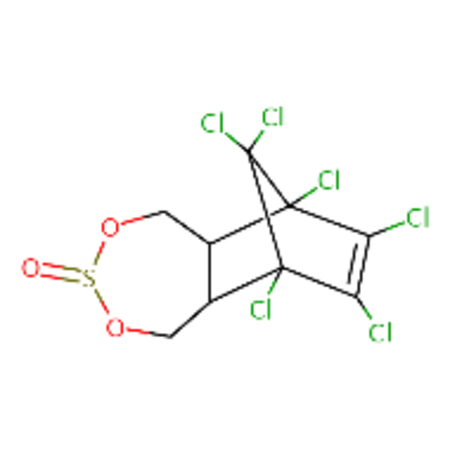 |
DTXSID7027750 | 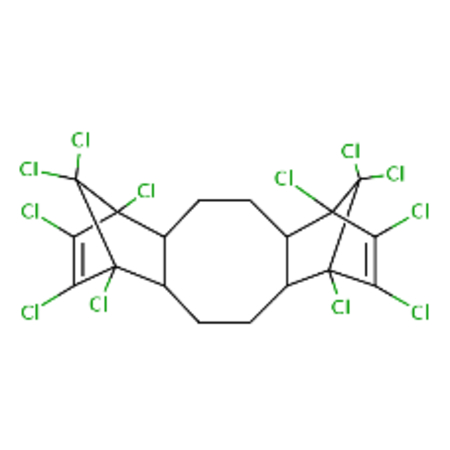 |
0.89 | 2.94 |
| DTXSID1020568 | 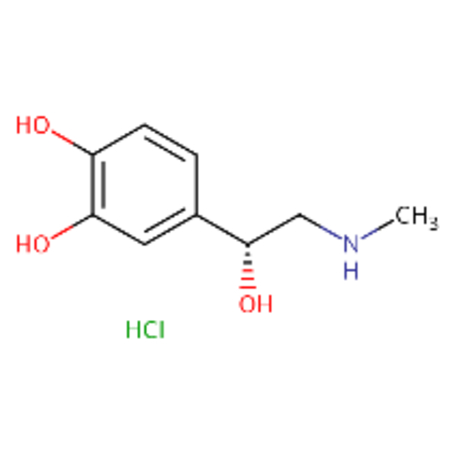 |
DTXSID8048529 | 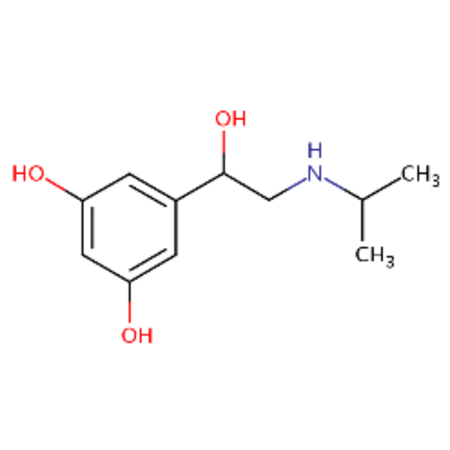 |
0.81 | 2.16 |
| DTXSID1022053 | 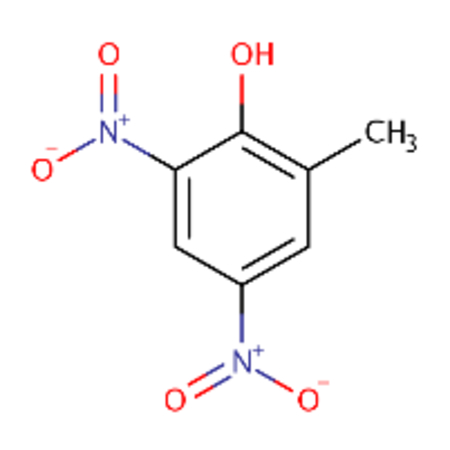 |
DTXSID0026961 | 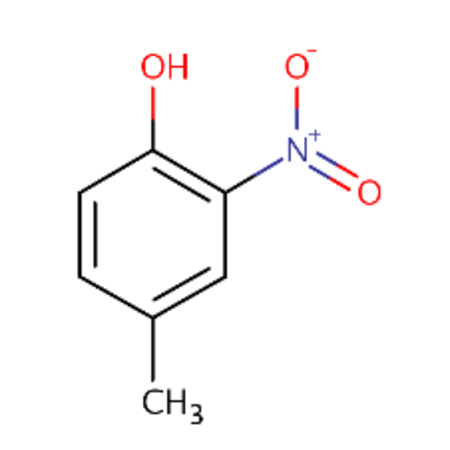 |
1 | 2.79 |
| DTXSID1022053 |  |
DTXSID2062535 | 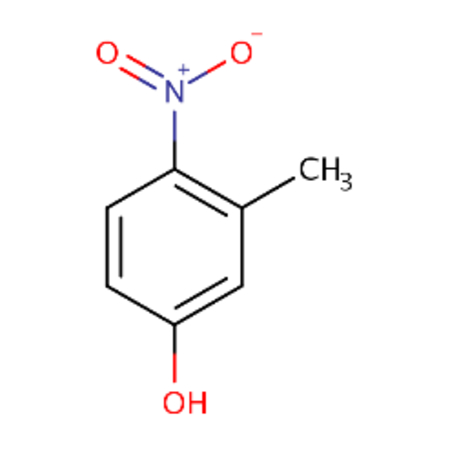 |
1 | 2.35 |
| DTXSID1023998 | 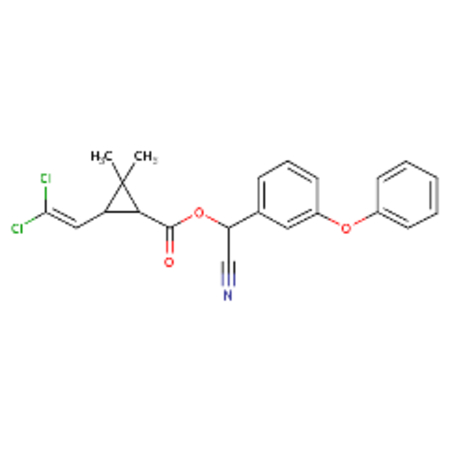 |
DTXSID8058168 | 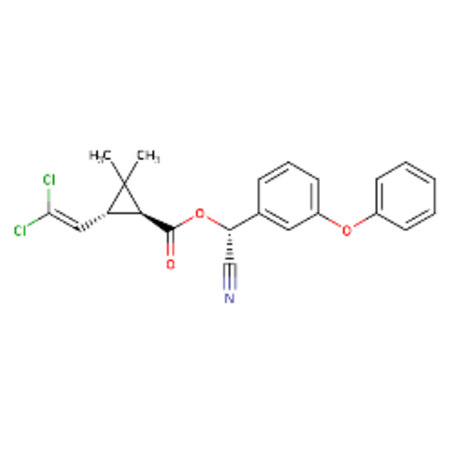 |
1 | 2.14 |
Table 6.
Twenty selected activity cliff pairs identified based on Morgan fingerprints
| DTXSID | Structure | DTXSID | Structure | Pairwise_Similarity | Activity_difference |
|---|---|---|---|---|---|
| DTXSID00155408 | 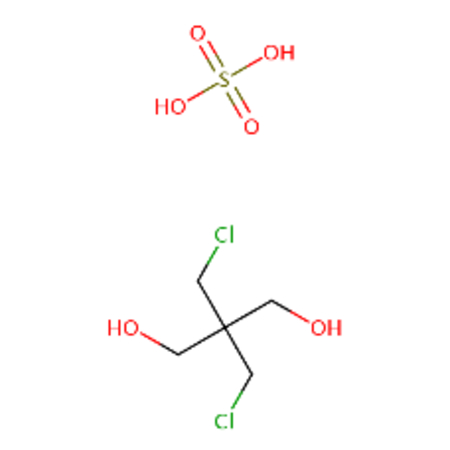 |
DTXSID40176591 | 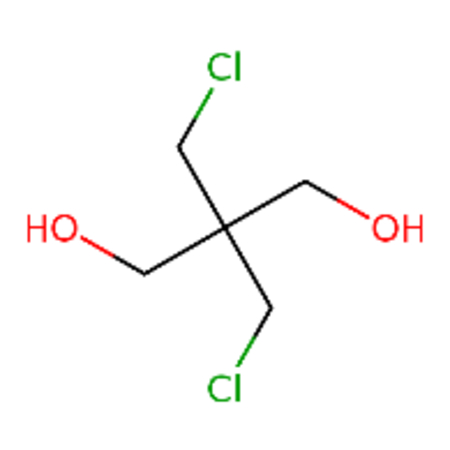 |
1 | 2 |
| DTXSID00162132 | 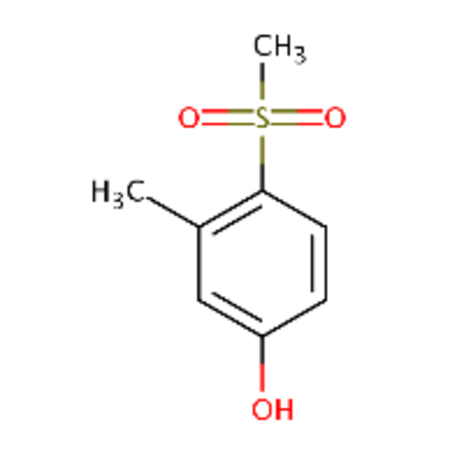 |
DTXSID40161482 | 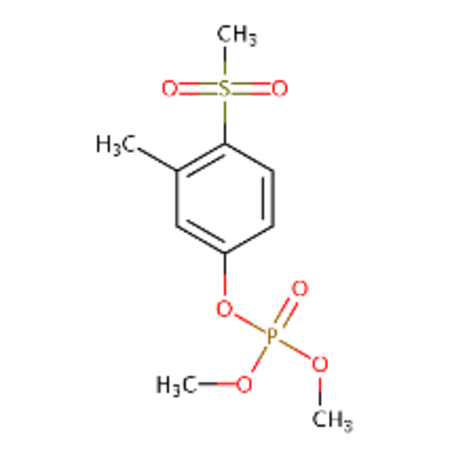 |
0.82 | 2.57 |
| DTXSID00168235 | 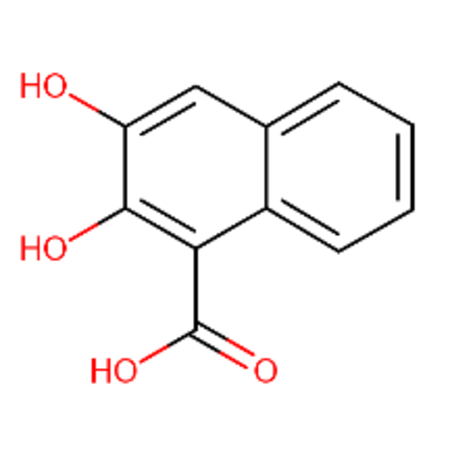 |
DTXSID4021218 | 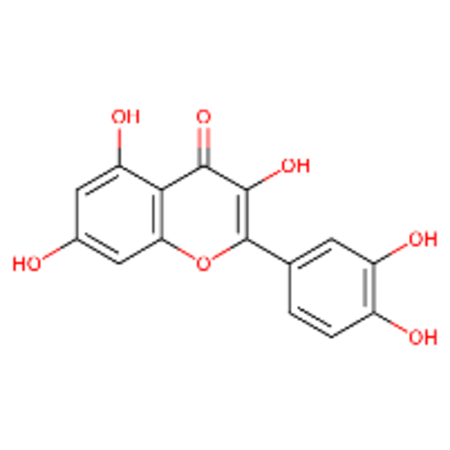 |
0.81 | 2.35 |
| DTXSID00178137 | 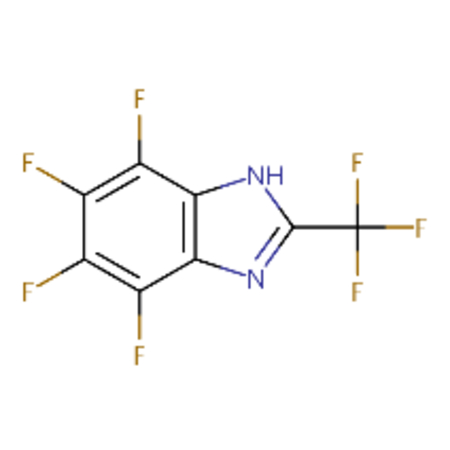 |
DTXSID30237685 | 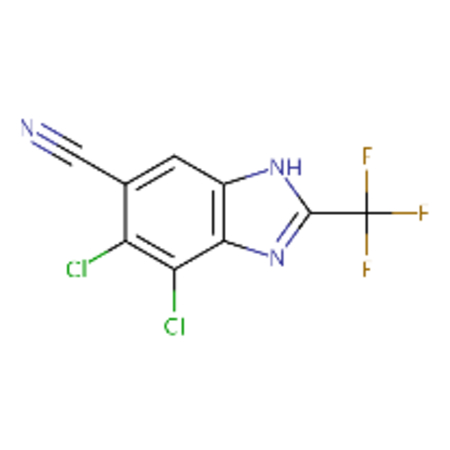 |
0.93 | 3.04 |
| DTXSID00185129 | 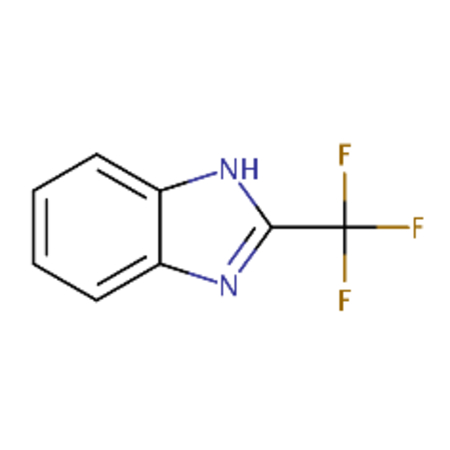 |
DTXSID30177936 | 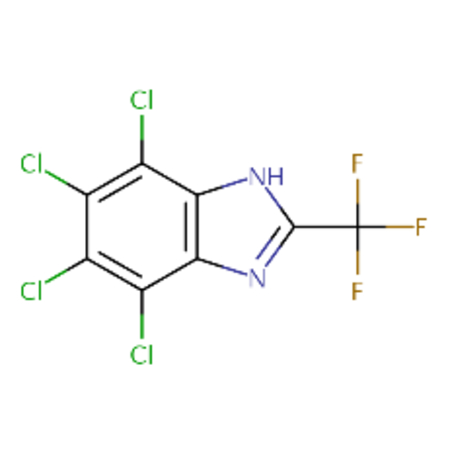 |
0.86 | 2.3 |
| DTXSID00195107 |  |
DTXSID30237685 | 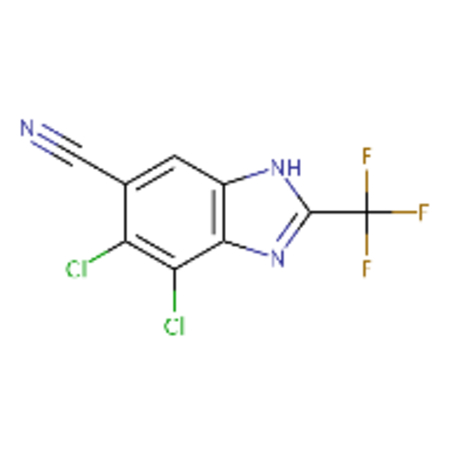 |
0.9 | 3.14 |
| DTXSID00199362 | 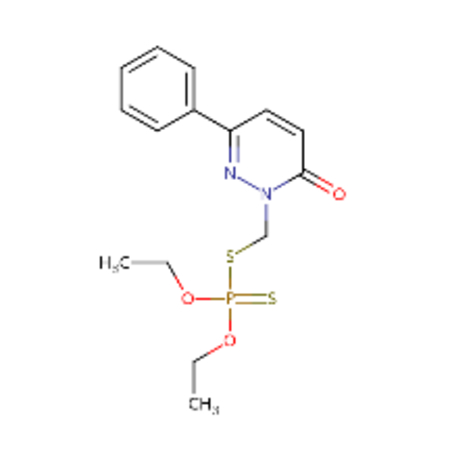 |
DTXSID10199353 |  |
0.95 | 2.25 |
| DTXSID00199362 | 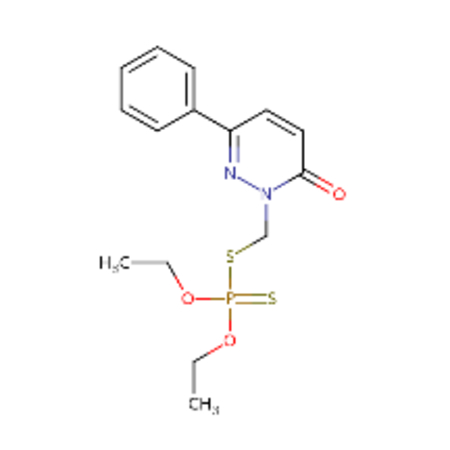 |
DTXSID20199384 | 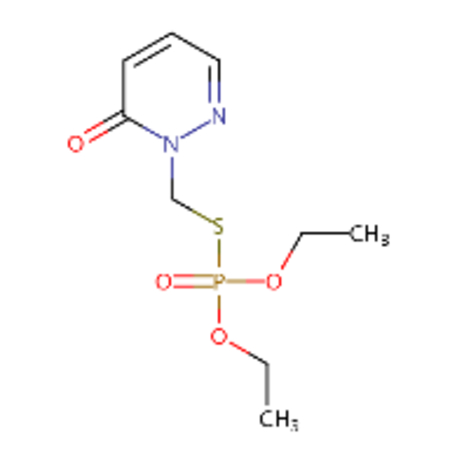 |
0.89 | 2.32 |
| DTXSID00199362 | 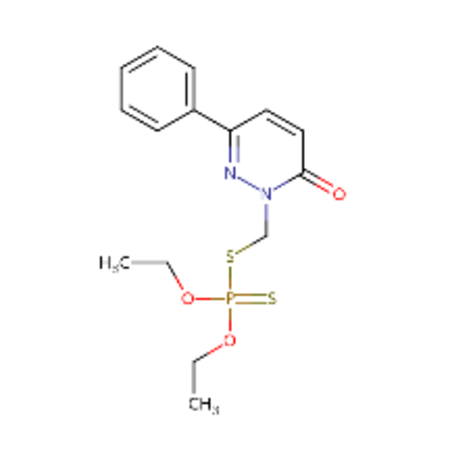 |
DTXSID3020122 | 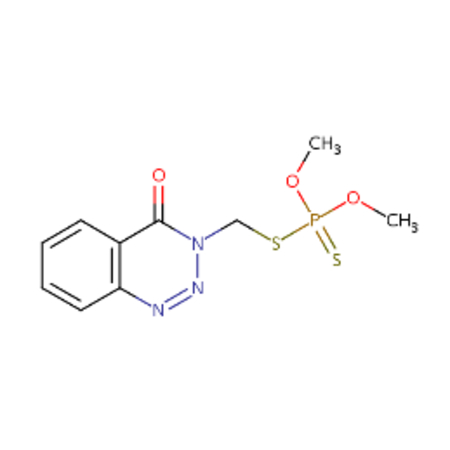 |
0.82 | 2.01 |
| DTXSID00199362 | 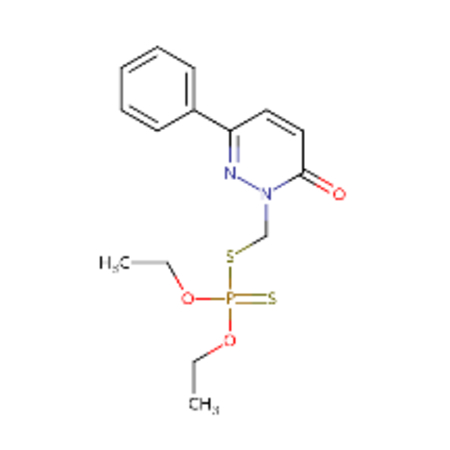 |
DTXSID50199352 | 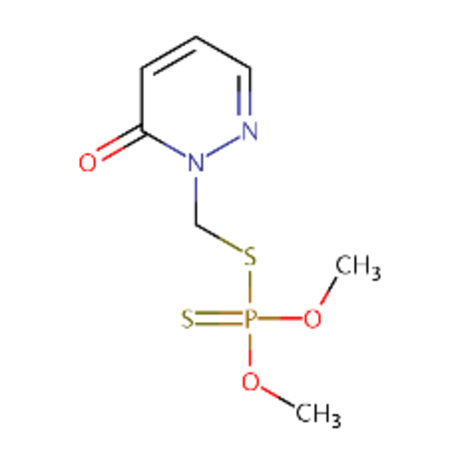 |
0.85 | 2.06 |
| DTXSID00199367 | 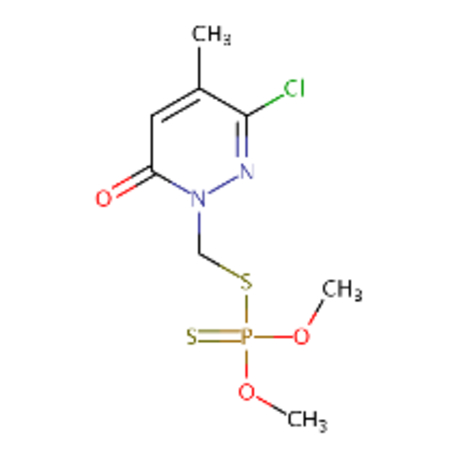 |
DTXSID30199416 | 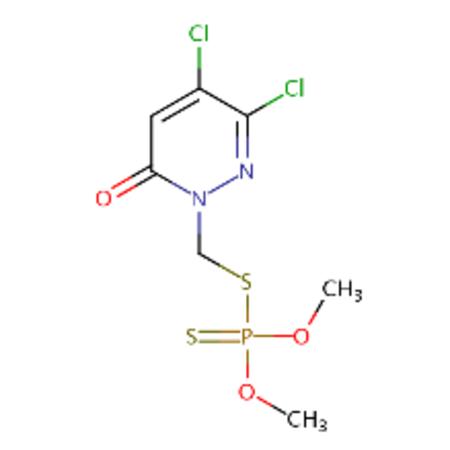 |
0.98 | 2.24 |
| DTXSID00199367 | 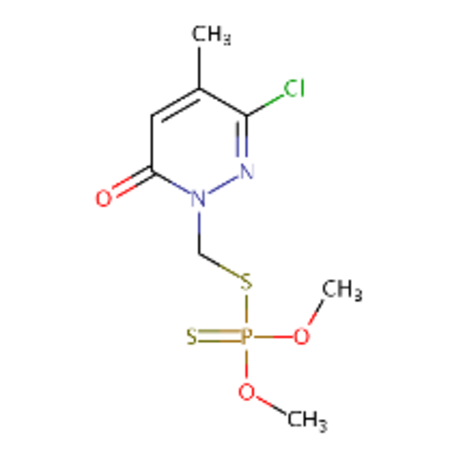 |
DTXSID40199361 |  |
0.87 | 2.42 |
| DTXSID00199367 | 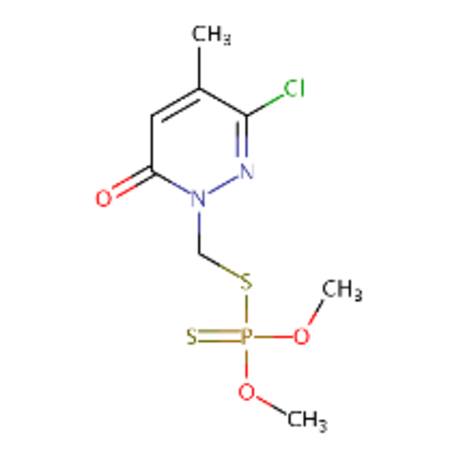 |
DTXSID60199363 | 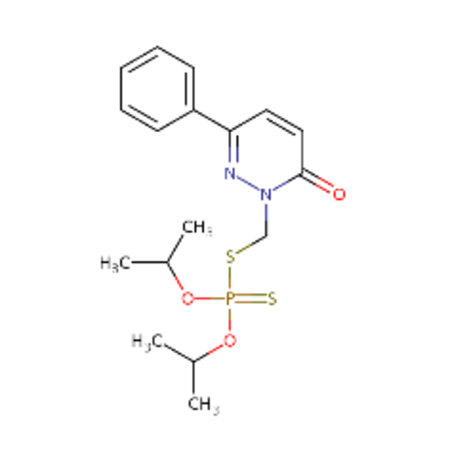 |
0.83 | 2.48 |
| DTXSID00201858 | 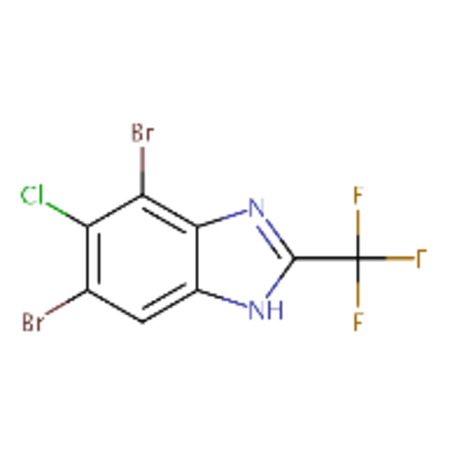 |
DTXSID30237685 | 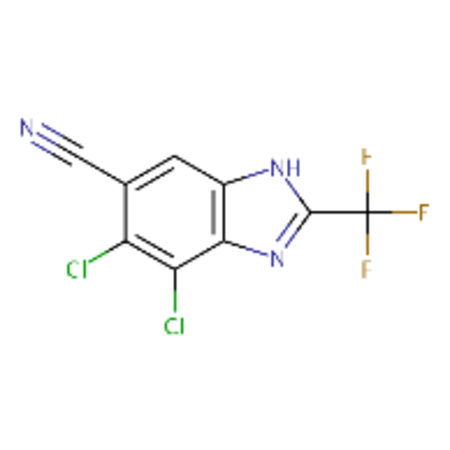 |
0.93 | 2.8 |
| DTXSID00204561 | 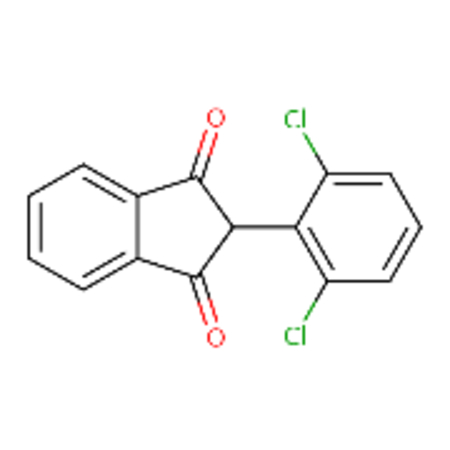 |
DTXSID2032348 | 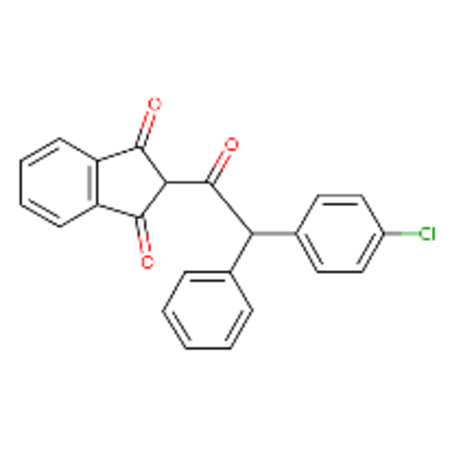 |
0.92 | 2.46 |
| DTXSID0020494 | 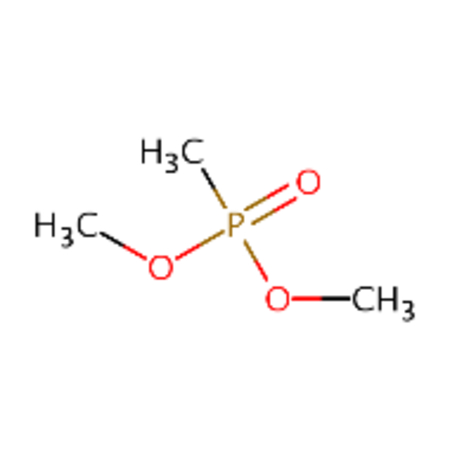 |
DTXSID50229981 | 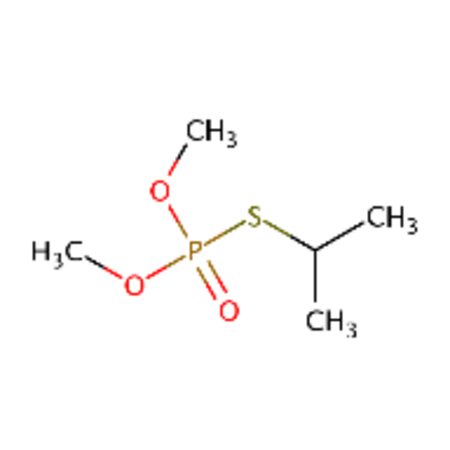 |
0.81 | 2.05 |
| DTXSID0020494 |  |
DTXSID90164928 | 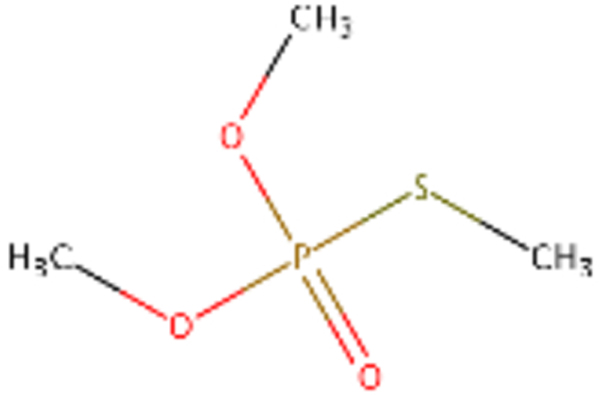 |
0.85 | 2.84 |
| DTXSID0020523 | 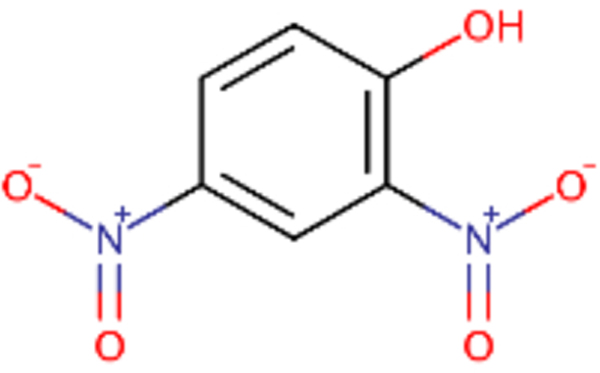 |
DTXSID0026961 | 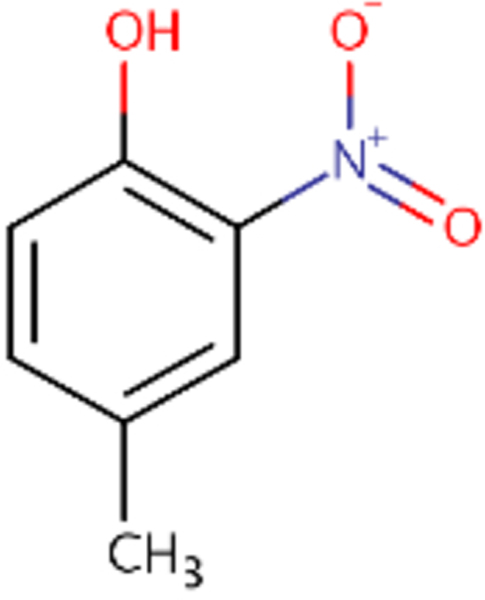 |
0.87 | 2.13 |
| DTXSID0020523 | 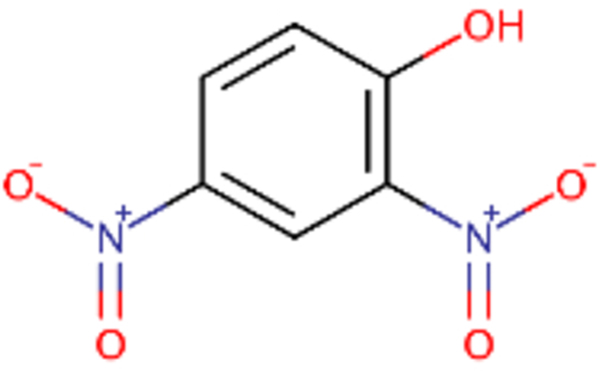 |
DTXSID4025161 | 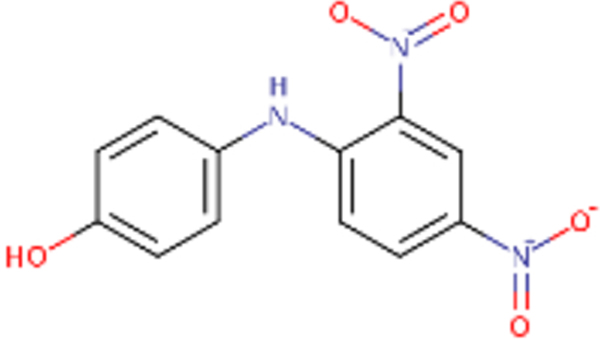 |
0.82 | 2.54 |
Cypermethrin and theta-cypermethrin were one example of a chemical pair with high ToxPrint similarity yet a large difference in LD50. These substances are stereoisomers of each other where cypermethrin [DTXSID1023998] has a reported LD50 of 36 mg/kg whereas theta-cypermethrin a LD50 of >5000 mg/kg. 2-octanone [DTXSID4021927] and 2-hexanone [DTXSID0022068] differ only in their chain length yet 2-octanone was reported as acutely toxic with a LD50 of 9 mg/kg in this dataset whereas 2-hexanone was reported as non toxic with a LD50 of 2590 mg/kg. Different chemical pairs were identified using Morgan fingerprints, DTXSID00199362 and DTX10199353 differed only by the addition of a phenyl ring yet this led to a dramatic shift in acute toxicity, LD50 of 555 mg/kg compared with 2.5 mg/kg.
Common structural moieties contributed to the high similarities but these masked differences in chemistry that could account for the large differences in the toxicity observed. Incorporating other aspects of similarity such as reactivity and metabolic similarity should help to resolve these differences, and this is the subject of our ongoing research. That said, the number of chemical pairs that fell within the activity cliff quadrant was low relative to the total number of chemical pairs captured. For the Morgan fingerprints, the number of chemicals that fell within the activity cliff region (based on the thresholds set) only represented a tiny proportion (0.0016%, 744/47,941,776) of the complete SAS map and this proportion was even lower for the ToxPrints (0.00034%, 162/48,163,600). This suggests that the chemical fingerprints on the whole were able to capture sufficient information to make reasonable predictions of acute oral toxicity.
3.4. Illustrative prototypical prediction
Table 7 lists the neighbourhood identified using k=10 and s=0.5 for the target chemical, tetraethylene glycol diacrylate, as well as their experimental LD50 and GenRA predicted LD50 values. All identified source analogues were also acrylates. The experimental LD50 value for trimethylene glycol diacrylate was 813 mg/kg compared with the GenRA prediction of 852 mg/kg, demonstrating good agreement.
Table 7.
Neighborhood for target chemical: Trimethylene glycol diacrylate
| Name | CAS | Similarity | Expt LD50 (log molar | Expt LD50 (mg/kg) |
|---|---|---|---|---|
| Trimethylene glycol diacrylate (target) | 17831-71-9 | 1.0 | −0.4296 | 813 (GenRA prediction 813) |
| Triethylene glycol diacrylate | 1680-21-3 | 1.0 | −0.2890 | 500 |
| Diethylene glycol diacrylate | 4074-88-8 | 0.958 | −0.0671 | 250 |
| 2-Ethoxyethyl acrylate | 106-74-1 | 0.733 | −0.8705 | 1070 |
| Ethylene acrylate | 2274-11-5 | 0.72 | −0.2463 | 300 |
| 2-Methoxyethyl acrylate | 3121-61-7 | 0.633 | −0.4920 | 404 |
| 2-Hydroxyethyl acrylate | 818-61-1 | 0.533 | −0.6739 | 548 |
| 1,4-Butanediol diacrylate | 1070-70-8 | 0.533 | −0.4715 | 587 |
| 2-Chloroethyl acrylate | 2206-89-5 | 0.516 | −0.1264 | 180 |
| Butyl acrylate | 141-32-2 | 0.515 | −0.8465 | 900 |
| 2-(Dimethylamino)ethyl acrylate | 2439-35-2 | 0.5 | −0.5021 | 4565 |
4. Conclusions
GenRA was originally developed to establish a baseline for read-across performance [7]. In the present manuscript, the GenRA methodology was adapted to be used to predict LD50 values for a large dataset of acute rat oral studies. The analysis estimated the ‘global’ performance of GenRA for predicting acute oral toxicity LD50 values to be reasonable, R2 of 0.61 (for up to k = 10 and minimum s = 0.05). This was comparable with other published acute toxicity read-across models. Performance was then explored on the basis of local neighbourhoods (so-named ‘local’ performance) firstly using the acute toxicity profiler from the OECD Toolbox and secondly using clusters extracted on the basis of ToxPrint chemotypes. The acute toxicity profiler from the OECD Toolbox was found to have low coverage for the dataset under study with the vast majority of chemicals being not categorised. In contrast, 100 clusters were extracted for the dataset of which 19 clusters were found to have improved performance (R2>0.61) relative to the ‘global’ performance, in some cases up to 0.9. Structure-activity similarity (SAS) maps were also constructed using 2 different chemical fingerprints and identifying chemical pairs that fell within the region of activity cliffs based on specific thresholds. The number of chemical pairs in this region formed a small proportion of the overall SAS. Whilst these could be improved based on incorporating other similarity contexts, their low number reaffirmed how structural fingerprints alone had given rise to reasonable GenRA predictions. This is supported by the comparable performance for GenRA relative to other models and read-across approaches that have been published using chemical structural features. Overall, the extension of GenRA was found to be useful for accurately predicting LD50 values.
Supplementary Material
Table 4.
Membership of cluster 59
| DTXSID | Experimental LD50_mg/kg | Predicted LD50_mg/kg | avg_similiarity (s) | k |
|---|---|---|---|---|
| DTXSID90165677 | 14.1 | 13.51 | 0.72 | 3 |
| DTXSID50165678 | 18.28 | 11.87 | 0.71 | 3 |
| DTXSID10165679 | 15.3 | 12.74 | 0.66 | 3 |
| DTXSID1042574 | 9800 | 2600 | 1 | 1 |
| DTXSID0042583 | 2600 | 9800 | 1 | 1 |
| DTXSID3023471 | 4.5 | 15.88 | 0.59 | 3 |
| DTXSID7057860 | 255 | 255 | 0.98 | 1 |
| DTXSID1046639 | 255 | 255 | 0.98 | 1 |
| DTXSID50238533 | 396 | 862 | 0.98 | 1 |
| DTXSID8045195 | 862 | 396 | 0.98 | 1 |
Highlights.
GenRA was extended to make quantitative read-across predictions
Predictions of LD50 values were made using a dataset of acute rat oral toxicity
‘Global’ performance metrics included a R2 value of 0.61 and RMSE of 0.58
Cross validated R2 values ranged from 0.47 to 0.62
‘Local’ performance across chemical clusters found R2 values improved up to 0.91.
Acknowledgements
The authors wish to thank in particular Agnes Karmaus, ILS and Nicole Kleinstreuer, NICEATM for their extensive contributions to the work of the ICCVAM ATWG that resulted in the availability of the acute oral rat dataset.
Footnotes
Disclaimer
The views expressed in this article are those of the authors and do not necessarily represent the views or policies of the U.S. Environmental Protection Agency.
Conflicts of interests
No conflicts of interest are declared.
References
- [1].European Commission (EC). 2006. Regulation (EC) No 1907/2006 of the European Parliament and of the Council of 18 December 2006 concerning the Registration, Evaluation, Authorisation and Restriction of Chemicals (REACH), establishing a European Chemicals Agency, amending Directive 1999/45/EC and repealing Council Regulation (EEC) No 793/93 and Commission Regulation (EC) No 1488/94 as well as Council Directive 76/769/EEC and Commission Directives 91/155/EEC, 93/67/EEC, 93/105/EC and 2000/21/EC. Off. J. Eur. Union L396/1 (2006). [Google Scholar]
- [2].Patlewicz G, Lizarraga L, Rua D, Allen D, Daniel A, Fitzpatrick S, Garcia-Reyero N, Gordon J, Hakkinen P, Howard A, Karmaus A, Matheson J, Mumtaz M, Richarz A-N, Ruiz P, Scarano L, Yamada T, Kleinstreuer N. Exploring Current Read-across Applications and Needs Among Selected U.S. Federal Agencies. Regul Toxicol Pharmacol. 106 (2019) 197–209. doi: 10.1016/j.yrtph.2019.05.011. [DOI] [PMC free article] [PubMed] [Google Scholar]
- [3].EPA. 2018. Working Together FY 2018–2022 US EPA Strategic Plan February 2018. Accessible at: https://www.epa.gov/sites/production/files/2018-02/documents/fy-2018-2022-epa-strategic-plan.pdf
- [4].Patlewicz G, Cronin MTD, Helman G, Lambert JC, Lizarraga LE, Shah I. Navigating through the minefield of read-across frameworks: A commentary perspective. Computational Toxicology 6 (2018) 39–54. doi: 10.1016/j.comtox.2018.04.002 [DOI] [Google Scholar]
- [5].Benfenati E, Belli M, Borges T, Casimiro E, Cester J, Fernandez A, Gini G, Honma M, Kinzl M, Knauf R, Manganaro A, Mombelli E, Petoumenou MI, Paparella M, Paris P, Raitano G. Results of a round-robin exercise on read-across. SAR QSAR Environ Res. 27(5) (2016) 371–384. doi: 10.1080/1062936X.2016. [DOI] [PubMed] [Google Scholar]
- [6].Low Y, Sedykh A, Fourches D, Golbraikh A, Whelan M, Rusyn I, Tropsha A. Integrative chemical-biological read-across approach for chemical hazard classification, Chem. Res. Toxicol. 26 (2013) 1199–1208. [DOI] [PMC free article] [PubMed] [Google Scholar]
- [7].Shah I, Liu J, Judson RS, Thomas RS, Patlewicz G. Systematically evaluating read-across prediction and performance using a local validity approach characterized by chemical structure and bioactivity information, Regul. Toxicol. Pharmacol. 79 (2016) 12–24. 10.1016/j.yrtph.2016.05.008. [DOI] [PubMed] [Google Scholar]
- [8].Patlewicz G, Ball N, Booth ED, Hulzebos E, Zvinavashe E, Hennes C. Use of category approaches, read-across and (Q)SAR: general considerations. Regul. Toxicol. Pharmacol. 67 (2013) 1–12. 10.1016/j.yrtph.2013.06.002. [DOI] [PubMed] [Google Scholar]
- [9].Williams A, Grulke C, Edwards J, McEachran A, Mansouri K, Baker N, Patlewicz G, Shah I, Wambaugh J, Judson R. The CompTox Chemistry Dashboard – A Community Data Resource for Environmental Chemistry. J. Cheminformatics 9 (2017) 61. doi: 10.1186/s13321-017-0247-6 [DOI] [PMC free article] [PubMed] [Google Scholar]
- [10].Helman G, Shah I, Williams AJ, Edwards J, Dunne J, Patlewicz G. Generalized Read-Across (GenRA): A workflow implemented into the EPA CompTox Chemicals Dashboard. ALTEX (2019) doi: 10.14573/altex.1811292. [DOI] [PMC free article] [PubMed] [Google Scholar]
- [11].Helman G, Shah I, Patlewicz G. Extending the Generalised Read-Across approach (GenRA): A systematic analysis of the impact of physicochemical property information on read-across performance. Computational Toxicology 8 (2018) 34–50. 10.1016/j.comtox.2018.07.001 [DOI] [PMC free article] [PubMed] [Google Scholar]
- [12].ICCVAM (Interagency Coordinating Committee on the Validation of Alternative Methods). 2018. A Strategic Roadmap for Establishing New Approaches to Evaluate the Safety of Chemicals and Medical Products in the United States. Available: https://ntp.niehs.nih.gov/go/iccvam-rdmp. 10.22427/NTP-ICCVAM-ROADMAP2018 [DOI]
- [13].Strickland J, Clippinger AJ, Brown J, Allen D, Jacobs A, Matheson J, Lowit A, Reinke EN, Johnson MS, Quinn MJ Jr1, Mattie D, Fitzpatrick SC, Ahir S, Kleinstreuer N, Casey W. Status of acute systemic toxicity testing requirements and data uses by U.S. regulatory agencies. Regul Toxicol Pharmacol. 94 (2018) 183–196. doi: 10.1016/j.yrtph.2018.01.022. [DOI] [PMC free article] [PubMed] [Google Scholar]
- [14].Kleinstreuer NC, Karmaus A, Mansouri K, Allen D, Fitzpatrick J, Patlewicz G. Predictive Models for Acute Oral Systemic Toxicity: A Workshop to Bridge the Gap from Research to Regulation. Computational Toxicology 8 (2018) 21–24. doi: 10.1016/j.comtox.2018.08.002. [DOI] [PMC free article] [PubMed] [Google Scholar]
- [15].Lapenna S, Fuart-Gatnik M, Worth A. Review of QSAR Models and Software Tools for predicting Acute and Chronic Systemic Toxicity. JRC Scientific and Technical Reports. (2010) EUR 24639 EN. ISBN 978-92-79-18758-2 [Google Scholar]
- [16].Sazonovas A, Japertas P, Didziapetris R. Estimation of reliability of predictions and model applicability domain evaluation in the analysis of acute toxicity (LD50). SAR QSAR Environ Res. 21 (2010) 127–148. doi: 10.1080/10629360903568671. [DOI] [PubMed] [Google Scholar]
- [17].National Academies Press (NAS) Application of Modern Toxicology Approaches for Predicting Acute Toxicity for Chemical Defense. 2015. Committee on Predictive-Toxicology Approaches for Military Assessments of Acute Exposures; Committee on Toxicology; Board on Environmental Studies and Toxicology; Board on Life Sciences; Division on Earth and Life Studies; The National Academies of Sciences, Engineering, and Medicine; Washington (DC). [PubMed] [Google Scholar]
- [18].Enslein K. An overview of structure-activity relationships as an alternative to testing in animals for carcinogenicity, mutagenicity, dermal and eye irritation, and acute oral toxicity. Toxicol Ind Health 4 (1988) 479–498. [DOI] [PubMed] [Google Scholar]
- [19].Zhu H, Martin TM, Ye L, Sedykh A, Young DM, Tropsha A. Quantitative structure-activity relationship modeling of rat acute toxicity by oral exposure. Chem Res Toxicol. 22 (2009) 1913–1921. doi: 10.1021/tx900189p. [DOI] [PMC free article] [PubMed] [Google Scholar]
- [20].Alberga D, Trisciuzzi D, Mansouri K, Mangiatordi GF, Nicolotti O. Prediction of Acute Oral Systemic Toxicity Using a Multifingerprint Similarity Approach. Toxicol Sci. 167 (2019) 484–495. doi: 10.1093/toxsci/kfy255. [DOI] [PubMed] [Google Scholar]
- [21].Russo DP, Strickland J, Karmaus AL, Wang W, Shende S, Hartung T, Aleksunes LM, Zhu H. Nonanimal models for Acute Toxicity Evaluations: Applying Data-Driven Profiling and Read-across. Environ. Health Perspect. 127 (2019) 47001. doi: 10.1289/EHP3614 [DOI] [PMC free article] [PubMed] [Google Scholar]
- [22].Rogers D, Hahn M 2010. Extended-Connectivity Fingerprints. J. Chem. Inf. Model. 50 (2010) 742–752. [DOI] [PubMed] [Google Scholar]
- [23].RDKit: Open-source cheminformatics; http://www.rdkit.org
- [24].Yang C, Tarkhov A, Marusczyk J, Bienfait B, Gasteiger J, Kleinoeder T, Magdziarz T, Sacher O, Schwab CH, Schwoebel J, Terfloth L, Arvidson K, Richard A, Worth A, Rathman J. New publicly available chemical query language, CSRML, to support chemotype representations for application to data mining and modeling. J Chem Inf Model. 55 (2015) 510–528. doi: 10.1021/ci500667v. [DOI] [PubMed] [Google Scholar]
- [25].Jaccard P. Lois de distribution florale. Bulletin de la Socíeté Vaudoise des Sciences Naturelles 38 (1902) 67–130. [Google Scholar]
- [26].Jaccard P. The distribution of the flora in the alpine zone. New Phytologist 11 (1912) 37–50. [Google Scholar]
- [27].Xu QS, Liang YZ, Du YP Monte Carlo cross-validation for selecting a model and estimating the prediction error in multivariate calibration. J. Chemom. 18 (2004) 112–120. 10.1002/cem.858 [DOI] [Google Scholar]
- [28].Dimitrov SD, Diderich R, Sobanski T, Pavlov TS, Chankov GV, Chapkanov AS, Karakolev YH, Temelkov SG, Vasilev RA, Gerova KD, Kuseva CD, Todorova ND, Mehmed AM, Rasenberg M, Mekenyan OG QSAR Toolbox - workflow and major functionalities. SAR QSAR Environ. Res. 19 (2016) 1–17. [DOI] [PubMed] [Google Scholar]
- [29].Pérez-Villanueva J, Méndez-Lucio O, Soria-Arteche O, Medina-Franco JL Activity cliffs and activity cliff generators based on chemotype-related activity landscapes. Mol Divers. 19 (2015) 1021–1035. doi: 10.1007/s11030-015-9609-z. [DOI] [PubMed] [Google Scholar]
- [30].Hunter J, Dale D, Firing E, Droettboom M and the Matplotlib development team. 2012 – 2018 The Matplotlib development team. https://matplotlib.org/
- [31].Raevsky OA, Grigor’ev VJ, Modina EA, Worth AP Prediction of acute toxicity to mice by the Arithmetic Mean Toxicity (AMT) modelling approach. SAR QSAR Environ Res. 21 (2010) 265–275. doi: 10.1080/10629361003771025. [DOI] [PubMed] [Google Scholar]
- [32].Lagunin A, Zakharov A, Filimonov D, Poroikov V. QSAR Modelling of Rat Acute Toxicity. Mol Inform. 30 (2011) 241–250. doi: 10.1002/minf.201000151. [DOI] [PubMed] [Google Scholar]
- [33].Lu J, Peng J, Wang J, Shen Q, Bi Y, Gong L, Zheng M, Luo X, Zhu W, Jiang H, Chen K Estimation of acute oral toxicity in rat using local lazy learning. J Cheminform. 6 (2014) 26. doi: 10.1186/1758-2946-6-26. [DOI] [PMC free article] [PubMed] [Google Scholar]
- [34].Lei T, Li Y, Song Y, Li D, Sun H, Hou T. ADMET evaluation in drug discovery: 15. Accurate prediction of rat oral acute toxicity using relevance vector machine and consensus modeling. J Cheminform. 8 (2016) 6. doi: 10.1186/s13321-016-0117-7. [DOI] [PMC free article] [PubMed] [Google Scholar]
- [35].Xu Y, Pei J, Lai L. Deep Learning Based Regression and Multiclass Models for Acute Oral Toxicity Prediction with Automatic Chemical Feature Extraction. J Chem Inf Model. 57 (2017) 2672–2685. doi: 10.1021/acs.jcim.7b00244. [DOI] [PubMed] [Google Scholar]
Associated Data
This section collects any data citations, data availability statements, or supplementary materials included in this article.


