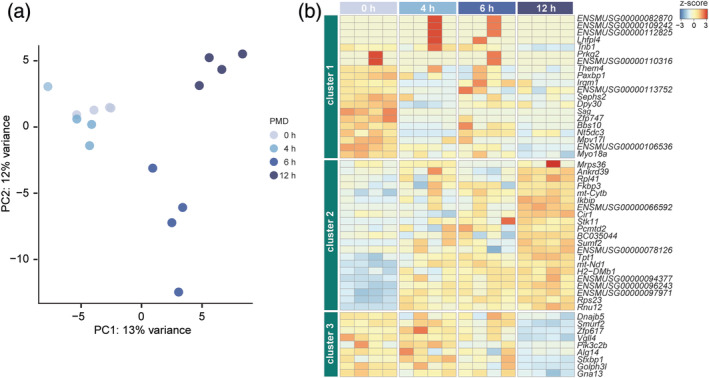
FIGURE 2.

The effect of postmortem delay (PMD) on the mouse microglia transcriptome. (a) PCA analysis of microglia samples with different PMD. Each dot represents a mouse (n = 4 per PMD interval). (b) Heatmap depicting row z‐scores of 50 PMD‐related genes in mouse microglia identified by pairwise comparisons with a cutoff q‐value < .1. Unsupervised hierarchical clustering resulted in three gene clusters
