

SUMMARY
Human endocannabinoid systems modulate multiple physiological processes mainly through the activation of cannabinoid receptors CB1 and CB2. Their high sequence similarity, low agonist selectivity, and lack of activation and G protein-coupling knowledge have hindered the development of therapeutic applications. Importantly, missing structural information has significantly held back the development of promising CB2-selective agonist drugs for treating inflammatory and neuropathic pain without the psychoactivity of CB1. Here, we report the cryoelectron microscopy structures of synthetic cannabinoid-bound CB2 and CB1 in complex with Gi, as well as agonist-bound CB2 crystal structure. Of important scientific and therapeutic benefit, our results reveal a diverse activation and signaling mechanism, the structural basis of CB2-selective agonists design, and the unexpected interaction of cholesterol with CB1, suggestive of its endogenous allosteric modulating role.
Graphical Abstract
In Brief
Structure and simulations of cannabinoid receptors CB2 and CB1 in their inactive, active-like, and activated signaling states reveal residue differences that may provide G protein selectivity, the distinct binding behavior of CB2 agonists in CB2 and CB1, as well as evidence for modulation of CB1 by cholesterol binding.
INTRODUCTION
Cannabinoid receptors CB1 and CB2 serve as key components of the endocannabinoid system and are the principal targets of Δ9-tetrahydrocannabinol (Δ9-THC), a psychoactive chemical from Cannabis sativa with a wide range of therapeutic applications (Lemberger, 1980). CB1 and CB2 play crucial roles in a variety of physiological processes, including appetite, pain sensation, memory, and immunomodulation (Guzmán, 2003). The two cannabinoid receptors share 44% total sequence identity and 68% sequence similarity in the transmembrane regions (Munro et al., 1993). However, they differ in their tissue distribution and exert distinct functions in endocannabinoid system, where CB1 and CB2 are expressed predominantly in the central nervous system and the immune system, respectively.
So far, several crystal structures of cannabinoid receptors have been determined, including antagonist-bound (Hua et al., 2016; Shao et al., 2016) and agonist-bound CB1 (Hua et al., 2017) as well as antagonist-bound CB2 structures (Li et al., 2019). While these structures have enhanced our understanding of the ligand induced inactive or active-like states, there are a number of important challenges that remain. First, the development of therapeutic applications has been hindered by difficulty in specifically modulating the individual cannabinoid receptors due to their high sequence similarity. Also, the absence of the agonist-bound CB2 structure has held back the development of CB2-selective agonists as high potential drug candidates for treating inflammatory and neuropathic pain without the psychoactivity of CB1 (Contino et al., 2017; Lunn et al., 2008).
Finally, CB2 and CB1 elicit their physiological responses by coupling primarily to Gi/o proteins to inhibit adenylate cyclase and cyclic AMP signaling, yet CB1 also couples with Gs (G protein-stimulating adenylate cyclase) or Gq/11 (G protein-activating phospholipase C and G protein-increasing cytosolic Ca2+) to instigate signaling under special circumstances (Glass and Felder, 1997; Lauckner et al., 2005). Although an indole-based synthetic cannabinoid MDMB-Fubinaca (FUB)-bound CB1-Gi structure was determined recently (Krishna Kumar et al., 2019), the activation and G protein-coupling mechanism underlying the two cannabinoid receptors CB2 and CB1 is still elusive.
Here, we have used single-particle cryoelectron microscopy (cryo-EM) and obtained the structures of agonist-bound CB2 and CB1 in complex with the heterotrimeric protein Gi as well as the crystal structure of agonist-bound CB2 by X-ray crystallography method. Together with our previously reported crystal structures of CB1 and CB2, we have, so far, determined structures of CB1 and CB2 in their inactive, active-like, and active states. Comparing the six cannabinoid receptor structures together with several other solved G protein-coupled receptor (GPCR) structures in complex with Gi/o, Gs, or G11 proteins, this study provides comprehensive insights into the diverse activation and means by which cannabinoid receptors couple to G proteins and opens up avenues for the rational design of new selective ligands, especially agonists, to precisely modulate the endocannabinoid systems.
RESULTS
Solution of CB2-Gi Cryo-EM Structure and Agonist-Bound CB2 Crystal Structure
To prepare the stable CB2-Gi (Gαiβγ) complexes for cryo-EM studies, we tried different modifications and ligands. Eventually, the expression level of CB2 receptor was improved by the insertion of BRIL protein at CB2’s N terminus. The stability of the CB2-Gi complex was achieved by co-expression of the receptor with the heterotrimeric Gi protein and the designed high-affinity (Ki = 0.37 nM for CB2) agonist AM12033 (Figure S1). The CB2-Gi complex was further stabilized by the addition of scFv16 (Koehl et al., 2018). Single-particle cryo-EM analysis of the frozen sample enabled us to obtain nominal global maps at 2.9 Å resolution for CB2-AM12033-GiscFv16 (Figure 1; Figure S2; Table S1). The ligand, receptor, and Gi in the isolated complex are clearly visible in the EM maps (Figure S2). Side chains of the majority of amino acid residues are well defined in all protein components (Figures S2C and S2D). Thus, the structure provides an accurate model of intermolecular interactions of CB2 with the agonist and Gi.
Figure 1. Cryo-EM Structures of the CB1-Gi and CB2-Gi Complexes.
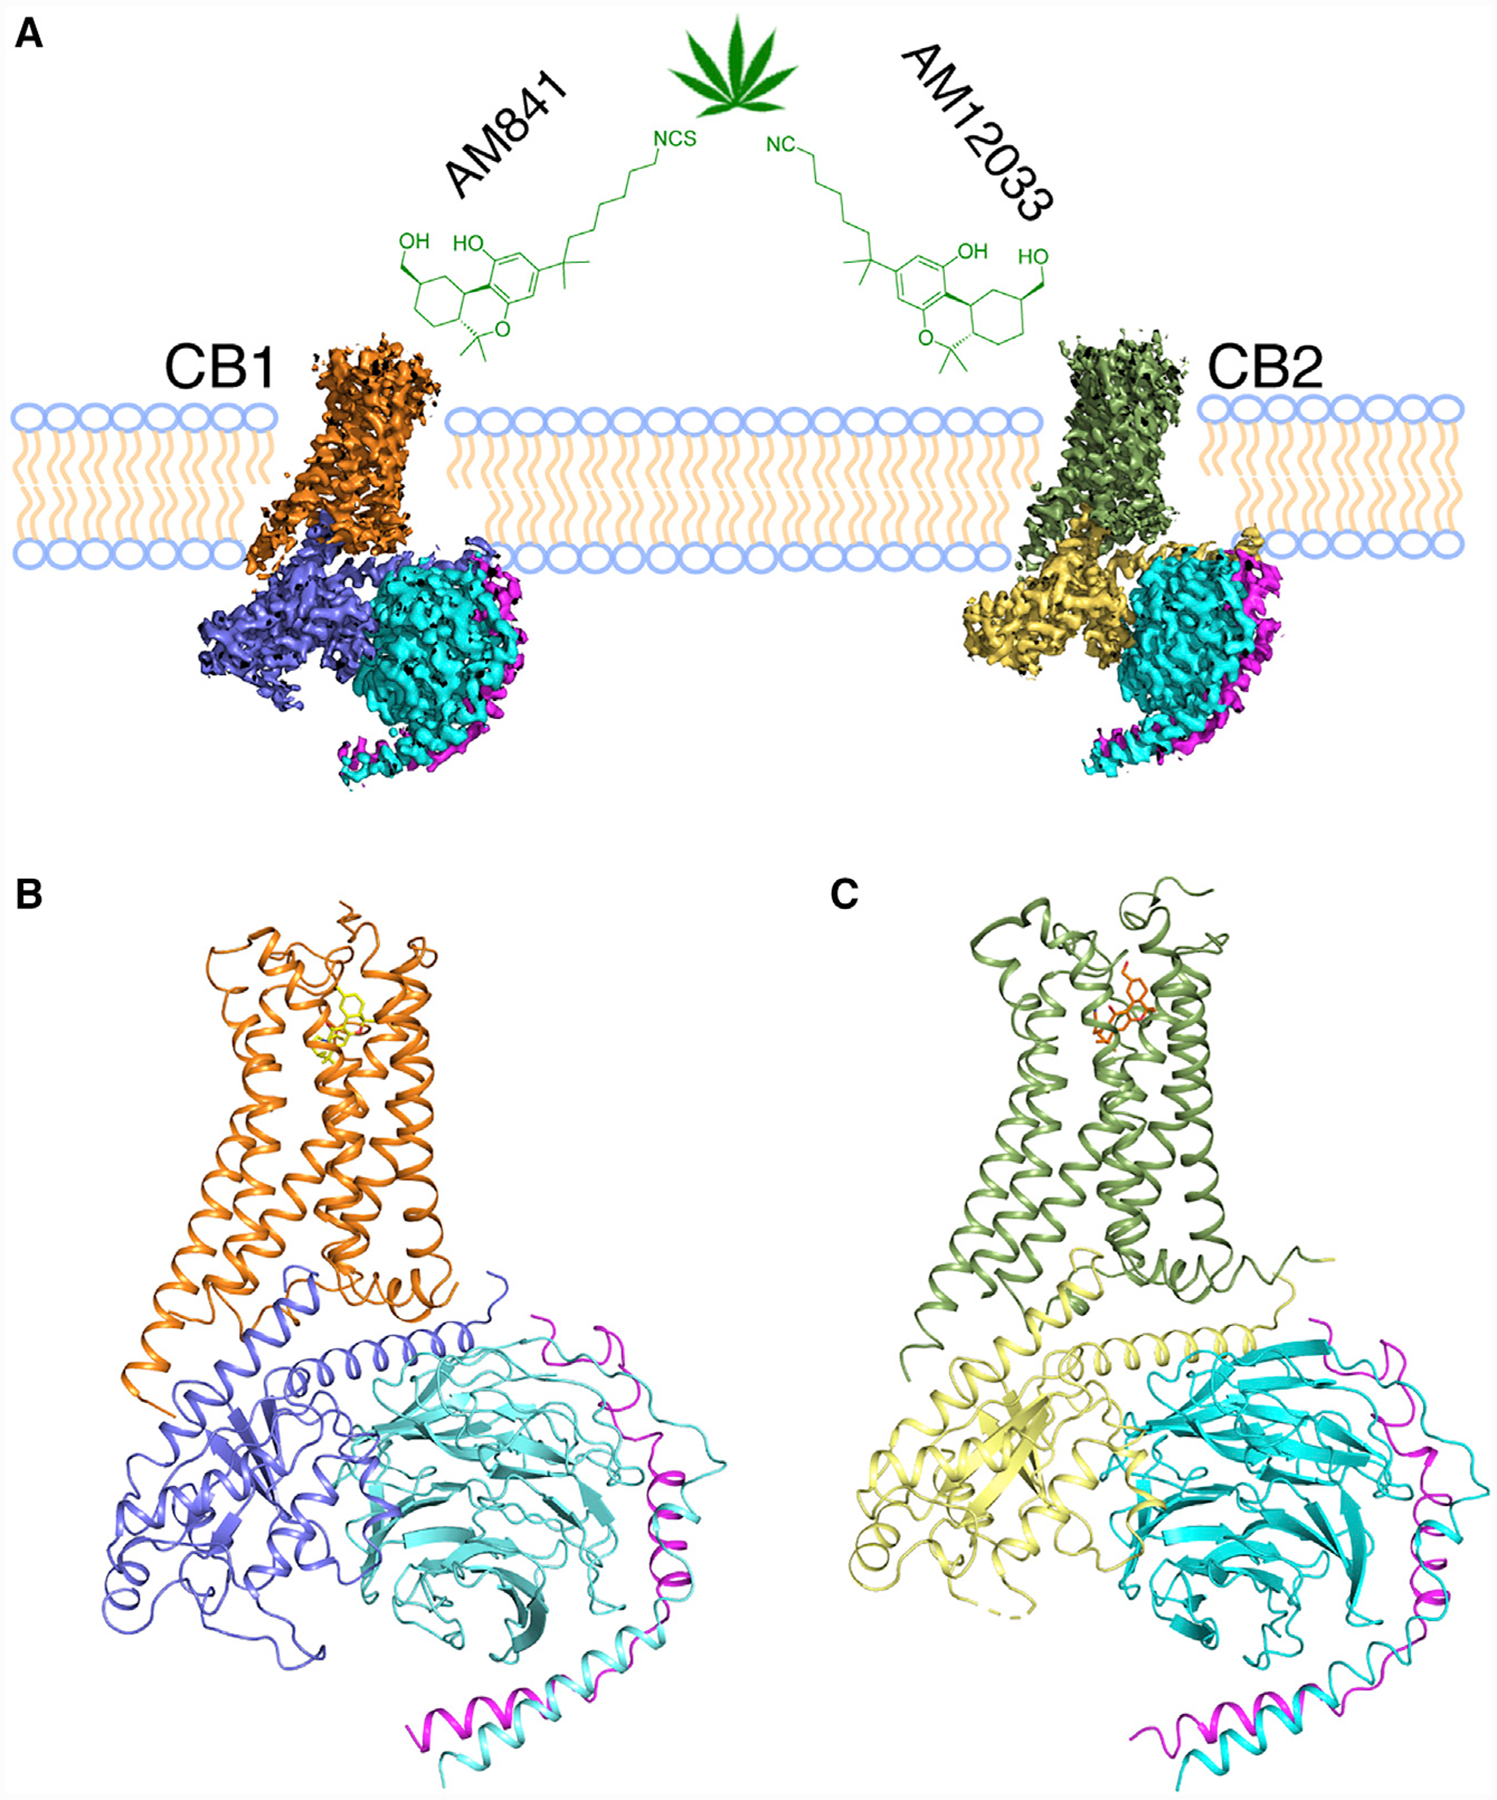
(A) Cryo-EM density maps of the CB1-Gi and CB2-Gi complexes, with colored subunits. Color code for the proteins is as follows: CB1, orange; CB2, green; Gαi in CB1, slate; Gαi in CB2, yellow; Gβ, cyan; Gγ, magenta.
(B and C) Cryo-EM structures of CB1-Gi (B) and CB2-Gi (C) complexes using same color code as in (A), with AM841 and AM10233 shown as yellow and orange sticks, respectively.
The same method was applied in obtaining the CB1-AM841-Gi-scFv16 complex cryo-EM structure at 3.0 Å resolution and the only differences is that the CB1-Gi complex was constituted in vitro from purified protein components using the THC-like cannabinoid agonist AM841(Hua et al., 2017) instead of in vivo co-expression for CB2-Gi complex. In addition, the agonist AM12033-bound CB2 crystal structure was also determined at 3.2 Å resolution (Table S2).
Overall Structure of CB2 Signaling Complex and Its Comparison with CB1-Gi Complex
The overall structure of the active CB2-Gi complex is similar to that of the active conformation of the CB1-Gi complex (Figure 2A), with root mean square deviation (RMSD) values of 1.65 Å for the whole complex, 1.26 Å for the receptors alone, and 0.41 Å for the Gi proteins. The N termini of both receptors adopt identical conformations, forming a short helix over the binding pocket. The binding poses of AM12033 in CB2 and AM841 in CB1 are superimposable. When comparing inactive and active states of CB2, we observe an outward movement of TM6 that is characteristic of receptor activation and an extension of TM5 that resulted in new interactions with Gαi (Figure 2B). Similar conformational changes are also observed in CB1-Gi complex structure (Figures S3A and S3B). These structural changes allow the G protein to engage with the receptor core. In addition, the conformations of critical residues for the receptor activation, such as d3.49R3.50Y3.51 and N7.49P7.50xxY7.53 motifs (superscripts indicate Ballesteros-Weinstein numbering for GPCRs [Ballesteros and Weinstein, 1995]), are almost identical between the active conformations of CB2 and CB1 (Figures S3C and S3D). Different from the large conformational changes of both extracellular and intracellular domains occurring from inactive to active states in CB1 (Figure S3B), the extracellular region, including the N terminus of CB2, undergoes very minor changes during its activation (Figures 2C and 2D).
Figure 2. Comparison of Cannabinoid Receptor Structures.
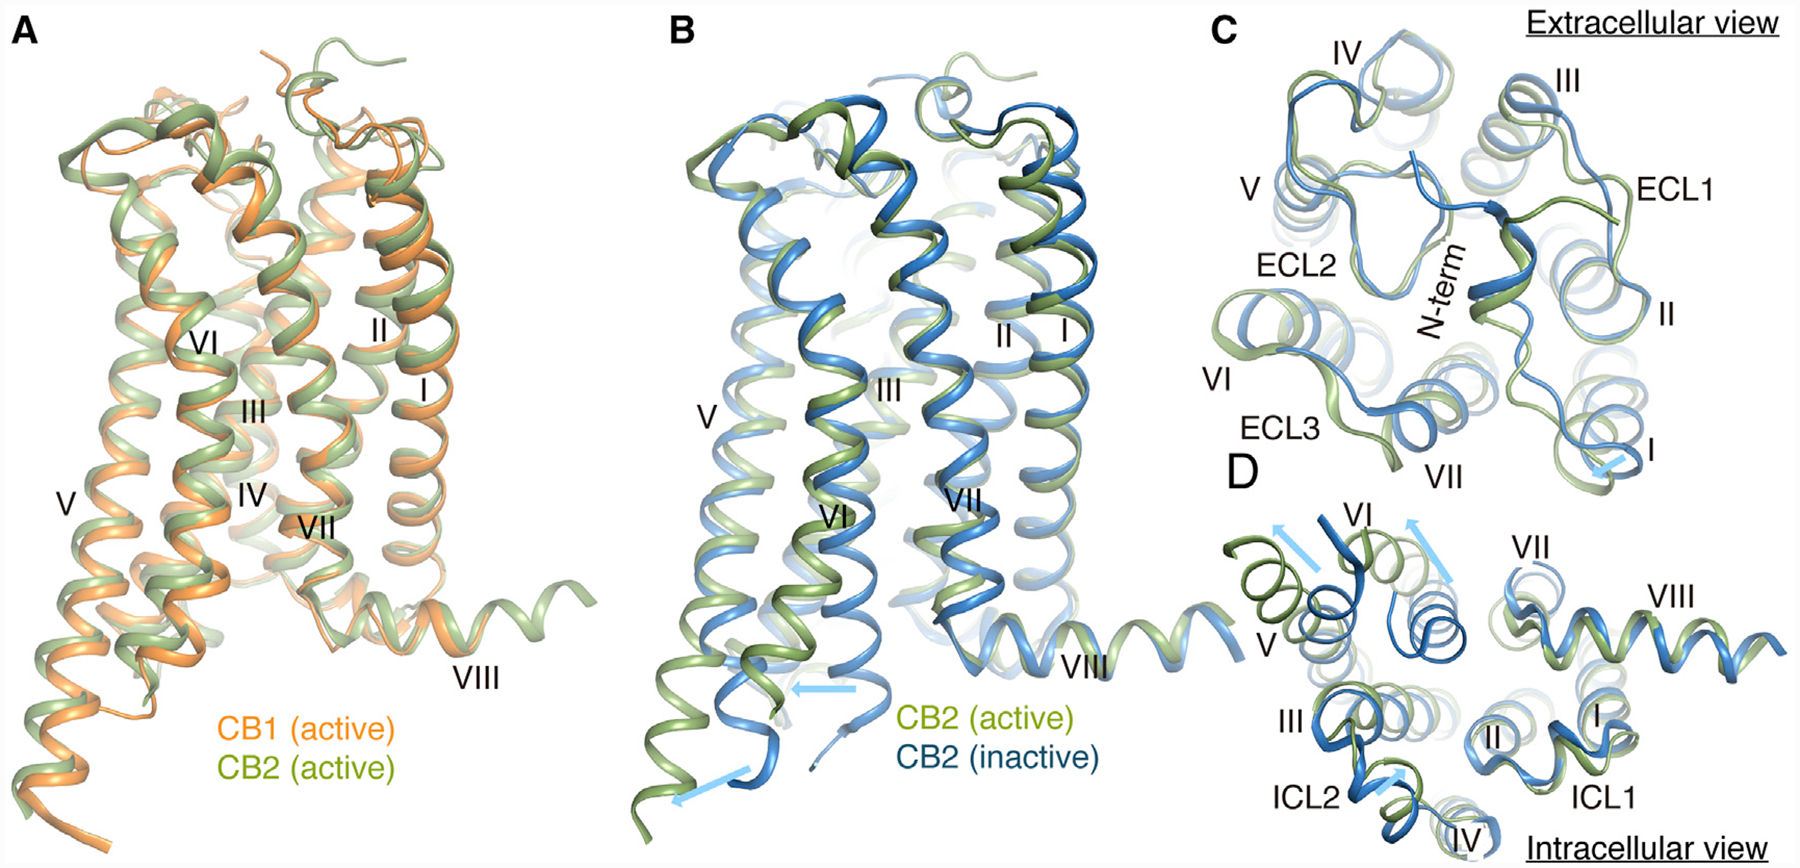
(A) Comparison of active CB1, orange; and CB2, green.
(B-D) Side (B), extracellular (C), and intracellular (D) comparison views of active, green; and inactive, sky blue (PDB: 5ZTY) CB2 structures. Conformational changes are indicated with blue arrows.
See also Figure S3.
The overall structure of the Gi heterotrimers in CB2 and CB1 complex structures is similar to those previously solved GPCR-Gi complexes (Figure S4). No electron density for guanosine diphosphate (GDP) is observed in the GDP-binding pocket, which is mainly formed by the β1-α1 loop (P loop) and the β6-α5 loop, suggesting that Gi is nucleotide-free in both receptor-Gi complex structures. The antibody scFv16 binds at a similar interface comprising of the αN helix of Gαi and the β-propeller of Gβ, as previously reported (Koehl et al., 2018).
The Interactions between CB2 and Gi
The structure of the CB2-Gi complex reveals a similar mode of interaction when compared with the CB1-Gi complex. The contacts between CB2 and Gi are extensively mediated through the Gαi subunit. The primary interaction interface is composed of TM3, TM5, TM6, and ICL2 of the receptor and the α5 helix, αN helix, and αN-β1 loop of the Gαi subunit (Figure 3A). Similar to other Gi-bound GPCRs, the two large hydrophobic side chains L353 and L348 of the α5 helix from Gαi are directed toward the hydrophobic pocket. For example, the hydrophobic pocket is formed by Val2125.61, Leu2436.33, Leu2476.37, Leu2396.29, and Leu1353.54 from the cytosolic ends of TM5, TM6, and TM3 of receptor (Figure 3B). However, compared to the μOR-, A1-, 5HT1B-, and M2-Gi complexes (Draper-Joyce et al., 2018; García-Nafría et al., 2018; Koehl et al., 2018; Maeda et al., 2019), the Gi proteins in CB2- and CB1-Gi complexes are observed to have a ~20° anticlockwise rotation (if viewed from intracellular to extracellular direction) when aligning all available receptor-G protein complex structures using CB2 structure as reference (Figures S4A and S4B). The orientation difference of the Gi proteins from CB2 and CB1 complexes may be attributed to the more extended TM5 of CB2 or CB1 where additional interactions with the α5 helix of Gαi are observed (Figure 3B). Specifically, residues Ser2225.71 and His2265.75 from CB2 or R3115.75 from CB1 formed new interactions with D337 and Q333 in α5 helix of Gαi. We hypothesize that the extra pulling force may serve to twist Gi into a more energy-favorable orientation in the CB2- and CB1-Gi complexes.
Figure 3. Comparison of CB1-Gi and CB2-Gi Binding Interfaces.
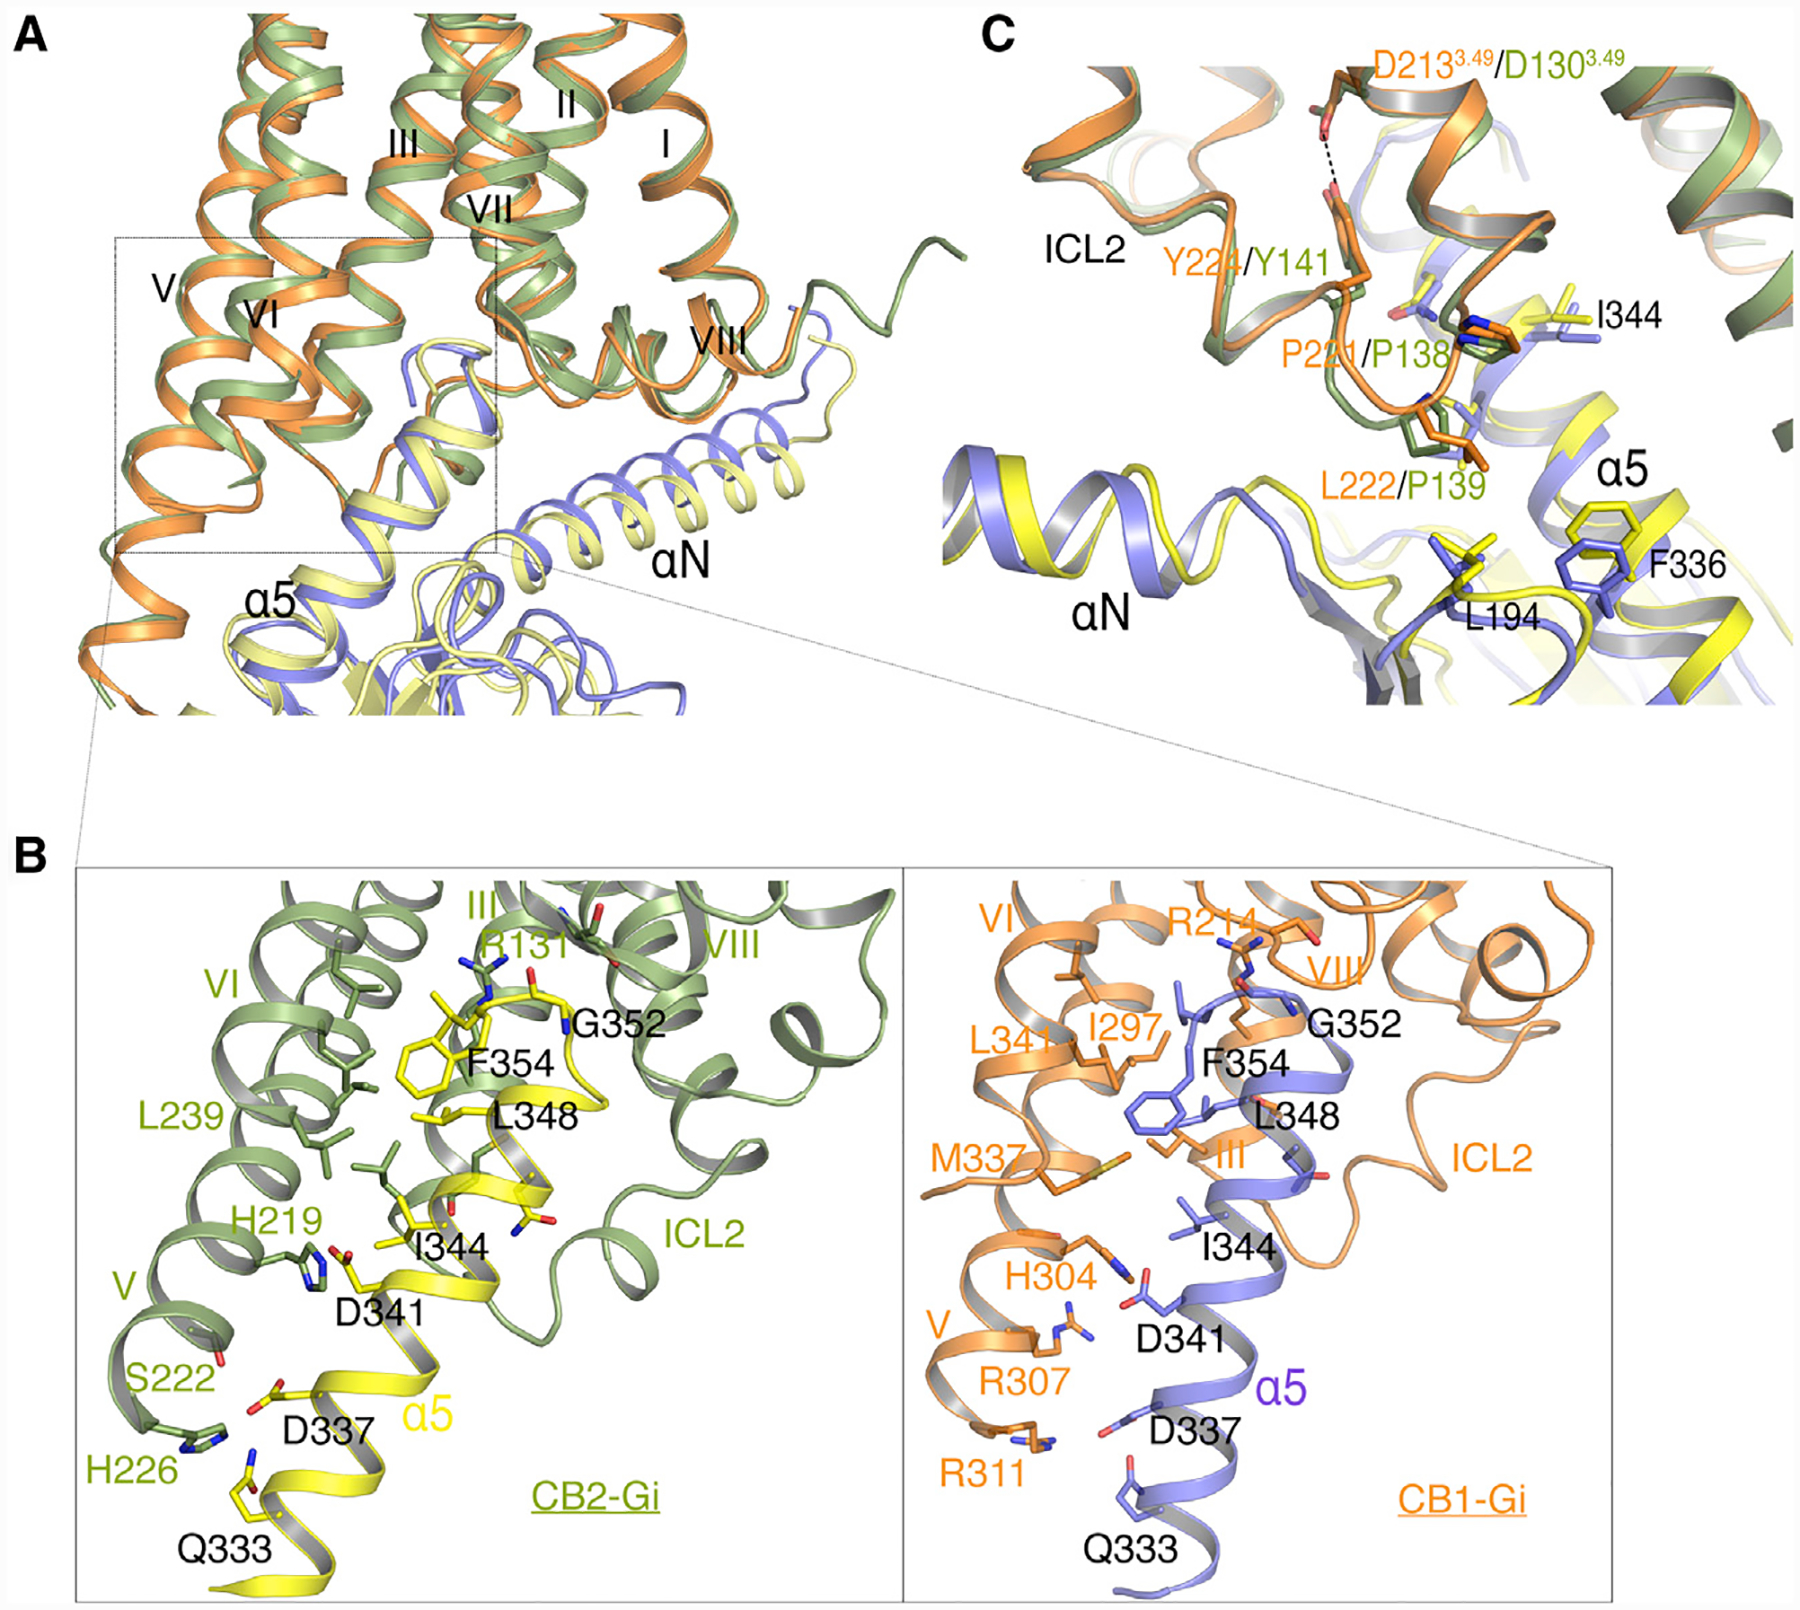
(A) Conformation comparison of the α5 helices (CB1-Gi, blue; CB2-Gi, yellow) in Gαi and receptors (CB1, orange; CB2, green) in CB1-Gi and CB2-Gi complexes when aligned on the receptors.
(B) Interactions between the α5 helix in Gαi and TM3, TM5, and TM6 in CB1 or CB2 (same color code).
(C) Interactions between Gαi and ICL2 of CB1 and CB2 (colors as in A).
See also Figure S4.
While CB1 and CB2 signal through Gi, CB1 is also known to couple with Gs or Gq. After careful inspection of the residues that are involved in the receptor-Gi interactions, L222ICL2 in CB1 is found in the proximity of L194 in the β2–β3 loop, as well as I344 in α5 helix of Gαi, which established weak interactions between CB1 and Gi (Figure 3C). In contrast, equivalent residue to L222ICL2 in CB2 is P139ICL2, which is unique in class A GPCRs and not involved in the interaction with Gi (Figure 3C). Previous studies have shown that the P139ICL2 mutation of P139F, P139M, or P139L enabled CB2 to couple with Gs protein (Zheng et al., 2013). In addition, the L222ICL2 (CB1) equivalent residue F139ICL2 in the β2AR-Gs structure forms extensive hydrophobic interactions with a pocket consisting of α5 helix, β2–β3 loop, and β1 strand in Gαs (Figures S4E and S4F) (Maeda et al., 2019). In agreement, L222F mutation in CB1 has been shown to increase CB1-Gs basal activity (Chen et al., 2010b; Krishna Kumar et al., 2019). Thus, we speculate that the residue L222ICL2 in CB1 facilitates its coupling with Gs, and likely Gq as well.
Concerning the interactions between ICL1, helix8 from CB2 and Gαi, we identified that Ser69 and Tyr70 in ICL1 form polar interactions with D305 in Gαi, which constrain the conformation of ICL1. In addition, ICL1 and helix8 of CB2 are in close proximity to the Gβ subunit, and the presence of multiple polar and charged amino acids at this interface suggests potential interactions.
AM12033-CB2 Interactions Unveiled by Cryo-EM and Crystal Structures
In the CB2-Gi complex, the agonist AM12033 adopts an L-shape conformation in the orthosteric binding pocket. The interactions between AM12033 and CB2 are mainly hydrophobic and aromatic, including residues from ECL2, TM3, TM5, TM6, and TM7 (Figure 4). The tricyclic tetrahydrocannabinol system of AM12033 forms π-π interactions with Phe183ECL2, Phe2817.35 and Phe942.64, and the phenolic hydroxyl at C1 forms a hydrogen bond with Ser2857.39. The alkyl chain of AM12033 extends into the long channel and forms hydrophobic interactions with residues from TM3, TM5, and TM6. Prior to solving cryo-EM CB2-Gi complex structure, we have already determined the AM12033-bound CB2 crystal structure at 3.2 Å resolution (Figure 4A) where the binding pose of AM12033 can be unambiguously defined, owing to the clear electron density in the orthosteric ligand-binding pocket. The competitive binding of AM12033 is in agreement with cyclic adenosine monophosphate (cAMP) functional assay (Figures S3E and S3F). The agonist AM12033 in both cryo-EM and crystal structures shares almost identical binding poses, and the surrounding residues take similar conformations as well (Figure S5A). Notably, the binding pockets of agonist AM12033 and antagonist AM10257 in CB2 share a high degree of similarity, as speculated in our previous report (Li et al., 2019) (Figure 4C), while the inward movements of extracellular parts of TM1, TM4, and TM7 produce a more compact agonist-binding pocket in CB2.
Figure 4. AM12033-Bound CB2 Crystal Structure and Interactions between AM12033 and CB2.
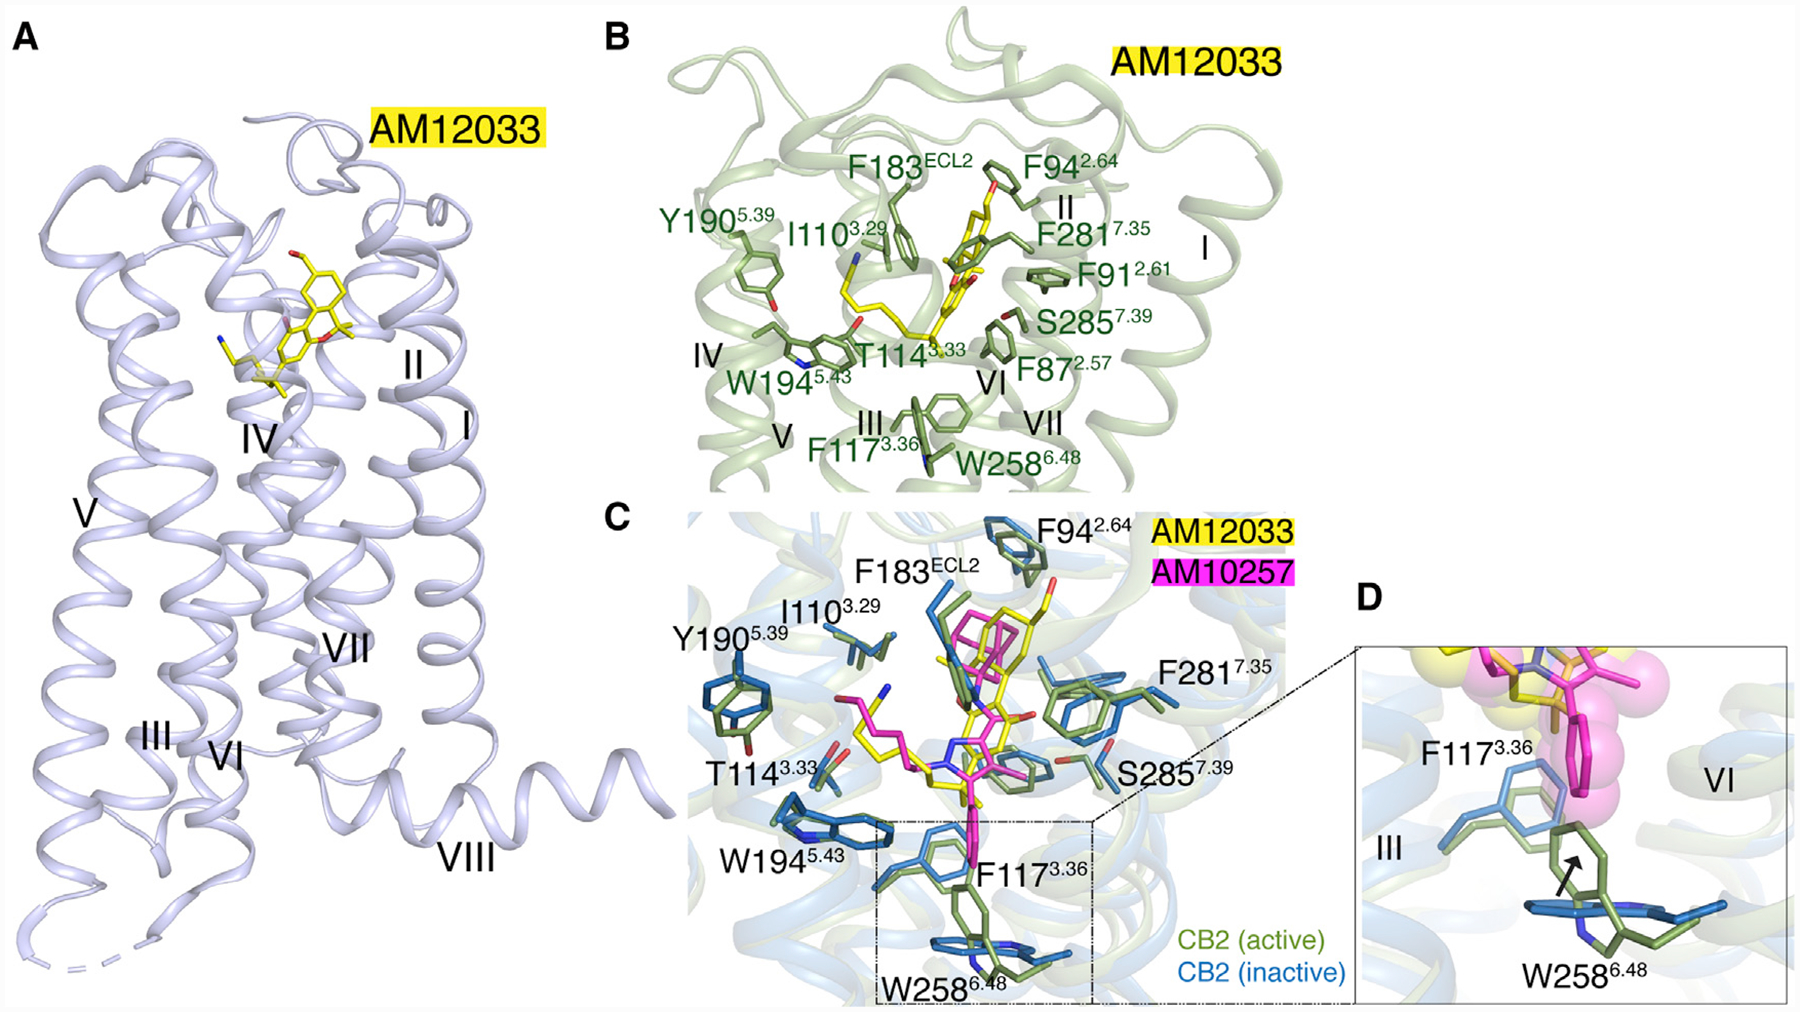
(A) Crystal structure of AM12033, yellow sticks; bound CB2, light blue cartoon.
(B) Key residues, green sticks, involved in AM12033, yellow sticks, binding in CB2-Gi complex structure, green cartoon.
(C) Binding poses comparison of AM12033, yellow sticks; and AM10257, magenta sticks in CB2.
(D) Comparison of the “toggle switch” residue conformation in active, green cartoon; and inactive, sky blue cartoon, CB2.
See also Figures S1 and S5 and Table S2.
Diverse Activation Processes of CB2 and CB1
In the AM12033-Gi-bound CB2 structure, the side chain of “toggle switch” residue Trp2586.48 experiences an expected major conformational change (Figure 4D) and a large outward movement of the intracellular part of TM6 by 11 Å (Arg238 as reference) to accommodate the mounting of α5 from the Gαi protein (Figure 5A). Moreover, the cytoplasmic portion of TM5 extended and moved outward by about 6 Å (V220 as reference) to form extensive interactions with the α5 of the Gαi, as discussed above. However, the cytoplasmic region of TM5 in CB1 is simply extended during activation (Figure 5B). The larger movement of TM5 in CB2 may be attributed to Gly2105.59 (Met2955.59 in CB1) that provides extra bending flexibility of TM5 (Figure 5C). Additionally, the classical activation features in class A GPCRs are also observed here, including the rearrangement of “micro-switches” DRY and NPxxY motifs (Figures S3C and S3D) (Erlandson et al., 2018). The “ionic lock” between Arg1313.50 and Asp2406.30, which is important for maintaining the ground state of the receptor (Savinainen et al., 2003), is broken, and Arg1313.50 in the DRY motif extends toward TM7 and forms a hydrogen bond with G352 from the α5-helix of Gαi. A 4 Å inward displacement of the NPxxY motif (N2957.49, P2967.50, and Y2997.52) in TM7 induces the conformational change of helix 8 and ICL1, eventually leading to the closer interaction between the receptor and Gi.
Figure 5. Comparison of CB1 and CB2 in Different States.
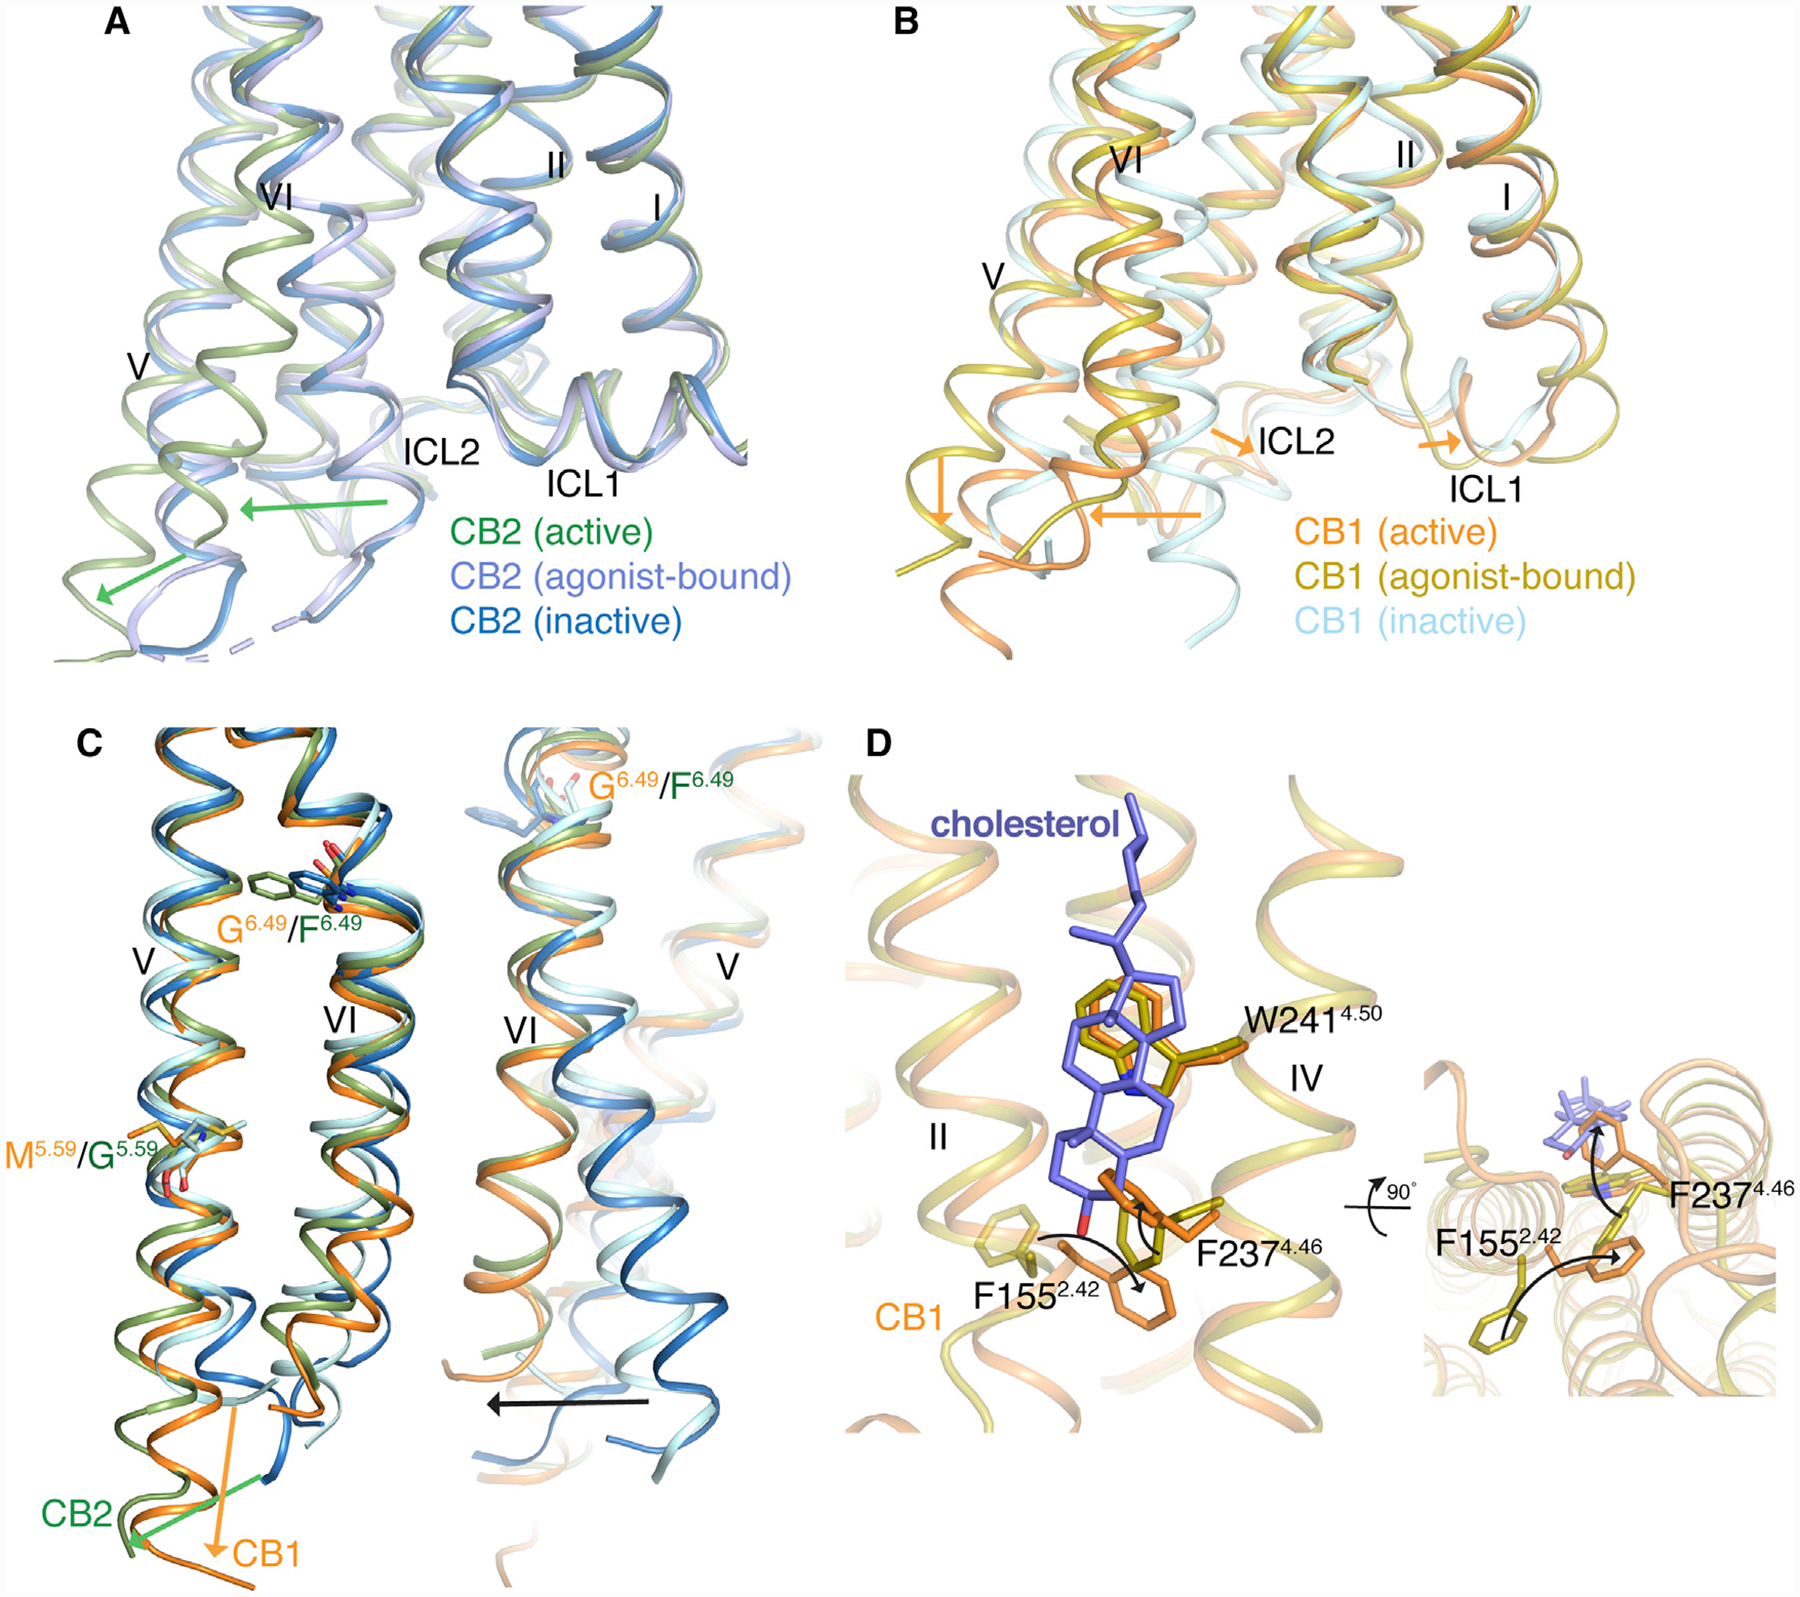
(A) Comparison of the intracellular parts of CB2 in different states. Color code is as follows: CB2-Gi, green; CB2-AM12033, light blue; and CB2-AM10257, blue.
(B) Comparison of the intracellular parts of CB1 in different states. Color code is as follows: CB1-Gi, orange; CB1-AM841, olive; and CB1-AM6538, cyan.
(C) Conformation comparison of TM5 and TM6 in CB1 and CB2 between inactive and active states with color code as above.
(D) Conformational changes of F1552.42 and F2374.46 in cholesterol, slate sticks, binding sites of CB1.
See also Figure S5.
The overall structure of AM841-CB1-Gi is similar to our previously solved AM841-bound CB1 crystal structure (Hua et al., 2017). The main differences occur in the CB1-G protein interface where the interacting residues are stabilized by Gi. In addition, elongation of TM5 and inward movement of TM5, TM6, ICL1, and ICL2 in the intracellular region resulted in more polar and hydrophobic interactions with α5 of the Gαi protein (Figure S5D). The binding poses of AM841 in the two structures are almost indistinguishable in the orthosteric binding pocket along with the key interacting residues. The “twin toggle switch” residues Phe2003.36 and Trp3566.48 adopt similar conformation in the two structures (Figure S5E), confirming their important role in CB1 activation. The DRY and NPxxY motifs show similar rearrangements (Figure S5F), indicating that the AM841-bound CB1 crystal structure is close to the active state. In contrast to the agonist-bound CB1 structures, the intracellular regions of TM5, TM6, and TM7 adopt a more converged conformation in AM12033-bound CB2 crystal structure, and its overall Cα RMSD with antagonist AM10257-bound CB2 is only 0.86 Å (Figure S5C), compared with CB2-Gi complex structure (Figure S5B). In our previous study, we have shown that class A GPCRs exhibit very diverse conformational changes in the intracellular region in responding to agonist binding (Hua et al., 2017). CB2 behaves as most solved class A GPCRs, which only experience minor conformational changes upon agonist binding, while CB1 is exceptional and displays larger conformational changes when modulated by agonists.
The structures (inactive, agonist-bound, and active states) of CB2 and CB1 we have obtained so far reveal intriguing conformational diversities (Figures 5A and 5B) and provide us the structural basis for deciphering the activation and signaling mechanism of cannabinoid receptors. First, the balloon-like plasticity of CB1 during the transitions between different states facilitates its inherent ability to respond to a diverse array of ligands compared to CB2. More interestingly, the two closely related receptors experience quite different activation processes. The more complicated activation of CB1 assumes the synergistic conformational change of the “twin toggle switch,” Phe3.36 and Trp6.48, to unleash the large conformational changes and induce the G protein-coupling. Yet in CB2, the single “toggle switch,” Trp6.48, is enough to trigger the activation and the downstream signaling.
Additionally, there is an atypical polar amino acid residue (Thr3.46) in both CB2 and CB1 compared with a conserved non-polar (I/L/M/V) residue in most (95%) class A GPCRs. Previous studies (D’Antona et al., 2006) and our own data (Hua et al., 2017) showed that T3.46A mutation disables CB2 or CB1 in coupling Gi protein. Based on our receptor-Gi complex structures, we found that upon activation in both CB2 or CB1, Tyr7.53 establishes new contacts with Thr3.46, Leu3.43, and Arg3.50 (Figures S5G and S5H). Meanwhile, Asp6.30 in TM6 interrupts its salt-bridge interaction with Arg3.50 (Figure S3D). This strengthens the interaction of TM3 and TM7, weakens the constraint on TM6 from TM3, and unlocks the outward movement of TM6. Therefore, T3.46A mutation in cannabinoid receptors or some other class A GPCRs may lead to restriction of the movement of TM6 and inactivation of the receptor.
Furthermore, previous studies have shown that a contact between residues 2.42 and 3.46 is important for GPCR folding (Venkatakrishnan et al., 2013). In CB2, the side chain of Phe722.42 adopts similar rotamer conformations in all three states, and the contacts between TM2 and TM3 are maintained. However, in CB1, the side chain of Phe1552.42 adopts different conformations in the three states, which facilitate the conformational flexibility of ICL1 and the cytoplastic end of TM2. This feature may indicate that these regions in CB1 may potentially be allosteric modulation sites. Of note, the cholesterol that we observed in the agonists-bound (AM11542 and AM841) CB1 crystal structures disappeared in the CB1-Gi complex structure. Comparing with the cholesterol-binding pocket in agonist AM841 or AM11542 bound structures, the side chains of Phe1552.42 and Phe2374.46 undergo large conformational changes in CB1-Gi structure and occupy the same position that cholesterol had in the agonist-bound crystal structures (Figure 5D). Also, the key residues involved in cholesterol binding are not conserved in CB1 and CB2. To our knowledge, Phe4.46 is unique to CB1 in class A GPCRs, and the cholesterol is not observed in either state of CB2 complex structures.
Structural Basis and Implications of CB1 and CB2 Agonist Selectivity
The structures we obtained so far reveal the similarity and diversity of antagonist- and agonist-binding modes in CB1 and CB2. The antagonist-binding pockets in both receptors are quite distinct, which is consistent with their high degree of antagonist selectivity (Hua et al., 2016; Li et al., 2019). However, the agonist-binding pockets in CB1 and CB2 and even the side-chain rotamers of the key residues involved with ligands interactions are almost identical (Figure 6A). Such structural observations may explain the low level of CB1 and CB2 selectivity found in the classical cannabinoids and their synthetic analogs.
Figure 6. Docking Poses of HU-308 in CB1 and CB2 and MD Simulations.
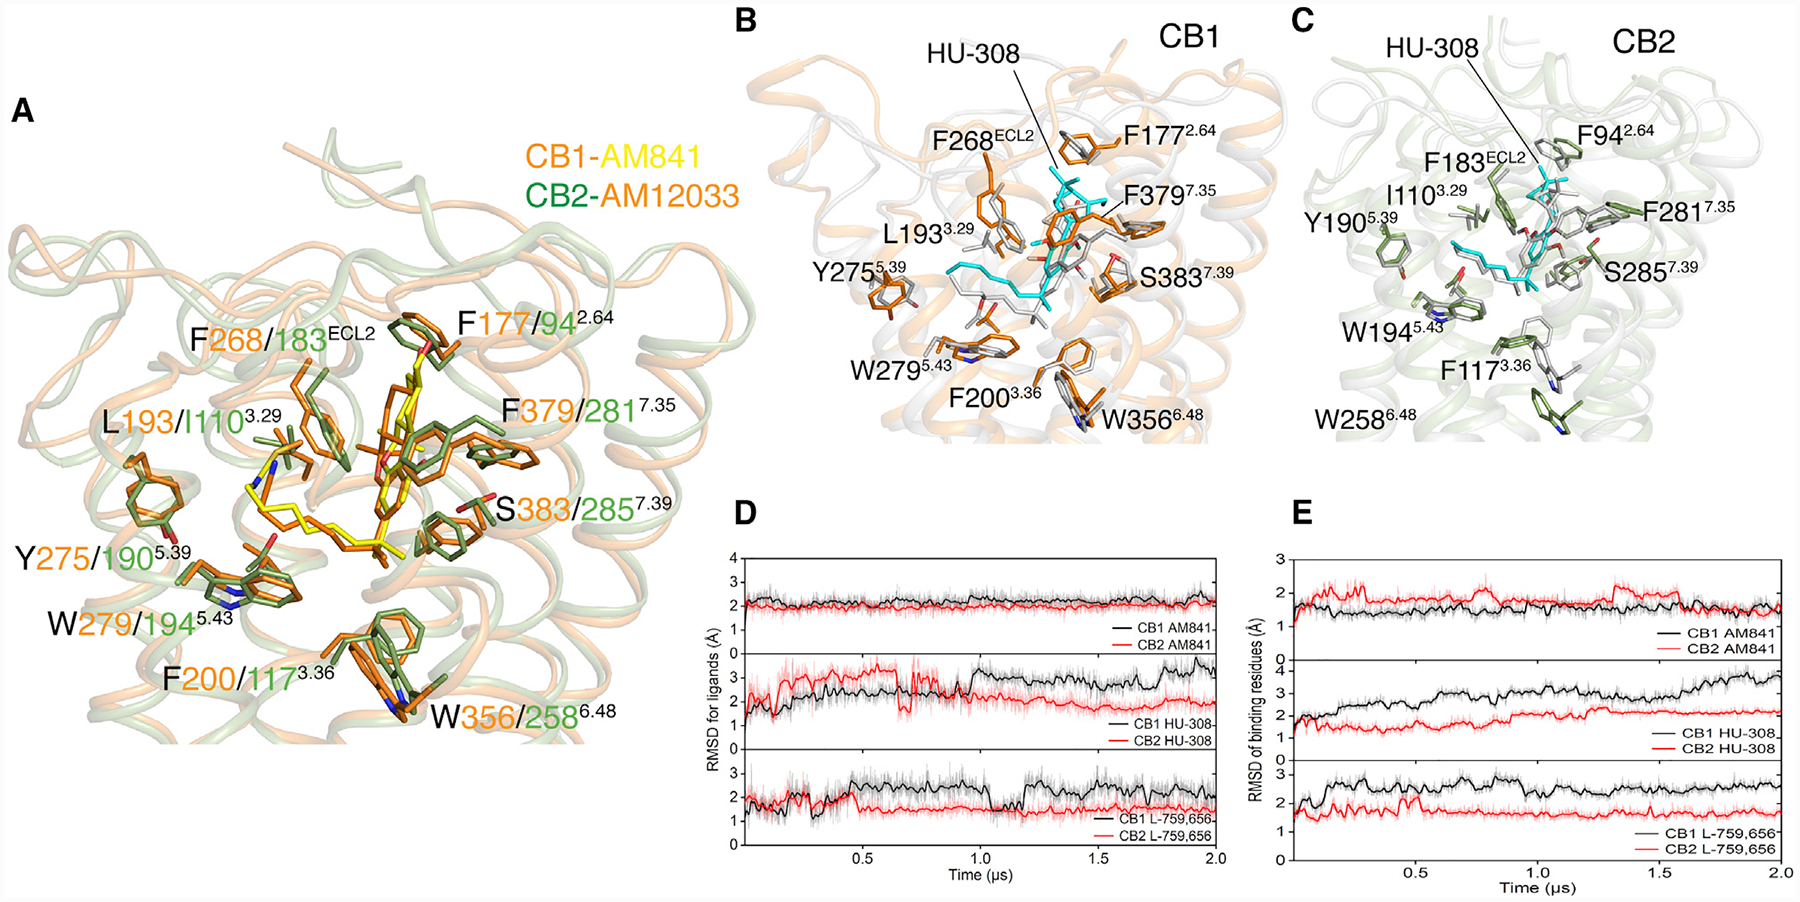
(A) Binding pocket comparison of AM841-bound CB1-Gi complex and AM12033-bound CB2-Gi complex.
(B) The initial docking pose of HU-308, gray sticks, in CB1, gray cartoon. After 2 μs MD simulation, HU-308 is shown as cyan sticks and CB1 is shown as orange cartoon.
(C) The initial docking pose of HU-308, gray sticks, in CB2, gray cartoon. After 2 μs MD simulation, HU-308 is shown as cyan sticks and CB2 is shown as green cartoon.
(D) RMSD of AM841, HU-308, and L-759,656 in CB1 or CB2 during 2 μs MD simulation.
(E) RMSD of key residues involved in the binding of AM841, HU-308, or L-759,656 in CB1 or CB2 during 2 μs MD simulation.
See also Figure S5.
In this study, to further explore the structural basis of agonist selectivity in CB1 and CB2, two highly CB2-selective agonists, HU-308 and L-759,656, were chosen as model ligands to probe the problems. The binding affinity of HU-308 for CB2 (Ki is 22.7 nM) is about 5,000 times higher than that of CB1 (almost no measurable Ki) (Hanus et al., 1999), while L-759,656 shows a binding affinity more than 406 times higher on CB2 (Ki is 11.8 nM) than that of CB1 (Ki is 4.8 μM) (Ross et al., 1999). The ligand binding to a target protein is a dynamic process which involves synergetic conformational changes of both protein and ligand. Thus, we decided to employ the molecular dynamic (MD) simulations and meta dynamics (metaMD) simulations to study the ligand-binding process into CB1 and CB2 structures (Figures 6B, 6C, S5I, and S5J) (Barducci et al., 2011, 2008). For quality-control purpose, the non-selective agonists AM841 and AM12033 were used as positive controls.
In order to characterize the different binding processes of HU-308, L-759,656 and AM841 in CB1 and CB2, we calculated the RMSDs of ligands (RMSDligand) and key residues which are involved with ligand binding (RMSDmolecule) during each simulation course. The calculation results are shown in Figures 6D and 6E. The RMSD values represent the conformation fluctuations for ligands or key residues during the 2 μs simulation process. Thus, the smaller RMSD value denotes more stable ligand-receptor binding. Not surprisingly, the RMSDAM841 in both CB1 and CB2, RMSDCB1, and RMSDCB2 all kept almost constant similar values (Figures 6D and 6E). These results indicate that our evaluation strategy is valid. Fortunately, the RMSD values for HU-308 or L-759,656 in CB1 are obviously larger than those of CB2. Similarly, the RMSD values for key residues in HU-308- or L-759,656-bound CB1 are clearly bigger than those of CB2 (Figures 6D and 6E). Therefore, the MD simulation results agree with the different ligand-binding affinities with CB1 and CB2.
To dig further into the understanding of the principle of agonist selectivity in CB1 and CB2, we introduced an advanced free energy sampling method, the well-tempered metaMD simulations (Barducci et al., 2011, 2008), to sample ligand-binding paths. MetaMD is a reliable method and has been widely used for many rare biological event samplings (Barducci et al., 2011; Bonomi et al., 2009; Yuan et al., 2014). Since the N termini in both CB1 and CB2 cover the orthosteric sites, the ligand entry process may be influenced. Thus, we selected two collective variables for our simulations: distance between the mass center of a ligand and that of the binding pocket and distance between the mass center of N terminus and that of ECL2 loop.
In the case of HU-308, the binding processes are composed of three different stages in both CB1 and CB2 (Figure 7). Initially, HU-308 fluctuated in the bulk environment at the extracellular region in the vicinity of position P1. At a certain stage, the N terminus overcame energy barriers and opened an empty space to accommodate initial ligand binding. The free energy surface (FES) plot indicated that the energy barriers were similar for CB1 and CB2, i.e., approximately 3.5 kcal/mol and 3.0 kcal/mol, respectively. However, when HU-308 diffused into a deeper space toward the orthosteric site, the energy barrier increased noticeably. It was about 10.5 kcal/mol for CB1, whereas it was about 5.0 kcal/mol for CB2 (Figures 7C and 7D). Such an obvious difference should explain why HU-308 is much more potent against CB2.
Figure 7. MetaMD Simulations of HU-308 in CB1 and CB2.
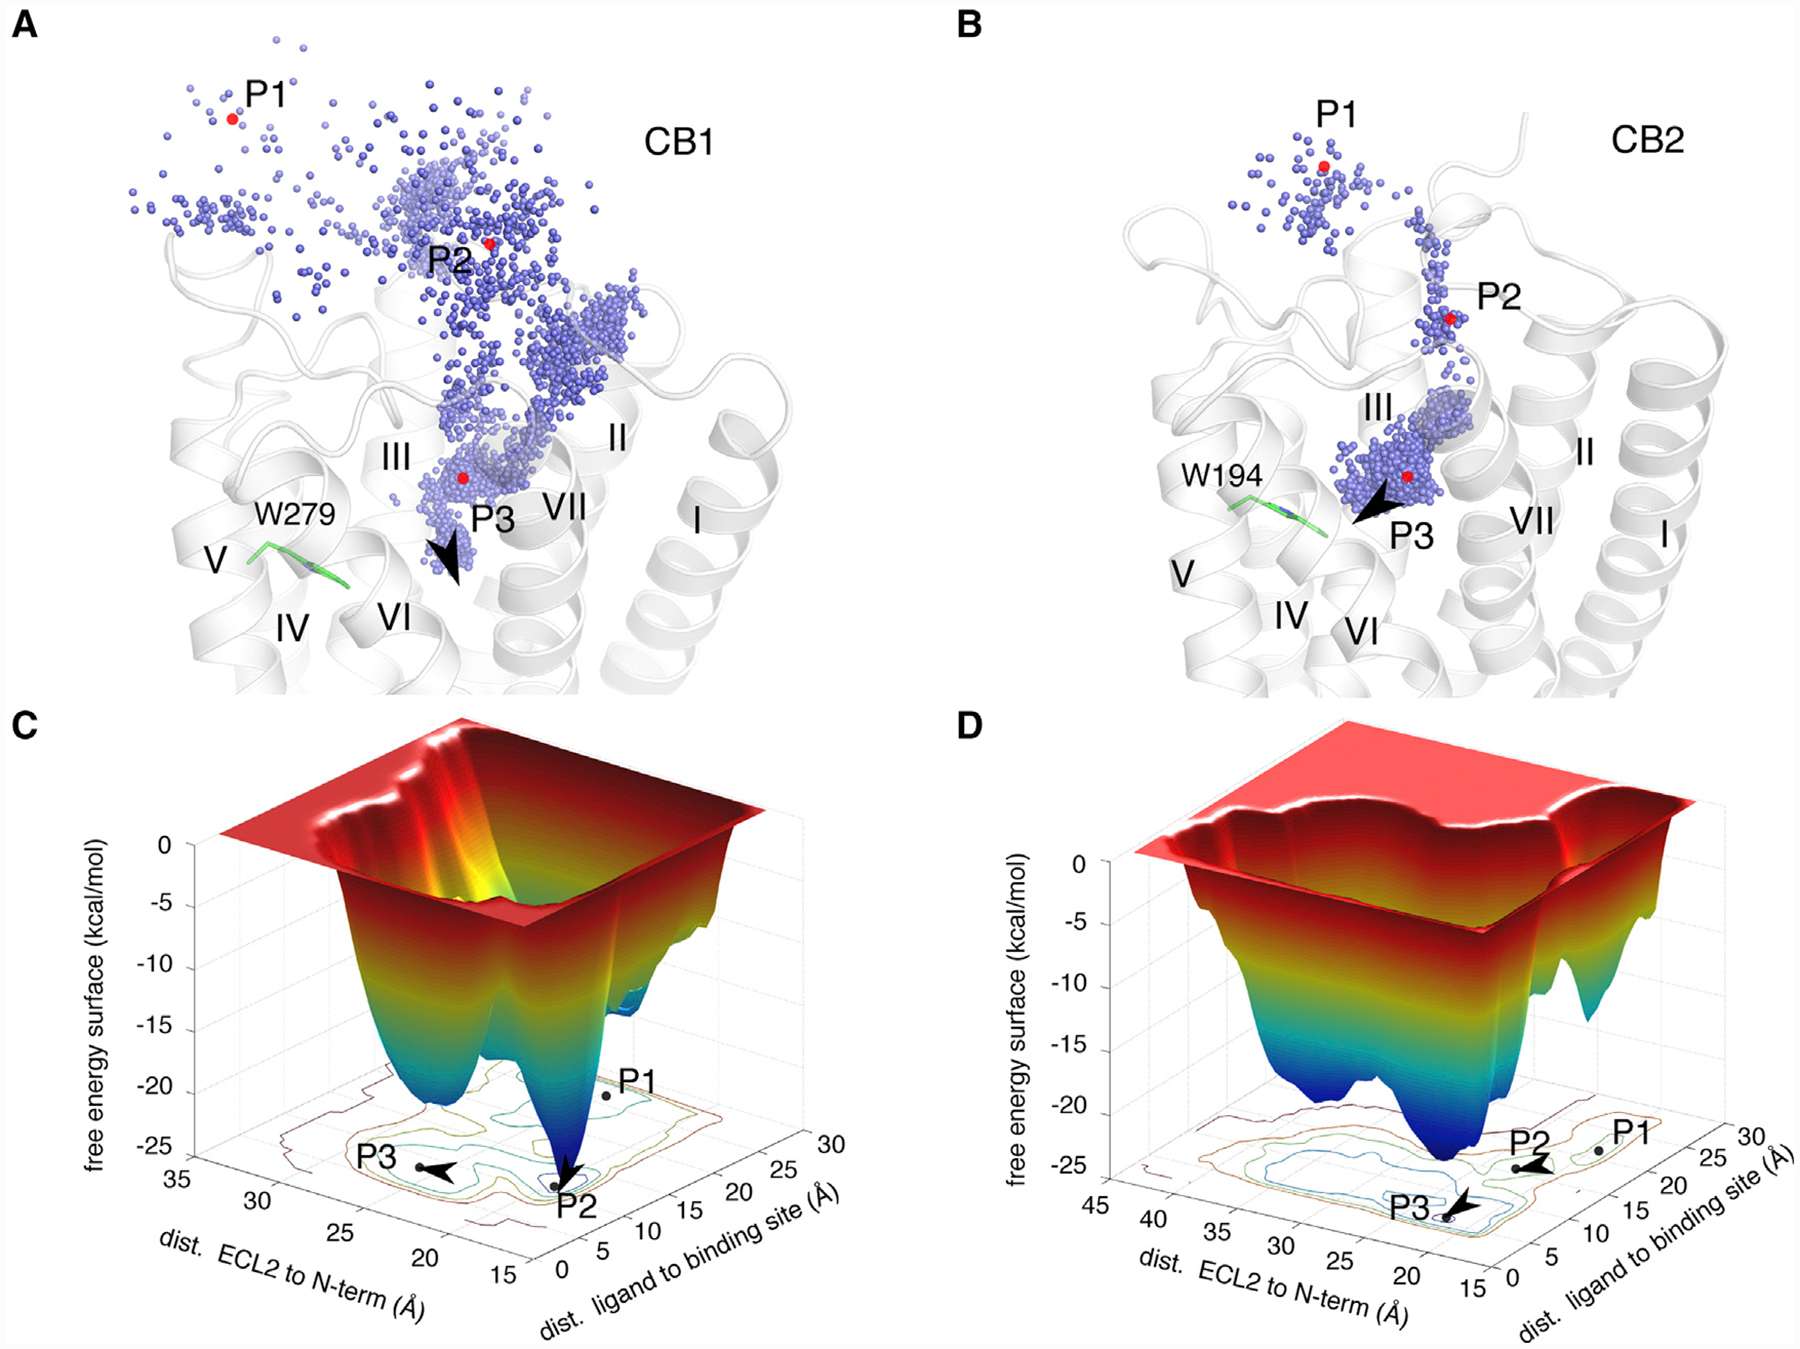
(A) The mass center, blue sphere, of HU-308 in metaMD simulation against CB1. Three typical positions P1–P3 were labeled in red. P1: bulk environment in the extracellular region. P2: initial ligand-binding position when N-terminal opened. P3: fully ligand-binding position in the orthosteric site.
(B) The mass center, blue sphere of HU-308 in metaMD simulation against CB2. Three typical positions P1–P3 are labeled in red.
(C and D) The free energy surface (FES) of metaMD simulations for systems CB1-HU-308 (C) and for that of CB2-HU-308 (D).
DISCUSSION
In this study, we compared and analyzed the structure snapshots of CB2 and CB1 in their inactive, active-like, and activated signaling states and deciphered their activation and signaling mechanism. Although the overall architecture is similar between CB2-AM12033-Gi and CB1-AM841-Gi, CB2 and CB1 exhibit distinct characters in terms of ligand and G protein selectivity and activation process. The single reside difference in ICL2 (L222 in CB1 and P139 in CB2) may contribute to the G protein-coupling diversity of cannabinoid receptors, where CB2 is specific to Gi only while CB1 can couple with Gi, Gs, and Gq. The high degree of structural similarity in the orthosteric binding pockets between agonist-bound CB2 and CB1 imposes substantial challenges for high-selective agonist design. The MD and metaMD simulation analysis on the selectivity of HU-308 and L-759,656 implied the possible connection between agonist selectivity and agonist entry path into CB2 or CB1.
The other interesting finding of this study is the cholesterol-binding behavior with CB1. Our collective experimental evidence encourages us to speculate that cholesterol or other steroids may be the endogenous allosteric modulator of CB1. This idea is supported by previous data which showed that pregnenolone, a derivative of cholesterol, acts as a CB1 allosteric modulator (Vallée et al., 2014). We believe that pregnenolone may also bind to the same cholesterol-binding region in CB1 owing to their similar structural scaffolds. In summary, our findings uncovered new clues in understanding the activation and signaling mechanism of cannabinoid receptors and will help the precise modulation of endocannabinoid systems for therapeutic benefit.
STAR★METHODS
LEAD CONTACT AND MATERIALS AVAILABILITY
Further information and requests for reagents may be directed to, and will be fulfilled by the Lead Contact, Zhi-Jie Liu (liuzhj@shanghaitech.edu.cn). All unique/stable reagents generated in this study will be made available on request but we may require a payment and a completed Materials Transfer Agreement if there is potential for commercial application.
EXPERIMENTAL MODEL AND SUBJECT DETAILS
Cell lines
Spodoptera frugiperda (Sf9) cells were used for CB2 expression, crystallization, and co-expression of G protein for cryo-EM study. Sf9 cells were grown in ESF 921 medium (Expression systems) at 27°C and 125 rpm. Binding and functional experiments were performed with either CHO-K1 cell lines (ATCC, female) or U2OS cell lines (PathHunter EA Parental Cell lines, female, DiscoveRx). CHO-K1 cells were maintained in DMEM/F12 media supplemented with 10% fetal bovine serum (FBS), 1% penicillin/streptomycin, and 5 mg/mL puromycin for stable cell line selection (Invitrogen, Waltham, MA). U2OS cells were selected by geneticin selection (500 mg/mL) in MEM media supplemented with 10% FBS, 1% penicillin/streptomycin and 250 mg/mL hygromycin.
METHOD DETAILS
Synthesis and Characterization of AM12033
All reagents and solvents were purchased from Sigma-Aldrich Chemicals company, unless otherwise specified, and used without further purification. All anhydrous reactions were performed under a static argon atmosphere in flame-dried glassware using scrupulously dry solvents. Flash column chromatography employed silica gel 60 (230–400 mesh). All compounds were demonstrated to be homogeneous by analytical TLC on pre-coated silica gel TLC plates (Merck, 60 F245 on glass, layer thickness 250 μm), and chromatograms were visualized by phosphomolybdic acid staining. Melting points were determined on a micro-melting point apparatus and are uncorrected. IR spectra were recorded on a Perkin Elmer Spectrum One FT-IR spectrometer. Peak strength is indicated as br (broad), w (weak), and s (strong). NMR spectra were recorded in CDCl3, unless otherwise stated, on a Bruker Ultra Shield 400 WB plus (1H at 400 MHz, 13C at 100 MHz) or on a Varian INOVA-500 (1H at 500 MHz, 13C at 125 MHz) spectrometers and chemical shifts are reported in units of δ relative to internal TMS. Multiplicities are indicated as br (broadened), s (singlet), d (doublet), t (triplet), q (quartet), qt (quintet) or m (multiplet). Coupling constants (J) are reported in hertz (Hz). Low and high-resolution mass spectra were performed in School of Chemical Sciences, University of Illinois at Urbana-Champaign. Mass spectral data are reported in the form of m/z (intensity relative to base = 100). LC/MS analysis was performed by using a Waters MicroMass ZQ system [electrospray-ionization (ESI) with Waters-2525 binary gradient module coupled to a Photodiode Array Detector (Waters-2996) and ELS detector (Waters-2424) using a XTerra MS C18, 5 μm, 4.6 mm × 50 mm column and acetonitrile/water].
2-(3,5-Dimethoxyphenyl)-2-methylpropanenitrile (2) (Sharma et al., 2013)
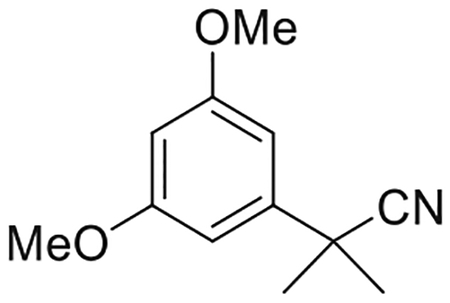
To a stirred suspension of sodium hydride (3.09 g, 128.6 mmol) in dry DMF (80 mL) at 0°C under an argon atmosphere was added dropwise a mixture of 1 (7.08 g, 40.0 mmol) and iodomethane (8.0 mL, 128.6 mmol) in dry DMF (4.2 mL). The reaction temperature was rose to 25°C over a 15 min period and stirring was continued for 2 h. The reaction mixture was quenched with saturated aqueous NH4Cl solution and diluted with diethyl ether. The organic layer was separated and the aqueous layer was extracted with diethyl ether. The combined organic layer was washed with water and brine, dried (MgSO4), and concentrated in vacuo. Purification by flash column chromatography on silica gel (25% ethyl acetate in hexane) gave the title compound (7.86 g, 96% yield) as a colorless oil. IR (neat) 2950, 2840, 2234 (w, CN), 1532, 1438, 1319, 1204, 788 cm−1. 1H NMR (500 MHz, CDCl3) δ 6.61 (d, J = 2.0 Hz, 2H, Ar-H), 6.40 (t, J = 2.0 Hz, 1 H, Ar-H), 3.81 (s, 6 H, -OCH3), 1.71 (s, 6 H, -C(CH3)2-); Mass spectrum (ESI) m/z (relative intensity) 206 (M++H, 100).
2-(3,5-Dimethoxyphenyl)-2-methylpropanal (3)(Nikas et al., 2015)
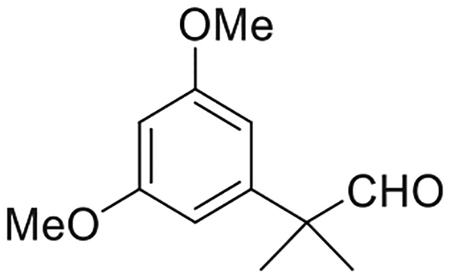
To a stirred solution of 2 (6.46 g, 31.5 mmol) in anhydrous CH2Cl2 (220 mL) at −78°C, under an argon atmosphere was added 1 M solution of DIBAL-H in Hexane (94 mL) dropwise and the reaction mixture was stirred for additional 30 min. The reaction mixture was then quenched by dropwise addition of potassium sodium tartrate (10% w/w solution in water) at −78°C. Following the addition, the mixture was warmed to room temperature, stirred for an additional 50 min and then diluted with ethyl acetate. The organic phase was separated, and the aqueous phase was extracted with ethyl acetate. The combined organic layer was washed with brine, dried (MgSO4), and the solvent was evaporated under reduced pressure. The crude product was purified by flash chromatography on silica gel (10%–35% ethyl acetate in hexane) to give 6.03 g of 3 as colorless oil in 92% yield. IR (neat) 2938, 2838, 2705 (w, CHO), 1725 (s, > C = O), 1595, 1457, 1424, 1314, 1205, 1156, 1066, 835 cm−1. 1H NMR (500 MHz, CDCl3) δ 9.46 (s, 1H, -CHO), 6.40 (d, J = 2.0 Hz, 2H, 2-H, 6-H), 6.39 (t, J = 2.0 Hz, 1H, 4-H), 3.78 (s, 6H, -OMe), 1.43 (s, 6H, -C(CH3)2-). 13C NMR (100 MHz CDCl3) δ 201.6 (-CHO), 161.1 (ArC), 143.6 (ArC), 105.1 (ArC), 98.6 (ArC), 65.7 (> (C)CHO), 55.2 (-OCH3), 50.5, 22.3. Mass spectrum (EI) m/z (relative intensity) 208 (M+, 25), 196 (16), 179 (M+-CHO), 165 (25), 151 (14), 139 (39), 91 (20), 77 (20). Exact mass (EI) calculated for C12H16O3 (M+), 208.10995; found, 208.11077.
(Z)-1,3-Dimethoxy-5-(2-methyl-7-phenoxyhept-3-en-2-yl)benzene (4)(Makriyannis et al., 2014)
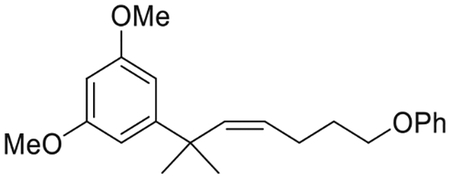
To a stirred suspension of (4-phenoxybutyl)triphenylphosphonium bromide (15)(Nikas et al., 2010) (43.32 g, 88.4 mmol) in dry THF (540 mL) at 0°C, under an argon atmosphere was added potassium bis(trimethylsilyl)amide (17.40 g, 87.1 mmol). The mixture was stirred for 30 min at 10°C to ensure complete formation of the orange phosphorane. A solution of aldehyde 3 (6.82 g, 32.8 mmol) in 8.6 mL THF was added dropwise to the resulting slurry, at 0°C. The reaction was stirred for 20 min at room temperature and upon completion was quenched by the addition of saturated aqueous NH4Cl solution. The organic layer was separated and the aqueous phase was extracted with diethyl ether. The combined organic layer was washed with brine and dried (MgSO4) and the solvent was evaporated under reduced pressure. The residue was purified on a silica gel (5%–15% diethyl ether in hexanes) to give 10.68 g of compound 4 as colorless oil in 96% yield. IR (neat) 2960, 2836, 1595, 1422, 1244, 1204, 1153, 1051, 753, 692 cm−1. 1H NMR (500 MHz, CDCl3) δ 7.29–7.21 (m, 2H, 3-H, 5-H of -OPh), 6.91 (t, J = 7.3 Hz, 1H, 4-H of -OPh), 6.81 (d, J = 7.3 Hz, 2H, 2-H, 6-H of -OPh), 6.56 (d, J = 2.2 Hz, 2H, 2-H, 6-H), 6.28 (t, J = 2.2 Hz, 1H, 4-H), 5.69 (dt, J = 11.4, 1.7 Hz, 1H, 2′-H), 5.31 (dt, J = 4, 7.4 Hz, 1H, 3′-H), 3.77 (s, 6H, -OMe), 3.69 (t, J = 6.7 Hz, 2H, 6′-H), 1.83 (qd, J = 7.4, 1.7 Hz, 2H, 4′-H), 1.63 (qt, J = 7.0 Hz, 2H, 5′-H), 1.40 (s, 6H, -C(CH3)2-). 13C NMR (100 MHz CDCl3) δ 160.6 (ArC), 159.1 (ArC), 153.3 (ArC), 140.4 (> C = C <), 130.3 (> C = C<), 129.4 (ArC), 120.5 (ArC), 114.6 (ArC), 105.0 (ArC), 97.0 (ArC), 67.3 (C-6′), 55.3 (-OCH3), 40.4, 31.4, 29.0, 24.9. Mass spectrum (ESI) m/z (relative intensity) 341 (M++H, 100), 247 (M++H-OPh, 30). LC/MS analysis (Waters MicroMass ZQ system) showed retention time of 5.6 min for the title compound.
1,3-Dimethoxy-5-(2-methyl-7-phenoxyheptan-2-yl)benzene (5)(Makriyannis et al., 2014)
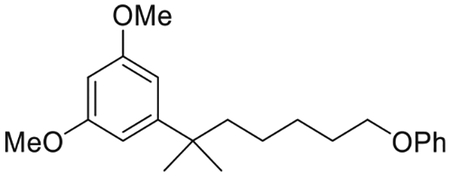
To a solution of 4 (6.85 g, 20.2 mmol) in ethyl acetate (200 mL) was added 10% w/w Pd/C (690 mg) and the resulting suspension stirred vigorously for 2.5 h under hydrogen atmosphere at room temperature. The catalyst was removed by filtration through celite, and the filtrate was evaporated under reduced pressure to afford 6.77 g of the crude product 5 as colorless oil, in 98% yield which was used in the next step without further purification. IR (neat) 2936, 2861, 1598, 1497, 1457, 1422, 1244, 1204, 1155, 1053, 832, 754, 692 cm−1. 1H NMR (400 MHz, CDCl3) δ 7.28−7.21 (m, 2H, 3-H, 5-H of -OPh), 6.99−6.88 (m, 1H, 4-H of -OPh), 6.87−6.83 (m, 2H, 2-H, 6-H of -OPh), 6.49 (d, J = 2.3 Hz, 2H, 2-H, 6-H), 6.30 (t, J = 2.3 Hz, 1H, 4-H), 3.87 (t, J = 6.5 Hz, 2H, 6′-H), 3.78 (s, 6H, -OMe), 1.74−1.65 (m, 2H, -CH2- of the side chain), 1.63−1.56 (m, 2H, -CH2- of the side chain), 1.41−1.32 (m, 2H, -CH2- of the side chain), 1.30−1.22 (s, 6H, -C(CH3)2-), 1.18−1.09 (m, 2H, -CH2- of the side chain); 13C NMR (100 MHz CDCl3) δ 160.6 (ArC), 159.2 (ArC), 152.5 (ArC), 129.5 (ArC), 120.6 (ArC), 114.6 (ArC), 104.8 (ArC), 96.8 (ArC), 67.9 (C-6′), 55.3 (-OCH3), 44.5, 38.1, 29.3, 29.1, 26.8, 24.6. Mass spectrum (ESI) m/z (relative intensity) 343 (M++H, 100). LC/MS analysis (Waters MicroMass ZQ system) showed retention time of 5.7 min for the title compound.
5-(7-Bromo-2-methylheptan-2-yl)benzene-1,3-diol (6)(Makriyannis et al., 2007; Makriyannis et al., 2014)
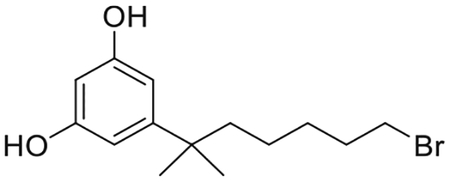
To a stirred solution of 5 (4.60 g, 13.4 mmol) in dry CH2Cl2 (75 mL), at −78°C, under an argon atmosphere, was added 1M boron tribromide solution in CH2Cl2 (59.1 mL, 59.1 mmol) dropwise. Following the addition, the reaction mixture was gradually warmed to room temperature and the stirring was continued at that temperature until completion of the reaction (3 h). The reaction mixture was quenched by the addition of MeOH (75 mL), warmed to room temperature and volatiles were removed in vacuo. The residue was diluted with ethyl acetate and washed sequentially with saturated aqueous NaHCO3 solution, water and brine. The organic layer was dried over MgSO4, filtered and concentrated under reduced pressure. Purification by flash column chromatography on silica gel (10%–35% ethyl acetate in hexanes) afforded 3.98 g of 6 as a white foam in 99% yield. IR (neat) 3323 (br, OH), 2934, 2860, 1599, 1507, 1461, 1438, 1330, 1150, 992, 842, 698 cm−1; 1H NMR (500 MHz, CDCl3) δ 6.37 (s, J = 2.0 Hz, 2H, 2-H, 6-H) 6.17 (t, J = 2.0 Hz, 1H, 4-H), 4.80 (br s, 2H, -OH), 3.34 (t, J = 7.0 Hz, 2H, 6′-H), 1.78 (qt, J = 6.9 Hz, 2H, -CH2- of the side chain), 1.58−1.49 (m, 2H, -CH2- of the side chain), 1.38−1.28 (m, 2H, -CH2- of the side chain), 1.23 (s, 6H, -C(CH3)2-), 1.12−1.02 (m, 2H, -CH2- of the side chain); 13C NMR (100 MHz CDCl3) δ 156.2 (ArC), 153.4 (ArC), 106.1 (ArC), 100.3 (ArC), 66.2 (C-6′), 44.2, 37.8, 34.3, 32.7, 28.9, 23.9, 15.0. Mass spectrum (ESI) m/z (relative intensity) 301 (M++H, 100). LC/MS analysis (Waters MicroMass ZQ system) showed retention time of 4.6 min for the title compound.
(1R,4R,5R)-4-[4-(7-Bromo-2-methylheptan-2-yl)-2,6-dihydroxyphenyl]-6,6-dimethylbicyclo[3.1.1]heptan-2-one (7)(Makriyannis et al., 2007)
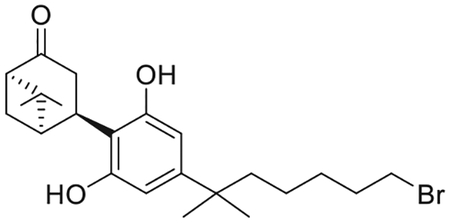
To a degassed solution of 6 (4.71 g, 15.7 mmol) and p-toluenesulfonic acid monohydrate (4.79 g, 25.1 mmol) in wet CHCl3 (250 mL) diacetates 18 (6.51 g, ca. 90% pure by 1H NMR, 25.1 mmol(Nikas et al., 2007) was added at 0°C, under an argon atmosphere. The mixture was warmed to room temperature and stirred for 4 d to ensure complete formation of the product. The reaction mixture was diluted with diethyl ether and washed sequentially with water, saturated aqueous NaHCO3 solution, and brine. The organic phase was dried over MgSO4 and the solvent was removed under reduced pressure. The residue was chromatographed on silica gel (15%–50% diethyl ether in hexane) and fractions containing almost pure product (TLC) were combined and evaporated. Further purification by recrystallization from CHCl3 and hexane gave 7 as a white crystalline solid (4.03 g, 59% yield), mp82–85°C; IR (neat) 3350 (br, OH), 2933, 2868, 1683 (s, > C = O), 1621, 1586, 1419, 1266, 1021, 837, 739, 672 cm−1. 1H NMR (500 MHz, CDCl3) δ 6.28 (s, 2H, Ar-H), 5.34 (br s, 2H, OH), 3.95 (t, J = 8.2 Hz, 1H, 4-H), 3.52 (dd, J = 18.8, 7.7 Hz, 1H, 3α-H), 3.35 (t, J = 6.8 Hz, 2H, 6′-H), 2.67−2.58 (m, 2H, 3β-H, 1-H), 2.55−2.44 (m, 2H, 7α-H, 7β-H), 2.32 (t, J = 5.5 Hz, 1H, 5-H), 1.78 (qt, J = 6.9 Hz, 2H, -CH2- of the side chain), 1.53−1.47 (m, 2H, -CH2- the side chain group), 1.37−1.30 (s and m overlapping, 5H, 6-Me, -CH2- of the side chain, especially 1.36, s, 3H, 6-Me), 1.20 (s, 6H, -C(CH3)2-), 1.13−1.04 (m, 2H, -CH2- of the side chain), 0.99 (s, 3H, 6-Me). 13C NMR (100 MHz CDCl3) δ 217.3 (> C = O), 155.0 (ArC), 149.7 (ArC), 113.8 (ArC), 106.7 (ArC), 58.1, 46.9, 44.3, 42.3, 38.1, 37.4, 34.1, 32.8, 29.7, 29.0, 28.8, 26.3, 24.6, 24.0, 22.3. Mass spectrum (ESI) m/z (relative intensity) 437 (M++H, 100), 367 (30). LC/MS analysis (Waters MicroMass ZQ system) showed retention time of 5.1 min for the title compound.
(6aR,10aR)-3-(7-Bromo-2-methylheptan-2-yl)-1-hydroxy-6,6-dimethyl-6,6a,7,8,10,10a-hexahydro-9H-benzo[c] chromen-9-one (8)
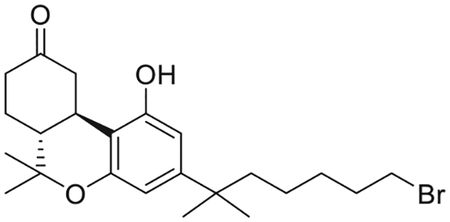
To a stirred solution of 7 (2.04 g, 4.68 mmol) in anhydrous CH2Cl2/CH3NO2 (3:1 mixture, 156 mL) at 0°C, under an argon atmosphere was added trimethylsilyl trifluoromethanesulfonate (4.68 mL, 0.3 M solution in CH3NO2,1.56 mmol). Stirring was continued for 3 h after the temperature allowed to rise to 25°C. The reaction was quenched with a mixture of saturated aqueous NaHCO3/brine (1:1), and diethyl ether was added. The organic phase was separated, the aqueous phase was extracted with diethyl ether, and the combined organic phase was washed with brine and dried over MgSO4. Solvent evaporation and purification by flash column chromatography on silica gel (15%−30% ethyl acetate-hexane) afforded 1.43 g (75% yield) of the title compound 8 as white foam. IR (neat) 3306 (br, OH), 2935, 2871, 1695 (s, > C = O), 1621, 1576, 1416, 1337, 1139, 1094, 1040, 970, 839 cm−1. 1H NMR (500 MHz, CDCl3) δ 6.37 (d, J =1.9 Hz, 1H, Ar-H), 6.28 (d, J =1.9 Hz, 1H, Ar-H), 6.17 (br s, 1H, OH), 4.00 (m as br d, J = 15.1 Hz, 1H, 10eq-H), 3.34 (t, J = 6.9 Hz, 2H, 6′-H), 2.89 (m as td, J = 12.9, 3.5 Hz, 1H, 10a-H), 2.65−2.58 (m, 1H, 8eq-H), 2.50−2.41 (m, 1H, 8ax-H), 2.20–2.12 (m, 2H, 10ax-H, 7eq-H), 1.97 (m as td, J =11.8, 2.5 Hz, 1H, 6a-H), 1.79 (qt, J =7.0 Hz, 2H of -CH2- of the side chain), 1.55–1.44 (m and s overlapping, 6H, 7ax-H, -CH2- of the side chain, 6-Me, especially 1.48, s, 3H, 6-Me), 1.33 (qt, J = 7.5 Hz, 2H, -CH2- of the side chain), 1.21 (s, 6H, -C(CH3)2-), 1.13 (s, 3H, 6-Me), 1.12−1.04 (m, 2H, -CH2-of the side chain). 13C NMR (100 MHz CDCl3) δ 214.6 (> C = O), (ArC), 154.4 (ArC), 150.5 (ArC), 107.9 (ArC), 107.2 (ArC), 105.6 (ArC), 47.5, 45.1, 44.2, 40.9, 37.5, 34.9, 34.1, 32.8, 28.9, 29.0, 28.9, 28.0, 27.0, 26.9, 19.0. Mass spectrum (ESI) m/z (relative intensity) 437 (M++H, 100). LC/MS analysis (Waters MicroMass ZQ system) showed retention time of 5.3 min for the title compound.
(6aR,10aR)-3-(7-Bromo-2-methylheptan-2-yl)-1-[(tert-butyldimethylsilyl)oxy]-6,6-dimethyl-6,6a,7,8,10,10a-hexahydro-9H-benzo[c]chromen-9-one (9)
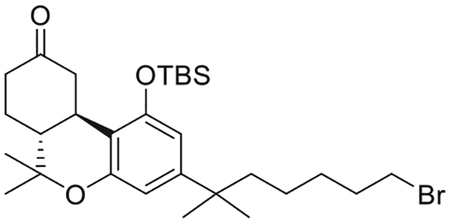
To a solution of 8 (2.52 g, 5.8 mmol) in anhydrous CH2Cl2 (12 mL) under an argon atmosphere were added sequentially, imidazole (395 g, 5.8 mmol), DMAP (73 mg, 0.6 mmol) and TBDMSCl (870 mg, 5.8 mmol). The reaction mixture was stirred room temperature for 12 h. The reaction mixture was diluted with diethyl ether and washed sequentially with 1M aqueous HCl solution, saturated aqueous NaHCO3 solution, water and brine. The organic phase was dried over MgSO4 and the solvent was removed under reduced pressure. Purification by flash column chromatography on silica gel (10%–30% diethyl ether in hexane) afforded 2.65 g (83% yield) of 9 as a colorless oil. IR (neat) 2931, 2859, 1713(s, >C = O), 1613, 1564, 1412, 1332, 1254, 1137, 1096, 1055, 980, 839 cm−1; 1H NMR (500 MHz,CDCl3) δ 6.41 (d, J =1.9 Hz, 1H, Ar-H), 6.33 (d, J =1.9 Hz, 1H, Ar-H), 3.77 (ddd, J = 14.9, 3.4, 2.0 Hz, 1H, 10eq-H), 3.33 (t, J = 6.9 Hz, 2H, 6′-H), 2.72 (m as td, J =12.8, 3.4 Hz, 1H, 10a-H), 2.59−2.52 (m, 1H, 8eq-H), 2.46−2.35 (m, 1H, 8ax-H), 2.2−2.07 (m, 2H, 10ax-H, 7eq-H), 1.95 (m as td, J = 12.5, 3.4 Hz, 1H, 6a-H), 1.78 (qt, J = 6.8 Hz, 2H of -CH2- of the side chain), 1.55–1.44 (m and s overlapping, 6H, 6-Me, 7ax-H, -CH2- of the side chain and especially 1.47, s, 3H, 6-Me), 1.33 (qt, J = 6.8 Hz, 2H, -CH2- of the side chain), 1.21 (s, 3H, -C(CH3)2-), 1.20 (s, 3H, -C(CH3)2-), 1.10–1.03 (m, 2H, -CH2- of the side chain and s, 3H, 6-Me), 1.00 (s, 9H, Si(Me)2CMe3), 0.24 (s, 3H, Si(Me)2CMe3), 0.16 (s, 3H, Si(Me)2CMe3). 13C NMR (100 MHz CDCl3) δ 210.4 (> C = O), 154.8 (ArC-1 or ArC-5), 154.3 (ArC-5 or ArC-1), 149.8 (tertiary aromatic), 112.2 (tertiary aromatic), 109.9 (ArC-2 or ArC-4), 108.5 (ArC-4 or ArC-2), 47.9, 45.7, 44.4, 40.9, 37.5, 35.3, 34.0, 32.9, 29.0, 28.9, 28.8, 28.6, 27.9, 26.2, 25.8, 24.1, 18.8, 18.5, −3.5, −3.9. Mass spectrum (ESI) m/z (relative intensity) 551 (M++H, 100). LC/MS analysis (Waters MicroMass ZQ system) showed retention time of 6.6 min for the title compound.
{[(6aR,10aR)-3-(7-Bromo-2-methylheptan-2-yl)-9-(methoxymethylene)-6,6-dimethyl-6a,7,8,9,10,10a-hexahydro-6H-benzo[c]chromen-1-yl]oxy}. (tert-butyl)dimethylsilane (10)
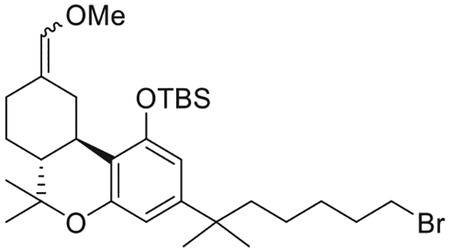
(Methoxymethyl)triphenyl phosphonium chloride (4.31 g, 12.6 mmol) was suspended in 21 mL of dry THF. Potassium bis(trimethylsilyl)amide (2.42 g, 12.2 mmol) was then added at 0°C, and the reaction mixture was stirred for 20 min at 0°C and for 15 min at room temperature. Intermediate 9 (1.16 g, 2.1 mmol) was dissolved in 5 mL of dry THF and added dropwise to the solution of the red ylide at 0°C. The reaction mixture was stirred at 0°C to room temperature for 1.5 h, and then quenched with saturated aqueous NH4Cl solution at 0°C and diluted with diethyl ether. The organic layer was separated and the aqueous layer was extracted with diethyl ether. The combined organic layer was washed with brine, dried (MgSO4), and concentrated in vacuo. The residue was chromatographed on silica gel (0%−10% diehtyl ether in hexane) to give a mixture (10) of two geometrical isomers 10a and 10b (1.71 g, 71% yield) as a colorless oil in the ratio of 2:1 respectivelly as determined by 1H NMR analysis. IR (neat) 2931, 2859, 1684, 1611, 1561, 1411, 1251, 1120, 1097, 1053, 980, 836, 779, 742, 695 cm−1. 1H NMR (400 MHz, CDCl3) 6.37 (d, J =1.9 Hz, 1H, Ar-H, 10a), 6.36 (d, J =1.9 Hz, 1H, Ar-H, 10b), 6.32 (d, J =1.9 Hz, 1H, Ar-H, 10b), 6.31 (d, J =1.9 Hz, 1H, Ar-H, 10a), 5.86 (s, 1H, = CHOMe, 10a), 5.81 (s, 1H, = CHOMe, 10b), 4.22−4.15 (m as dd, J =13.6, 3.4 Hz, 1H, C-ring, 10b), 3.55 (s, 3H,OMe, 10a), 3.52 (s, 3H, OMe, 10b), 3.46−3.42 (m as dd, J = 13.6, 3.4 Hz, 1H, C-ring, 10a), 3.32 (t, J = 6.9 Hz, 2H, 6′-H for 10a and 2H, 6′-H for 10b), 2.96−2.88 (m as br d, J =13.6 Hz, 1H, C-ring, 10a), 2.35–2.26 (m, 1H, C-ring of 10a and 1H, C-ring of 10b), 2.22−2.15 (m, 1H, C-ring, 10b), 2.09−1.99 (m, 1H, C-ring, 10b), 1.92−1.84 (m, 1H, C-ring of 10a and 1H, C-ring of 10b), 1.83−1.72 (m, 1H, C-ring, 10a), 1.69−1.55 (m, 2H, -CH2- of the side chain of 10a, 2H, -CH2- of the side chain of 10b, 2H, C-ring of 10a, and 2H, C-ring of 10b), 1.55−1.46 (m, 2H, -CH2- of the side chain of 10a, 2H, -CH2- of the side chain of 10b), 1.39 (s, 3H, 6-Me, 10a), 1.38 (s, 3H, 6-Me, 10b), 1.32 (qt, J = 7.2 Hz, 2H, -CH2- of the side chain of 10a, 2H, -CH2- of the side chain of 10b), 1.20 (s, 6H, -C(CH3)2- of 10a), 1.19 (s, 6H, -C(CH3)2- of 10b), 1.12−0.97 (m, s, s, s, and s, overlapping, 1H, C-ring of 10a, 1H, C-ring of 10b, 2H, -CH2- of the side chain of 10a, 2H, -CH2- of the side chain of 10b, 3H, 6-Me of 10a, 3H, 6-Me of 10b, 9H, -Si(Me)2CMe3, of 10a, 9H, -Si(Me)2CMe3, of 10b, especially 1.03, s, -Si(Me)2CMe3, of 10a and 1.00, s, -Si(Me)2CMe3, of 10b), 0.24 (s, 3H, -Si(Me)2CMe3, 10a), 0.23 (s, 3H, -Si(Me)2CMe3, 10b), 0.19 (s, 3H, -Si(Me)2CMe3, 10b), 0.15 (s, 3H, -Si(Me)2CMe3, 10a). Mass spectrum (ESI) m/z (relative intensity) 579 (M++H, 100). LC/MS analysis (Waters MicroMass ZQ system) showed retention time of 7.2 min for the title compound.
(6aR,10aR)-3-(7-Bromo-2-methylheptan-2-yl)-1-[(tert-butyldimethylsilyl)oxy]-6,6-dimethyl-6a,7,8,9,10,10a-hexahydro-6H-benzo[c]chromene-9-carbaldehyde (11)
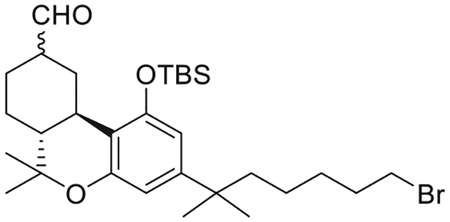
To a stirred solution of 10 (2.50 g, 4.3 mmol) in CH2Cl2 (144 mL) under an argon atmosphere, was added wet trichloroacetic acid (3.51 g, 21.6 mmol). The reaction mixture was stirred at room temperature for 50 min and then quenched with saturated aqueous NaHCO3 solution and diluted with diethyl ether. The organic layer was separated and the aqueous layer was extracted with diethyl ether. The combined organic phase was washed with water and brine, dried (MgSO4) and evaporated under reduced pressure. The residue consisted of a mixture of epimeric aldehydes 12 and 11a (2.26 g, 93% yield) in the ratio of 2:1 respectivelly as determined by 1H NMR analysis, and it was used into the next step as such.1H NMR (500 MHz, CDCl3) δ 9.89 (d, J =1.5 Hz, 1H, 9α-CHO, 11a), 9.63 (d, J =1.5 Hz, 1H, 9β-CHO, 12), 6.38 (d, J =1.9 Hz, 1H, Ar-H, 12), 6.36 (d, J =1.9 Hz, 1H, Ar-H, 11a), 6.33 (d, J =1.9 Hz, 1H, Ar-H, 11a), 6.32 (d, J =1.9 Hz, 1H, Ar-H, 12), 3.69−3.62 (m as br d, J =14.0 Hz, 1H, C-ring, 11a), 3.52−3.44 (m, 1H, C-ring, 12), 3.33 (t, J = 6.5 Hz, 2H, -CH2Br for 12 and 2H, -CH2Br for 11a), 2.65−2.60 (m, 1H, C-ring, 11a), 2.45−2.33 (m, 2H, C-ring, 12 and 2H, C-ring, 11a), 2.31−2.24 (m, 1H, C-ring, 11a), 2.14−2.07 (m, 1H, C- ring, 12), 2.03−1.96 (m, 1H, C-ring, 12), 1.80−1.71 (m, 2H, -CH2- of the side chain 1H of 12, 2H, -CH2- of the side chain of 11a),1.65−1.60 (m, 1H, C-ring, 12, 1H, C-ring, 11a), 1.58−1.42 (m, 2H, -CH2- of the side chain of 12, 2H, -CH2-of the side chain of 11a, 1H, C-ring of 12, 1H, C-ring of 11a), 1.39 (s, 3H, 6-Me of 12), 1.35 (s, 3H, 6-Me of 11a), 1.33 (qt, J = 7.5 Hz, 2H, -CH2-of the side chain of 12 and 2H, -CH2- of the side chain of 11a), 1.25−1.11 (m, 2H, C-ring of 12, 1H, C-ring of 11a, 6H, -C(CH3)2- of 11a, 6H, -C(CH3)2- of 12), 1.09−1.03 (m and s, overlapping, 2H, -CH2- of the side chain of 12, 2H, -CH2- of the side chain of 11a, 1.07, s, 3H, 6-Me, 12), 1.02–1.00 (s and s overlapping, 3H, 6-Me of 11a and 9H, -Si(Me)2CMe3 of 12), 0.97 (s, 9H, -Si(Me)2-CMe3, 11a), 0.28 (s, 3H, -Si(Me)2CMe3, 11a), 0.26 (s, 3H, Si(Me)2CMe3, 12), 0.25 (s, 3H, Si(Me)2CMe3, 11a), 0.15 (s, 3H, Si(Me)2CMe3, 12).
(6aR,9R,10aR)-3-(7-Bromo-2-methylheptan-2-yl)-1-[(tert-butyldimethylsilyl)oxy]-6,6-dimethyl-6a,7,8,9,10,10a-hexahydro-6H-benzo[c]chromene-9-carbaldehyde (12)
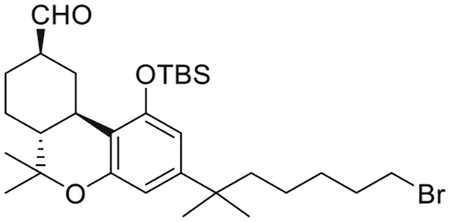
To a mixture of 11a and 12 (2.20 g, 3.9 mmol) in ethanol (77 mL) under an argon atmosphere, was added potassium carbonate powder (2.68 g, 19.4 mmol) and the mixture was stirred at room temperature for 3 h. The reaction mixture was quenched by the dropewise addition of 1M aqueous acetic acid solution (until pH of 5). The volatiles were evaporated under reduced pressure. The water layer was extracted with diethyl ether. The organic layer was washed with brine, dried (MgSO4), and concentrated under reduced presure. Purification by flash column chromatography on silica gel (5%–25% diethyl ether in hexane) gave 12 (1.78 g, 81% yield) as a colorless oil. IR (neat) 2934, 2860, 2713 (w, CHO), 1728 (s, > C = O), 1613, 1560, 1413, 1331, 1253, 1066, 982, 838, 780 cm−1. 1H NMR (500 MHz, CDCl3) δ 9.63 (d, J = 1.5 Hz, 1H, 9β-CHO), 6.38 (d, J = 1.9 Hz, 1H, Ar-H), 6.32 (d, J = 1.9 Hz, 1H, Ar-H), 3.52−3.44 (m, 1H, C-ring), 3.33 (t, J = 6.9 Hz, 2H, 6′-H), 2.45−2.36 (m as td, J = 11.0, 2.6 Hz, 2H, C-ring), 2.14−2.06 (m, 1H, C-ring), 2.03–1.95 (m, 1H, C-ring), 1.77 (qt, J = 7.2 Hz, 2H, -CH2- of the side chain), 1.64−1.60 (m, 1H, C-ring), 1.54−1.46 (m, 3H, -CH2- of the side chain, C-ring), 1.39 (s, 3H, 6-Me), 1.32 (qt, J = 7.5 Hz, 2H, -CH2- of the side chain), 1.26−1.18 (m, 2H, C-ring, and 6H, -C(CH3)2-), 1.09−0.99 (m, s, and s, overlapping, 14H as follows: 2H, -CH2- of the side chain, 1.08, s, 3H, 6-Me, 1.01, s, 9H, -Si(Me)2CMe3), 0.26 (s, 3H, Si(Me)2CMe3), 0.15 (s, 3H, Si(Me)2CMe3). 13C NMR (100 MHz CDCl3) δ 203.6 (-CHO), 154.6 (ArC-1 or ArC-5), 154.3 (ArC-5 or ArC-1), 149.3 (tertiary aromatic), 112.6 (tertiary aromatic), 109.6 (ArC-2 or ArC-4), 108.5 (ArC-4 or ArC-2), 50.6, 49.1, 44.3, 37.4, 37.3, 35.5, 33.9, 32.8, 30.2, 28.9, 28.8, 28.7, 27.6, 26.9, 26.0, 25.9, 23.9, 18.8, 18.2, −3.6, −4.2. Mass spectrum (ESI) m/z (relative intensity) 565 (M++H, 100). LC/MS analysis (Waters MicroMass ZQ system) showed retention time of 6.8 min for the title compound.
{(6aR,9R,10aR)-3-(7-Bromo-2-methylheptan-2-yl)-1-[(tert-butyldimethylsilyl)oxy]-6,6-dimethyl-6a,7,8,9,10,10a-hexahydro-6H-benzo[c]chromen-9-yl}methanol (13)
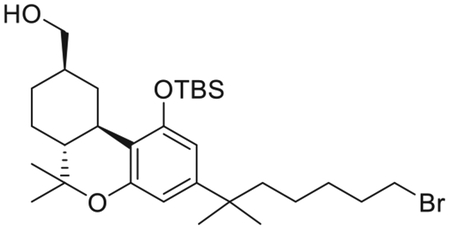
Sodium borohydride (394 mg, 10.5 mmol) was added to a stirred solution of aldehyde 12 (740 mg, 1.31 mmol) in ethanol (32 mL) at 0°C under argon. After 30 min, the reaction was quenched with the addition of saturated aqueous NH4Cl solution and volatiles were removed in vacuo. The residue was dissolved in ethyl acetate and water was added. The organic layer was separated and the aqueous layer was extracted with ethyl acetate. The combined organic phase was washed with water and brine, dried (MgSO4), and evaporated. Purification by flash column chromatography on silica gel (15%–50% diethyl ether in hexane) gave 13 (712 mg, 96% yield) as a colorless viscous oil. IR (neat) 3360 (br, OH), 2935, 2869, 1743, 1621, 1560, 1415, 1364, 1217, 1139, 1038, 971, 837, 748 cm−1; 1H NMR (400 MHz, CDCl3) δ 6.37 (d, J = 1.9 Hz, 1H, Ar-H), 6.30 (d, J = 1.9 Hz, 1H, Ar-H), 3.54 (dd, J = 10.6, 5.6 Hz, half of an AB system, 1H, -CH2OH), 3.50−3.43 (m as dd, J = 10.6, 6.5 Hz, half of an AB system, 1H, -CH2OH), 3.32 (t, J = 6.9 Hz, 2H, 6’-H), 3.19−3.13 (m as br d, J = 12.8 Hz, 1H, C-ring), 2.40−2.32 (m as td, J =11.0, 2.6 Hz, 1H, C-ring), 2.04−1.88 (m, 2H, C-ring), 1.81−1.59 (m, 3H as follows 1H of C-ring, 2H, -CH2- of the side chain), 1.54−1.43 (m, 3H, -CH2- of the side chain, C-ring), 1.38 (s, 3H, 6-Me), 1.35–1.27 (m, 3H, -CH2- of the side chain, C-ring) 1.20 (s, 3H, -C(CH3)2-), 1.19 (s, 3H, -C(CH3)2-), 1.17–1.10 (m, 3H, -CH2- of the side chain, C-ring), 1.06 (s, 3H, 6-Me), 1.00 (s, 9H, Si(Me)2CMe3), 0.77 (q, J =11.9 Hz, 1H, C-ring), 0.23 (s, 3H, Si(Me)2CMe3), 0.13 (s, 3H, Si(Me)2CMe3). 13C NMR (100 MHz CDCl3) δ 154.7 (ArC-1 or ArC-5), 154.4 (ArC-5 or ArC-1), 149.0 (tertiary aromatic), 113.8 (tertiary aromatic), 109.8 (ArC-2 or ArC-4), 108.6 (ArC-4 or ArC-2), 68.6 (-CH2OH), 49.8, 44.5, 40.7, 37.4, 35.7, 33.4, 32.7, 29.9, 29.5, 29.0, 28.9, 27.8, 27.7, 26.1, 24.1, 19.0, 18.4, −3.4, −4.1. Mass spectrum (ESI) m/z (relative intensity) 567 (M++H, 100). LC/MS analysis (Waters MicroMass ZQ system) showed retention time of 6.5 min for the title compound.
7-[(6aR,9R,10aR)-1-Hydroxy-9-(hydroxymethyl)-6,6-dimethyl-6a,7,8,9,10,10a-hexahydro-6H-benzo[c]chromen-3-yl]-7-methyloctanenitrile (AM12033)
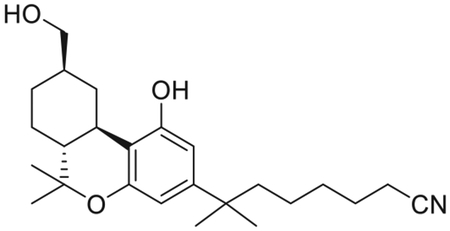
To a solution of 13 (120 mg, 0.21 mmol) in anhydrous DMSO (4.2 mL), under an argon atmosphere, was added NaCN (103.1 mg, 2.1 mmol). The reaction mixture was stirred for 9 h at room temperature, and then quenched with the addition of ice. Extractive isolation with diethyl ether, and purification by flash column chromatography on silica gel (20%–50% ethyl acetate in hexane) gave AM12033 (66 mg, 79% yield) as a white solid. Melting point = 73°C. IR (neat) 3382 (br, OH), 2932, 2864, 2252 (w, CN), 1621, 1574, 1461, 1414, 1333, 1271, 1139, 1038, 971, 839, 736 cm−1; 1H NMR (400 MHz, CDCl3) δ 6.33 (d, J = 1.9 Hz, 1H, Ar-H), 6.20 (d, J =1.9 Hz, 1H, Ar-H), 5.25 (br s, 1H, OH), 3.53 (d, J = 6.3 Hz, 2H, -CH2OH), 3.24−3.17 (m as br d, J = 12.8 Hz, 1H, C-ring), 2.48 (td, J = 11.1, 2.8 Hz, 1H, C-ring), 2.26 (t, J = 7.1 Hz, 2H, 6’-H), 2.00−1.89 (m, 2H, C-ring), 1.84−1.72 (m, 1H, C-ring), 1.61−1.55 (m, 3H, -CH2- of the side chain, C-ring), 1.54−1.48 (m, 3H, -CH2- of the side chain, C-ring), 1.40−1.30 (s and qt overlapping, 2H, -CH2- of the side chain, especially 1.38, s, 3H, 6Me), 1.20 (s, 6H, -C(CH3)2-), 1.18−1.03 (s and m overlapping, 2H, -CH2- of the side chain, 1H, C-ring, especially, 1.08, s, 3H, 6-Me), 0.83 (q, J = 11.9 Hz, 1H, C-ring); 13C NMR (100 MHz CDCl3) δ 154.9 (ArC-1 or ArC-5), 154.8 (ArC-5 or ArC-1), 149.4 (tertiary aromatic), 120.0 (-CN), 109.9 (tertiary aromatic), 108.0 (ArC-2 or ArC-4), 105.5 (ArC-4 or ArC-2), 68.7 (-CH2OH), 49.5, 44.1, 40.6, 37.4, 35.1, 33.3, 29.9, 29.3, 28.9, 28.8, 27.9, 27.6, 25.3, 23.9, 19.2, 17.2 (-CH2CN). Exact mass (ESI) calculated for C25H38NO3 (M+ + H), 400.2852; found 400.2853. LC/MS analysis (Waters MicroMass ZQ system) showed retention time of 5.2 min for the title compound.
Protein Engineering and Expression of CB2 for Crystallography Study
CB2-T4L construction and expression for crystallization were performed using the similar procedure as described before(Li et al., 2019). In brief, the construct has truncations of residues 1–20, 223–234 and 326–360; the T4L fusion protein was fused to the truncated third intracellular loop of the human CB2 gene. Six mutations (Gly782.48Leu, Thr1273.46Ala, Thr1534.45Leu, Gly2105.59Ala, Arg2426.32Glu and Gly3048.48Glu) were introduced into the CB2-T4L gene for further modification. The optimized construct was cloned into a modified pFastBac1 vector with the haemagglutinin (HA) signal sequence at the N terminus and a 10 x His-tag followed by a Flag-tag at the C terminus. The modified CB2-T4L protein was expressed in Spodoptera frugiperda (Sf9) insect cells using the Bac-to-Bac Baculovirus Expression System (Invitrogen). Sf9 cells were infected at a cell density of 2–2.5 × 10⁶ cells per ml with high-titer viral stock MOI (multiplicity of infection) of 5.0. Cells were harvested by centrifugation for 48 h post-infection and stored at −80°C for future use.
CB2-AM12033 Complex Purification for Co-crystallization
Frozen cell pellets were thawed and lysed by repeated washing and centrifugation in the hypotonic buffer of 10 mM HEPES (pH 7.5), 10 mM MgCl2, 20 mM KCl, and the high osmotic buffer of 10 mM HEPES (pH 7.5), 1.0 M NaCl, 10 mM MgCl2, 20 mM KCl, with EDTA-free complete protease inhibitor cocktail tablets (Roche). Purified membranes were thawed at room temperature and incubated with 20 μM AM12033 and inhibitor cocktail at 4°C for 3 h. The membranes were further incubated with 1.0 mg/mL iodoacetamide (Sigma) for 1 h and were solubilized in the buffer containing 50 mM HEPES (pH 7.5), 500 mM NaCl, 0.75% (w/v) lauryl maltose neopentyl glycol (LMNG, Anatrace) and 0.15% (w/v) cholesterol hemisucinate (CHS, Sigma-Aldrich) at 4°C for 2.5–3 h. The supernatant was isolated by ultracentrifugation, and then incubated with TALON IMAC resin (Clontech) and 20 mM imidazole, at 4°C overnight. The resin was washed with 15 column volumes (CV) of washing buffer I containing 25 mM HEPES (pH 7.5), 500 mM NaCl, 10% (v/v) glycerol, 0.1% (w/v) LMNG, 0.02% (w/v) CHS, 30 mM imidazole and 20 mM AM12033, and 10 CV of washing buffer II containing 25 mM HEPES (pH 7.5), 500 mM NaCl, 10% (v/v) glycerol, 0.03% (w/v) LMNG, 0.006% (w/v) CHS, 50mM imidazole and 20 μM AM12033. The protein was eluted using 3 CV of elution buffer containing 25 mM HEPES (pH7.5), 500 mM NaCl, 10% (v/v) glycerol, 0.01% (w/v) LMNG, 0.002% (w/v) CHS, 250 mM imidazole and 25 μM AM12033. The purified receptor was then concentrated to 20 mg/mL for crystallization trials.
Crystallization of CB2-AM12033 in Lipidic Cubic Phase
Crystallization was performed using the lipidic cubic phase (LCP) method as described before(Caffrey and Cherezov, 2009). The concentrated CB2 protein in complex with AM12033 was reconstituted into LCP by mixing with molten lipid (90% (w/v) monoolein and 10% (w/v) cholesterol at volume ratio of 2:3 using a syringe mixer. LCP crystallization trials were performed using an NT8-LCP crystallization robot (Formulatrix). 96-well sandwich plates were incubated and imaged at 20°C using an automated incubator/imager (RockImager, Formulatrix). Crystals grew in the condition of 100 mM HEPES pH 7.0, 25% PEG 400, 220 mM Sodium sulfate decahydrate, and reached a full size of 40 mm × 20 mm after 2 weeks. The crystals were harvested from the LCP matrix using micro-mounts (MiTeGen) and immediately flash frozen in liquid nitrogen.
Data Collection and Structure Determination of CB2-AM12033
X-ray diffraction data were collected at the Spring-8 beamline 41XU, using a Pilatus3 6M detector (X-ray wavelength 1.0000 Å). A rastering and data-collection strategy was followed as previously described (Cherezov et al., 2009). Diffraction images were indexed, integrated, and scaled using XDS (Kabsch, 2010) and merged using XPREP. Initial phases were obtained by molecular replacement (MR) with Phaser (McCoy et al., 2007) using the antagonist AM10257 bound CB2 structure (PDB: 5ZTY) as search model. The structure determination was completed by manually modeling the CB2 and T4L in the program COOT (Emsley et al., 2010) using both |2Fo|-|Fc| and |Fo|-|Fc| maps and refined with Phenix (Adams et al., 2010) and Buster (Smart et al., 2012).
Constructs and Expression of CB2 and Gi Heterotrimer
The N-BRIL fused wild type human CB2 construct was cloned into a modified pFastBac1 vector with the HA signal sequence at the N terminus followed by a 10 x His-tag and a Flag-tag. Human Gαi1 and Gβ1γ2 subunits were cloned into pFastbac1 and pFastDual vector individually. The CB2 and Gi, heterotrimer were co-expressed in Sf9 insect cells using the Bac-to-Bac Baculovirus Expression System (Invitrogen). Sf9 cells were infected at a cell density of 2–2.5 × 10⁶ cells per ml with three separate virus preparations for CB2, Gαi1 and Gβ1γ2 at a ratio of 1:2:2. The infected cells were cultured at 27°C for 48 h before collection by centrifugation and the cell pellets were stored at −80°C for future use.
Constructs, Expression, and Purification of scFv16
ScFv16 was cloned into a modified pFastBac1 vector containing a GP67 secretion signal before the amino terminus of the scFv16 and 10 x His tag at C terminus. ScFv16 expressed in secreted form from Trichuplusia ni Hi5 insect cells using the Bac-to-Bac Baculovirus Expression System, and purified by Ni-NTA chromatography. Supernatant was pH balanced by addition of 1M Tris pH 8.0, and then was loaded onto Ni-NTA resin. The column was washed with 6 CV wash buffer I 20 mM HEPES pH 7.5, 100 mM NaCl, and 10 mM imidazole followed by 4 CV wash II 20 mM HEPES pH 7.5, 100 mM NaCl, and 30 mM imidazole. The protein was eluted with the same buffer supplemented with 250 mM imidazole, the C-terminal 10 x His tag was cleaved by incubation with human rhinovirus 3C protease, and the protein was dialyzed into a buffer consisting of 20 mM HEPES pH 7.5 and 100 mM NaCl. Cleaved scFv16 was further purified by reloading over Ni-NTA resin. The flowthrough was collected and purified over gel filtration chromatography using a Hiload Superdex 7510/300 column. Monomeric fractions were pooled, concentrated, and flash frozen in liquid nitrogen, then stored at −80°C for further use.
CB2-Gi-scFv16 Complex Formation and Purification
The cell pellets corresponding to 1L CB2-Gi co-expression culture were thawed and lysed in the hypotonic buffer of 10mM HEPES, pH7.5, 10 mM MgCl2, 20 mM KCl with EDTA-free complete protease inhibitor cocktail tablets (Roche). The CB2-Gi complex was formed in membranes by addition of 20 μM AM12033 and 2 units of apyrase (NEB) in the presence 500 ug scFv16. The lysate was incubated for overnight at 4°C and discard the supernatant by centrifugation at 40,000 × rpm for 30min. The complex from membranes was solubilized in the buffer containing 50 mM HEPES (pH 7.5), 100 mM NaCl, 0.75% (w/v) lauryl maltose neopentyl glycol (LMNG, Anatrace), 0.15% (w/v) cholesterol hemisucinate (CHS, Sigma-Aldrich), 20 μM AM12033 and 2 units of apyrase (NEB) at 4°C for 2 h. The supernatant was isolated by ultracentrifugation, and then incubated with TALON IMAC resin (Clontech) and 20 mM imidazole over 6 h at 4°C. The resin was washed with 15 CV (column volumes) of washing buffer I containing 25 mM HEPES (pH 7.5), 100 mM NaCl, 10% (v/v) glycerol, 0.1% (w/v) LMNG, 0.02% (w/v) CHS, 30 mM imidazole and 20 μM AM12033, and 15 column volumes of washing buffer II containing 25 mM HEPES (pH 7.5), 100 mM NaCl, 10% (v/v) glycerol, 0.03% (w/v) LMNG, 0.006% (w/v) CHS, 50mM imidazole and 20 μM AM12033. The protein was eluted using 3 column volumes of elution buffer containing 25mM HEPES (pH 7.5), 100 mM NaCl, 10% (v/v) glycerol, 0.01% (w/v) LMNG, 0.002% (w/v) CHS, 250 mM imidazole and 25 μM AM12033. The purified CB2-Gi complex was concentrated, then injected onto a Superdex200 10/300 GL column (GE Healthcare) equilibrated in the buffer containing 20 mM HEPES, pH 7.5, 100 mM NaCl, 0.00075% (w/v) LMNG, 0.00025% GDN, 0.0001% (w/v) CHS, 100 μM TCEP. The complex peak fractions were collected and concentrated individually to 0.8–1.0 mg/mL for electron microscopy experiments.
CB1-Gi-scFv16 Complex Expression, Formation, and Purification
Wild type human CB1 was subcloned into a modified mammalian expression pTT5 vector, which contains a haemagglutinin (HA) signal sequence, a FLAG tag and 10 x His tag, followed by a tobacco etch virus (TEV) protease cleavage site. In order to improve the protein expression, the construct was further modified by the truncations of the CB1 residues 1–70, and 426–472, and the BRIL (PDB: 1M6T, MW 10.9kDa) fusion protein was fused to the N terminus. Glu2735.37Lys, Thr2835.47Val and Arg3406.32Glu, which do not affect the G protein-coupling were introduced (Hua et al., 2017). The protein expression and membrane preparation were performed using the same procedure as described before (Hua et al., 2017). Purified membranes were thawed at room temperature and then incubated with 25 μM AM841 in the presence of 1.0 mg/mL iodoacetamide (Sigma) and EDTA-free protease inhibitor cocktail (Roche) at 4°Cfor 2 h. The membranes were then solubilized with 50 mM HEPES (pH 7.5), 100 mM NaCl, 1% (w/v) LMNG, 0.2% (w/v) CHS at 4°C for 2.5–3 h.The supernatants were isolated by high-speed centrifugation, and then incubated with TALON IMAC resin and 20 mM imidazole, at 4°C overnight. The resin was washed with 15 column volumes of washing buffer I containing 25 mM HEPES (pH 7.5), 100 mM NaCl, 10% (v/v) glycerol, 0.1% (w/v) LMNG, 0.02% (w/v) CHS, 30 mM imidazole and 20 μM AM841, and 5 column volumes of washing buffer II containing 25 mM HEPES (pH 7.5), 100 mM NaCl, 10% (v/v) glycerol, 0.03% (w/v) LMNG, 0.006% (w/v) CHS, 50mM imidazole and 20 uM AM841. The proteins were eluted by 2.5 column volumes of eluting buffer containing 25 mM HEPES (pH 7.5), 100 mM NaCl, 10% (v/v) glycerol, 0.01% (w/v) LMNG, 0.001% (w/v) CHS, 250 mM imidazole and 20 uM AM841. PD MiniTrap G-25 column was used to remove imidazole and the protein was used for the complex formation.
Heterotrimeric G-proteins were expressed and purified as follows: Human Gαi1 and Gβ1γ2 subunits were cloned into pFastbac1 and pFastDual vector individually. Sf9 insect cells were coinfected with viruses encoding Gαi1 and Gβ1γ2 subunits. In order to facilitate the purification, His-tag with TEV cleavable site is attached at the amino terminus of the Gγ subunit. Cells were harvested 48 h post infection, lysed in hypotonic buffer containing 50 mM HEPES (pH 7.5), 100 mM NaCl, protease inhibitor, 5 mM imidazole, 5 mM MgCl2, 1mM DTT. The supernatant was purified by nickel affinity chromatography, followed by size-exclusion chromatography using a Superdex 75 column. Monomeric fractions were pooled, concentrated for complex formation.
CB1-Gi-scFv16 complex formation: purified receptors and excess molar ratio of G-protein were mixed together. The coupling reaction was allowed to proceed at 24°C for 1 h and was followed by addition of apyrase to catalyze hydrolysis of unbound GDP. And then the incubated at 25°C for another 2 h. Finally, a 1.2 molar excess of scFv16 was added to the complex and incubated at 4°C overnight. The CB1-Gi-scFv16 complex was purified by size exclusion chromatography on a superdex 200 10/300 GL column in 20 mM HEPES, pH 7.5, 100 mM NaCl, 0.00075% (w/v) LMNG, 0.00025% GDN, 0.0001% (w/v) CHS, 100 μM TCEP and 5 μM AM841. Peak fractions were concentrated to 1 mg/mL for electron microscopy studies.
Cryo-EM Sample Preparation and Image Acquisition
Three microliters of purified CB1-Gi-scFv16 or CB2-Gi-scFv16 complexes was applied to a glow-discharged holey carbon grid (CryoMatrix Amorphous alloy film R1.2/1.3, 300 mesh), and subsequently vitrified using a Vitrobot Mark IV (Thermo Fisher Scientific). The chamber of Vitrobot was set to 100% humidity at 4°C. The sample was blotted for 2.5 s with blot force 2. Cryo-EM images were collected on a Titan Krios microscope operated at 300 kV equipped with a Gatan Quantum energy filter, with a slit width of 20 eV, a Gatan K2 summit direct electron camera (Gatan). Movies were taken in EFTEM nanoprobe mode, with 50 μm C2 aperture, at a calibrated magnification of 130,000 corresponding to a magnified pixel size of 1.04 E. Each movie comprises 45 frames with a total dose of 60 electrons per E2, exposure time was 8.1 s with the dose rate of 8e−/ Å2/s. Data acquisition was done using SerialEM software (Mastronarde, 2005) with a defocus range of −0.8 to −2.0 μm.
Image Processing and 3D Reconstruction
For CB1-Gi-scFv16 complex, a total of 5577 movies were collected and subjected for motion correction using MotionCor2 (Zheng et al., 2017). Contrast transfer function (CTF) parameters for each non-dose weighted micrography were estimated by Gctf (Zhang, 2016). Particles selection, 2D and 3D classifications were performed on a binned dataset with a pixel size of 2.08 Å using RELION 2.1.0 (Scheres, 2012). To generate CB1-Gi-scFv16 complex template for automatic picking, around 2,186,340 particles were automatically picked with manual guidence and classified by 2D classification in RELION. After auto-picking in RELION, the low-quality images and false-positive particles were removed manually. About 1,385,539 particles were extracted for subsequent processing. We used the cryo-EM structure of CB1-FUB-Gi complex (Electron Microscopy Data Bank code EMD-0339), low-pass-filtered to 60 Å, as the initial model for 3D classification in RELION. The model of the best class after 3D classification was used as the initial model for the final 3D classification and 3D auto-refinement. Further Baycsian polishing of these particles was performed in RELION3.0, followed by another round of auto-refinement, which generated a final 3.0 Å map determined by gold standard Fourier shell correlation using the 0.143 criterion. Local resolution estimation was performed with the Bsoft package (Heymann, 2001) using the two unfiltered half maps.
For CB2-Gi-scFv16 complex, a total of 3894 images were collected. The dataset was subjected to motion correction, CTF estimation, autopicking, 2D classification and 3D classification in RELION 2.1.0. About 1,248,405 particles were extracted for further 3D processing. We used our cryo-EM structure of CB1-AM841-Gi complex, low-pass-filtered to 60 Å, as the initial model for 3D classification in RELION. After auto-refinement and further Baycsian polishing applied to these particles in RELION3.0 improved the density map with nominal resolution of 2.9 Å. Local resolution estimation was also performed with the Bsoft package.
Model Building and Refinement
For CB1-Gi-scFv16 complex, the cryo-EM structure of CB1-FUB-Gi complex (PDB code 6N4B) was used as the starting model for model building and refinement against the electron density map. For CB2-Gi-scFv16 complex, the CB2-AM12033 crystal structure and Gi protein in CB1 were used as the starting model. The model was docked into the EM density map using Chimera (Pettersen et al., 2004), followed by iterative manual adjustment and rebuilding in COOT (Emsley et al., 2010) and phenix.real_space_refine in Phenix (Adams et al., 2010). The model statistics were validates using MolProbity (Chen et al., 2010a). Structural figures were prepared in Chimera and PyMOL (https://pymol.org/2/). The final refinement statistics are provided in Table S1. The extent of any model overfitting during refinement was measured by refining the final model against one of the half-maps and by comparing the resulting map versus model FSC curves with the two half-maps and full model.
Molecular Docking
The Schrodinger Suite 2018–4 (Schrödinger) was used to predict the ligand-binding poses for CB1 or CB2. The structures of the two receptors were processed by using the ‘Protein Preparation Wizard’ (Sastry et al., 2013) and converting of ligands from 2D to 3D structures was carried out using ‘LigPrep’ (Schrödinger). The ‘Glide’ SP was used in molecular docking (Friesner et al., 2004; Friesner et al., 2006).
Molecular Dynamics Simulation of CB1/CB2 in Complex with Agonists
The CB1 and CB2 structures were isolated from their cryo-EM complex structures and Prime (Schrödinger) was used to add missing side chains, hydrogens and cap the termini of the receptors. The residues D1632.50, D2133.49 in CB1, D802.50, D1303.49 in CB2 were manually protonated to simulate the protonation upon GPCR activation (Ranganathan et al., 2014). Then the processed CB1 or CB2 in complex with agonists (AM841, HU-308 or L-759,656) was embedded in a bilayer composed of 140 1-palmitoyl-2-oleoyl-sn-glycero-3-phosphocholine (POPC) lipids using the CHARMM-GUI Membrane Builder (23, 24). The orientation of CB1 or CB2 in the membrane is referenced to the CB1 structure (PDB: 5TGZ) in the Orientations of Proteins in Membranes (OPM) database (25). Each receptor-agonist-membrane system was solvated in a periodic 0.15 M NaCl TIP3P water box with a minimum water height of 20.0 Å on top and bottom of the system.
All simulations were performed on a GPU cluster using the CUDA version of PMEMD (Particle Mesh Ewald Molecular Dynamics) in Amber18 (AMBER 2018, University of California, San Francisco). The protein was modeled with the ff14SB protein force field (26), ligands with the GAFF2 force field (24) and lipids with the AMBER Lipid17 force field. The constructed system was first energy minimized for 10,000 steps, of which the first 5,000 steps were performed using the steepest descent method and the remaining 5,000 steps used the conjugate gradient method. Then the simulation system was heated from 0 to 100 K using Langevin dynamics with a constant box volume. Restraints were applied to protein, ligands, and lipids with a constant force of 10 kcal/mol/Å2. Subsequently, the temperature was increased to 310 K, where the periodic box was coupled accordingly using anisotropic Berendsen control in order to maintain the pressure at around 1 atm. These restraints were then removed from lipids and the system was equilibrated for another 10 ns at the constant pressure and temperature ensemble (NPT). Further equilibration was then carried out at 310 K with harmonic restraints applied to the protein starting at 5 kcal/mol/Å2 and reduced in a stepwise fashion every 2 ns for 10 ns, followed by 0.1 kcal/mol/Å2 restraints for 20 ns for a total of 30 ns of equilibration. Then 2 ms production simulations with no restraints were performed at 310 K and 1 bar in the NPT ensemble for each system. The Particle mesh Ewald (PME) method (Darden et al., 1993) was used to treat all electrostatic interactions beyond a cutoff of 9 Å. The SHAKE algorithm (Ryckaert et al., 1977) was used for recording the length of bonds involving hydrogen during the simulation with an integration time step of 2 fs.
Snapshots from each trajectory were saved every 40 ps during the production runs and these trajectories were used for analysis with Visual Molecular Dynamics (VMD) (27) and CPPTRAJ (28).
Metadynamics Simulations
To investigate the ligand-binding processes and ligand selectivity, we introduced well-tempered metaMD simulations. We choose two collective variables for our simulations: (1) distance between the mass center of a ligand and that of the binding pocket; (2) distance between the mass center of N-terminal and that of ECL2 loop. All membrane systems were built in CHARMM-GUI (Jo et al., 2008), under Charmm36m force field (Huang et al., 2017). Each system contains 132 POPC lipids, 14400 water molecules as well as 0.15 M NaCl. For the details of metaMD simulations, please see our previously published work (Chan et al., 2018; Yuan et al., 2016).
Cyclic AMP Accumulation Assay
Inhibition of forskolin-stimulated cAMP production was measured using the CISBIO® cAMP Homogeneous Time-Resolved Fluorescence Resonance Energy Transfer (HTRF) (FRET) HiRange assay kit according to the manufacturers protocol (Cisbio Assays, Bedford, MA). CHO-hCB2 cells were plated in low-volume 384-well plates (4000/well) using Opti-MEM supplemented with 1% FBS following suspension in 5mM EDTA/PBS. Cells were treated for 30 min with 25μM of phosphodiesterase inhibitor (RO-20–1724), 20mM forskolin, and test compounds. Compounds were dissolved and diluted in DMSO to a final concentration of 1%. Plates were developed by adding the cAMP-d2 antibody and the cryptate solution in lysis buffer for 60 min at room temperature. Fluorescent measures were acquired at 620/665 nm using a Perkin-Elmer EnVision plate reader (Weltham, MA) and FRET was calculated as the 665/620 ratio. In all experiments, 1% DMSO was used as the vehicle and the response was normalized to the percent of response produced by the full agonist CP55,940. Agonist and antagonist drug additions were made at the same time.
QUANTIFICATION AND STATISTICAL ANALYSIS
The determination of agonist potency and relative efficacy was determined by 3 parameter nonlinear regression with responses normalized to the Emax produced by CP55,940 in each individual experiment (N = 7 individual assays performed in duplicate) to generate the % CP55,940 graphed in the figure. The determination of antagonist affinity was calculated using a modified version of Schild’s method of dose-ratio comparison. At concentrations higher than 10 nM, SR144528 caused a decrease in the baseline activity of the system. It was therefore necessary to include this effect when analyzing the antagonist-mediated shift in the agonist EC50. Specifically, the bottom of the curve was permitted to float freely and the x-value of each response curve was interpolated where 50% of the maximum response was achieved. The dose-ratio of these interpolated values was used to produce the linearization and estimates of antagonist affinity. All analyses were performed using Prism 8.1 (GraphPad).
DATA AND CODE AVAILABILITY
Data Resources
Coordinates and structures factors have been deposited in the Protein Data Bank for CB2-AM12033 (PDB: 6KPC), CB2-AM12033-Gi-scFv16 (PDB: 6KPF) and CB1-AM841-Gi-scFv16 (PDB: 6KPG).
Supplementary Material
KEY RESOURCES TABLE
| REAGENT or RESOURCE | SOURCE | IDENTIFIER |
|---|---|---|
| Chemicals, Peptides, and Recombinant Proteins | ||
| EDTA-free complete protease inhibitor cocktail tablets | Roche | Cat#5056489001 |
| Iodoacetamide | Sigma | Cat#I1149 |
| Lauryl Maltose Neopentyl Glycerol (LMNG) | Anatrace | Cat#4216588 |
| Cholesterol hemisucinate (CHS) | Sigma | Cat#C6512 |
| TCEP | Thermo Fisher Scientific | Cat#77720 |
| Apyrase | New England Biolabs | Cat#M0398S |
| GDN (glycol-diosgenin): Synthetic Digitonin Substitute | Anatrace | Cat#GDN101 |
| Ethylenediamine Tetraacetic Acid (EDTA) | Fisher Scientific | Cat#S311-500 |
| N-[4-(7-diethylamino-4-methyl-3-coumarinyl)phenyl]maleimide (CPM) | Invitrogen | Cat#D10251 |
| TALON IMAC resin | Clontech | Cat#635507 |
| 1-Oleoyl-rac-glycerol (monoolein) | Sigma | Cat#M7765 |
| Magnesium Chloride | Fisher Scientific | Cat#BP214-500 |
| Protein Assay Dye | Biorad | 5000006 |
| Cholesterol | Sigma | Cat#C8667 |
| CP55,940 | Tocris | Cat#0949 |
| AM12033 | This paper | N/A |
| AM841 | This paper | N/A |
| [3H]CP55,940 | NIDA Drug Supply Program | NOCD-092 |
| SR144528 | NIDA Drug Supply Program | NOCD-085 |
| 4-methyl-5-phenyl-1H-pyrazole-3-carboxylic acid | ChemBridge | 4036397 |
| 1-adamantylamine | Sigma-Aldrich | 138576 |
| O-(benzotriazol-1-yl)-N,N,N’,N’-tetramethyluronium tetrafluoroborate | Sigma-Aldrich | 12806 |
| Hünig’s base | Sigma-Aldrich | D125806 |
| Sodium Hydride | Sigma-Aldrich | 452912 |
| 5-Bromo-1-pentanol | Sigma-Aldrich | 670855 |
| N,N-Dimethylformamide | Sigma-Aldrich | 227056 |
| dichloromethane | Sigma-Aldrich | D65100 |
| sodium sulfate | Sigma-Aldrich | 239313 |
| silica gel columns | Biotage | FSUL-0442 |
| Critical Commercial Assays | ||
| HTRF HiRange cAMP Assay Kit | CISBIO | Cat# 62AM6PEC |
| PathHunter Detection Kit | DiscoveRx | Cat#93-0001 |
| Q5 site directed mutagenesis kit | NEB | Cat#E0554S |
| In-Fusion® HD EcoDry™ Cloning System | Clontech | Cat#639684 |
| Deposited Data | ||
| CB2_AM12033 complex structure | This paper | PDB: 6KPC |
| CB2-Gi EM map | This paper | PDB: 6KPF |
| CB1-Gi EM map | This paper | PDB: 6KPG |
| Experimental Models: Cell Lines | ||
| Spodoptera frugiperda (Sf9) | Expression Systems | N/A |
| HEK293F human cell line | Expression Systems | CRL-1573 |
| Primers for Site-Direct Mutagenesis | ||
| G78L_forward:TTGGCTCTGGCTGACTTC | This paper | N/A |
| G78L_reverse:GCTGCCAATGAACAGGTATG | This paper | N/A |
| T127A_forward:GCTGGCCGCCATTGA | This paper | N/A |
| T127A_reverse:AGGAGGCTACCCACAGA | This paper | N/A |
| T153L_forward:GGTGCTCCTGGGCATC | This paper | N/A |
| T153L_reverse:AGTGCCCTTCCACGG | This paper | N/A |
| G210A_forward: ATCATCTACACCTATGCCCACGTGCTCTGGAAG | This paper | N/A |
| G210A_reverse: CTTCCAGAGCACGTGGGCATAGGTGTAGATGAT | This paper | N/A |
| R242E_forward:GATGTGGAGTTGGCCAAGAC | This paper | N/A |
| R242E_reverse:CAGCCTCATTCGGGCC | This paper | N/A |
| G304E_forward:GAGTGAAGAGATCCGCTCC | This paper | N/A |
| G304E_reverse:CGTAGAGCATAGATGACAGGG | This paper | N/A |
| Recombinant DNA | ||
| pFastBac1-CB2 | This paper | N/A |
| pTT5-CB1 | This paper | N/A |
| pFastBac1-Gα | This paper | N/A |
| pFastBacDual-Gβγ | This paper | N/A |
| pFastBac1-scFv16 | This paper | N/A |
| Software and Algorithms | ||
| Schrödinger Suite 2015-4 | Schrödinger | https://www.schrodinger.com |
| GROMACS 5.1.2 | Abraham et al., 2015 | www.gromacs.org |
| SwissParam | Zoete et al., 2011 | www.swissparam.ch |
| XDS | Kabsch, 2010 | Xds.mpimf-heidelberg.mpg.de |
| SCALA | www.ccp4.ac.uk/html/scala.html | |
| Phaser | McCoy et al., 2007 | www.phenix-online.org |
| Phenix | Adams et al., 2010 | www.phenix-online.org |
| Buster | Smart et al., 2012 | www.globalphasing.com/buster |
| COOT | Emsley et al., 2010 | https://www2.mrc-lmb.cam.ac.uk/personal/pemsley/coot |
| SerialEM | Mastronarde, 2005 | http://bio3d.colorado.edu/SerialEM/ |
| MotionCor2 | Zheng et al., 2017 | https://emcore.ucsf.edu/ucsf-motioncor2 |
| CTFFIND4 | Rohou and Grigorieff, 2015 | https://grigoriefflab.janelia.org/ctffind4 |
| Relion | Fernandez-Leiro and Scheres, 2017 | https://www2.mrc-lmb.cam.ac.uk/relion/index.php? title = Download_&_install |
| CisTEM | Grant et al., 2018 | https://cistem.org/ |
| Prism v.7.0 | GraphPad Software | N/A |
| Other | ||
| Solid white 384-well assay plates | VWR | Cat#82051-278 (CS) |
| Low-volume (20 μL) 384-well assay plates | VWR | Cat#784080 |
| DMEM/F-12 (1:1) cell culture media | Invitrogen | Cat#11330-057 |
| Opti-MEM cell culture media | Invitrogen | Cat#11058-021 |
| FreeStyle™ 293 Expression Medium | Life Technologies | Cat#12338-026 |
| DMEM | Invitrogen | Cat#11965-118 |
| MEM | Invitrogen | Cat#11095-098 |
| Phoenix package system | Stanford University | N/A |
| Penicillin/Streptomycin | Invitrogen | Cat#15140-122 |
| Puromycin | Invitrogen | Cat#A11138-03 |
| Hygromycin B | Life Technologies | Cat#10687-010 |
| Geneticin | Life Technologies | Cat#10131-035 |
| Bovine Serum Albumin, Fraction V, Cold-ethanol Precipitated | Fisher Scientific | Cat#BP1605100 |
| Trypsin 0.5% EDTA | Invitrogen | Cat#25300-120 |
| Dulbecco’s phosphate-buffered saline (DPBS) | Invitrogen | Cat#14190250 |
| 4’,6-Diamidino-2-phenylindole dihydrochloride (DAPI) | Sigma | Cat#D8417 |
| Fetal Bovine Serum (FBS) | Life Technologies | Cat#16140089 |
| Glass bottom dishes-uncoated (confocal plates) | MatTek | Cat#P35G-10-14-C |
| Collagen I | Fisher | Cat#CB40231 |
| 100kDa cutoff concentrators | Sartorius | Cat#VS0642 |
| PD Minitrap G-25 coulmn | GE Healthcare | Cat#28-9180-07 |
| 96-well glass sandwich plates for LCP crystallization | NOVA | Cat#NOA90020 |
| Lipofectamine® 2000 | Thermo Scientific | 11668027 |
| 96-well white microplate with bonded GF/B filter | PerkinElmer | Cat#6005177 |
| 500 cm2 Square Cell Culture Dish | Corning | Cat#431110 |
Highlights.
3D structures of CB2-AM12033-Gi, CB1-AM841-Gi, and CB2-AM12033 are determined
Structural evidence of G protein selectivity by CB1 and CB2 is identified
MD simulations reveal the distinct binding behavior of HU308 in CB2 and CB1
Cholesterol molecule as an endogenous allosteric modulator of CB1 is uncovered
ACKNOWLEDGMENTS
This work was supported by the National Natural Science Foundation of China grant 31870744 (T.H.); National Key Research and Development Program of China grant 2018YFA0507000 (T.H.); NIH grants R01DA045020 (A.M. and L.-M.B.), R01DA041435 (A.M.), and P01DA009158 (A.M. and L.-M.B.). We thank the Shanghai Municipal Government and ShanghaiTech University for financial support. The cryo-EM data were collected at the Bio-Electron Microscopy Facility of ShanghaiTech University with the assistance of D. Liu. The synchrotron radiation experiments were performed at the BL41XU of Spring-8 with approval of the Japan Synchrotron Radiation Research Institute (JASRI) (proposal no. 2019A2520 and 2019A2721). We thank J. Liu and N. Chen from Cell Expression Core, as well as the Cloning, Protein Purification, and Assay Cores of iHuman Institute for their support. We thank Julie Liu and Vera Nazarenko for graphical abstract design.
Footnotes
Data Resources
6KPC
6KPF
6KPG
SUPPLEMENTAL INFORMATION
Supplemental Information can be found online at https://doi.org/10.1016/j.cell.2020.01.008.
DECLARATION OF INTERESTS
The authors declare no competing interests.
REFERENCES
- Abraham MJ, Murtola T, Schulz R, Páll S, Smith JC, Hess B, and Lindahl E (2015). GROMACS: High performance molecular simulations through multi-level parallelism from laptops to supercomputers. SoftwareX, 1–2, 19–25. [Google Scholar]
- Adams PD, Afonine PV, Bunkóczi G, Chen VB, Davis IW, Echols N, Headd JJ, Hung LW, Kapral GJ, Grosse-Kunstleve RW, et al. (2010). PHENIX: a comprehensive Python-based system for macromolecular structure solution. Acta Crystallogr. D Biol. Crystallogr 66, 213–221. [DOI] [PMC free article] [PubMed] [Google Scholar]
- Ballesteros JA, and Weinstein H (1995). Integrated methods for the construction of three-dimensional models and computational probing of structure-function relations in G protein-coupled receptors. Methods in Neurosciences 25, 366–428. [Google Scholar]
- Barducci A, Bussi G, and Parrinello M (2008). Well-tempered metadynamics: a smoothly converging and tunable free-energy method. Phys. Rev. Lett 100, 020603. [DOI] [PubMed] [Google Scholar]
- Barducci A, Bonomi M, and Parrinello M (2011). Metadynamics. WIREs Comput. Mol. Sci 1, 826–843. [Google Scholar]
- Bonomi M, Barducci A, and Parrinello M (2009). Reconstructing the equilibrium Boltzmann distribution from well-tempered metadynamics. J. Comput. Chem 30, 1615–1621. [DOI] [PubMed] [Google Scholar]
- Caffrey M, and Cherezov V (2009). Crystallizing membrane proteins using lipidic mesophases. Nat. Protoc 4, 706–731. [DOI] [PMC free article] [PubMed] [Google Scholar]
- Chan HCS, Wang J, Palczewski K, Filipek S, Vogel H, Liu ZJ, and Yuan S (2018). Exploring a new ligand binding site of G protein-coupled receptors. Chem. Sci. (Camb.) 9, 6480–6489. [DOI] [PMC free article] [PubMed] [Google Scholar]
- Chen VB, Arendall WB 3rd, Headd JJ, Keedy DA, Immormino RM, Kapral GJ, Murray LW, Richardson JS, and Richardson DC (2010a). MolProbity: all-atom structure validation for macromolecular crystallography. Acta Crystallogr. D Biol. Crystallogr 66, 12–21. [DOI] [PMC free article] [PubMed] [Google Scholar]
- Chen XP, Yang W, Fan Y, Luo JS, Hong K, Wang Z, Yan JF, Chen X, Lu JX, Benovic JL, and Zhou NM (2010b). Structural determinants in the second intracellular loop of the human cannabinoid CB1 receptor mediate selective coupling to G(s) and G(i). Br. J. Pharmacol 161, 1817–1834. [DOI] [PMC free article] [PubMed] [Google Scholar]
- Cherezov V, Hanson MA, Griffith MT, Hilgart MC, Sanishvili R, Nagarajan V, Stepanov S, Fischetti RF, Kuhn P, and Stevens RC (2009). Rastering strategy for screening and centring of microcrystal samples of human membrane proteins with a sub-10 microm size X-ray synchrotron beam. J. R. Soc. Interface 6 (Suppl 5), S587–S597. [DOI] [PMC free article] [PubMed] [Google Scholar]
- Contino M, Capparelli E, Colabufo NA, and Bush AI (2017). Editorial: The CB2 Cannabinoid System: A New Strategy in Neurodegenerative Disorder and Neuroinflammation. Front. Neurosci 11, 196. [DOI] [PMC free article] [PubMed] [Google Scholar]
- D’Antona AM, Ahn KH, and Kendall DA (2006). Mutations of CB1 T210 produce active and inactive receptor forms: correlations with ligand affinity, receptor stability, and cellular localization. Biochemistry 45, 5606–5617. [DOI] [PMC free article] [PubMed] [Google Scholar]
- Darden T, York D, and Pedersen L (1993). Particle mesh Ewald: An Nlog(N) method for Ewald sums in large systems. J. Chem. Phys 98, 10089–10092. [Google Scholar]
- Draper-Joyce CJ, Khoshouei M, Thal DM, Liang YL, Nguyen ATN, Furness SGB, Venugopal H, Baltos JA, Plitzko JM, Danev R, et al. (2018). Structure of the adenosine-bound human adenosine A1 receptor-Gi complex. Nature 558, 559–563. [DOI] [PubMed] [Google Scholar]
- Emsley P, Lohkamp B, Scott WG, and Cowtan K (2010). Features and development of Coot. Acta Crystallogr. D Biol. Crystallogr 66, 486–501. [DOI] [PMC free article] [PubMed] [Google Scholar]
- Erlandson SC, McMahon C, and Kruse AC (2018). Structural Basis for G Protein-Coupled Receptor Signaling. Annu. Rev. Biophys Published online March 2, 2018. 10.1146/annurev-biophys-070317-032931. [DOI] [PubMed] [Google Scholar]
- Fernandez-Leiro R, and Scheres SHW (2017). A pipeline approach to single-particle processing in RELION. Acta. Crystallogr. D. Struct. Biol 73, 496–502. [DOI] [PMC free article] [PubMed] [Google Scholar]
- Friesner RA, Banks JL, Murphy RB, Halgren TA, Klicic JJ, Mainz DT, Repasky MP, Knoll EH, Shelley M, Perry JK, et al. (2004). Glide: a new approach for rapid, accurate docking and scoring. 1. Method and assessment of docking accuracy. J. Med. Chem 47, 1739–1749. [DOI] [PubMed] [Google Scholar]
- Friesner RA, Murphy RB, Repasky MP, Frye LL, Greenwood JR, Halgren TA, Sanschagrin PC, and Mainz DT (2006). Extra precision glide: docking and scoring incorporating a model of hydrophobic enclosure for protein-ligand complexes. J. Med. Chem 49, 6177–6196. [DOI] [PubMed] [Google Scholar]
- García-Nafría J, Nehmé R, Edwards PC, and Tate CG (2018). Cryo-EM structure of the serotonin 5-HT1B receptor coupled to heterotrimeric Go. Nature 558, 620–623. [DOI] [PMC free article] [PubMed] [Google Scholar]
- Glass M, and Felder CC (1997). Concurrent stimulation of cannabinoid CB1 and dopamine D2 receptors augments cAMP accumulation in striatal neurons: evidence for a Gs linkage to the CB1 receptor. J. Neurosci 17, 5327–5333. [DOI] [PMC free article] [PubMed] [Google Scholar]
- Grant T, Rohou A, and Grigorieff N (2018). cisTEM: user-friendly software for single-particle image processing. eLife 7, e14874. [DOI] [PMC free article] [PubMed] [Google Scholar]
- Guzmán M (2003). Cannabinoids: potential anticancer agents. Nat. Rev. Cancer 3, 745–755. [DOI] [PubMed] [Google Scholar]
- Hanus L, Breuer A, Tchilibon S, Shiloah S, Goldenberg D, Horowitz M, Pertwee RG, Ross RA, Mechoulam R, and Fride E (1999). HU-308: a specific agonist for CB(2), a peripheral cannabinoid receptor. Proc. Natl. Acad. Sci. USA 96, 14228–14233. [DOI] [PMC free article] [PubMed] [Google Scholar]
- Heymann JB (2001). Bsoft: image and molecular processing in electron microscopy. J. Struct. Biol 133, 156–169. [DOI] [PubMed] [Google Scholar]
- Hua T, Vemuri K, Pu M, Qu L, Han GW, Wu Y, Zhao S, Shui W, Li S, Korde A, et al. (2016). Crystal Structure of the Human Cannabinoid Receptor CB1. Cell 167, 750–762.14. [DOI] [PMC free article] [PubMed] [Google Scholar]
- Hua T, Vemuri K, Nikas SP, Laprairie RB, Wu Y, Qu L, Pu M, Korde A, Jiang S, Ho JH, et al. (2017). Crystal structures of agonist-bound human cannabinoid receptor CB1. Nature 547, 468–471. [DOI] [PMC free article] [PubMed] [Google Scholar]
- Huang J, Rauscher S, Nawrocki G, Ran T, Feig M, de Groot BL, Grubmüller H, and MacKerell AD Jr. (2017). CHARMM36m: an improved force field for folded and intrinsically disordered proteins. Nat. Methods 14, 71–73. [DOI] [PMC free article] [PubMed] [Google Scholar]
- Jo S, Kim T, Iyer VG, and Im W (2008). CHARMM-GUI: a web-based graphical user interface for CHARMM. J. Comput. Chem 29, 1859–1865. [DOI] [PubMed] [Google Scholar]
- Kabsch W (2010). Integration, scaling, space-group assignment and post-refinement. Acta Crystallogr. D Biol. Crystallogr 66, 133–144. [DOI] [PMC free article] [PubMed] [Google Scholar]
- Koehl A, Hu H, Maeda S, Zhang Y, Qu Q, Paggi JM, Latorraca NR, Hilger D, Dawson R, Matile H, et al. (2018). Structure of the μ-opioid receptor-Gi protein complex. Nature 558, 547–552. [DOI] [PMC free article] [PubMed] [Google Scholar]
- Krishna Kumar K, Shalev-Benami M, Robertson MJ, Hu H, Banister SD, Hollingsworth SA, Latorraca NR, Kato HE, Hilger D, Maeda S, et al. (2019). Structure of a Signaling Cannabinoid Receptor 1-G Protein Complex. Cell 176, 448–458.e12. [DOI] [PMC free article] [PubMed] [Google Scholar]
- Lauckner JE, Hille B, and Mackie K (2005). The cannabinoid agonist WIN55,212–2 increases intracellular calcium via CB1 receptor coupling to Gq/11 G proteins. Proc. Natl. Acad. Sci. USA 102, 19144–19149. [DOI] [PMC free article] [PubMed] [Google Scholar]
- Lemberger L (1980). Potential therapeutic usefulness of marijuana. Annu. Rev. Pharmacol. Toxicol 20, 151–172. [DOI] [PubMed] [Google Scholar]
- Li X, Hua T, Vemuri K, Ho JH, Wu Y, Wu L, Popov P, Benchama O, Zvonok N, Locke K, et al. (2019). Crystal Structure of the Human Cannabinoid Receptor CB2. Cell 176, 459–467.e13. [DOI] [PMC free article] [PubMed] [Google Scholar]
- Liu Y, Ji L, Eno M, Kudalkar S, Li AL, Schimpgen M, Benchama O, Morales P, Xu S, Hurst D, et al. (2018). (R)- N-(1-Methyl-2-hydroxyethyl)-13-(S)-methyl-arachidonamide (AMG315): A Novel Chiral Potent Endocannabinoid Ligand with Stability to Metabolizing Enzymes. J. Med. Chem 61, 8639–8657. [DOI] [PubMed] [Google Scholar]
- Lunn CA, Reich EP, Fine JS, Lavey B, Kozlowski JA, Hipkin RW, Lundell DJ, and Bober L (2008). Biology and therapeutic potential of cannabinoid CB2 receptor inverse agonists. Br. J. Pharmacol 153, 226–239. [DOI] [PMC free article] [PubMed] [Google Scholar]
- Maeda S, Qu Q, Robertson MJ, Skiniotis G, and Kobilka BK (2019). Structures of the M1 and M2 muscarinic acetylcholine receptor/G-protein complexes. Science 364, 552–557. [DOI] [PMC free article] [PubMed] [Google Scholar]
- Makriyannis A, D’Souza MR, Sharma R, Nikas SP, and Thakur GA (2014). 2-cycloalkyl resorcinol cannabinergic ligands. Northeastern University patent application WO2014062965 A1, filed October 17, 2013, and published April 24, 2014.
- Makriyannis A, Nikas SP, Khanolkar A, and Thakur GA (2007). Methods of preparation and use of novel bicyclic cannabinoids. University of Connecticut patent application US20070135388 A1, filed December 12, 2006, and published June 14, 2007.
- Mastronarde DN (2005). Automated electron microscope tomography using robust prediction of specimen movements. J. Struct. Biol 152, 36–51. [DOI] [PubMed] [Google Scholar]
- McCoy AJ, Grosse-Kunstleve RW, Adams PD, Winn MD, Storoni LC, and Read RJ (2007). Phaser crystallographic software. J. Appl. Cryst 40, 658–674. [DOI] [PMC free article] [PubMed] [Google Scholar]
- Munro S, Thomas KL, and Abu-Shaar M (1993). Molecular characterization of a peripheral receptor for cannabinoids. Nature 365, 61–65. [DOI] [PubMed] [Google Scholar]
- Nikas SP, Thakur GA, Parrish D, Alapafuja SO, Huestis MA, and Makriyannis A (2007). A concise methodology for the synthesis of (−)-Δ 9-tetrahydrocannabinol and (−)-Δ 9-tetrahydrocannabivarin metabolites and their regiospecifically deuterated analogs. Tetrahedron 63, 8112–8123. [Google Scholar]
- Nikas SP, Alapafuja SO, Papanastasiou I, Paronis CA, Shukla VG, Papahatjis DP, Bowman AL, Halikhedkar A, Han X, and Makriyannis A (2010). Novel 1′,1′-chain substituted hexahydrocannabinols: 9β-hydroxy-3-(1-hexyl-cyclobut-1-yl)-hexahydrocannabinol (AM2389) a highly potent cannabinoid receptor 1 (CB1) agonist. J. Med. Chem 53, 6996–7010. [DOI] [PMC free article] [PubMed] [Google Scholar]
- Nikas SP, Sharma R, Paronis CA, Kulkarni S, Thakur GA, Hurst D, Wood JT, Gifford RS, Rajarshi G, Liu Y, et al. (2015). Probing the carboxyester side chain in controlled deactivation (−)-δ(8)-tetrahydrocannabinols. J. Med. Chem 58, 665–681. [DOI] [PMC free article] [PubMed] [Google Scholar]
- Pettersen EF, Goddard TD, Huang CC, Couch GS, Greenblatt DM, Meng EC, and Ferrin TE (2004). UCSF Chimera-a visualization system for exploratory research and analysis. J. Comput. Chem 25, 1605–1612. [DOI] [PubMed] [Google Scholar]
- Ranganathan A, Dror RO, and Carlsson J (2014). Insights into the role of Asp79(2.50) in β2 adrenergic receptor activation from molecular dynamics simulations. Biochemistry 53, 7283–7296. [DOI] [PubMed] [Google Scholar]
- Rohou A, and Grigorieff N (2015). CTFFIND4: fast and accurate defocus estimation from electron micrographs. J. Struct. Biol 192, 216–221. [DOI] [PMC free article] [PubMed] [Google Scholar]
- Ross RA, Brockie HC, Stevenson LA, Murphy VL, Templeton F, Makriyannis A, and Pertwee RG (1999). Agonist-inverse agonist characterization at CB1 and CB2 cannabinoid receptors of L759633, L759656, and AM630. Br. J. Pharmacol 126, 665–672. [DOI] [PMC free article] [PubMed] [Google Scholar]
- Ryckaert JPC, Ciccotti G, and Berendsen HJC (1977). Numerical integration of the cartesian equations of motion of a system with constrains: Molecular dynamics of n-alkanes. J. Comp. Physiol 23, 327–341. [Google Scholar]
- Sastry GM, Adzhigirey M, Day T, Annabhimoju R, and Sherman W (2013). Protein and ligand preparation: parameters, protocols, and influence on virtual screening enrichments. J. Comput. Aided Mol. Des 27, 221–234. [DOI] [PubMed] [Google Scholar]
- Savinainen JR, Saario SM, Niemi R, Järvinen T, and Laitinen JT (2003). An optimized approach to study endocannabinoid signaling: evidence against constitutive activity of rat brain adenosine A1 and cannabinoid CB1 receptors. Br. J. Pharmacol 140, 1451–1459. [DOI] [PMC free article] [PubMed] [Google Scholar]
- Scheres SH (2012). RELION: implementation of a Bayesian approach to cryo-EM structure determination. J. Struct. Biol 180, 519–530. [DOI] [PMC free article] [PubMed] [Google Scholar]
- Shao Z, Yin J, Chapman K, Grzemska M, Clark L, Wang J, and Rosenbaum DM (2016). High-resolution crystal structure of the human CB1 cannabinoid receptor. Nature 540, 602–606. [DOI] [PMC free article] [PubMed] [Google Scholar]
- Sharma R, Nikas SP, Paronis CA, Wood JT, Halikhedkar A, Guo JJ, Thakur GA, Kulkarni S, Benchama O, Raghav JG, et al. (2013). Controlled-deactivation cannabinergic ligands. J. Med. Chem 56, 10142–10157. [DOI] [PMC free article] [PubMed] [Google Scholar]
- Smart OS, Womack TO, Flensburg C, Keller P, Paciorek W, Sharff A, Vonrhein C, and Bricogne G (2012). Exploiting structure similarity in refinement: automated NCS and target-structure restraints in BUSTER. Acta Crystallogr. D Biol. Crystallogr 68, 368–380. [DOI] [PMC free article] [PubMed] [Google Scholar]
- Vallée M, Vitiello S, Bellocchio L, Hébert-Chatelain E, Monlezun S, Martin-Garcia E, Kasanetz F, Baillie GL, Panin F, Cathala A, et al. (2014). Pregnenolone can protect the brain from cannabis intoxication. Science 343, 94–98. [DOI] [PMC free article] [PubMed] [Google Scholar]
- Venkatakrishnan AJ, Deupi X, Lebon G, Tate CG, Schertler GF, and Babu MM (2013). Molecular signatures of G-protein-coupled receptors. Nature 494, 185–194. [DOI] [PubMed] [Google Scholar]
- Yuan S, Filipek S, Palczewski K, and Vogel H (2014). Activation of G-protein-coupled receptors correlates with the formation of a continuous internal water pathway. Nat. Commun 5, 4733. [DOI] [PubMed] [Google Scholar]
- Yuan S, Filipek S, and Vogel H (2016). A Gating Mechanism of the Serotonin 5-HT3 Receptor. Structure 24, 816–825. [DOI] [PubMed] [Google Scholar]
- Zhang K (2016). Gctf: Real-time CTF determination and correction. J. Struct. Biol 193, 1–12. [DOI] [PMC free article] [PubMed] [Google Scholar]
- Zheng C, Chen L, Chen X, He X, Yang J, Shi Y, and Zhou N (2013). The second intracellular loop of the human cannabinoid CB2 receptor governs G protein coupling in coordination with the carboxyl terminal domain. PLoS ONE 8, e63262. [DOI] [PMC free article] [PubMed] [Google Scholar]
- Zheng SQ, Palovcak E, Armache JP, Verba KA, Cheng Y, and Agard DA (2017). MotionCor2: anisotropic correction of beam-induced motion for improved cryo-electron microscopy. Nat. Methods 14, 331–332. [DOI] [PMC free article] [PubMed] [Google Scholar]
- Zoete V, Cuendet MA, Grosdidier A, and Michielin O (2011). Swiss-Param: a fast force field generation tool for small organic molecules. J. Comput. Chem 32, 2,359–2,368. [DOI] [PubMed] [Google Scholar]
Associated Data
This section collects any data citations, data availability statements, or supplementary materials included in this article.
Supplementary Materials
Data Availability Statement
Data Resources
Coordinates and structures factors have been deposited in the Protein Data Bank for CB2-AM12033 (PDB: 6KPC), CB2-AM12033-Gi-scFv16 (PDB: 6KPF) and CB1-AM841-Gi-scFv16 (PDB: 6KPG).