

Abstract
Objective
To predict response to anti–tumor necrosis factor (anti‐TNF) prior to treatment in patients with rheumatoid arthritis (RA), and to comprehensively understand the mechanism of how different RA patients respond differently to anti‐TNF treatment.
Methods
Gene expression and/or DNA methylation profiling on peripheral blood mononuclear cells (PBMCs), monocytes, and CD4+ T cells obtained from 80 RA patients before they began either adalimumab (ADA) or etanercept (ETN) therapy was studied. After 6 months, treatment response was evaluated according to the European League Against Rheumatism criteria for disease response. Differential expression and methylation analyses were performed to identify the response‐associated transcription and epigenetic signatures. Using these signatures, machine learning models were built by random forest algorithm to predict response prior to anti‐TNF treatment, and were further validated by a follow‐up study.
Results
Transcription signatures in ADA and ETN responders were divergent in PBMCs, and this phenomenon was reproduced in monocytes and CD4+ T cells. The genes up‐regulated in CD4+ T cells from ADA responders were enriched in the TNF signaling pathway, while very few pathways were differential in monocytes. Differentially methylated positions (DMPs) were strongly hypermethylated in responders to ETN but not to ADA. The machine learning models for the prediction of response to ADA and ETN using differential genes reached an overall accuracy of 85.9% and 79%, respectively. The models using DMPs reached an overall accuracy of 84.7% and 88% for ADA and ETN, respectively. A follow‐up study validated the high performance of these models.
Conclusion
Our findings indicate that machine learning models based on molecular signatures accurately predict response before ADA and ETN treatment, paving the path toward personalized anti‐TNF treatment.
INTRODUCTION
Rheumatoid arthritis (RA) is a chronic autoimmune disease leading to joint inflammation and destruction (1, 2). To date, conventional synthetic disease‐modifying antirheumatic drugs (csDMARDs), such as methotrexate, are typically given as a first‐line treatment to patients with RA in an attempt to achieve a state of low disease activity. Upon failure or loss of efficacy of csDMARDs, patients are switched to biologic DMARDs (bDMARDs), such as tumor necrosis factor inhibitors (TNFi) (3). Currently, there are different biologic TNFi, including adalimumab (ADA) and etanercept (ETN), available for clinical use (4). ADA is the first fully human therapeutic anti‐TNF monoclonal antibody, while ETN is a recombinant human TNF receptor (p75)–Fc fusion protein that competitively inhibits TNF (5). Although these TNFi have revolutionized the treatment of RA, ~30% of patients do not respond well to their initial anti‐TNF therapy (4). Treatment failure elevates the risk of adverse events such as infections and puts additional socioeconomic burden on the patients (3, 6). Thus, there is a strong unmet need to predict response to TNFi.
To predict treatment response, it is crucial to identify reliable predictors. Katchamart et al (1) and Callaghan et al (4) reviewed 18 and 154 studies, respectively, and identified several potential predictors of RA remission and response to biologic therapy, including age, sex, disease duration, disease activity, smoking status, and concomitant methotrexate therapy, among others (1, 4). Vastesaeger et al (7) developed a matrix tool based on 6 predictors (sex, Health Assessment Questionnaire, presence of comorbidities, age, tender joint count, and erythrocyte sedimentation rate) to predict remission and low disease activity in RA patients treated with golimumab (anti‐TNF) therapy. More recently, Ganhão et al (8) examined this matrix tool in real‐world RA patients receiving anti‐TNF therapy and corroborated the idea of this tool for the prediction of remission. Those studies, however, 1) did not illustrate the biologic mechanisms that underlie this differential response to the TNFi, and 2) did not examine potential treatment responses to different TNFi.
At the cellular and tissue level, RA is characterized by the chronic infiltration of immune cells in the synovial membrane (9). To understand biologic processes associated with anti‐TNF response, several transcriptomic and epigenetic studies have been conducted using the synovium and blood from patients with RA (10, 11, 12, 13, 14, 15, 16, 17, 18, 19). Those studies have demonstrated that transcriptomic and epigenetic profiling have the potential to predict response to anti‐TNF therapies before treatment. Despite the promising predictive potential, we still lack molecular insights into the predictive power of different cell types involved in the anti‐TNF response. Most studies focus on predicting response to one TNFi, and cannot predict if the patients who fail to respond to one TNFi will respond to another known TNFi (20). The gene signature used for predicting response has been shown to be unique for different TNFi (17). Thus, it is crucial to investigate the role of different cell types, especially immune cells, in RA patients receiving different anti‐TNF therapies to reveal the biologic process of specific anti‐TNF response.
Building upon the previous studies, we performed transcriptomic and epigenetic profiling of immune cell types and whole PBMCs, along with deep clinical profiling of RA patients, to generate cell‐specific profiles that can predict response to 2 TNFi—ADA and ETN—prior to treatment initiation.
PATIENTS AND METHODS
Patients in this study were selected from the BiOCURA cohort at the University Medical Center Utrecht (18). BiOCURA is an observational cohort in which patients with RA who are eligible for treatment both with TNFi agents (ADA, ETN, infliximab, golimumab, and certolizumab pegol) and with non‐TNFi agents (tocilizumab, abatacept, and rituximab) were enrolled and followed up for 12 months after the initiation of treatment. All csDMARDs (methotrexate, hydroxychloroquine, leflunomide, and glucocorticoids) were allowed concomitantly with the bDMARD. Patients’ responses were evaluated based on the Disease Activity Score in 28 joints (DAS28) at baseline and after 6 months of treatment according to European League Against Rheumatism (EULAR) criteria (21). (For the patients with a follow‐up duration of <6 months, response evaluation was based on DAS28 at baseline and at the last visit, which showed that all of these patients were nonresponders to either ADA or ETN).
Stratified random sampling was carried out to retain 80 of 212 patients with RA who were treated with either ADA or ETN alone and were followed up for ≥6 months (for responders) in this study for further analysis. We first isolated peripheral blood mononuclear cells (PBMCs) from these patients prior to ADA or ETN treatment (Figure 1A). Then genome‐wide gene expression and DNA methylation profiling were performed on these PBMCs, using RNA sequencing and an Infinium MethylationEPIC BeadChip kit, respectively. (RNA sequencing data and DNA methylation data can be accessed at GEO accession no. GSE138747). RNA sequencing on CD14+ monocytes and CD4+ T cells isolated from the PBMCs were performed to gain more insights into different responses to anti‐TNF. Using the gene expression and DNA methylation signatures, we then built and internally validated machine learning models to predict response to ADA and ETN (Figure 1B). Finally, 9 patients were used to externally validate the prediction that was made by the machine learning models. A detailed description of the methods conducted in this study can be found in the Supplementary Methods, available on the Arthritis & Rheumatology website at http://onlinelibrary.wiley.com/doi/10.1002/art.41516/abstract.
Figure 1.
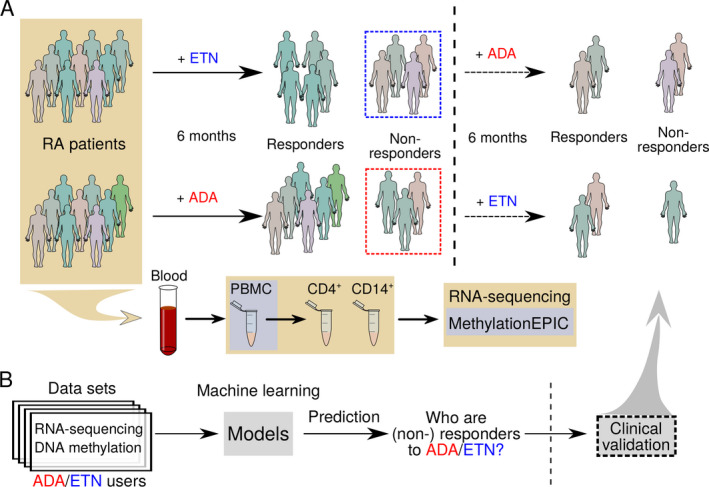
Flow chart showing the study methods. A, Blood samples were obtained from patients with rheumatoid arthritis (RA) at baseline, and patients were treated with subcutaneous adalimumab (ADA) or etanercept (ETN) for 6 months. Peripheral blood mononuclear cells (PBMCs) were isolated for RNA sequencing and DNA methylation profiling. CD4+ T cells and CD14+ monocytes were then isolated for RNA sequencing. Patients were classified as responders or nonresponders according to European League Against Rheumatism criteria at the end of month 6. Patients who did not respond to ADA were switched to ETN, and patients who did not respond to ETN were switched to ADA, for 6 months and treatment responses were observed. B, RNA sequencing data sets and DNA methylation data sets were used to build machine learning models to predict treatment responses at baseline.
RESULTS
Demographic and disease characteristics of the patients
The characteristics of the patients are summarized in Table 1 and Supplementary Table 1, available on the Arthritis & Rheumatology website at http://onlinelibrary.wiley.com/doi/10.1002/art.41516/abstract. Eighty patients with RA were selected from the BiOCURA study (18), of which 38 (47.5%) and 42 (52.5%) were treated with ADA (ADA cohort) and ETN (ETN cohort), respectively. In each cohort ~70% of the patients were women. At baseline, the mean ages of the patients in the ADA cohort and the ETN cohort were 53.34 years and 54.27 years, respectively. After 6 months of treatment, 11, 9, and 18 patients showed good, moderate, and no response, respectively, to ADA, while 11, 8, and 23 patients showed good, moderate, and no response, respectively, to ETN. No significant difference was observed between the cohorts in terms of either age, sex, smoking status, weight, height, alcohol use, rheumatoid factor positivity, anti–cyclic citrullinated peptide (anti‐CCP) positivity, bDMARD exposure, hemoglobin, leukocyte, and thrombocyte counts at baseline, or drug response rate after 6 months of treatment (Supplementary Table 1).
Table 1.
Demographic and baseline clinical characteristics of the RA patients in the ADA and ETN cohorts*
| ADA | ETN | |||
|---|---|---|---|---|
|
Nonresponder (n = 18) |
Responder (n = 20) |
Nonresponder (n = 23) |
Responder (n = 19) |
|
| Sex, no. | ||||
| Female | 13 | 14 | 16 | 13 |
| Male | 5 | 6 | 7 | 6 |
| Smoking, no. | ||||
| Never | 4 | 5 | 10 | 5 |
| Stopped | 8 | 10 | 8 | 12 |
| Yes | 6 | 5 | 5 | 2 |
| RF, no. | ||||
| Negative | 9 | 5 | 6 | 5 |
| Positive | 9 | 15 | 17 | 14 |
| Anti‐CCP, no. | ||||
| Negative | 6 | 5 | 5 | 4 |
| Positive | 12 | 15 | 18 | 15 |
| bDMARD naive, no. | ||||
| No | 10 | 6 | 13 | 5 |
| Yes | 8 | 14 | 10 | 14 |
| Age, years | 53.4 ± 11.6 | 53.3 ± 13.2 | 56.95 ± 9.51 | 51.03 ± 11.31 |
| Weight, kg | 79.23 ± 15.51 | 81.91 ± 16.87 | 81.55 ± 15.56 | 81.27 ± 18.73 |
| Height, cm | 173.56 ± 9.06 | 175.8 ± 11.27 | 173.57 ± 12.42 | 173.11 ± 6.91 |
| Alcohol use, units/week | 3.39 ± 4.64 | 3.5 ± 4.29 | 5.13 ± 7.12 | 4.22 ± 5.04 |
| Hemoglobin count, gm/dl | 8.45 ± 0.77 | 8.44 ± 0.74 | 8.60 ± 0.74 | 8.39 ± 0.60 |
| Leukocyte count x 109/liter | 9.59 ± 4.61 | 7.42 ± 2.15 | 8.02 ± 1.94 | 7.53 ± 2.01 |
| Thrombocyte count x 109/liter | 296.88 ± 51.38 | 261.15 ± 62.53 | 278.22 ± 57.11 | 289.06 ± 70.2 |
There were no significant differences, determined by Fisher’s exact test for categorical variables and by Welch’s 2‐sample t‐test for continuous variables, between responders and nonresponders in either the adalimumab (ADA) or etanercept (ETN) cohort. Except where indicated otherwise, values are the mean ± SD. RF = rheumatoid factor; anti‐CCP = anti–cyclic citrullinated peptide; bDMARD = biologic disease‐modifying antirheumatic drug.
To increase statistical power, we combined patients with good response and those with moderate response, and designated them as responders. Thus, 53% of patients receiving ADA (20 of 38) and 45% of patients receiving ETN (19 of 42) were considered to be responders. No significant difference was observed between responders and nonresponders at baseline for clinical parameters in either cohort (Table 1).
Distinct gene signatures of responders to ADA and ETN
We first studied the molecular signatures of circulating PBMCs and identified 549 differentially expressed genes (DEGs) (nominal P < 0.05) between ADA responders and nonresponders (Figure 2A and Supplementary Figure 1, available on the Arthritis & Rheumatology website at http://onlinelibrary.wiley.com/doi/10.1002/art.41516/abstract). Similarly, we identified 460 DEGs between ETN responders and nonresponders (Figure 2B and Supplementary Figure 1). For the ADA cohort, genes involved in DNA and nucleotide binding, such as RFX2, IRF8, and TAF1, were differentially expressed between responders and nonresponders. Similarly, in the ETN cohort, genes involved in DNA and nucleotide binding such as FOXO4 and TAF11, and TNF receptor signaling, such as TRAF6, were differentially expressed between responders and nonresponders (Figures 2C and D). Interestingly, the expression of TNF was not associated with the response to either ADA or ETN (both P > 0.05) (Figures 2C and D).
Figure 2.
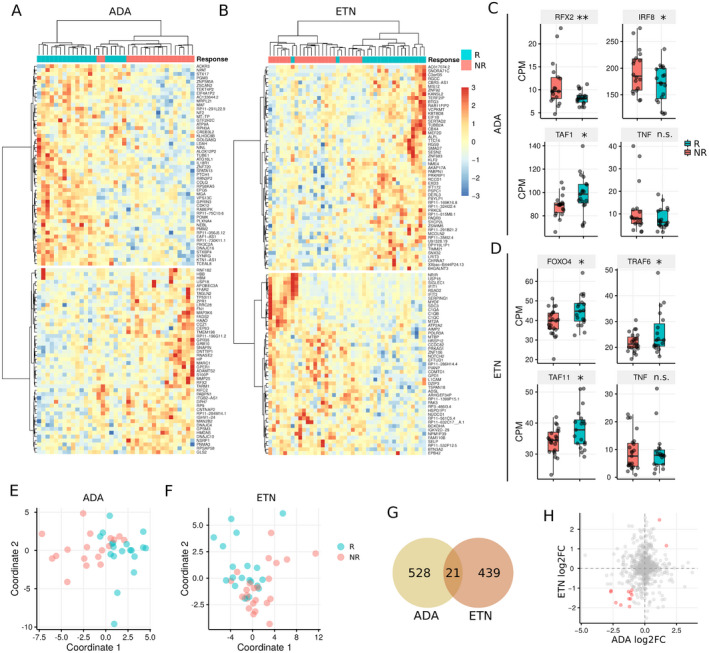
Differences between gene expression in PBMCs from responders (R) versus nonresponders (NR) to ADA or ETN. A and B, Heatmaps showing the top 100 differentially expressed genes (DEGs) in PBMCs from responders versus nonresponders to ADA (A) and ETN (B). C and D, Expression of example DEGs in responders and nonresponders to ADA (C) and ETN (D). Data are shown as box plots in the style of Tukey. Each box represents the 25th to 75th percentiles. Lines inside the boxes represent the median. Whiskers outside the boxes represent the lowest and highest data points excluding the outliers. The outliers are determined by 1.5‐interquartile range criteria. Circles represent individual patients. E and F, Multidimensional scaling plots based on gene expression data showing clusters of patient response to ADA (E) and ETN (F). G, Venn diagram showing the overlap in DEGs between patients receiving ADA and patients receiving ETN. H, Scatterplot showing differences in fold change (FC) in RNA expression for DEGs in the ADA cohort and the ETN cohort. * = P < 0.05; ** = P < 0.01. CPM = count per million; NS = not significant (see Figure 1 for other definitions). Color figure can be viewed in the online issue, which is available at http://onlinelibrary.wiley.com/doi/10.1002/art.41516/abstract.
Multidimensional scaling analysis performed using DEGs showed that we can differentiate between responders and nonresponders in each cohort (Figures 2A, B, E, and F). Since both ADA and ETN are TNFi, we checked the overlap in DEGs identified from the 2 cohorts. Notably, only 2% of DEGs (21 of 988) overlapped between the 2 cohorts, and even fewer genes were differentially expressed in the same direction (Figures 2G and H). Taken together, these results suggest that responses to ADA and ETN are defined by distinct gene signatures.
Distinct DNA methylation profiles in responders to ETN and responders to ADA
Genome‐wide DNA methylation analysis of PBMCs from the same patients identified 16,141 and 17,026 differentially methylated positions (DMPs) of CpG sites (nominal P < 0.05) associated with response to ADA and ETN, respectively (Figures 3A and B and Supplementary Figure 2, available on the Arthritis & Rheumatology website at http://onlinelibrary.wiley.com/doi/10.1002/art.41516/abstract). These DMPs are distributed on or near 7,719 and 7,850 genes, with an average of 2.09 and 2.17 DMPs per gene for the ADA and ETN cohorts, respectively. Multidimensional scaling plots showed clear differences between responders and nonresponders for both ETN and ADA using these DMPs (Figures 3C and D). Approximately 46% (n = 7,424) of the DMPs were hypermethylated in ADA responders, while a drastically higher fraction of DMPs (76.3%; n = 12,994) were hypermethylated in ETN responders. We found more hypermethylated DMPs in the upstream and promoter regions of genes (Figure 3E) and on CpG islands (Figure 3F) in ADA responders. In contrast, globally more hypermethylated DMPs were found in ETN responders (Figures 3G and H). Thus, on the epigenetic level, we observed a distinct hypermethylation pattern between ADA and ETN responders, suggesting the role of epigenetics in defining response to ADA and to ETN in PBMCs.
Figure 3.
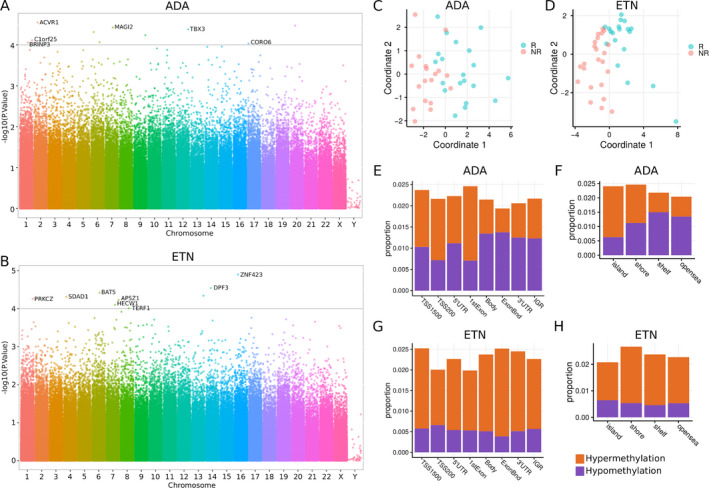
Differentially methylated positions (DMPs) associated with response to ADA and ETN in PBMCs. A and B, Manhattan plots showing the −log10‐transformed P values for CpG sites in the DNA methylation profiling for response to ADA (A) and ETN (B). Gene names are shown for genes in which any CpG site reached a significance level of P < 10−4. The corresponding probes are shown in Supplementary Figure 2, available on the Arthritis & Rheumatology website at http://onlinelibrary.wiley.com/doi/10.1002/art.41516/abstract. C and D, Multidimensional scaling plots, based on DNA methylation data, showing clusters of patients classified as responders or nonresponders to ADA (C) and ETN (D). E and G, Distribution of gene region features where DMPs associated with response to ADA (E) and to ETN (G) were located. TSS1500 = 200–1,500 bases upstream of the transcription start site (TSS); TSS200 = 0–200 bases upstream of the TSS; 5′UTR = 5′‐untranslated region; ExonBnd = exon boundary; IGR = intergenic region. F and H, Distribution of area related to CpG island where DMPs associated with response to ADA (F) and ETN (H) were located. island = CpG island; shore = 0–2 kb from island; shelf = 2–4 kb from island; opensea = the rest of the area. See Figure 1 for other definitions. Color figure can be viewed in the online issue, which is available at http://onlinelibrary.wiley.com/doi/10.1002/art.41516/abstract.
TNF signaling signatures in CD4+ T cells from responders to ADA
Since we found different gene signatures defining response to ADA or ETN, we hypothesized that different cell types may contribute to the response to ADA or ETN. Therefore, we performed RNA sequencing on 2 major innate and adaptive immune cell types, monocytes and CD4+ T cells, that are known to be involved in RA pathogenesis. Monocytes and CD4+ T cells were isolated from PBMCs from the same patients. Differential gene expression analyses identified 444 and 635 DEGs (nominal P < 0.05) between responders and nonresponders to ADA in monocytes and CD4+ T cells, respectively (Figures 4A and B and Supplementary Figures 3A and B, available on the Arthritis & Rheumatology website at http://onlinelibrary.wiley.com/doi/10.1002/art.41516/abstract). Notably, the expression of genes associated with RA and the TNF signaling pathway, such as CTLA4, TNFSF13B, TNFRSF1B, TNFSF4, IRF1, and IL18R1, was higher in CD4+ T cells from ADA responders than those from ADA nonresponders (Figures 4C and D). These genes were not differentially expressed between monocytes from responders and those from nonresponders to ADA (data not shown), suggesting that CD4+ T cells showed clearer molecular “TNF signaling” signatures associated with response to ADA compared to monocytes.
Figure 4.
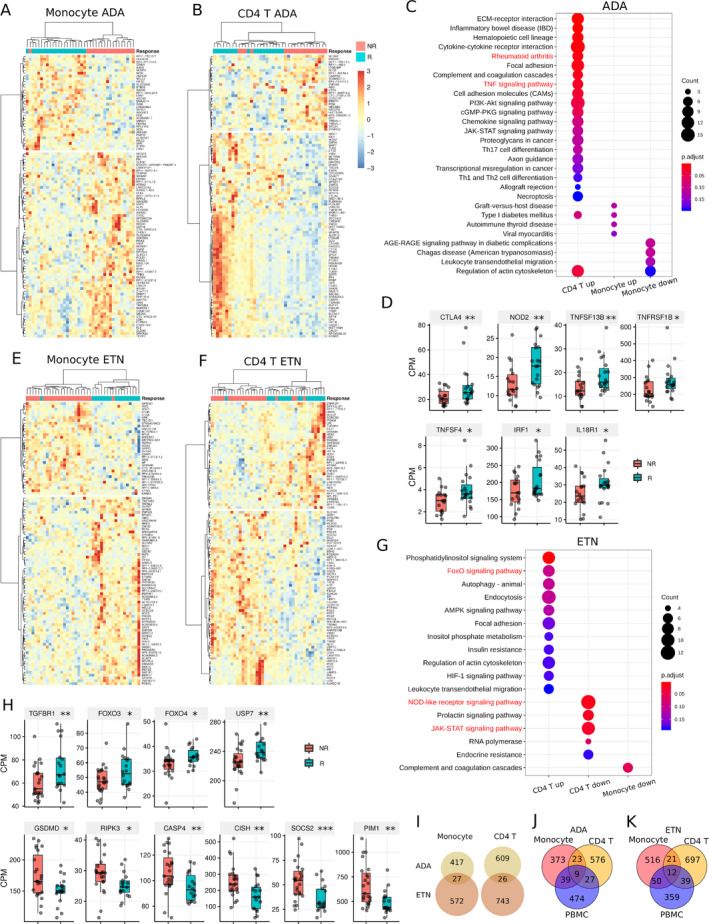
Differences between gene expression in monocytes and CD4+ T cells from responders (R) versus nonresponders (NR) to ADA and ETN. A and B, Heatmaps showing the top 100 differentially expressed genes (DEGs) in monocytes (A) and CD4+ T cells (B) from responders versus nonresponders to ADA. C, KEGG pathways enriched by the DEGs associated with ADA response in monocytes and CD4+ T cells. D, Expression of ADA response–associated DEGs involved in RA and the tumor necrosis factor (TNF) signaling pathway in CD4+ T cells. E and F, Heatmaps showing the top 100 DEGs associated with ETN response in monocytes (E) and CD4+ T cells (F). G, KEGG pathways enriched by the DEGs associated with ETN response in monocytes and CD4+ T cells. H, Expression of ETN response–associated DEGs involved in FoxO signaling, NOD‐like receptor signaling, and JAK/STAT signaling pathways in CD4+ T cells. I, Venn diagrams showing the overlap between ADA response–associated DEGs and ETN response–associated DEGs in monocytes and CD4+ T cells. J and K, Venn diagrams showing the overlap between ADA response–associated DEGs (J) and ETN response–associated DEGs (K) in monocytes, CD4+ T cells, and PBMCs. In D and H, data are shown as box plots in the style of Tukey. Each box represents the 25th to 75th percentiles. Lines inside the boxes represent the median. Whiskers outside the boxes represent the lowest and highest data points excluding the outliers. The outliers are determined by 1.5‐interquartile range criteria. Circles represent individual patients. * = P < 0.05; ** = P < 0.01; *** = P < 0.001. CPM = count per million (see Figure 1 for other definitions). Color figure can be viewed in the online issue, which is available at http://onlinelibrary.wiley.com/doi/10.1002/art.41516/abstract.
Similarly, 599 and 769 DEGs were associated with response to ETN in monocytes and CD4+ T cells, respectively (Figures 4E and F and Supplementary Figures 3C and D). In CD4+ T cells from responders to ETN, genes in the FoxO signaling pathway, such as FOXO3, FOXO4, TGFBR1, and USP7, were up‐regulated, while genes in the NOD‐like receptor signaling pathway, such as GSDMD, RIPK3, and CASP4, and the JAK/STAT signaling pathway, such as CISH, SOCS2, and PIM1, were down‐regulated (Figures 4G and H). Notably, very few pathways were differential in the monocytes from both the ADA and ETN cohorts (Figures 4C and G).
Consistent with the finding in PBMCs, the expression of TNF in both CD4+ T cells and monocytes was not associated with the response to either ADA or ETN (data not shown), and the DEGs associated with response to ADA and ETN showed little overlap in both monocytes and CD4+ T cells (Figure 4I). Comparing the DEGs identified from different cells, we found that each exhibited unique gene signatures (Figures 4J and K), suggesting a necessity to study different cell populations to identify which cells were involved in differentiating the response to anti‐TNF therapy (Figures 4J and K).
Accurate prediction of clinical response by machine learning models
In addition to understanding the mechanisms of how RA patients respond differently to ETN or ADA therapy, the ultimate goal of this study was to predict which therapy is effective for which patients before commencing therapy. To this aim, we built machine learning models based on random forest algorithms, exploiting the transcriptome signatures from monocytes, CD4+ T cells, and PBMCs, and methylation signatures from PBMCs (see Supplementary Methods, available on the Arthritis & Rheumatology website at http://onlinelibrary.wiley.com/doi/10.1002/art.41516/abstract). The model based on DEGs of PBMCs (“PBMC RNA” ADA model) showed the highest overall accuracy of predicting response to ADA among other models (ADA models). More specifically, these ADA models reached overall accuracy of 80.3%, 72.7%, 85.9%, and 84.7% using DEGs on monocytes, CD4+ T cells, PBMCs, and DMPs of PBMCs, respectively. The true‐positive rates of these models ranged from 76.0% to 90.0%, and the true‐negative rates ranged from 70.0% to 89.0% (Figure 5A).
Figure 5.
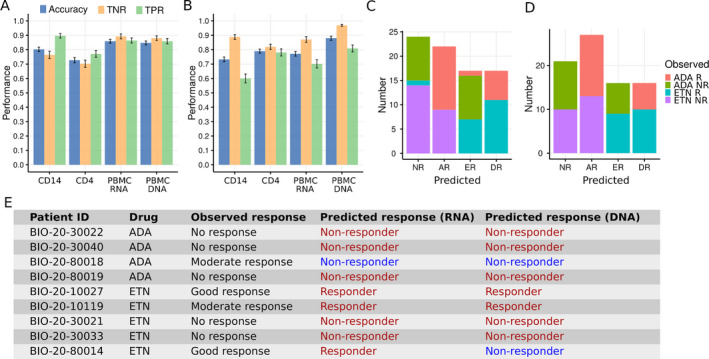
Machine learning models of the prediction of RA patients’ response to ADA and ETN therapy. A and B, Accuracy, true‐negative rate (TNR), and true‐positive rate (TPR) of machine learning models based on gene expression signatures (CD14, CD4, and PBMC RNA) and DNA methylation signatures (PBMC DNA) for the prediction of 6‐month response to ADA (A) and ETN (B). Bars show the mean ± SEM from cross‐validation analysis. C and D, Machine learning prediction of 6‐month response to ADA and ETN treatment using the best model based on gene expression data (C) and DNA methylation data (D). R = responder; NR = nonresponder; AR = responder to ADA only; ER = responder to ETN only; DR = double responder (response to both ADA and ETN). E, Validation of machine learning prediction by 6‐month‐follow‐up drug‐switched study (see Figure 1). The last 2 columns are predictions made by the best machine learning models based on gene expression data and DNA methylation data, respectively. Correct predictions are shown in red. See Figure 1 for other definitions. Color figure can be viewed in the online issue, which is available at http://onlinelibrary.wiley.com/doi/10.1002/art.41516/abstract.
The overall accuracy of the models for ETN therapy (ETN models) ranged from 73.3% to 79.0% using DEGs of different cell subsets and reached as high as 88% using DMPs of PBMCs (Figure 5B). For the ETN models using DEGs, the model based on gene expression of CD4+ T cells (“CD4 RNA” ETN model) showed the highest overall accuracy (79.0%) and nearly equal true‐positive (78.1%) and true‐negative (82.0%) rates. These results suggest that we can accurately predict the clinical response before ADA and ETN treatment using molecular signatures–based machine learning models, although the prediction accuracy of these molecular signatures differs between cell types and treatments, underlining the need to study more than one drug, cell type, or epigenetic layer.
Further, we predicted the response to ADA and ETN for all patients included in this study using the best models using gene expression data (“PBMC RNA” ADA model and “CD4 RNA” ETN model) and DNA methylation data (“PBMC DNA” ADA and ETN models) (Figures 5C and D). Interestingly, both the RNA models and the DNA models predict that ~30% of patients will not respond to either ADA or ETN, which is consistent with the clinical observation that 30% of patients do not respond well to their first anti‐TNF therapy (4). In addition, ~50% of patients respond well to either ADA or ETN. To test whether these predictions were reliable, we followed up the patients who failed to respond to the first round of ADA or ETN treatment and were switched to the other treatment (either ETN or ADA) for 6 months (Figure 1A). Finally, data for 9 patients (including 4 patients receiving ADA therapy and 5 patients receiving ETN therapy) were used to validate the reliability of the prediction. We found remarkably high prediction accuracy of our models, with response to switched treatment correctly predicted in 88.9% (n = 8) and 77.8% (n = 7) of the patients by the RNA models and DNA models, respectively (Figure 5E).
DISCUSSION
To date, methotrexate is still generally accepted as the mainstay of treatment for RA. When methotrexate fails, however, treatment schemes are basically followed on a trial‐and‐error basis. Hence, it may take a considerable amount of time before RA patients receive the therapeutic regimen that fits them best. Similarly, the different TNFi agents do not have the same beneficial clinical effect in all patients. This observed effect underlies the reason that a second or even a third TNFi can induce clinically meaningful effects upon failure of the first. As a result, being able to predict which TNFi would be effective and should be the first choice of treatment would be highly beneficial in reducing the time to effective treatment, which has been extensively proven to be a paramount factor in achieving long‐standing disease remission. Hence, by using a deep molecular approach followed by machine‐learning algorithms, we aimed to predict the response to TNFi, and to provide support for decision‐making regarding choice of TNFi, by comparing ADA and ETN.
In general, the overlap of DEGs identified in previous studies of TNFi is relatively low (17). This discrepancy might be due to multiple factors, including small sample sizes, different response classification criteria, different durations of treatment, low detection power of microarrays, and existence of biologically divergent signatures between different anti‐TNF therapies or between different cell populations. For example, the expression of CD11c (ITGAX) in monocytes was previously associated with response to ADA in RA patients (22), but was recently shown to have no association with response to ADA or ETN when tested in whole blood samples in a large patient cohort (23). Therefore, in our study we deliberately included patients with the same clinical characteristics in both cohorts and performed transcriptomic and epigenetic profiling of multiple cell populations using recently developed techniques, i.e., RNA sequencing and a MethylationEPIC BeadChip kit.
We found divergent gene signatures associated with response to ADA and ETN, and this divergence of gene signatures was reproduced in multiple cell populations, suggesting a potentially different action of mechanism between these 2 anti‐TNF agents. As a result, we found that the majority of the patients did not respond to both ADA and ETN but had the potential to respond to one of the drugs. Since ADA is an anti‐TNF monoclonal antibody, while ETN is a TNF receptor–Fc fusion protein, the genetic and epigenetic differences between individual patients thus determine the drug response. Given such different molecular signatures, ADA and ETN should be studied and considered differently in the future although both are TNFi.
DNA methylation has been shown to play an important role in the progression of RA (24, 25, 26). To our knowledge, only one previous study investigated DNA methylation on whole blood for response to ETN using a HumanMethylation450 BeadChip kit, which examines ~450,000 CpG sites in the human genome (19). In that study, Plant et al identified 5 DMPs (cg04857395, cg26401028, cg16426293, cg03277049, and cg12226028) associated with response to ETN in whole blood (19). In the present study, we used the more recently developed MethylationEPIC BeadChip, which examines >850,000 CpG sites, and did not find any of the sites reported by Plant et al to be differentially expressed in PBMCs from patients in the ADA treatment cohort (P values ranged from 0.1 to 0.8) and ETN cohort (P values ranged from 0.5 to 0.9). There are several potential reasons for this. First, different cells were studied in both studies. In other words, Plant et al interrogated DNA methylation in whole blood cells, while we studied the PBMCs. Second, the criteria used to determine whether a patient had a good response or no response differed between the studies. Plant et al defined a good response as a DAS28 of <2.6 and a nonresponse as an improvement in the DAS28 of <0.6 or as an end point DAS28 of >5.1 after 3 months of ETN treatment (19). In contrast, in our study, the EULAR criteria (21) were applied after 6 months of ADA or ETN treatment, as described in Patients and Methods. More importantly, only the patients with an extreme response phenotype, either good response or nonresponse, were included in the study by Plant et al (19). Therefore, it is essential to use a set of reliable and consistent criteria when identifying and comparing the molecular signatures associated with response to anti‐TNF therapies in different studies.
To the best of our knowledge, this is the first study in which paired multicellular and multiomics data have been used to investigate molecular determinants of response to TNFi. However, there are some limitations, which we discuss below. The majority of the DEGs and DMPs identified in this study were not significant after correcting for multiple hypothesis testing, likely due to patient heterogeneity. Thus, we combined the gene expression/methylation signatures identified using nominal P values to build machine learning models to improve the prediction of response. We achieved high accuracy using the RNA models and/or DNA model to predict response to ADA and ETN. These models were further validated by a follow‐up study, which shows a reliable application prospect to guide clinical decision‐making. However, one may argue that the responsiveness of these patients may be affected by the previous TNFi treatment.
It is still unknown how the responsiveness to a TNFi is affected by prior treatment with another TNFi, and our current data cannot completely address this question. In clinical practice, patients who failed to respond to a TNFi would not be recommended to receive the same treatment, at least in the near future, suggesting that the responsiveness to a particular TNFi is relatively stable. However, patients who fail to respond to one TNFi are frequently treated with another TNFi, based on an assumption that the response to a TNFi is not affected by prior treatment regimens. Our results support this assumption, as we found that response to a second TNFi treatment could be predicted to a certain extent based on baseline gene signatures measured prior to failure to respond to the first treatment. However, further studies are needed to assess the stability of response, to explore the reasons why some TNFi work in some patients and not in others, and to ultimately apply such predictions in clinical practice.
To further determine whether the signatures we identified were robust or dependent upon a subset of patient samples, we performed additional tests as described below. We performed jackknife resampling iterations, where 20% of the samples in each group were removed in each iteration, and then we repeated the entire analysis using the randomly retained 80% of the remaining samples (see Supplementary Methods, available on the Arthritis & Rheumatology website at http://onlinelibrary.wiley.com/doi/10.1002/art.41516/abstract). We performed 1,000 such iterations and found that most DEGs and DMPs identified in the original analysis were re‐identified in >50% of the jackknife resampling iterations (Supplementary Figure 4, available on the Arthritis & Rheumatology website at http://onlinelibrary.wiley.com/doi/10.1002/art.41516/abstract). As an additional control, we shuffled the sample identity (i.e., whether the patient was a responder or nonresponder) to mix samples between groups. Such mislabeling of the samples between groups should not provide us with genes/methylation sites that are consistently differential between different iterations. Indeed, we found that most of the DEGs and DMPs were not consistently re‐identified (most DEGs and DMPs were consistent in <25% of such iterations) (Supplementary Figure 4).
Using the DEGs and DMPs consistently identified in >50% of jackknife resampling iterations, we found clear patient clusters, methylation patterns, and response prediction ability similar to those shown in Figures 2, 3, 4, 5 (Supplementary Figure 5, available on the Arthritis & Rheumatology website at http://onlinelibrary.wiley.com/doi/10.1002/art.41516/abstract). Based on models built upon the features identified after jackknife down sampling or random sample shuffling (Supplementary Figure 6, available on the Arthritis & Rheumatology website at http://onlinelibrary.wiley.com/doi/10.1002/art.41516/abstract), we found that models created after jackknife down sampling were much better than those based on genes obtained by random sample shuffling. The jackknife down sampling models were comparable to the models shown in Figure 5, suggesting that the selected features in our final models are informative. Thus, the molecular signatures identified were robust and were clearly dependent on the response status of the patients.
Examination of overlapping between DEGs and corresponding genes illustrated that in both the ADA treatment cohort and the ETN treatment cohort, >100 genes were differentially expressed, with ≥1 CpG site differentially methylated (Supplementary Table 2, available on the Arthritis & Rheumatology website at http://onlinelibrary.wiley.com/doi/10.1002/art.41516/abstract). Interestingly, compared to DMPs with smaller variability in methylation levels (static DMPs), DMPs with larger variability in methylation levels (dynamic DMPs) were more correlated with the expression of corresponding genes (Supplementary Figure 6, available on the Arthritis & Rheumatology website at http://onlinelibrary.wiley.com/doi/10.1002/art.41516/abstract). So, the gene expression is weakly regulated by DNA methylation, especially when the CpG sites are less dynamic.
This study also had some limitations. As a subset of BioCURA, the patients included in this study did not all complete 6 months of treatment. More specifically, 4 patients discontinued treatment prior to month 3, and 18 patients discontinued treatment between month 3 and month 6. All of these patients were determined to be nonresponders based on the EULAR criteria using DAS28 at baseline and DAS28 at the last visit prior to month 6. Some patients may have shown response after a longer period of treatment, but in this study they were classified as nonresponders due to the study design and follow‐up criteria. The second limitation is that since this is an observational cohort, the ratios of responders to nonresponders does not represent the actual response ratio observed in patients. We selected for a comparable number of responders and nonresponders to allow enough samples in each group. Future studies should be conducted on larger cohorts of patients representing actual response ratios, but ensuring a sufficient number of patients in each group.
In conclusion, we systemically studied, for the first time, transcription and/or DNA methylome signatures associated with response to different TNFi in PBMCs, monocytes, and CD4+ T cells from patients with RA. We found that transcription signatures in ADA and ETN responders are divergent in PBMCs, and this phenomenon was reproduced in monocytes and CD4+ T cells. Besides, DMPs of responders to ETN but not to ADA were strongly hypermethylated. Finally, machine learning models based on these molecular signatures could accurately predict response before ADA and ETN treatment, paving the path toward personalized treatment strategies with TNFi.
AUTHOR CONTRIBUTIONS
All authors were involved in drafting the article or revising it critically for important intellectual content, and all authors approved the final version to be published. Dr. Pandit had full access to all of the data in the study and takes responsibility for the integrity of the data and the accuracy of the data analysis.
Study conception and design
Tao, Lafeber, Radstake, Pandit.
Acquisition of data
Concepcion, Vianen, Marijnissen, Radstake, Pandit.
Analysis and interpretation of data
Tao, Pandit.
ROLE OF THE STUDY SPONSOR
AbbVie had no role in the study design or in the collection, analysis, or interpretation of the data, the writing of the manuscript, or the decision to submit the manuscript for publication. Publication of this article was not contingent upon approval by AbbVie.
Supporting information
Supplementary Material
ACKNOWLEDGMENTS
We thank Chiara Angiolilli for valuable suggestions and comments on the manuscript. We thank Katja Coeleveld, Kim van der Wurff‐Jacobs, and Dorien van de Berg for bio‐banking, Karin A. L. Schrijvers‐te‐Brake, Annemiek Sloeserwij, and Joke Nijdeken for facilitating the acquisition of data, and the Society for Rheumatology Research Utrecht (SRU) for including patients. We are grateful to all of the patients who participated in this study.
Supported by AbbVie. Mr. Tao’s work was supported by a China Scholarship Council Fellowship (201606300050). Dr. Pandit’s work was supported by the Netherlands Organization for Scientific Research (grant 016.Veni.178.027).
Drs. Radstake and Pandit contributed equally to this work.
No potential conflicts of interest relevant to this article were reported.
Contributor Information
Timothy R. D. J. Radstake, Email: T.R.D.J.Radstake@umcutrecht.nl.
Aridaman Pandit, Email: A.Pandit@umcutrecht.nl.
References
- 1. Katchamart W, Johnson S, Lin HJ, Phumethum V, Salliot C, Bombardier C. Predictors for remission in rheumatoid arthritis patients: a systematic review. Arthritis Care Res (Hoboken) 2010;62:1128–43. [DOI] [PubMed] [Google Scholar]
- 2. Van der Helm‐van Mil AH, Huizinga TW, de Vries RR, Toes RE. Emerging patterns of risk factor make‐up enable subclassification of rheumatoid arthritis. Arthritis Rheum 2007;56:1728–35. [DOI] [PubMed] [Google Scholar]
- 3. Chen YF, Jobanputra P, Barton P, Jowett S, Bryan S, Clark W, et al. A systematic review of the effectiveness of adalimumab, etanercept and infliximab for the treatment of rheumatoid arthritis in adults and an economic evaluation of their cost‐effectiveness. Health Technol Asses 2006;10:3310. [DOI] [PubMed] [Google Scholar]
- 4. Callaghan CA, Boyter AC, Mullen AB, McRorie ER. Biological therapy for rheumatoid arthritis: is personalised medicine possible? Eur J Hosp Pharm 2014;21:229–37. [Google Scholar]
- 5. Weinblatt ME, Keystone EC, Furst DE, Moreland LW, Weisman MH, Birbara CA, et al. Adalimumab, a fully human anti–tumor necrosis factor α monoclonal antibody, for the treatment of rheumatoid arthritis in patients taking concomitant methotrexate: the ARMADA trial. Arthritis Rheum 2003;48:35–45. [DOI] [PubMed] [Google Scholar]
- 6. Listing J, Strangfeld A, Kary S, Rau R, von Hinueber U, Stoyanova‐Scholz M, et al. Infections in patients with rheumatoid arthritis treated with biologic agents. Arthritis Rheum 2005;52:3403–12. [DOI] [PubMed] [Google Scholar]
- 7. Vastesaeger N, Kutzbach AG, Amital H, Pavelka K, Lazaro MA, Moots RJ, et al. Prediction of remission and low disease activity in disease‐modifying antirheumatic drug‐refractory patients with rheumatoid arthritis treated with golimumab. Rheumatology (Oxford) 2016;55:1466–76. [DOI] [PMC free article] [PubMed] [Google Scholar]
- 8. Ganhão S, Bernardes M, Lucas R, Fonseca JE, Rosa‐Gonçalves D, Madeira N, et al. Remission and low disease activity matrix tools: results in real‐world rheumatoid arthritis patients under anti‐TNFα therapy. Acta Reumatol Port 2019; Special Issue:107–9. [PubMed] [Google Scholar]
- 9. Klareskog L, Catrina AI, Paget S. Rheumatoid arthritis. Lancet 2009;373:659–72. [DOI] [PubMed] [Google Scholar]
- 10. Kraan TC, Wijbrandts CA, van Baarsen LG, Rustenburg F, Baggen JM, Verweij CL, et al. Responsiveness to anti–tumour necrosis factor α therapy is related to pretreatment tissue inflammation levels in rheumatoid arthritis patients. Ann Rheum Dis 2008;67:563–6. [DOI] [PubMed] [Google Scholar]
- 11. Van der Pouw Kraan TC, van Gaalen F, Huizinga TW, Pieterman E, Breedveld FC, Verweij CL. Discovery of distinctive gene expression profiles in rheumatoid synovium using cDNA microarray technology: evidence for the existence of multiple pathways of tissue destruction and repair. Genes Immun 2003;4:187–96. [DOI] [PubMed] [Google Scholar]
- 12. Lindberg J, Wijbrandts CA, van Baarsen LG, Nader G, Klareskog L, Catrina A, et al. The gene expression profile in the synovium as a predictor of the clinical response to infliximab treatment in rheumatoid arthritis. PLoS One 2010;5:e11310. [DOI] [PMC free article] [PubMed] [Google Scholar]
- 13. Lindberg J, af Klint E, Catrina AI, Nilsson P, Klareskog L, Ulfgren AK, et al. Effect of infliximab on mRNA expression profiles in synovial tissue of rheumatoid arthritis patients. Arthritis Res Ther 2006;8:R179. [DOI] [PMC free article] [PubMed] [Google Scholar]
- 14. Badot V, Galant C, Toukap AN, Theate I, Maudoux AL, van den Eynde BJ, et al. Gene expression profiling in the synovium identifies a predictive signature of absence of response to adalimumab therapy in rheumatoid arthritis. Arthritis Res Ther 2009;11:R57. [DOI] [PMC free article] [PubMed] [Google Scholar]
- 15. Dennis G, Holweg CT, Kummerfeld SK, Choy DF, Setiadi AF, Hackney JA, et al. Synovial phenotypes in rheumatoid arthritis correlate with response to biologic therapeutics. Arthritis Res Ther 2014;16:R90. [DOI] [PMC free article] [PubMed] [Google Scholar]
- 16. Aterido A, Canete JD, Tornere J, Blanco F, Fernandez‐Gutierrez B, Perez C, et al. A combined transcriptomic and genomic analysis identifies a gene signature associated with the response to anti‐TNF therapy in rheumatoid arthritis. Front Immunol 2019;10:1459. [DOI] [PMC free article] [PubMed] [Google Scholar]
- 17. Toonen EJ, Gilissen C, Franke B, Kievit W, Eijsbouts AM, den Broeder AA, et al. Validation study of existing gene expression signatures for anti‐TNF treatment in patients with rheumatoid arthritis. PLoS One 2012;7:e33199. [DOI] [PMC free article] [PubMed] [Google Scholar]
- 18. Cuppen BV, Rossato M, Fritsch‐Stork RD, Concepcion AN, Linn‐Rasker SP, Bijlsma JW, et al. RNA sequencing to predict response to TNF‐inhibitors reveals possible mechanism for nonresponse in smokers. Expert Rev Clin Immu 2018;14:623–33. [DOI] [PubMed] [Google Scholar]
- 19. Plant D, Webster A, Nair N, Oliver J, Smith S, Eyre S, et al. Differential methylation as a biomarker of response to etanercept in patients with rheumatoid arthritis. Arthritis Rheumatol 2016;68:1353–60. [DOI] [PMC free article] [PubMed] [Google Scholar]
- 20. Kekow J, Mueller‐Ladner U, Schulze‐Koops H. Rituximab is more effective than second anti‐TNF therapy in rheumatoid arthritis patients and previous TNFα blocker failure. Biologics 2012;6:191–9. [DOI] [PMC free article] [PubMed] [Google Scholar]
- 21. Fransen J, van Riel PL. The Disease Activity Score and the EULAR response criteria. Clin Exp Rheumatol 2005;23:S93–9. [PubMed] [Google Scholar]
- 22. Stuhlmuller B, Haupl T, Hernandez MM, Grutzkau A, Kuban RJ, Tandon N, et al. CD11c as a transcriptional biomarker to predict response to anti‐TNF monotherapy with adalimumab in patients with rheumatoid arthritis. Clin Pharmacol Ther 2010;87:311–21. [DOI] [PubMed] [Google Scholar]
- 23. Smith SL, Eyre S, Yarwood A, Hyrich K, Morgan AW, Wilson AG, et al. Investigating CD11c expression as a potential genomic biomarker of response to TNF inhibitor biologics in whole blood rheumatoid arthritis samples. Arthritis Res Ther 2015;17:359. [DOI] [PMC free article] [PubMed] [Google Scholar]
- 24. Araki Y, Mimura T. The mechanisms underlying chronic inflammation in rheumatoid arthritis from the perspective of the epigenetic landscape [review]. J Immunol Res 2016;2016:6290682. [DOI] [PMC free article] [PubMed] [Google Scholar]
- 25. Ai RZ, Laragione T, Hammaker D, Boyle DL, Wildberg A, Maeshima K, et al. Comprehensive epigenetic landscape of rheumatoid arthritis fibroblast‐like synoviocytes. Nat Commun 2018;9:1921. [DOI] [PMC free article] [PubMed] [Google Scholar]
- 26. Nair N, Wilson AG, Barton A. DNA methylation as a marker of response in rheumatoid arthritis [review]. Pharmacogenomics 2017;18:1322–32. [DOI] [PubMed] [Google Scholar]
Associated Data
This section collects any data citations, data availability statements, or supplementary materials included in this article.
Supplementary Materials
Supplementary Material