

Abstract
Background
Childhood hypertension is a growing public health problem. Simultaneously, hypovitaminosis D is widespread in this population and could be associated with hypertension. This study systematically reviewed the literature on the relationship between vitamin D status and blood pressure (BP) in children and adolescents.
Methods
Following the PRISMA guidelines, PUBMED, MEDLINE, CINAHL, EMBASE, Cochrane Library, and ClinicalTrials.gov and the gray literature without language or time restrictions were searched. We included observational studies, assessed their risk of bias, and extracted data on population characteristics, vitamin D status and BP measurements, and the association between the two variables. A narrative analysis of the studies was performed.
Results
In total, 85 studies were included. Prospective cohort studies showed no association between vitamin D and BP, and generally, they were flawed. Also, the majority of non-prospective cohort studies (cross-sectional, retrospective, case-control) did not report an association between vitamin D and BP. They were mostly flawed regarding BP measurement and adjusting to potential confounders.
Conclusion
The results on the relationship between vitamin D status and BP in children and adolescents varied between the studies, and mainly pointed towards lack of association.
Supplementary Information
The online version contains supplementary material available at 10.1186/s13643-021-01584-x.
Keywords: Vitamin D, Blood pressure, Children, Adolescents, Systematic review
Background
Childhood hypertension is a serious public health burden, of considerable consequences [1]. In 2018, the global prevalence of childhood hypertension was estimated to be 4%, representing a substantial rise during the past two decades [2]. Between 2000 and 2015, the prevalence of hypertension showed a substantial increase among children aged 6 to 19 years [2]. This trend of increasing prevalence is expected to persist in the future, putting children at danger and further burdening health care systems [2]. Primary hypertension in childhood is commonly associated with cardiovascular risk factors, obesity, left ventricular hypertrophy, retinal vascular, and cognitive changes [3] and is associated with essential hypertension in adulthood [4, 5]. The increasing prevalence of hypertension is multifaceted, and its main driver is a higher body mass index (BMI) [2].
Simultaneously, hypovitaminosis D or low serum levels of hydroxyvitamin D (25(OH)D), is widespread in children and adolescents worldwide, even in countries which have plentiful sunlight all-year round [6–8]. The most common determinants of deficiency include limited exposure to sunlight, low dietary vitamin D intake, and sequestration in fat tissue especially among obese children and adolescents [9–12].
There is a general consensus that sufficient vitamin D levels during childhood promote skeletal growth and development. Yet, attention is being increasingly given to the extraskeletal benefits attained by having adequate vitamin D status [13]. Emerging evidence suggests that low serum vitamin D level is associated with poor health outcomes in the pediatric population, specifically obesity-related chronic health conditions, most notably hypertension [14, 15]. Obese youth with lower vitamin D levels have showed increased odds for hypertension, and this association remained significant even after adjusting for either BMI or total fat mass [16]. Moreover, an inverse association between 25(OH)D and systolic blood pressure (SBP) has been noted [17]. Several biologically plausible hypotheses support the beneficial effect of adequate vitamin D status on blood pressure (BP), including the role of vitamin D in improving endothelial function, decreasing proinflammatory cytokine levels, and regulating the renin-angiotension-aldosterone system [18–23].
To date, human interventional studies have failed to produce conclusive evidence pertaining to vitamin D as a potential antihypertensive supplement. A recent systematic review conducted by Abboud [24] revealed no benefit of vitamin D supplementation on decreasing SBP or diastolic blood pressure (DBP). This could be explained by the fact that other factors, rather than simply dietary intake, determine vitamin D status and its health implications. Vitamin D status can vary quite markedly in groups of people with apparently similar input level and is affected by calcium intake, some therapeutic agents, adiposity levels, and exercise [25]. Attaining adequate vitamin D status for preventing hypertension could thus be of public health relevance. Therefore, this study aims to systematically review the literature to decipher the relationship between vitamin D status and BP in children and adolescents.
Methods
Review design
This is a systematic review conducted according to the Preferred Reporting Items for Systematic Reviews and Meta-Analyses (PRISMA) statement [26] (see Additional file 1) and following a predefined protocol that was registered with the International Prospective Register of Systematic Reviews (PROSPERO) (CRD42020167550). Ethical approval was not required for this purpose.
The databases PUBMED, MEDLINE (Ovid), CINAHL (EBSCO), EMBASE (Ovid), the Cochrane Library, and http://www.ClinicalTrials.gov, were searched as well as the references of included articles, and previous reviews of vitamin D and BP in children and adolescents identified by the search. The search included observational studies reporting on the association between vitamin D status and BP (systolic, diastolic, or mean arterial pressure (MAP)) in children and adolescents. There were no language or time restrictions to eligible reports.
Search strategy
Our search strategy included three key concepts: (1) vitamin D, (2) blood pressure, and (3) children and adolescents, and for each concept, we mapped Medical Subject Headings (MeSH) and keywords. The search included terms such as vitamin D, cholecalciferol, ergocalciferol, or calcidol, combined with BP or hypertension, and pediatric, child, adolescent, youth, or teenage. We did not apply time restrictions to the search, i.e., the databases were searched from their inception date through January 17, 2020. In addition, we conducted a search update on June 09, 2020. A medical information specialist validated the electronic search strategy (see Additional file 2). The references retrieved from scientific databases were managed using EndNote software, version X6.
Study selection
The selection included prospective cohort, cross-sectional, case-control, or retrospective studies including children and adolescents as defined by the studies (e.g., aged less than 18 years). Observational studies evaluating the relationship between vitamin D status (e.g., 25(OH)D blood level) and BP were also considered. The outcomes of interest included the difference in measured BP readings, or the odds of increased BP, or the differences in the prevalence of hypertension between participants with suboptimal vitamin D status, e.g., deficiency, and those with adequate levels of vitamin D. The outcomes of interest also included the correlation between vitamin D levels and BP levels, and the difference in vitamin D levels across groups of BP (e.g., normotensive vs. hypertensive). Mixed studies (including children, adolescents, and adults) were included if there was a subgroup analysis for children and/or adolescents only.
This review excluded studies evaluating the effect of vitamin D supplementation on BP reduction as well as studies investigating the association between hypervitaminosis D and BP. Also excluded were studies conducted on adult participants as defined by the studies (e.g., aged 18 years and above), pregnant women, neonates (aged 0 to 30 days), and infants (aged 1 month to 2 years), as classified by the World Health Organization, participants with diseases affecting vitamin D metabolism (e.g., chronic kidney disease, dialysis, liver disease, parathyroid abnormality, and vitamin D-dependent rickets types 1 and 2), participants taking medications known to interfere with vitamin D metabolism (e.g., phenytoin, phenobarbital, carbamazepine, and rifampin).
Screening of titles and/or abstracts retrieved by the search was done in duplicate on EndNote software, version X6, and eligible studies were identified. Two pairs of authors (M.A. and R.R.; N.M. and S.H.) then retrieved the full texts of these studies and assessed them for eligibility in duplicate. Disagreements were solved through discussion. A calibration exercise was conducted before study selection to ensure the validity of the process.
Data extraction
Data from eligible studies were extracted in duplicate by two pairs of authors (M.A. and R.R.; N.M. and S.H.) on Microsoft Excel 2016, following a data extraction standard form. A calibration exercise was first conducted. Disagreements were resolved through discussion The following details were retained: characteristics of the study, details of the population included, the studied exposures and outcomes, and the main findings and adjustments to the analyses, as applicable. Serum 25(OH)D measures were converted to nanomoles per liter whenever it was reported as nanograms per milliliter, by multiplying by a factor of 2.496.
Risk of bias assessment
After an initial calibration exercise, two pairs of authors (M.A. and R.R.; N.M. and S.H.) collaboratively assessed in duplicate the risk of bias of included studies, solving disagreements between them through discussion. We used a modified version of the Cochrane Risk of Bias tool [27] that is designed to assess to risk of bias of observational studies. Each potential source of bias was graded as low, high, or unclear risk. The criteria for judging a high risk of bias included failure to develop and apply appropriate eligibility criteria; flawed measurement of both exposure and outcome; failure to adequately control confounding; and incomplete follow-up (only for prospective cohort studies).
Data synthesis
Separate narrative analyses of the findings of prospective cohort and non-prospective cohort studies were performed. Furthermore, we provided separate analyses for non-prospective studies based on the level of adjustment for confounding factors. We opted for this method of analysis because failure to take into account confounding factors decreases the quality of the evidence generated by the study [27].
Results
Search results
The details of the search process are detailed in Fig. 1. A total of 85 studies [14–16, 28–108] were included in the systematic review.
Fig. 1.

PRISMA diagram of study selection
Prospective cohort studies
Characteristics of the studies
We identified three prospective cohort studies [60, 99, 102], which characteristics are detailed in Table 1. These studies were published between 2014 [102] and 2019 [99], and were conducted in Australia [60], United States of America (USA) [99], and England [102].
Table 1.
Characteristics and results of prospective cohort studies
| First author, year- country | Study population | Outcomes evaluated and evaluation method | Adjusted variables for statistical analysis | Key findings |
|---|---|---|---|---|
| Ke, 2018- Australia [60] |
249 healthy Australian children recruited at age 8, 162 followed up at age 15 Mean BMI (SD) in kg/m2 at 8 years: 16.7(2.3) Mean BMI (SD) in kg/m2 at 15 years: 22.2 (3.8) % Male at age 8: 47.4%; at age 15: 54.3% Age in years: Range: 5.9–8.5; Mean (SD) at 8 years: 7.8 (0.6); at 15 years: 14.9 (0.2) |
Serum 25(OH)D: Radioimmunoassay SBP and DBP: average of 3 readings by an automated BP monitor after a 5 min rest |
Age; Date of blood draw; Sum of skinfolds; Socioeconomic status; Body fat |
● At 8 years old: No association between 25(OH)D and log SBP (standardized β: 0.004; NS); and log DBP (standardized β: − 0.049; NS) ● At 15 years old: No association between 25(OH)D and log SBP (standardized β: − 0.06; NS); Significant inverse association between 25(OH)D and log DBP (standardized β: − 0.19; p = 0.015) ● No association between 25(OH)D at age 8 and BP at age 15 in boys [SBP (standardized β: − 0.18; p = 0.2); DBP (standardized β: -0.06; NS)] and girls [SBP (standardized β: 0.11; NS); DBP (standardized β: − 0.1; NS)] |
| Wang, 2019- Boson, USA [99] |
775 black and other children from the original Boston Birth Cohort, enrolled from 2005 to 2012 and followed prospectively up to age 18 years at a medical center Mean BMI (SD) in kg/m2: NR % Male: 49.8% Age in years: Median (IQR) for last BP measurement: 10.7 (8.7–12.3) |
Plasma 25(OH)D2 and 25(OH)D3: HPLC-tandem mass spectrometry assay SBP: validated automatic sphygmomanometer, on the right arm, in a sitting position with an appropriately sized cuff Elevated SBP: BP ≥ 75th p for age, gender, and height |
Maternal age; Race; Education; Smoking; Parity; Hypertensive disorder; Diabetes mellitus; Pre-pregnancy obesity; Preterm birth; Birthweight; Season at birth and season at measurement; Breastfeeding; Child’s age at BP measurement; Sex; Current overweight or obesity None for vitamin D across SBP groups |
● No association between low vitamin D status during early childhood and SBP at ages 3 to 5 years. Higher odds of elevated SBP at 6 to 18 years of age with low vitamin D status in early childhood, rendered not significant when adjusted for current weight status: OR for low vitamin D status during early childhood and SBP at 3–5 years [OR 0.96 (95%CI 0.62–1.49); p = 0.859] and 6–18 years [OR 1.56 (95%CI 1.00–2.44); p = 0.051] ● No difference in plasma 25(OH)D in childhood, according to Child Systolic BP p: 83.12 (28.2) nmol/L for < 75 p vs. 78.87 (24.71) nmol/L for ≥ 75 p; p = 0.050 |
| Williams, 2014- Avon, Southwest England [102] |
2470 participants of the Avon Longitudinal Study of Parents and Children at 15-year of follow-up Mean (SD) BMI: 21.5 (3.7) % Male: 49.5% Age in years: Range: 7–12; Mean: 15.4; Mean (SD) at 25(OH)D sampling: 10.0 (0.9) |
25(OH)D2 and 25(OH)D3: NR SBP and DBP: NR |
Age; Gender; Socioeconomic status; Childhood BMI; Follow-up BMI; Season-adjusted 25(OH)D3; PTH; Circulating calcium and phosphate |
NS association between vitamin D measured during childhood (at mean age 7.4, 9.8, or 11.7 years) and BP at mean age 15.5 years ● Mean difference per doubling of 25(OH)D2 SBP: Mean difference: − 0.12 (95% CI − 0.61, 0.39); p = 0.65 DBP: Mean difference: − 0.10 (95% CI − 0.59, 0.37); p = 0.68 ● Mean difference per doubling of 25(OH)D3 SBP: Mean difference: 0.47 (95% CI − 0.45, 1.35); p = 0.29 DBP: Mean difference: − 0.06 (95% CI − 0.87, 0.75); p = 0.88 ● Mean difference between 25(OH)D 50–72 nmol/L vs. 25(OH)D ≥ 72 nmol/L SBP: Mean difference: 0.58 (95% CI − 0.41, 1.57) DBP: Mean difference: 0.65 (95% CI − 0.18, 1.48) ● Mean difference between 25(OH)D < 50 nmol/L vs. 25(OH)D ≥ 72 nmol/L SBP: Mean difference: − 0.60 (95% CI − 1.69, 0.49) DBP: Mean difference: 0.17 (95% CI − 0.75, 1.08) |
BMI body mass index, SD standard deviation, 25(OH)D 25-hydroxyvitamin D, SBP systolic blood pressure, DBP diastolic blood pressure, BP blood pressure, Β beta, NS not significant, USA United States of America, NR not reported, IQR interquartile range, 25(OH)D2 25-hydroxyvitamin D2, 25(OH)D3 25-hydroxyvitamin D3, HPLC high-performance liquid chromatography, p Percentile, OR odds ratio, CI confidence interval
Results of the studies
The findings from the prospective cohort studies are also presented in Table 1. Two [60, 102] out of three studies showed no association between vitamin D and BP (SBP and DBP), whereas one [99] showed an inverse association between low vitamin D status during early childhood and SBP a decade later, which was rendered not significant after adjustment for weight status.
In details, Ke et al. [60] examined 25(OH)D concentrations in an Australian cohort of 8-year-olds (n = 249) followed up at age 15 (n = 162) and explored associations between 25(OH)D with cardiovascular disease (CVD) risk factors, including BP, in these populations. On the cross-sectional analyses of 8- and 15-year-olds, SBP and DBP were not found to be significantly associated with 25(OH)D concentrations. Of interest, prospectively there was no association between 25(OH)D at age 8 and SBP nor DBP at age 15, both in boys and in girls. Similarly, Williams et al. [102] compared prospective associations of two analogs of childhood 25(OH)D (25(OH)D2 and 25(OH)D3) at ages 7–12 years with SBP and DBP measured in adolescence. The analyses were conducted on 2470 participants of the Avon Longitudinal Study of Parents and Children (ALSPAC)—a prospective birth cohort that recruited pregnant women in the former county of Avon, South West England. The results of this study showed that there were no associations between vitamin D measured during childhood with SBP and DBP at mean age of 15.5 years. Finally, among 775 children from the Children’s Health Study (CHS)—a prospective birth cohort study recruiting children from the original Boston Birth Cohort at Boston Medical Center, Wang et al. [99] investigated whether vitamin D status in early life can affect SBP a decade later and reported not association between the two variables at ages 3 to 5 years. Further, Wang et al. [99] reported higher odds of elevated SBP at age 6 to 18 years among children with lower vitamin D during early childhood; however, this result was rendered not significant when adjusted for current weight status. Among the three studies, only Wang et al. [99] studied vitamin D levels across SBP status groups (< 75th percentile vs. ≥ 75th percentile) during childhood and reported no association between the two variables (p = 0.05).
Assessment of risk of bias
The assessment of risk of bias of prospective cohort studies is presented in Fig. 2. Developing and/or applying appropriate eligibility criteria were appropriate in the three studies. The assessment of vitamin D was adequate in Ke et al. [60] and Wang et al. [99], yet not reported in Williams et al. [102]. The assessment of BP was adequate in Ke et al. [60], yet, it was not reported in Williams et al. [102]. In Wang et al. [99], the number of BP measurements was not reported; thus, the risk of bias was unclear. The three studies extensively adjusted to potential confounders regarding the association between vitamin D and BP. Finally, there was no suspicion of differential loss to follow-up in Ke et al. [60] and Wang et al. [99]; however, in Williams et al. [102], there were numerous significant differences in the characteristics of included and excluded participants because of missing data on one or more variable, which might imply a high risk of bias.
Fig. 2.

Risk of bias of prospective cohort studies
Non- prospective cohort studies (cross-sectional, retrospective and case-control studies)
Characteristics of the studies
Table 2 details the characteristics of non-prospective cohort studies. The included studies were published between 2007 [95] and 2020 [47, 57, 82, 92, 105]. The majority of the studies were conducted in the Americas (USA, n = 23 [15, 33, 34, 36, 37, 40, 43, 65, 66, 69, 75, 79–81, 84, 86, 91, 92, 95, 100, 103, 107]; Latin America, n = 9 [53–56, 74, 83, 96–98]; Canada, n = 1 [71]), followed by Asia (n = 33) [14, 28–32, 35, 38, 39, 44, 48–50, 57–59, 61–64, 67, 68, 70, 72, 73, 76–78, 88, 90, 105, 106, 109], Europe (n = 14) [42, 45–47, 51, 82, 85, 87, 89, 93, 94, 101, 104, 108], Australia (n = 1) [16], and Africa (n = 1) [52]. The majority of the studies were cross-sectional (n = 67) [14, 15, 28, 29, 31–38, 40–48, 50–59, 61, 62, 64, 65, 68, 69, 72–78, 80, 81, 83–93, 96–98, 100, 104–109], and there were seven retrospective studies [16, 39, 49, 66, 71, 95, 103], one case-control study [70]. We also identified four articles [30, 63, 82, 94] which included a cross-sectional baseline assessment from human interventional studies, and two from prospective cohort studies [67, 101] and one article [79] included data from both prospective cohort (baseline assessment) and cross-sectional studies. The sample size ranged from 22 [35] to 9757 [65] participants; the age of participants ranged from 1 to 21 years [65]. Five studies included females only [36, 37, 58, 63, 90], while one study [53] consisted of males only. Twelve studies [15, 61, 64, 65, 68, 75, 77–79, 91, 100, 105] included nationally representative samples. Twenty studies included obese/overweight participants [16, 33, 34, 37, 38, 41, 47, 49, 62, 69, 71, 84, 88, 89, 95, 96, 98, 103, 104, 107]; one study [43] included children with multiple, modifiable atherosclerosis-promoting risk factors; one [79] was conducted on youth with type 1 diabetes. Only one study [93] recruited children and adolescents with primary hypertension, and only one [35] included healthy children with vitamin D deficiency.
Table 2.
Characteristics and results of non-prospective cohort studies
| First author, year- country | Study population | Outcomes evaluated and evaluation method | Adjusted variables for statistical analysis | Key findings |
|---|---|---|---|---|
| Cross-sectional | ||||
| Al Daghri, 2010- Riyadh, Saudi Arabia [28] |
118 children and adolescents, non-obese, without chronic disease, not taking vitamin D supplements, recruited from primary health care centers Mean BMI (SD) in kg/m2: 118 children and adolescents, non-obese, without chronic disease, not taking vitamin D supplements, recruited from primary health care centers Mean BMI (SD) in kg/m2: Boys: 19.8 (5.7); Girls: 18.9 (4.3) % Male: 44.9% Age in years: Range: 5–17; Mean(SD): Boys: 12.4 (3.7); Girls: 11.6 (3.7) |
Serum 25(OH)D: ELISA SBP and DBP: average of 2 readings (not detailed) |
None | Inverse correlation between vitamin D with SBP and DBP in the total sample and in girls, but not in boys |
| Al Daghri, 2015- Riyadh, Saudi Arabia [29] |
259 children, healthy, not taking medications or supplements known to affect body weight, recruited from primary health care centers Mean BMI(SD) in kg/m2: Boys: 23.38 (6.23); Girls: 22.95 (4.97) % Male: 39.8% Age in years: Range: NR; Mean(SD): Boys 14.9 (1.6); Girls 14.8 (1.6) |
Serum 25(OH)D: COBAS e-411 automated analyzer SBP and DBP: NR |
None |
● Inverse correlation between vitamin D with SBP in boys only ● Inverse correlation between vitamin D with DBP in the total sample |
| Al Daghri, 2015- Riyadh, Saudi Arabia [31] |
2225 adolescents, healthy, without acute or chronic medical conditions, recruited from private and public schools Mean BMI(SD) in kg/m2: Boys: 22.9 (0.17); Girls: 23 (0.16) % Male: 53.3% Age in years: Range: 13–17; Mean(SD): Boys: 15.1 (0.06); Girls: 15.1 (0.06) |
Serum 25(OH)D: COBAS e-411 automated analyzer SBP and DBP: average of 2 readings, 15 min apart, by a standardized mercury sphygmomanometer |
None | Inverse correlation between vitamin D with SBP and DBP in boys only |
| Al Daghri, 2016- Riyadh, Saudi Arabia [30] |
4183 children, without acute medical condition, with information collected from a biomarkers research program Mean BMI(SD) in kg/m2: Boys: 21.4 (5.1); Girls: 22 (4.8) % Male: 45.6% Age in years: Range: 12–18; Mean(SD): Boys: 14.3 (1.9); Girls: 14.3 (2.1) |
Serum 25(OH)D: COBAS e-411 automated analyzer SBP and DBP: NR |
None | Inverse correlation between vitamin D with SBP and DBP in boys only |
| Al Daghri, 2018- Riyadh, Saudi Arabia [32] |
740 adolescents, without serious medical conditions, not taking medications or vitamin D supplements, recruited from primary schools Mean BMI(SD) in kg/m2: 21.9 (4.8) % Male: 33.1% Age in years: Range: 10–17; Mean(SD): All: 14.2 (1.6); Boys:14.1 (1.2); Girls: 14.3 (1.8) |
Serum 25(OH)D: COBAS e-411 automated analyzer Vitamin D status groups: Deficient: 50–75 nmol/L; Insufficient: < 50 nmol/L; Sufficient: ≥ 75 nmol/L SBP and DBP: NR |
None |
● No difference in SBP across vitamin D status groups ● Lower DBP in vitamin D sufficiency |
| Al Saleh, 2013-Riyadh, Saudi Arabia [35] |
22 children with vitamin D deficiency, free of chronic diseases, not taking vitamin D supplements, recruited from primary health care centers Mean BMI(SD) in kg/m2: NR % Male: 43.4% Age in years: Range: NR; Mean(SD): NR |
Serum 1,25(OH)2D: ELISA SBP and DBP: average of 2 readings (not detailed) |
Gender and BMI | Inverse association between vitamin D with SBP only |
| Alemzadeh, 2012-Wisconsin, USA [33] |
133 Caucasian, Hispanic and African adolescents, obese (BMI > 95th p for age), medically stable, not taking medications or multivitamin supplement, recruited from an endocrine clinic Mean BMI(SD) in kg/m2: NR % Male: 41.4% Age in years: Range: 13.1–17.9; Mean(SD): 14.9 (1.4) |
Serum 25(OH)D: radioimmunoassay Vitamin D status groups: Deficient: < 50 nmol/L; Sufficient: ≥ 50 nmol/L SBP and DBP: average of 2 readings, in sitting position |
None |
● No differences in SBP and DBP across vitamin D status groups ● No correlation between vitamin D with SBP and DBP |
| Alemzadeh, 2016-Wisconsin, USA [34] |
152 Caucasian, Hispanic and African adolescents, obese (BMI > 95th p for age), without chronic medical conditions, not taking supplements, recruited from a children hospital Mean BMI(SD) in kg/m2: NR % Male: 42.8% Age in years: Range: 13.2-17.8; Mean(SD): 14.7 (1.3) |
Serum 25(OH)D: radioimmunoassay Vitamin D status groups: Deficient: < 50 nmol/L; Insufficient: 50–74.9 nmol/L; Sufficient: ≥ 75 nmol/L SBP and DBP: average of 2 readings, in sitting position |
None | No differences in SBP and DBP across vitamin D status groups |
| Ashraf, 2011- Birmingham, USA [37] |
80 Caucasian American and African American post-menarchal adolescents, obese (BMI > 95th p for age and gender), without chronic disease, not taking supplements, recruited from weight management clinics Mean BMI(SD) in kg/m2: NR % Male: 0% Age in years: Range: NR; Mean(SD): African American: 14.3 (2.3), Caucasian American: 14.8 (2.3) |
Serum 25(OH)D: liquid chromatography-tandem mass spectrometry SBP and DBP: automated BP cuff (not detailed) |
BMI; Race | No correlation between vitamin D with SBP and DBP |
| Ashraf, 2014- Alabama, USA [36] |
47 European American and African American post-menarchal adolescents, without medical conditions, not taking medications and supplements, recruited from weight management clinics Mean BMI(SD) in kg/m2: 23.3 (4.5) %Male: 0% Age in years: Range: 14-18; Mean(SD): 15.9 (1.4) |
Serum 25(OH)D: liquid chromatography mass spectrometry Free 25(OH)D and bioavailable 25(OH)D: calculated using published formulas SBP ad DBP: average of 2 readings, after a 5-min rest, using the auscultatory method, in supine position |
Age; Percent body fat; Race; Fasting insulin; Height | No correlation between vitamin D with SBP and DBP |
| Atabek, 2014- Konya, Turkey [38] |
247 children and adolescents, obese (BMI > 95 p for age and gender), without chronic disease, not taking medications, recruited from an outpatient endocrinology and diabetes pediatric clinic Mean BMI(SD) in kg/m2: NR %Male: 47.3% Age in years: Range: 8–16; Mean(SD): 11.93 (2.77) |
Serum 25(OH)D: mass spectrometry Vitamin D status groups: Deficient:< 50 nmol/L SBP and DBP: after a rest ≥ 10 min, using a standard mercury sphygmomanometer |
None |
● No differences in SBP and DBP across vitamin D status groups ● Inverse correlation between vitamin D with SBP only |
| Bacha, 2019- Texas, USA [40] |
79 Hispanic, Black and White American adolescents, not engaging in a diet or physical activity program, without medical conditions, not taking medications and supplements, recruited through advertisement in the community and at a children’s hospital Normal weight:22.8%; overweight with normal glucose tolerance:38%; overweight with prediabetes:39.2% %Male: 43% Age in years: Range: NR; Mean(SD): 15.4 (0.2) |
Total 25(OH)D: electrochemiluminescence assay SBP and DBP: average of 7 readings, taken 10 min apart, by an automated device |
None | No differences in SBP and DBP across tertiles of vitamin D |
| Banzato, 2014- Verona, Italy [41] |
32 Caucasian children, overweight and obese (definition: NR), free of chronic disease, not taking medications or supplements, recruited from a pediatric department Mean BMI(SD) in kg/m2: 30.08 (3.18) %Male: 65.6% Age in years: Range: 7–16; Mean(SD): 11.7(2.26) |
25(OH)D: chemiluminescent method SBP and DBP: average of 3 readings, on the left arm over 30 min, in sitting position, using a mercury sphygmomanometer |
None | No differences in SBP and DBP across tertiles of vitamin D |
| Cabral, 2016- Porto, Portugal [42] |
514 adolescents from the EPITeen, recruited from public and private schools BMI ≥ 95 p for age and gender: 9.3% % Male: 47.5% Age in years: Range: 13; Mean(SD): NR |
Serum 25(OH)D: chemiluminescence immunoassay SBP and DBP: average of 2 readings separated by ≥ 5 min, after a 10-min rest, by a mercury sphygmomanometer |
BMI; Gender; Parental education; Physical activity; Season |
● No differences in SBP and DBP across quartiles of vitamin D ● No difference in vitamin D level among normotensive and those with high BP |
| Cheraghi, 2012- Kansas, USA [43] |
74 white and non-white children with multiple, modifiable atherosclerosis-promoting risk factors, recruited from a preventive cardiology clinic at a children's hospital BMI > 95 p for age and gender: 85% %Male: 44.6% Age in years: Range: NR; Mean(SD): 13.7 (3.1) |
Serum 25(OH)D: NR Vitamin D status groups: Deficient: < 49.92 nmol/L; Sufficient: ≥ 49.92 nmol/L SBP: over the right arm, in sitting position, using a dinamap monitor |
None |
● No difference in SBP across vitamin D status groups ● No difference in vitamin D level among those with normal and high SBP |
| Choi, 2014- South Korea [44] |
260 adolescents, free of diabetes, recruited from a rural high school Mean BMI(SD) in kg/m2: Boys:22.2 (3.2); Girls: 21.2 (2.5) %Male: 51.9% Age in years: Range: 15–16; Mean(SD): 15.9 (0.3) |
Serum 25(OH)D: radioimmunoassay SBP and DBP: average of 2 readings, at rest, using a oscillometric device with appropriate cuff size |
None | No correlation between vitamin D with SBP and DBP |
| De Moraes, 2014- European Countries [45] |
1089 European adolescents from the HELENA study, recruited from different European countries Mean BMI(SD) in kg/m2: Boys:21.4; Girls: 21.3 %Male; 46.7% Age in years: Range: 12.5–17.5; Mean: 14.8 |
Plasma 25(OH)D: immunoassay ELISA SBP and DBP: lowest of 2 readings, taken 10 min apart, in sitting position, using an oscillometric monitor device |
Contextual variables (seasonality; latitude of residence; school); Potential individual confounders (maternal education; age at menarche (in girls); BMI; waist circumference; physical activity; serum lipid concentrations); Biomarker serum concentrates (blood composition; iron status indicators; multiple vitamins including vitamin D) |
No association between vitamin D with SBP and DBP |
| De piero Belmont, 2015-Spain [46] |
314 children, free of disease, not taking medications and supplements, recruited from public schools Mean BMI(SD) in kg/m2: 19.4 (3.2) %Male: 50.3% Age in years: Range: 8–13; Mean (SD): 10.7 (1.0) |
Plasma 25(OH)D: immunochemiluminescence SBP and DBP: average of 3 reading, taken 5 min apart using the right arm, in sitting position HTN status: Normal BP: SBP or DBP ≤ 90th p; Pre-HTN: SBP or DBP ≥ 90th p and ≤ 95 thp; High BP: SBP or DBP ≥ 95th p |
For the OR: Age; gender |
● Lower SBP and DBP with increasing tertiles of vitamin D ● Higher prevalence of HTN in the lowest tertile of vitamin D compared with the highest tertile ● Lower odds of elevated SBP or DBP with increasing tertiles of vitamin D |
| Dura-Trave, 2020- Pamplona, Spain [47] |
236 Caucasian adolescents, with severe obesity (BMI z-score > 3.0 or BMI > 99th p), without illness, not taking medication, vitamin D, or calcium supplements Mean BMI z-score(SD): deficiency: 4.3 (1.1); insufficiency: 4.4 (0.9); sufficiency: 3.8 (0.6) %Male: 62.3% Age in years: Range: 10.2–15.8; Mean: 13.4 |
Plasma 25(OH)D: high-specific chemiluminescence immunoassay Vitamin D status group: Deficient: < 50 nmol/L; hypovitaminosis D: < 75 nmol/L SBP and DBP: lowest of 3 measurements, in the right arm, in supine position, using a digital BP monitor Arterial HTN: SBP and/or DBP ≥ 95th p for age, sex, and height, according to the American reference charts (SBP > 130 or DBP > 85 mmHg) |
None |
● Higher SBP and DBP with vitamin D deficiency ● Higher prevalence of arterial HTN with hypovitaminosis D ● Inverse association between vitamin D with SBP only |
| Ganji, 2011-USA [15] |
5867 White, Black and Hispanic children and adolescents, recruited from the NHANES study (2001–2006) Mean BMI(SD) in kg/m2: 23.1 (0.1) %Male: 50.6% Age in years: Range: 12–19; Mean: 15.4 |
Serum 25(OH)D: radioimmunoassay SBP and DBP: mercury sphygmomanometer (not detailed) |
For SBP: Age; Sex; Race/ethnicity; BMI For DBP: Age; Sex |
● Lower SBP with increasing tertiles of vitamin D ● No association between vitamin D with DBP |
| Ghobadi, 2019- Shiraz, Iran [48] |
240 children, without chronic disease, not on special diets, not taking drugs affecting metabolic status, recruited from elementary schools Mean BMI(SD) in kg/m2: 16.05 (2.74) %Males: 52.9% Age in years: Range: 6–9; Mean(SD): 7.8 (1.06) |
Serum 25(OH)D: ELISA SBP and DBP: average of 2 readings, by mercury sphygmomanometer |
Age; Gender; BMI; Physical activity |
Inverse association between vitamin D with SBP and DBP |
| Ha, 2013- Suwon, South Korea [50] |
310 children, free of disease not taking medications, recruited from elementary schools. Mean BMI(SD) in kg/m2; serum 25(OH)D Q1: 19.8 (3.7); Q2: 19.4 (3.7); Q3: 19.3 (3.3); Q4: 18.3 (3) %Male: 52% Age in years: Range:10–12; Mean (SD): Q1: 12.2 (1.2); Q2:12.2 (1.3); Q3: 12.3 (1.1); Q4:12.3 (1.1) |
Serum 25(OH)D: chemiluminescence immunoassay SBP and DBP: average of 2 readings by an automated BP instrument |
Age; Gender; Tanner stage; Body fatness; physical activity |
● No differences in SBP and DBP across quartiles of vitamin D ● No association between vitamin D with SBP and DBP |
| Hannesdottir, 2017- Iceland [51] |
159 elementary school children Mean BMI(SD) in kg/m2: NR %Male: 46.5% Age in years: Range:7 |
Serum 25(OH)D: radioimmunoassay Vitamin D status groups: Deficient: < 50 nmol/L; Sufficient: > 50 nmol/L SBP and DBP: average of 3 readings in a standard way using the left arm |
None |
● No association/correlation between vitamin D with SBP and DBP ● No differences in SBP and DBP across vitamin D status groups |
| Hassan, 2015- Egypt [52] |
65 obese (BMI > 95th p for age and sex-specific growth curves) and 30 healthy (BMI between 15 and 85th p for age and sex-specific growth curves) children with no medical conditions, including type I and type II diabetes, not taking any medications that influence physical growth, recruited from primary public schools Mean BMI(SD) in kg/m2: 24.28 (5.95) %Male: 49.5% Age in years: Range: 8–11; Mean(SD): All: 9.99 (1.14); obese:10.1 (1.18) ; control: 10.27 (0.74) |
Serum 25(OH) D: NR SBP and DBP: average of 2 readings by a mercury sphygmomanometer after a rest of 20 min |
None | No association between vitamin D with SBP and DBP in the total sample, and in obese participants |
| Hirschler, 2012- Buenos Aires, Argentine [53] |
116 boys without chronic disease, and not taking medications known to affect bone metabolism, recruited from amateur rugby club Mean BMI (SD) in kg/m2: 22.0 (5.3) %Male: 100% Age in years: Mean(SD): 11.3 (2.4) |
Serum 25(OH)D: radioimmunoassay kit SBP and DBP: NR |
Tanner stage | No differences in SBP and DBP across quartiles of vitamin D |
| Hirschler, 2013- Buenos Aires, Argentine [54] |
290 Indian Koya children, free of chronic disease, recruited from schools Mean BMI in kg/m2: 16.88 (2.99) %Male: 44.5% Age in years: Range: 5–19; Mean(SD): 10.7(2.9) |
Serum 25(OH)D: radioimmunoassay kit Vitamin D status groups: Deficient: < 50 nmol/L SBP and DBP: NR |
Age (adjustment only for SBP across quartiles) |
● Higher SBP and DBP with vitamin D deficiency ● Lower SBP with increasing quartiles of vitamin D |
| Hirschler, 2019- San Antonio de los Cobres and Chicoana, Argentine [55] |
152 indigenous schoolchildren from San Antonio de los Cobres;175 from Chicoana not taking medications affecting BP, lipids, glucose level, with no significant difference in socioeconomic level, age, BMI and waist circumference, recruited from elementary schools Mean BMI(SD): San Antonio de los Cobres in kg/m2: 16.83 (2.69); Chicoana: 19.27 (4.41) %Male: 51.7% Age in years: Mean(SD) San Antonio de los Cobres: 9.37 (2.11); Chicoana: 9.02 (2.14) |
Serum 25(OH)D: radioimmunoassay SBP and DBP: average of 2 readings, at a period of 1 to 2 min, by a mercury sphygmomanometer in a sitting position with the child’s right forearm horizontal on the table and cuffs sizes adjusted for differences in arm circumference and height HTN: average of the values of SBP and /or DBP ≥ 95th p based on age , sex and height p |
Age; Gender; z-BMI; Milk intake | Inverse association between vitamin D with SBP and DBP |
| Hirschler, 2019- Argentine [56] |
152 indigenous schoolchildren from San Antonio de los Cobres;175 from Chicoana not taking medications affecting BP, lipids, glucose level, with no significant difference in socioeconomic level, age, BMI and waist circumference, recruited from elementary schools Mean BMI(SD): San Antonio de los Cobres in kg/m2: 16.83 (2.69); Chicoana: 19.27 (4.41) %Male: 51.7% Age in years: Mean(SD) San Antonio de los Cobres: 9.37 (2.11); Chicoana: 9.02 (2.14) |
Serum 25(OH)D: radioimmunoassay SBP and DBP: average of 2 readings at a period of 1 to 2 min by a mercury sphygmomanometer in a sitting position, with the child’s right forearm horizontal on the table and cuffs sizes adjusted for differences in arm circumference and height MAP: (DBP*2 + SBP) / 3 |
BMI; Age; Sex; Location; Triglycerides; Insulin; Glucose | No association between vitamin D with SBP, DBP and MAP |
| Izadi, 2020- Tehran, Iran [57] |
514 students, without disease, or regular use of medication or supplement, recruited from local schools Mean BMI(SD) in kg/m2: 17.41 (0.19) % Male: 46.69% Age in years: Range: 7–12; Mean(SD): 9.16 (1.53) |
Serum 25(OH)D: ELISA SBP and DBP: standard mercury pressure gauge with dimensions suitable for children and standard medical devices in a sitting position after a 5-min rest |
Linear regression; Age; BMI; Gender; DBP; Triglycerides; HDL and Total Cholesterol | No association between vitamin D with SBP, in adjusted model |
| Jang, 2013- South Korea [58] |
320 adolescents, not taking medications and not having high insulin levels, recruited from schools as part of the Korean Children Adolescent Study Not-overweight: 88.4%; Overweight: 11.5% % Male: 0% Age in years: Range: 12.4–14.5; Mean(SD): NR |
Serum 25(OH)D: gamma counter with a radioimmunoassay Vitamin D status: Deficient: < 50 nmol/L SBP and DBP: average of 2 readings by a mercury sphygmomanometer in a sitting position at rest High BP: ≥ 130/85 mmHg |
BMI z-score; Physical activity |
● No correlation between vitamin D with SBP and DBP ● Higher SBP with vitamin D deficiency ● No differences in prevalence of HTN and DBP across vitamin D status groups |
| Kardas, 2013- Turkey [59] |
114 children and adolescents obese (BMI ≥ 90th p for reference curves for Turkish children) and non-obese recruited from a children hospital Mean BMI(SD) in kg/m2: 24.5 (5.4); Mean BMI (obese): 28.5 (2.7); Mean BMI (non-obese); 19.6 (3.6) % Male: 50.9% Age in years: Mean(SD) obese: 13.5 (1.6); non-obese 13.4 (1.7) |
Plasma 25(OH)D: HPLC SBP and DBP: average of 2 readings by a mercury sphygmomanometer, after a 20 min rest |
None | Inverse correlation between vitamin D with SBP and DBP in the total sample; no longer significant when assessed among obese and non-obese participants |
| Kelishadi, 2014-Iran [61] |
1095 nationally representative sample of Iranian students Mean BMI(SD) in kg/m2: 19.37 (4.58) % Male: 52% Age in years: Range: 10–18; Mean(SD): 14.74 (2.61) |
Serum 25(OH)D: chemiluminescence immunoassay SBP and DBP: average of two readings by a standardized mercury sphygmomanometer in a sitting position on the right arm with an appropriate cuff size |
Age; Gender; Anthropometric measures | Inverse association between vitamin D with SBP and DBP |
| Khadgawat, 2012- New Delhi, India [62] |
62 obese Asian-Indian children and adolescents without any known systemic illness, endocrine or metabolic disorder or symptoms suggesting hypothalamic obesity, not taking any medications. Mean BMI(SD) in kg/m2: 29.3 (4.8) % Male: 56.5% Age in years: Range: 6–17; Mean(SD): 13 (3.1) |
Serum 25(OH)D: radioimmunoassay Vitamin D status groups: Deficient:< 50 nmol/L; Severe; Deficiency: < 12.5 nmol/L; Moderate Deficiency: 12.5–25 nmol/L; Mild Deficiency :25–50 nmol/L SBP and DBP: average of 3 readings in a sitting position, after a 5 min rest ,by a mercury sphygmomanometer in the right upper arm with an appropriate size cuff |
BMI; Age; Gender; Pubertal stage | No differences in SBP and DBP across vitamin D status groups |
| Kim, 2018- South Korea [64] |
2314 adolescents selected from the KNHANES (2010–2014) nationwide survey who were fasting for more than 8 h, and had complete data for 25(OH)D and metabolic syndrome components Mean BMI(SD) in kg/m2: NR % Male: 53.80% Age in years: Range: 12–18; Mean(SD): NR |
Serum 25(OH)D: NR Vitamin D status groups: Deficient: < 50 nmol/L; Sufficient: ≥ 50 nmol/L SBP and DBP: average of 3 readings on the right arm after a 5-min rest Elevated BP: SBP ≥ 130 mmHg; DBP ≥ 85 mmHg |
Age; Gender; Household income; Residential area; Self-perceived health status; Self-perceived stress status; family history of chronic disease; Sleep habits, and physical activity habits | Similar odds of elevated BP across vitamin D status groups, in adjusted model |
| Kumar, 2009-USA [65] |
9757 non-Hispanic white, non-Hispanic black, Hispanics/Mexicans and other race; children and adolescents from the NHANES study (2001–2004) Mean BMI(SD) in kg/m2: NR % Male: NR Age in years: Range: 1–21; Mean(SD): NR |
25(OH)D: diasorin assay Vitamin D status groups: Deficient:< 37.5 nmol/L; Insufficient: 37.5–72.5 nmol/L SBP and DBP: average of 3 readings HTN: SBP or DBP >95th p for the median height of each participant's age and gender or > 140/90 mmHg in those ≥ 17 years of age |
Age; Gender; Race/ethnicity; Poverty income ratio; Obesity; Milk intake; Television and computer use; vitamin D supplement use |
● Higher odds of HTN with vitamin D deficiency ● Higher SBP and DBP with poorer vitamin D status |
| Lee, 2014-Seoul, South Korea [14] |
1660 children from the KMOSES, no history of cardiovascular disease, diabetes, HTN or endocrine disorders, non-smoking, no alcohol consumption Mean BMI(SD) in kg/m2: Boys: 8.6 (3.4) Girls: 17.4 (3.0) % Male: 54.5% Age in years: Range: 9; Mean(SD): NR |
Serum 25(OH)D: chemiluminescent immunoassay SBP and DBP: standard brachial cuff technique. HTN: > 90th p for sex, height and age |
BMI |
● No differences in prevalence of high BP, SBP and DBP across quartiles of vitamin D ● No difference in vitamin D level among normotensive and those with high BP |
| Lee, 2015- Seoul, South Korea [68] |
2880 children and adolescents from the KNHANES (2008–2010) nationwide survey having data on 25(OH) D levels and blood sample for metabolic syndrome components Mean BMI(SD) in kg/m2: 20.46 (3.57) %Male: 53.4% Age in years: Range:10–18; Mean(SD): 13.74 (2.49) |
25(OH)D: 125I-labelled radioimmunoassay kits SBP and DBP: average of 2 readings in the right arm, within 5 min interval, by a standard mercury sphygmomanometer at rest. |
Age; Gender | Lower SBP and DBP with increasing quartiles of vitamin D |
| Lee, 2016- USA [69] |
209 non-Hispanic white, non-Hispanic black, other race, overweight or obese patients recruited to participate in the OSCIR if having insulin resistance, depressed fasting glucose to fasting insulin ratio or referral from primary health clinics and free of chronic or acute infectious diseases, not taking glucose or lipid lowering medications. Mean BMI(SD): 35.9 (8.4) %Male: 45% Age in years: Range: 6–18; Mean(SD): 12.6 (2.9) |
Plasma total 25(OH)D: in duplicates by Immunodiagnostic Systems enzyme immunoassay SBP and DBP: standard sphygmomanometer in a sitting position with an appropriate size cuff |
None | No association between vitamin D with SBP and DBP |
| Malyavskaya, 2017- Russia [108] |
319 children and adolescents, without acute and/or chronic diseases, recruited from secondary educational institutions Mean BMI(SD) in kg/m2: Q1: 22.6 (4.2); Q2: 20.8 (4.7); Q3: 20.2 (4.4); Q4: 19.6 (3.4) %Male: 51% Age in years: Range:10–15; Mean(SD): 13.3 (1.6) |
Serum 25 (OH)D: ELISA SBP and DBP: NR |
None |
● No differences in SBP and DBP across quartiles of vitamin D, except for a higher DBP for Q 1 vs. 4 ● Inverse correlation between vitamin D with DBP only |
| Matter, 2016-KSA [72] |
84 healthy adolescents attending an outpatient clinic, without acute or chronic disease or under treatment that could influence 25(OH)D level, and with 25(OH)D levels of < 50 or > 75 nmol/L Mean BMI(SD): NR % Male deficient group: 60%; control group:72% Age in years: Range: 12–16; Mean(SD) deficient group: 14.08 (2.01); control group: 13.93 (1.06) |
Serum 25(OH)D: radioimmunoassay Vitamin D status: Deficient: < 50 nmol/L SBP and DBP: NR |
None | No differences in SBP and DBP across vitamin D status groups |
| Mellati, 2015-Iran [73] |
297 healthy schoolchildren Mean BMI(SD) in kg/m2: 17.81 (3.39) % Male: 45.10% Age in years: Range: 7–11 ; Mean(SD): 7.86 (1.32) |
Serum 25(OH)D: ELISA using immunodiagnostic system SBP and DBP: average of 3 readings in 10 min intervals after at least a 15-min rest. For those with higher BP, the measurement was repeated on another day |
None |
● Lower SBP and DBP with increasing tertiles of vitamin D ● Inverse correlation between vitamin D with SBP and DBP |
| Milagres, 2017-Vicosa, Brazil [74] |
378 children from all public and private schools from the Survey of Health Assessment of Schoolchildren, not taking medications interfering with metabolism of vitamin D, glucose, lipids, and no vitamin mineral supplementation. Mean BMI Z-score: 0·41 (1.4) % Male: 47.8% Age in years: Range: 8–9; Mean(SD): NR |
Serum 25(OH)D: architect 25-OH vitamin D assay Vitamin D status group: Deficient: < 50 nmol/L; Insufficient: ≥ 50–< 75 nmol/L; Sufficient: ≥ 75 nmol/L SBP and DBP: average of 3 readings by an automatic inflation BP monitor in a sitting position with at least a 5-min rest Elevated BP: SBP or DBP ≥ 90th p for age, gender and height according to the VI Brazilian guidelines of HTN by the Brazilian Society of Cardiology |
Age; Gender; Season Ethnicity; PTH; Per capita income; Maternal schooling; vitamin D intake; Sedentary behavior; Percentage of body fat (or other measures of adiposity) |
No difference in prevalence of elevated BP and HTN across vitamin D status groups |
| Moore, 2017-USA [75] |
2908 children and adolescents from the NHANES study (2007–2010), not pregnant, and completed 24-h recall Mean BMI(SD) in kg/m2: NR % Male: 51.4% Age in years: Range: 8–18; Mean(SD): NR |
Serum 25(OH)D: LC/MS Vitamin D status group: Deficient: < 50 nmol/L; Insufficient: 50–72.5 nmol/L; Sufficient :> 72.5 nmol/L SBP and DBP: average of 3 readings by the auscultatory method in a sitting position for 5 min Normal BP: SBP or DBP < 90th p for age, sex and height; Pre-HTN: SBP: ≥ 90th to < 95th p for age, sex and height; HTN: ≥ 95th p for age, sex and height |
Race/ethnicity; Sex; Age; Economic status; BMI z-score |
● No association between vitamin D with SBP and DBP, in adjusted model ● Higher prevalence of HTN with poorer vitamin D status |
| Muhairi, 2013- Al Ain, UAE [76] |
315 healthy adolescents (BMI: 5–75th p for age and sex), not using regular medications or have chronic medical conditions that might affect growth, body composition, dietary intake or physical activity and non-smokers, recruited from schools obese:16.5%; Overweight :15.9; Lean: 67.5% % Male: 48% Age in years: Range: 12–18; Mean(SD): NR |
Serum 25(OH)D: radioimmunoassay SBP and DBP: average of 2 readings by a standard mercury sphygmomanometer after a 5-min rest in a sitting position with appropriate cuff size |
None | No difference in vitamin D level among normotensive and those with high BP |
| Nam, 2012- South Korea [77] |
713 adolescents from the KNHANES (2007–2009), nationwide survey not having congenital heart disease or previous diagnosis of epilepsy Mean BMI (SD) in kg/m2: 21.12 (0.16) % Male: 53.01 Age in years: Range: 12–19; Mean(SD): NR |
Serum 25(OH)D: radioimmunoassay SBP and DBP: average of 2 measurements in 5-min intervals, by standard mercury sphygmomanometer on the right arm |
None |
● No difference in SBP across tertiles of vitamin D ● Lower DBP with increasing tertiles of vitamin D |
| Nam, 2014- South Korea [78] |
1504 adolescents from the KNHANES (2008–2009), nationwide survey, not having congenital heart disease or epilepsy Mean BMI(SE): insufficient group: 21.2 (0.1); sufficient group: 20.4 (0.2) % Males: 52.65% Age in years: Range: 12–18; Mean(SD): NR |
Serum 25(OH)D: radioimmunoassay Vitamin D status groups: Insufficient: ≤ 50 nmol/L; Sufficient: > 50 nmol/L SBP and DBP: average of 2 measurements in 5-min intervals, by standard mercury sphygmomanometer on the right arm High BP: SBP or DBP ≥ 90th p for age and sex, use of BP-lowering medication or a previous diagnosis of HTN |
For the OR between high BP and 25(OH)D: Age; Gender; BMI; Regular physical exercise; Alcohol drinking; Use of multivitamin or mineral supplements |
● Inverse correlation between vitamin D with SBP and DBP ● No difference in SBP across vitamin D status groups; higher DBP with vitamin D insufficiency ● Similar odds of high BP across vitamin D status groups, in adjusted model |
| Nsiah-Kumi, 2012- Nebraska, USA [80] |
198 native American healthy youth (without active infection, or illness that could affect weight), recruited from schools, local grocery store, tribal exercise facility, health facilities, community events Mean BMI p: 78 (1.7) % Male: 47% Age in years: Range: 5–19; Mean(SEM): 10.8 (0.3) |
25(OH)D: radioimmunoassay vitamin D status groups: Deficient: < 40 nmol/L; Insufficient: < 75 nmol/L SBP and DBP: after a 5-min rest, using an appropriately sized cuff |
BMI p for age and sex | Inverse association between vitamin D with SBP and DBP |
| Nwosu, 2013-Central New England, USA [81] |
45 prepubertal healthy children recruited using paper flyers from primary care physician offices Normal weight: 44.4%; Overweight: 55.6% % Male: 58% Age in years: Range: 3–12; Mean(SD): 8.3 (2.5); Males: 9.0 (2.4); Females: 7.28 (2.4) |
Serum 25(OH)D: chemiluminescent immunoassay Vitamin D status groups: Deficient:< 50 nmol/L; Sufficient: > 50 nmol/L SBP and DBP: NR |
None | No differences in SBP and DBP across vitamin D status groups |
| Oliveira, 2014-Juiz de Fora, Brazil [83] |
160 healthy adolescents not using medications or supplements, recruited from schools Normal weight: 48.1%; Overweight: 51.9% (matched for age, gender and type of school) % Male: 55.6% Age in years: Range: 15–17; Mean(SD): 16 (0.9) |
Serum 25(OH)D: radioimmunoassay SBP and DBP: average of the second and third measurements, at 5-min intervals, with the right arm at the same level as the heart, by an equipment validated against mercury sphygmomanometers according to the international validation protocol, using an appropriate cuff size, in a sitting position Elevated BP: based on parameters of the Brazilian HTN Society taking into account gender, age and height |
None | Lower vitamin D level among hypertensive participants |
| Olson, 2012- North Texas, USA [84] |
411 obese (BMI ≥ 95th p for age) children without disease, not using medications or vitamin D supplement > 400 IU/day, recruited from an obesity center at a children’s medical center Mean BMI(SD) in kg/m2: NR % Male: 43% Age in years: Range: 6–16; Mean(SD): 11.7(2.6) |
25(OH)D: chemiluminescent immunoassay SBP and DBP: average of up to 3 measures, by dinamap procare monitor, at rest |
BMI z-scores; Age | No correlation between vitamin D with SBP and DBP |
| Pacifico, 2011-Rome, Italy [85] |
452 healthy children recruited from outpatient clinics %Male Tertile 1: 49.4%; Tertile 2: 45%; Tertile 3: 45.6% Overweight/obese: 67.25% Age in years: Median(IQR): Tertile 1: 11.5 (4.2); Tertile 2: 11.2 (4.3); Tertile 3: 11.0 (4.0) |
Serum 25(OH)D3: electrochemiluminescence immunoassay SBP and DBP: average of 2 measures, at the right arm in the supine position using an automated oscillatory system, after a 10-min rest Elevated BP: SBP or DBP ≥ 90th p for age, gender and height |
For correlation: age; gender; Tanner stage For regression: Model 1: age; gender; Tanner stage Model 2: age; gender; Tanner stage; waist circumference Model 3: age; gender; Tanner stage; Standard deviation score-BMI |
● Lower SBP and DBP with increasing tertiles of vitamin D ● Negative correlation between vitamin D with SBP only ● Lower odds of elevated BP with increasing tertiles of vitamin D, in adjusted model |
| Parikh, 2012- Augusta area, USA [86] |
701 healthy adolescents, not taking medications, recruited from high schools Mean BMI(SD) in kg/m2: 23.0 (4.7) Age in years: Range: 14–18; Mean(SD): 16.2 (1.2) |
Plasma 25(OH)D: liquid chromatography tandem mass spectroscopy SBP and DBP: NR |
Age; Gender; Ethnicity; Sexual maturation; Season; Physical activity; Percent body fat |
● Inverse correlation between vitamin D with SBP and DBP ● Lower SBP with increasing tertiles of vitamin D; No difference in DBP |
| Petersen, 2015-Denmark [87] |
782 healthy children, not taking medications, recruited from schools Girls: Obese: 2%; Overweight: 13%; Normal weight: 74%; Underweight: 11% Boys: Obese: 2%; Overweight: 11%; Normal weight: 78%; Underweight: 9% Age in years: Range: 8–11; Mean(SD): Boys: 10.1 (0.6); Girls: 9.9 (0.6) |
Serum 25(OH)D (including both D2 and D3): automated chemiluminescent immunoassay SBP and DBP: average of 3 readings, after 10-min rest, by an automated device, using two different cuff sizes |
Sex; Age; Height; Ethnicity; Whole-blood EPA+ DHA; Entered puberty (yes/no); Parental education |
● No association between vitamin D with SBP ● Inverse association with DBP, in adjusted model |
| Pirgon, 2013-Turkey [88] |
87 obese adolescents, recruited from a pediatric endocrinology unit: 45 patients with NAFLD and 42 patients without NAFLD, not taking medications, and free of other diseases Mean BMI(SD) in kg/m2: 2.1 (0.3) % Male: 48.2% Age in years: Range: 11–15; Total: Mean(SD): 12.7 (1.3); NAFLD group:12.8 (0.8); Non-NAFLD group:12.6 (1.7) |
Serum 25(OH)D: automated chemiluminescence immunoassay SBP and DBP: mercury-gravity manometer and a cuff appropriate for body size, in a sitting position, after rest for at least 5 min |
None | No correlation between vitamin D with SBP and DBP in participants with and without NAFLD |
| Prodam, 2016- Novara area, Italy [89] |
575 healthy, overweight or obese, sedentary children and adolescents (according to International Obesity Task Force criteria), not using medications, recruited from a pediatric endocrinology clinic Mean BMI (SD) in kg/m2: 26.7 (4.5) Severely obese: 27.6%; Obese: 44.2%; Overweight: 28.2% % Male: 50.26% Age in years: Range: 6–18; Mean(SD): 10.7(2.8) |
Serum 25(OH)D: direct competitive chemiluminescent immunoassay SBP and DBP: average of 3 measurements on the left arm, after a 15-min rest in the supine position and prior to other physical evaluations, using a standard mercury sphygmomanometer |
None | Inverse correlation between vitamin D and SBP only |
| Rafraf, 2014- Boukan, Iran [90] |
216 healthy adolescents, not using medication or supplements, recruited from high schools Mean BMI(SD) in kg/m2: 21.1 (3.5) % Male: 0% Age in years: Range: 14–17; Mean(SD): 15.9 (1.0) |
Serum 25(OH)D: ELISA SBP and DBP: average of 2 measurements, at a 1–2 min interval, in the morning by a mercury sphygmomanometer with an adult cuff on the upper right arm, with the arm horizontally on a table, in the sitting position, after a 5-min rest |
BMI; Energy; Physical activity level | No association between vitamin D with SBP and DBP |
| Reis, 2009- USA [91] |
3528 adolescents nationally representative sample of white, black, Mexican American and other race (NHANES 2001–2004) not diabetic, not pregnant Mean BMI(SD) in kg/m2: NR % Male: 51.5% Age in years: Range: 12–19; Mean(95%CI): 15.4 (15.3–15.6) |
Serum 25(OH)D: radioimmunoassay SBP and DBP: average of up to 4 measures by a mercury-gravity sphygmomanometer using appropriate arm cuff size, in seated position, after a 5-min rest High BP: SBP or DBP ≥ 90th p for age, sex, and height, or use of BP medications |
Age; Gender; Ethnicity; BMI Poverty-to-income ratio; Physical activity No adjustment for vitamin D as outcome |
● Lower prevalence of high BP and SBP with increasing quartiles of vitamin D; No difference in DBP ● Lower vitamin D level among participants with high BP |
| Simpson, 2020-Connecticut, USA [92] |
203 healthy, urban-dwelling children, not using medications or vitamin D supplements > 400 IU/day, recruited to participate in a vitamin D supplementation study from local medical offices and community site Mean BMI(SD) in kg/m2: NR % Male: 50.24% Age in years: Range: 6 months–10 years; Mean(SD): 5.6 (2.3) |
Total serum 25-OHD and 1,25(OH)2D: radioimmunoassay Calculated free 25(OH)D: calculated using serum vitamin D binding protein and albumin concentrations, and their reported dissociation constants Genotype-specific free 25(OH)D: calculated using 25(OH)D/DBP dissociation constants specific for each individual’s haplotype Direct measured free 25(OH)D: ELISA SBP and DBP: NR |
None | Inverse correlation between vitamin D with SBP only |
| Skrzypczyk, 2018- Poland [93] |
49 children and adolescents with primary HTN, not using vitamin D supplements during last 12 months Obese: 30.6%; Overweight: 28.6% % Male: 69.4% Age in years: Range: 5.58–18; Mean(SD): 14.29 (3.17) |
25(OH)D: chemiluminescence Peripheral BP: using oscillometric device 24-h BP: using a SUNTECH OSCAR 2 device and interpreted according to the American Heart Association guidelines. Monitors were programmed to measure BP every 15 min from 6 AM to 10 PM and every 30 min from 10 PM to 6 AM. SBP, DBP and MAP: measured during 24 h |
None | No correlation between vitamin D with SBP and DBP |
| Teixeira, 2018- Rio de Janeiro, Brazil [96] |
60 severely obese adolescents (BMI > 99.9th p for age), without chronic disease, not taking medications or vitamin D supplementation, recruited from an obesity clinic Mean BMI(SD) in kg/m2: 46.21 (7.01) % Male: 36.7% Age in years: Range: 10–20; Mean(SD): 17.32 (1.35) |
Serum 25(OH)D: HPLC Vitamin D status group: Deficient: ≤50 nmol/L; Insufficient: > 50– < 75 nmol/L; Adequate: 75–247 nmol/L SBP and DBP: average of 2 measures taken 1 min apart, by oscillometric technique semi-automatic digital arm device, after a 5-min rest HTN: according to the VI Brazilian Guidelines for HTN in adolescents |
None | No difference in prevalence of HTN across vitamin D status groups |
| Tomaino, 2015- Lima and Tumbes, Peru [97] |
1074 adolescents selected from a community census Mean BMI in kg/m2: 21.2 Overweight (based on standard recommendations for age- and sex-specific body mass index cutoffs for international, adolescent populations): 22% % Male:48% Age in years: Range: 13–15; Mean(SD): 14.9 (0.8) |
25(OH)D: in duplicate, using the LIASON 25-OH vitamin D total assay Vitamin D status group: Deficient: < 50 nmol/L; Non-deficient: ≥ 50 nmol/L SBP and DBP: median of 3 measurements, after 5-min rest, using the right arm and in the seated position MAP: 1/3 SBP + 2/3 DBP |
Overweight status; Age; Sex; Height; Seasonality; Personal smoking status; Second-hand smoke exposure; Monthly household income; Study site | Higher MAP, SBP, DBP with vitamin D deficiency |
| Valle, 2019- Rio de Janeiro, Brazil [98] |
97 overweight (BMI ≥ 85th p) and obese adolescents (BMI ≥ 95th p), cared for in the NESA, free of chronic disease, not taking medications or supplements Mean BMI(SD) in kg/m2: 32.2 (6.3) %Male: 44% Age in years: Range: 12–19; Mean(SD): 14.7 (1.8) |
Serum 25(OH)D: HPLC Vitamin D status group: Deficient: < 50 nmol/L SBP and DBP: by an automatic inflation BP monitor (not detailed) High BP: NR |
None |
● Inverse association between vitamin D with DBP only ● Higher prevalence of elevated BP with vitamin D deficiency ● Higher SBP with vitamin D deficiency |
| Williams, 2011-USA [100] |
Nationally representative sample of healthy adolescents (NHANES 2001–2006) [N for 25(OH)D: 6013; SBP: 4807; DBP: 4777] % Male: Quintile 1: 40.7%; Quintile 2: 52.9%; Quintile 3: 53.7%; Quintile 4: 54.6%; Quintile 5: 54.6% Age in years: Range: 12–19; Mean(95%CI): Quintile 1: 15.7 (15.5, 15.9); Quintile 2: 15.1 (14.9, 15.3), Quintile 3: 14.9 (14.7, 15.2); Quintile 4: 15.2 (15.0, 15.5); Quintile 5: 15.6 (15.4, 15.8) |
Serum 25(OH)D: radioimmunoassay SBP and DBP: average of up to 4 measurements, at rest |
Age; Gender; Ethnicity; Poverty income ratio; Waist circumference; Sampling probability (via weights); Cluster effects | Inverse association between vitamin D and SBP only |
| Wojcik, 2017- Krakow, Poland [104] |
30 obese adolescents recruited from a children’s university hospital Mean BMI(SD)in kg/m2: 32.5 (4.85) % Male: 46.66% Age in years: Range: NR; Mean(CI): 13.23 (12.64–13.8) |
Serum 25(OH)D: HPLC Vitamin D status group: Deficient: < 50 nmol/L SBP and DBP: average of 3 measurements, every 3 min, using a pneumatic sphygmomanometer Arterial HTN: mean SBP and/or DBP >95th p for age, height and gender |
None | Higher prevalence of arterial HTN and DBP with vitamin D deficiency; no difference in SBP |
| Xiao, 2020- China [105] |
6091 nationally representative sample of children and adolescents, without any condition, or use of drug affecting cardiovascular health, recruited from schools Mean BMI(SD) in kg/m2: NR % Male:50.2% Age in years: Range: 6–18; Mean(SD): 11.9 (3.7) |
Plasma 25(OH)D: chemiluminescent immunoassay Vitamin D status group: Adequacy: < 50 nmol/L; Inadequacy: > 50 nmol/L SBP and DBP: average of last 2 reading out of 3, with 1–2 min intervals, after resting for at least 15 min, in a sitting position from the right arm using a suitable cuff size based on the arm circumference HTN: average SBP and/or DBP ≥ 95th sex, age and height-specific p for Chinese children and adolescents, or taking antihypertensive drugs |
Age; Gender; Season of blood collection; Geographical location; Smoking; Drinking; Physical activity; Dietary vitamin D intake; BMI; Fat mass percentage; Muscle mass index | Higher odds of HTN with vitamin D inadequacy, in the total sample and in girls only |
| Yousefichaijan, 2019- Arak, Iran [106] |
65 healthy children, without disease, not taking hypertensive drugs, with vitamin D deficiency, recruited from a hospital Mean BMI(SD) in kg/m2: 16 (2.84) % Male: 49.2% Age in years: Range < 11; Mean(SD): 13.9 (3.2) |
Serum 25(OH)D: NR Vitamin D status group: Deficient: < 50 nmol/L SBP and DBP: digital monitor citizen Hypertensive status: Normal: BP < 90th p for age, gender and height; Pre-HTN: BP: 90–95th p; Stage 1 HTN: BP: 95–99th p + 5 mmHg; Stage II HTN: BP: >99th pe + 5 mmHg |
None | No difference in vitamin D level across BP status groups |
| Zhou, 2011- USA [107] |
140 healthy obese (BMI > 95th p for age and gender) children, recruited from a pediatric endocrine clinic Mean BMI(SD) in kg/m2: 34.5 (7.4) % Male: 40.7% Age in years: Range: 6–21; Mean(SD): 13.9 (3.2) |
Serum 25(OH)D: chemiluminescent assay SBP and DBP: NR |
Age |
● Negative correlation between vitamin D with SBP only ● Higher SBP with vitamin D deficiency |
| Retrospective | ||||
| Aypak, 2014- Ankara- Turkey [39] |
168 medical records of Turkish children, from outpatient pediatric clinics Obese: 26.2%; Overweight 20.2%; Lean: 53.6% % Male: 51.8% Age in years: Range: 4–16; Median: 11 |
25(OH)D: imunochemiluminescent assay SBP and DBP: NR |
None | No correlation between vitamin D with SBP and DBP |
| Gul, 2017- Tokat- Turkey [49] |
310 obese children (> 95th p for sex-specific growth curves and cut-off levels for Turkish children), followed up at an obesity clinic Mean BMI(SD) in kg/m2: 29.22 (4.71) % Male: 42.6% Age in years: Range: 6–17; Mean(SD): 12.10 (2.82) |
Serum 25(OH)D: chemiluminescence immunoassay Vitamin D status groups: Deficient: < 37.5 nmol/L; Insufficient: 37.5–72.5 nmol/L; Sufficient: ≥ 75 nmol/L SBP and DBP: NR HTN: BP ≥ 95th p for age, sex and height |
None |
● No differences in HTN frequency, SBP and DBP according to vitamin D status groups ● No correlation between vitamin D with SBP and DBP ● Lower vitamin D level among hypertensive participants |
| Kao, 2015- Australia [16] |
229 obese children and adolescents (BMI ≥ 95th p for age and sex-specific growth curves) without pre-existing disorders of vitamin D synthesis or action, attending obesity outpatient clinics Mean BMI(SD) in kg/m2: 34.8 (94) % Male: 50.7% Age in years: Range: 2–18; Mean(SD): 12.1 (3) |
Serum 25(OH)D: electrochemiluminescent immunoassay or direct chemiluminescence competitive immunoassay SBP and DBP: manual sphygmomanometer in a seated position with appropriate cuff size |
BMI; Age; Gender; Season |
● Lower SBP and DBP with increasing quintiles of vitamin D ● Higher odds of elevated BP with lower quintiles of vitamin D |
| Kumaratne, 2017- California, USA [66] |
234 healthy Hispanic adolescents from pediatric clinics not taking vitamin D supplementation and having no chronic illness by chart review BMI (< 85th p): 44.4%; Overweight(≥ 95th p for age and gender); Obese (BMI > 85th p for age and gender): 55.6% % Male: 53% Age in years: Range: 13–19; Mean(SD): NR |
Serum 25(OH)D: NR Vitamin D status groups: Deficient: < 50 nmol/L; Adequate: ≥ 50 nmol/L SBP and DBP: NR |
None | No differences in SBP and DBP across vitamin D status groups, among all weight categories |
| MacDonald, 2017- Alberta, Canada [71] |
217 overweight (BMI 85–97 p for age and sex)and obese (> 97th p for age and sex) children attending a pediatric weight management clinic, data collected from charts Mean BMI(SD) in kg/m2: Deficient group: 33.0 (8.1); Sufficient group: 30.1 (6.6) % Male: 50% Age in years: Range: 12–18; Mean(SD): 12.0 (2.9) |
Serum 25(OH)D: according to standard methodologies Vitamin D status groups: Deficient: < 50 nmol/L; Sufficient: > 50 nmol/L SBP and DBP: by an automatic BP machine with appropriate cuff size |
None | No differences in SBP and DBP across vitamin D status groups |
| Smotkin-Tangorra, 2007- New York, USA [95] |
217 obese (>95th p for age and sex) children and adolescents, recruited from a pediatric endocrine clinic at an infants and children's hospital Mean BMI(SD) in kg/m2: 32.2 (6.4) % Male: 45.6% Age in years: Range: 7–18; Mean(SD): 12.9 (5.5) |
25(OH)D: NR Vitamin D status groups: Insufficient: < 50 nmol/L SBP: 1 measure in seated position |
None | Higher SBP with vitamin D insufficiency |
| Williams, 2014- Pennsylvania, USA [103] |
150 obese children and teenagers (≥ 95 p) attending a pediatric weight loss program Mean BMI(SD) in kg/m2: NR % Male: 35% Age in years: Range: 5–19; Mean(SD): Deficient group: 14.5 (3.1); Insufficient group: 13.6 (3.4) |
Serum 25(OH)D: NR Vitamin D status groups: Deficient: < 50 nmol/L; Insufficient: < 75 nmol/L SBP and DBP: NR High BP: > 95th p for age and sex |
Age; Sex; Race; Location; Season; Insulin level; Hyperlipidemia; Total comorbidities | Higher SBP with poorer vitamin D status; no difference in prevalence of high BP and DBP |
| Case-control | ||||
| Liang, 2018- China [70] |
164 children from an established cohort recruited from elementary schools divided into: Hypertensive group: children diagnosed with HTN, not under treatment for vitamin deficiency and not taking antihypertensive drugs or other medications, and free of other diseases Non-hypertensive group: children without HTN or any other disease that affect vitamin absorption and metabolism Mean BMI(SD) in kg/m2:19.45 (4.59); hypertensive group: 22.51 (4.39); non-hypertensive group: 16.36 (1.94) % Male: 50.6% Age in years: Range: 6–12; Mean(SD): 9.81 (1.62) |
Serum 25(OH)D: HPLC SBP and DBP: average of 3 readings in the sit-down position by electronic sphygmomanometer using an appropriately sized BP cuff placed on the right arm |
BMI | Lower vitamin D level among participants with HTN; NS after adjustment |
| Interventional (baseline assessment) | ||||
| Al Daghri, 2016- Riyadh, Saudi Arabia [109] |
77 children and adolescents, overweight/obese, with fasting blood glucose 5.6–6.9 nmol/L, without acute or chronic medical conditions, not taking vitamin D supplements, recruited from public schools and health centers Mean BMI(SD) in kg/m2: 32.31 (5) % Male: 33.5% Age in years: Range: 12–17; Mean(SD): NR |
Serum 25(OH)D: COBAS e-411 automated analyzer SBP and DBP: average of 2 readings, at rest |
None | Inverse correlation between vitamin D with DBP only |
| Khayyatzadeh, 2018- Iran [63] |
988 healthy adolescents not taking medications or supplements Mean BMI(SD) in kg/m2: 21.07 (4.2) % Male: 0% Age in years: Mean(SD): Deficient group: 14.5 (1.53); Insufficient group: 14.7 (1.51); Sufficient group: 15.2 (1.53) |
Serum 25(OH)D: electrochemiluminescence Vitamin D status groups: Deficient: < 50 nmol/L; Insufficient :50–74.9 nmol/L; and Sufficient: > 75 nmol/L SBP and DBP: standard procedure |
None | No differences in SBP and DBP across vitamin D status groups |
| Ohlund, 2020- Umea and Malmo, Sweden [82] |
206 healthy children recruited for a vitamin D supplementation study Mean BMI(SD) in kg/m2: NR % Male: 46.1% Age in years: Range: 5–7; Mean(SD): NR |
Serum 25(OH)D2 and 25(OH)D3: MS on an API 4000 LC/MS/MS system (AB Sciex) SBP and DBP: using an automated oscillometric sphygmomanometer in Umea, and an automatic BP monitor in Malmo |
Gender; Skin color; Study site; Mothers’ education | Inverse association between vitamin D with SBP and DBP, in adjusted model |
| Smith, 2018- United Kingdom [94] |
110 healthy adolescents, not taking vitamin D supplement or planning a winter sun vacation Obese (≥ 95th p for age): 7%; Overweight (≥ 85– < 95th p for age): 12%; Normal (≥ 2nd– < 85th p for age): 81% % Male: 43% Age in years: Range: 14–18; Mean(SD): 15.9 (1.4) |
Serum 25(OH)D: liquid chromatography-tandem mass spectrometry SBP and DBP: average of 3 measurements, 1-min apart, using an automatic BP monitor, in upright position with the arm supported |
Sex; Age; BMI z-score; Tanner stage; Physical activity | No association between vitamin D with SBP and DBP |
| Cross-sectional baseline assessments from prospective cohort studies | ||||
| Kwon, 2015- South Korea [67] |
205 prepubertal children from Ewha Birth and Growth Cohort Study Mean BMI(SD) in kg/m2: NR % Male: 53.2% Age in years: Range: 7–9; Mean(SD):7.89 (0.85) |
Serum 25(OH) D: radioimmunoassay SBP and DBP: average of 2 readings, 5 min apart, by an automatic device with the correct cuff size and the arm properly supported |
Age; Sex; BMI z-score; Birth order; Fruit/fruit juice intake; Maternal educational level | No association between vitamin D with SBP and DBP, in adjusted model |
| Williams, 2012- Avon, Southwest England [101] |
4274 children from the Avon Longitudinal Study of Parents and Children at 9 years of follow-up Mean BMI(SD) in kg/m2: 17.6 (2.7) % Male: NR Age in years: Mean(SD): 9.86 (0.32) |
25(OH)D: HPLC Season-adjusted 25(OH)D3 Total 25(OH)D: sum of 25(OH)D2 and unadjusted 25(OH)D3 SBP and DBP: mean of 2 measurements, using a Vital Signs monitor, at rest, with the arm supported at chest level |
Age; Gender; Ethnicity; Socioeconomic position; Waist circumference; PTH; Circulating calcium and phosphate level | No association between vitamin D with SBP and DBP, in adjusted model |
| Cross-sectional baseline assessment from a prospective cohort study and cross-sectional | ||||
|
Nandi-Munshi, 2017- USA [79] NHANES (2001–2006): Cross-sectional SNAS: Prospective cohort (baseline assessment) |
NHANES: 8789 children and adolescents Obese: 19.79%; Overweight: 16.48%; Lean: 63.73% % Male: 49.9% Age in years: Range: 6–19 SNAS: 938 youth with type 1 diabetes Obese: 13.02%; Overweight: 21.04%; Lean: 65.94% % Male: 52.2% Age in years: up to 19 |
NHANES: Serum 25(OH)D: radioimmunoassay SBP and DBP: average of up to 3 measures, at rest, using a mercury sphygmomanometer BP: normal: SBP and DBP <90th p; pre-HTN: SBP or DBP ≥ 90th–< 95th p; HTN: SBP or DBP ≥ 95th p SNAS: Serum 25(OH)D: chemiluminescence immunoassay based on a linkage between specific vitamin D antibody-coated magnetic particles and an isoluminol derivative SBP and DBP: average of 3 measures, using a mercury sphygmomanometer HTN: BP > 90 p for age, sex, and height, or use of antihypertensive drugs |
None | No difference in vitamin D level among normotensive and those with HTN |
BMI body mass index, SD standard deviation, 25(OH)D 25-hydroxyvitamin D, ELISA enzyme-linked immunosorbent assay, SBP systolic blood pressure, DBP diastolic blood pressure, NR not reported, USA United States of America, p percentile, BP blood pressure, EPITeen EPIdemiological health Investigation of Teenagers in Port, HELENA Healthy Lifestyle in Europe by Nutrition in Adolescence, HTN hypertension, NESA Nucleo de Estudos da Saude do Adolescente, HPLC high-performance liquid chromatography, NHANES National Health and Nutrition Examination Survey, Q quartile, MAP mean arterial pressure, HDL high-density lipoprotein cholesterol, KNHANES Korean National Health and Nutrition Examination Survey, KMOSES Korean Metabolic Disorders and Obesity Study in Elementary School Children, OSCIR Oxidative Stress in Childhood Insulin Resistance, PTH parathyroid hormone, LC/MS liquid chromatography/mass spectrometry, SE standard error, SEM standard error to the mean, IU international unit, IQR interquartile range, EPA eicosapentaenoic acid, DHA docosahexaenoic acid, NAFLD non-alcoholic fatty liver disease, 1,25(OH)2D 1,25-dihydroxyvitamin D, CI confidence interval
Results of the studies
The findings of non-prospective cohort studies are also available in Table 2 (see Additional file 3 for the detailed numerical results of the studies). Among the 36 studies [27–34, 38–41, 43, 44, 47, 49, 51, 52, 59, 63, 66, 69, 71–73, 77, 81, 88, 89, 92, 93, 95, 96, 98, 104, 108, 109] that did not adjust for potential confounders, ten [28, 29, 31, 47, 73, 89, 92, 95, 98, 109] found a significant inverse association between vitamin D and SBP (of which three [29, 31, 109] in boys only), while the majority (n = 25) [30, 32–34, 38–41, 43, 44, 49, 51, 52, 59, 63, 66, 69, 71, 72, 77, 78, 88, 93, 104, 108] did not report such findings. Regarding the relationship between vitamin D and DBP, twelve [28–32, 47, 73, 77, 98, 104, 108, 109] found a significant inverse association (of which two [31, 109] in boys only), whereas most of the studies (n = 21) [33, 34, 38–41, 44, 49, 51, 52, 59, 63, 66, 69, 71, 72, 81, 88, 89, 92, 93] did not. Regarding hypertension, three studies [47, 98, 104] found higher prevalence with poorer vitamin D status. In contrast, two studies [49, 96] did not report any relationship between vitamin D and hypertension status.
Regarding the four studies [46, 54, 68, 107] that adjusted for age and/or gender, all of them [46, 54, 68, 107] found a significant inverse association between vitamin D and SBP. Also, three [46, 54, 68] reported a negative relationship with DBP; yet, only one study [107] did not find any association between vitamin D and DBP. One study [46] reported on higher prevalence of hypertension with lower vitamin D levels. The only study [58] that adjusted for BMI and physical activity found a higher SBP with vitamin D deficiency, but did not find any association between vitamin D and DBP, as well as the prevalence of hypertension.
Out of the six studies [14, 35, 37, 61, 80, 84] which adjusted for age, gender, and/or anthropometric measurements including BMI, three [35, 61, 80] found a significant inverse association between vitamin D and SBP, whereas another three [14, 37, 84] did not find such a relationship. Two studies [61, 80] reported a significant negative association between vitamin D and DBP, whereas four [14, 35, 37, 84] did not. The only study [14] that assessed high BP did not report any significant association with vitamin D.
Regarding the three studies [53, 62, 85] that adjusted for age, gender, anthropometric measurements, and/or sexual maturation level, one [85] found a significant inverse association with SBP, while two [53, 62] did not find such an association. Further, one [85] found a significant inverse association with DBP, whereas two [53, 62] did not find any association. The only study [85] that assessed high BP status, reported an inverse relationship with vitamin D.
Regarding the 27 studies [15, 16, 36, 42, 45, 48, 50, 55–57, 64, 65, 67, 74, 75, 78, 82, 86, 87, 90, 91, 94, 97, 100, 101, 103, 105] which adjusted for multiple confounding factors, eleven studies [15, 16, 48, 55, 65, 82, 86, 91, 97, 100, 103] reported a significant inverse relationship between vitamin D and SBP, whereas twelve [36, 42, 45, 50, 56, 57, 67, 75, 87, 90, 94, 101] found no such relationship. Eight studies [16, 48, 55, 65, 82, 86, 87, 97] found a significant inverse relationship between vitamin D and DBP, yet, the majority (n = 14) [15, 36, 42, 45, 50, 56, 67, 75, 90, 91, 94, 100, 101, 103] found no such association. Finally, six [16, 65, 75, 78, 91, 105] found an inverse association between vitamin D and elevated BP status, whereas three [64, 74, 103] did not.
Only eleven studies [14, 42, 43, 49, 70, 76, 79, 83, 91, 99, 106] investigated vitamin D levels across groups of BP status. Among them, four studies [49, 70, 83, 91] found a lower vitamin D level in participants with elevated BP compared with their counterparts; whereas seven [14, 42, 43, 76, 79, 99, 106] did not find a difference in vitamin D level among normotensive participants and those with high BP.
Assessment of risk of bias
The assessment of risk of bias of non-prospective cohort studies is presented in Fig. 3. Developing and/or applying appropriate eligibility criteria were flawed in seven studies [16, 39, 49, 66, 71, 95, 103] and were unclear in another eight [43, 44, 51, 59, 73, 81, 97, 104]. Interestingly, seven studies [43, 52, 64, 66, 95, 103, 106] did not describe the measurement of vitamin D, another 30 [14, 16, 29, 32, 37–39, 43, 49, 51, 53, 54, 57, 63, 66, 69, 71, 72, 80–82, 86, 88, 92, 98, 103, 106–109] did not provide a detailed description of BP measurement, and 29 [28, 31, 33–36, 42, 44–46, 48, 50, 52, 55, 56, 58, 59, 61, 67, 68, 76–78, 85, 90, 95, 96, 101, 109] had a high risk of bias for BP measurement. Only 29 studies [15, 16, 36, 42, 45, 48, 50, 55–57, 61, 62, 64, 65, 67, 74, 75, 82, 85–87, 90, 91, 94, 97, 100, 101, 103, 105] provided results adequately adjusted to potential confounders.
Fig. 3.

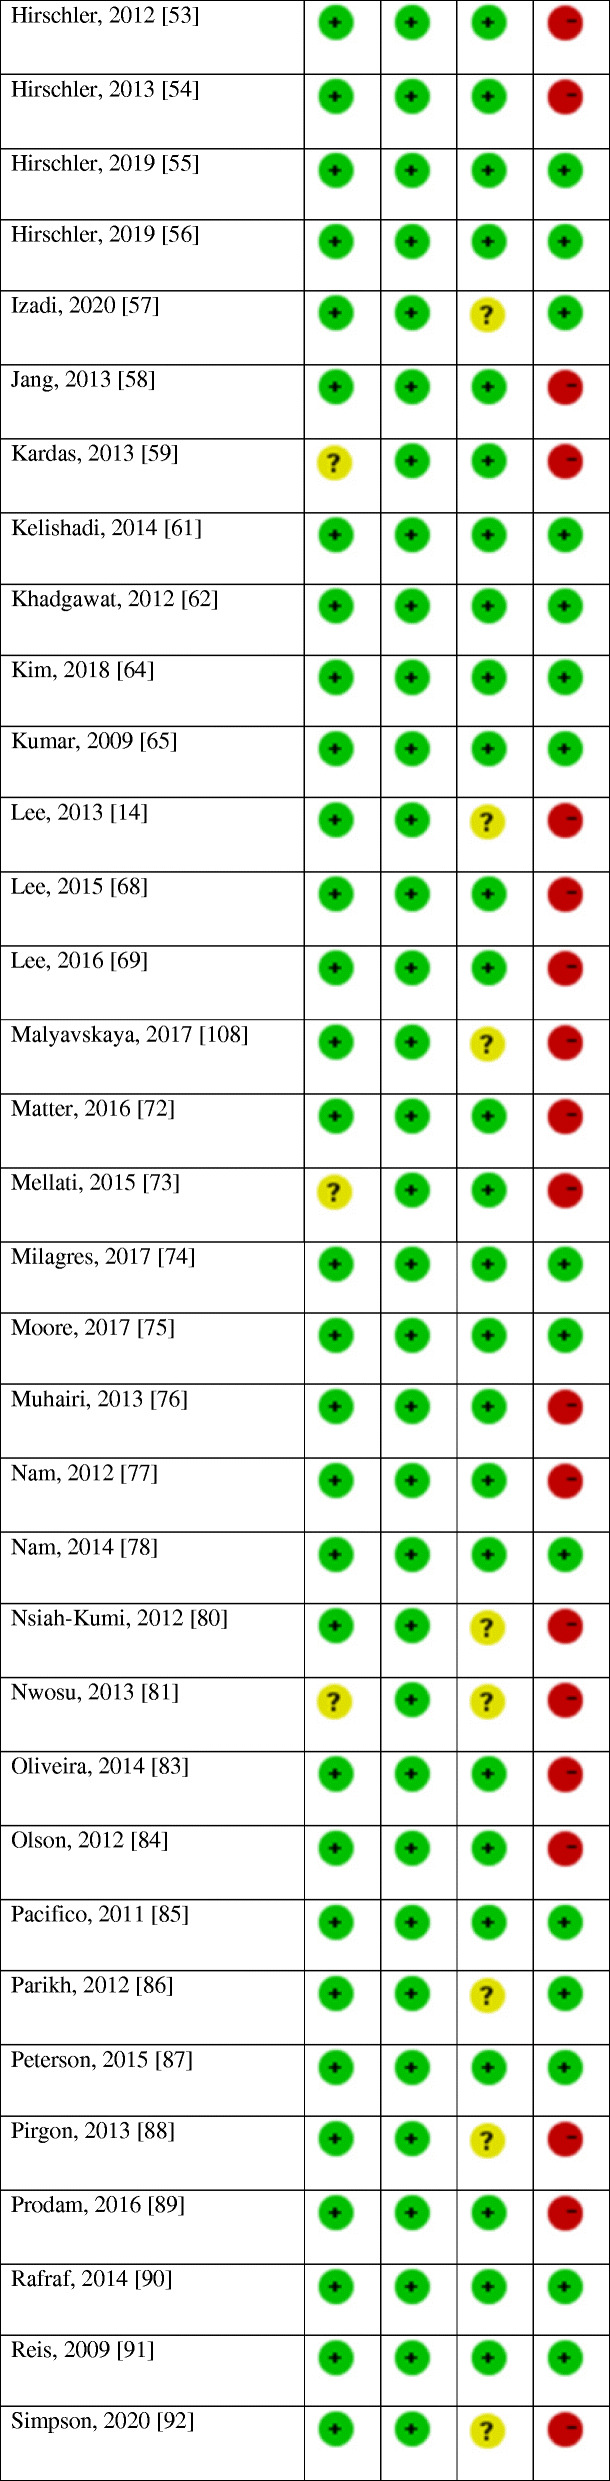

Risk of bias of the non-prospective cohort studies
Discussion
Vitamin D deficiency is a global and pressing public health problem even in countries that have an abundance of sunshine throughout the year [110], and in countries where vitamin D supplementation has been implemented for years [8, 111]. Despite the striking lack of data pertaining to children and adolescents worldwide [112], available evidence pinpoints a widespread vitamin D deficiency specifically in this age group [113–118]. This deficiency can be attributed to atmospheric and environmental determinants such as high latitude and air pollution; endogenous characteristics such as genetics, skin pigmentation, obesity, and limited physical activity; and behavioral factors, such as sun avoidance, reduced outdoor activities, and use of sunscreen [119]. Similarly, the prevalence of elevated BP in this age group has been on the rise [2]. Interestingly, factors associated with decreased skin production of vitamin D, including high latitude, industrialization, and dark skin, were also shown to be associated with increased BP levels [120]. Thus, the association between vitamin D and BP gained increasing attention over the last couple of years.
Accumulating evidence ranging from molecular mechanisms to biochemical (physiological) and clinical data suggests that vitamin D deficiency contributes to hypertension and proposes an antihypertensive effect of this vitamin, through vasculo- and renoprotective effects, suppression of the renin-angiotensin-aldosterone system, and effects on calcium homeostasis, among others [120]. Yet, to date, epidemiological and experimental data has not provided conclusive evidence about the association between BP and 25(OH)D concentrations, and available results are inconsistent with neither inverse nor an independent relationship reported [120, 121]. In order to thoroughly investigate the association between vitamin D and BP in children and adolescents, we conducted a systematic review of observational studies. We provided separate analyses for prospective cohort and non-prospective cohort studies (cross-sectional, retrospective, and case-control). We opted this approach since in non-prospective cohort studies, the temporal relationship between exposure and outcome can often not be determined; thus, it is not possible to determine the direction of causality of the reported relationship [122]. In contrast, although observational cohort studies hold a lower position in the evidence rankings compared with randomized controlled trials (RCTs), their longitudinal findings may shed light on the direction of causality [122] and would, therefore, facilitate causal inference [123].
Our search identified three prospective cohort studies that explored the association between childhood 25(OH)D status and BP during later childhood and adolescence. The three studies showed no association between vitamin D and BP. However, due to the limited number of studies and limited sample size, the conclusions that can be drawn from this analysis are considerably limited, and the clinically relevant information provided is not novel.
The vast majority of the studies identified in our review were non-prospective cohort, which mainly did not show a consistent inverse association between 25(OH)D and SBP or DBP levels, or hypertensive status. Possible reasons for the inconsistency in the findings of these studies might relate to the different methodologies used to evaluate vitamin D status and BP, as well as the flawed evaluation of the latter in some studies, the wide difference in the sample size, seasonality, and difference in maturity (Tanner stage) of the participants, in addition to other physiological and environmental factors [6, 11, 12, 25, 124, 125].
In specific, for the majority of these studies, BP evaluation was mainly based on the average of two readings. This method yields a crude estimation of the average BP level and may be subject to artifacts such as regression to the mean. Recent data among children suggest that the first three measurements differ significantly from the average BP, while the fourth till tenth readings do not, and suggest that in children, the fourth BP reading might be used as a reliable approximation, and BP measurement might be improved by including ten measurements [124]. Only two studies [41, 93] adopted ambulatory blood pressure monitoring (ABPM), which is a superior technique [125] and is considered the gold standard of BP measurements in children and adolescents, as it precisely characterizes changes in BP throughout daily activities, correlates more with target organ damage [126, 127]. Benzato et al. [41] evaluated the relationship between 24-h BP patterns and vitamin D levels in 32 obese children and showed that low levels of vitamin D were associated with a higher BP burden, especially at night. In contrast, Skrzypczyk et al. [93] evaluated 49 children with arterial hypertension and found that vitamin D status did not correlate with office BP nor ABPM parameters except for heart rate, suggesting negative influence of vitamin D on arterial wall, which requires further investigations. Up-till-now, ABPM and other reliable estimates of average BP, such as repeated measurements, were rarely used in large epidemiological and clinical studies in children and even in adults [120].
The lack of a significant association between vitamin D status and BP might be attributable to the recruitment of normotensive participants in the vast majority of the studies [121]. Yet, even in studies investigating vitamin D levels across groups of BP status, the results were inconsistent. And, while the majority these studies did not find a difference in vitamin D level among normotensive participants and those with high BP, four found a lower vitamin D level in participants with elevated BP compared with their counterparts. Further investigating the reason behind these mixed results through prospective cohort studies is warranted, especially that Reis et al. [91] who used data from a large sample from NHANES 2001-2004 demonstrated a lower mean vitamin D among subject with high BP. These same inconsistent findings were reported in the adult population [120].
Through a systematic review of the literature investigating the pediatric population, Abboud [24] showed no effect of vitamin D supplementation on SBP or DBP in RCTs, and only a significant small decrease in DBP in non-randomized trials. The quality of evidence of this analysis ranged between low and moderate. Yet, the author acknowledged the small number of included studies, and the fact that all participants were normotensive at baseline, which might mitigate any effect of vitamin D on reducing BP. Similarly, Hauger et al. [128], through a systematic review of RCTs, found no effect of vitamin D supplementation on cardiometabolic health in childhood and adolescence, except for a beneficial impact of increasing 25(OH)D above 70 nmol/L on insulin resistance only in obese subjects, which still needs to be confirmed in adequately powered, high-quality RCTs. The authors acknowledged the low risk of bias in the included studies, but advised caution when interpreting their results as they are based on a relatively limited number of available RCTs. These results are in line with the findings reported among adults showing that vitamin D supplementation did not affect cardiometabolic outcomes, including BP [129–131]. Only, Witham et al. [132], through a systematic review of the literature and a meta-analysis, showed a small but significant fall in DBP with vitamin D supplementation only among adults with elevated BP, whereas no reduction in BP was observed in people who were normotensive at baseline. Accordingly, while observational studies might show associations between low 25(OH)D concentrations and elevated BP, interventional studies have not confirmed that optimizing vitamin D status through supplementation has antihypertensive effects. It could be deduced that associations between 25(OH)D and BP are not causal. This was also suggested by a large systematic review and meta-analysis on the relationship between vitamin D status and a wide range of acute and chronic health disorders [133].
Finally, it is always worthy to note that when discussing the effects of vitamin D on BP, one must consider the extremely rare yet relevant issue of toxicity with mega doses of vitamin D and associated-hypercalcemia [134], which might lead to reversible hypertension [135]. Data from Tomaino et al. [97] indicate a U-shaped relationship between SBP and 25(OH)D, and inverse J-shaped relationships between DBP and MAP with serum 25(OH)D status.
Strengths and limitations
To our knowledge, this is the first review to systematically assess the association between vitamin D status and BP in children and adolescents, according to a predefined protocol, and following standard methods for reporting systematic reviews [26]. We searched multiple databases and did not set limits to publication language or time, to increase the comprehensiveness of our search. In addition, we critically appraised included studies. Yet, one limitation of our work relates to the quality of the included records. We included observational studies, only three of them were prospective cohort. The remaining included studies were non-prospective cohort (cross-sectional, retrospective, case-control), among which more than half did not adequately control for significant potential confounders. Although the majority of the studies assessed serum concentration of 25(OH)D which is considered the best determinant of vitamin D status [136], few studies adopted rigorous methodology for measuring BP, such as the use of random-zero sphygmomanometers, multiple readings, or automated measurement [132], which may lead to a suboptimal assessment of BP. The quality of evidence of our review is limited by the variable study quality, significant heterogeneity of outcome assessment methods, and study populations. All of which limit our ability to draw a solid conclusion regarding the relationship between vitamin D status and BP. Accordingly, our results suggest of a lack of association, which are certainly not robust enough and should be interpreted with caution.
Conclusions
Accumulating evidence, ranging from physiological mechanisms, to epidemiological data suggests a link between vitamin D deficiency and elevated BP. Yet, conclusive evidence on the antihypertensive effects of vitamin D remains lacking. The results on the relationship between vitamin D status and BP in children and adolescents varied between the studies, and mainly pointed towards lack of association. In order to provide a clear-cut answer on the antihypertensive effects of vitamin D, future work should assess the effect of vitamin D on BP reduction in hypertensive patients through powered, high-quality and long-term RCTs, and should be followed by larger-scale studies examining the impact of vitamin D on hard outcomes, including cardiovascular events and death. If the association proves to be causal, optimizing vitamin D status through supplementation in the pediatric population could slow the rising BP prevalence in this population group. In light of the widespread vitamin D deficiency, and the various health benefits of this vitamin on the musculoskeletal [137], immune [138], neurological [139], and cardiovascular [140] systems, optimizing vitamin D status in the pediatric population remain needed.
Supplementary Information
Acknowledgements
We would like to thank Ms. Aida Farha for her assistance in developing the search strategy.
Abbreviations
- 25(OH)D
Hydroxyvitamin D
- ABPM
Ambulatory blood pressure monitoring
- ALSPAC
Avon longitudinal study of parents and children
- BMI
Body mass index
- BP
Blood pressure
- CHS
Children’s health study
- CVD
Cardiovascular disease
- DBP
Diastolic blood pressure
- MAP
Mean arterial pressure
- MeSH
Medical subject headings
- NHANES
National Health and Nutrition Examination Survey
- PRISMA
Preferred Reporting Items for Systematic Reviews and Meta-analyses
- PROSPERO
International Prospective Register of Systematic Reviews
- RCT
Randomized controlled trials
- SBP
Systolic blood pressure
- USA
United States of America
Authors’ contributions
M.A., R.R., and F.A were involved in the concept and design. S.H. and R.R. performed the searches. M.A., F.A., and D.P. conducted the title and abstract screening. M.A., R.R., N.M., and S.H. conducted the full text screening and performed the data extraction and quality assessment. All the authors contributed to writing the draft manuscript. All authors read and approved the final manuscript.
Funding
This study was funded by the cluster grant R18030 awarded by Zayed University, United Arab Emirates. The funding body was not involved in the design of the study and collection, analysis, and interpretation of data or in writing the manuscript.
Availability of data and materials
Not applicable.
Ethics approval and consent to participate
Not applicable.
Consent for publication
Not applicable.
Competing interests
The authors declare that they have no competing interests.
Footnotes
Publisher’s Note
Springer Nature remains neutral with regard to jurisdictional claims in published maps and institutional affiliations.
Contributor Information
Myriam Abboud, Email: Myriam.abboud@zu.ac.ae.
Fatme Al Anouti, Email: Fatme.AlAnouti@zu.ac.ae.
Dimitrios Papandreou, Email: Dimitrios.Papandreou@zu.ac.ae.
Rana Rizk, Email: rana.rizk@inspect-lb.org.
Nadine Mahboub, Email: nadine.mahboub@outlook.com.
Suzan Haidar, Email: suzan.haidar@liu.edu.lb.
References
- 1.Bell CS, Samuel JP, Samuels JA. Prevalence of hypertension in children: applying the new American Academy of Pediatrics clinical practice guideline. Hypertension. 2019;73:148–152. doi: 10.1161/HYPERTENSIONAHA.118.11673. [DOI] [PMC free article] [PubMed] [Google Scholar]
- 2.Song P, Zhang Y, Yu J, Zha M, Zhu Y, Rahimi K, et al. Global prevalence of hypertension in children: a systematic review and meta-analysis. JAMA Pediatr. 2019;173:1154–1163. doi: 10.1001/jamapediatrics.2019.3310. [DOI] [PMC free article] [PubMed] [Google Scholar]
- 3.Falkner B. Hypertension in children and adolescents: epidemiology and natural history. Pediatr Nephrol. 2010;25:1219–1224. doi: 10.1007/s00467-009-1200-3. [DOI] [PMC free article] [PubMed] [Google Scholar]
- 4.Beckett LA, Rosner B, Roche AF, Guo S. Serial changes in blood pressure from adolescence into adulthood. Am J Epidemiol. 1992;135:1166–1177. doi: 10.1093/oxfordjournals.aje.a116217. [DOI] [PubMed] [Google Scholar]
- 5.Tiu AC, Bishop MD, Asico LD, Jose PA, Villar VAM. Primary pediatric hypertension: current understanding and emerging concepts. Curr Hypertens Rep. 2017;19:70. doi: 10.1007/s11906-017-0768-4. [DOI] [PMC free article] [PubMed] [Google Scholar]
- 6.Holick MF. The vitamin D deficiency pandemic: approaches for diagnosis, treatment and prevention. Rev Endocr Metab Disord. 2017;18:153–165. doi: 10.1007/s11154-017-9424-1. [DOI] [PubMed] [Google Scholar]
- 7.Absoud M, Cummins C, Lim MJ, Wassmer E, Shaw N. Prevalence and predictors of vitamin D insufficiency in children: a Great Britain population based study. PLoS One. 2011;6:e22179. doi: 10.1371/journal.pone.0022179. [DOI] [PMC free article] [PubMed] [Google Scholar]
- 8.Van Schoor N, Lips P. Global overview of vitamin D status. Endocrin Metab Clin. 2017;46:845–870. doi: 10.1016/j.ecl.2017.07.002. [DOI] [PubMed] [Google Scholar]
- 9.Holick MF, Chen TC. Vitamin D deficiency: a worldwide problem with health consequences. Am J Clin Nutr. 2008;87:1080S–1086S. doi: 10.1093/ajcn/87.4.1080S. [DOI] [PubMed] [Google Scholar]
- 10.Parva NR, Tadepalli S, Singh P, Qian A, Joshi R, Kandala H, et al. Prevalence of vitamin D deficiency and associated risk factors in the US population (2011-2012) Cureus. 2018;10:e2741. doi: 10.7759/cureus.2741. [DOI] [PMC free article] [PubMed] [Google Scholar]
- 11.Wortsman J, Matsuoka LY, Chen TC, Lu Z, Holick MF. Decreased bioavailability of vitamin D in obesity. Am J Clin Nutr. 2000;72:690–693. doi: 10.1093/ajcn/72.3.690. [DOI] [PubMed] [Google Scholar]
- 12.Buffington C, Walker B, Cowan GS, Scruggs D. Vitamin D deficiency in the morbidly obese. Obes Surg. 1993;3:421–424. doi: 10.1381/096089293765559142. [DOI] [PubMed] [Google Scholar]
- 13.Laing EM, Lewis RD. New concepts in vitamin D requirements for children and adolescents: a controversy revisited. Front Horm Res. 2018;50:42–65. doi: 10.1159/000486065. [DOI] [PubMed] [Google Scholar]
- 14.Lee S, Kim SM, Park H, Choi KM, Cho GJ, Ko B, et al. Serum 25-hydroxyvitamin D levels, obesity and the metabolic syndrome among Korean children. Nutr Metab Cardiovas. 2013;23:785–791. doi: 10.1016/j.numecd.2012.04.013. [DOI] [PubMed] [Google Scholar]
- 15.Ganji V, Zhang X, Shaikh N, Tangpricha V. Serum 25-hydroxyvitamin D concentrations are associated with prevalence of metabolic syndrome and various cardiometabolic risk factors in US children and adolescents based on assay-adjusted serum 25-hydroxyvitamin D data from NHANES 2001–2006. Am J Clin Nutr. 2011;94:225–233. doi: 10.3945/ajcn.111.013516. [DOI] [PubMed] [Google Scholar]
- 16.Kao KT, Abidi N, Ranasinha S, Brown J, Rodda C, McCallum Z, et al. Low vitamin D is associated with hypertension in paediatric obesity. J Paediatr Child Health. 2015;51:1207–1213. doi: 10.1111/jpc.12935. [DOI] [PubMed] [Google Scholar]
- 17.Dolinsky DH, Armstrong S, Mangarelli C, Kemper AR. The association between vitamin D and cardiometabolic risk factors in children: a systematic review. Clin Pediatr (Phila) 2013;52:210–223. doi: 10.1177/0009922812470742. [DOI] [PubMed] [Google Scholar]
- 18.Norman AW. From vitamin D to hormone D: fundamentals of the vitamin D endocrine system essential for good health. Am J Clin Nutr. 2008;88:491. doi: 10.1093/ajcn/88.2.491S. [DOI] [PubMed] [Google Scholar]
- 19.Forman JP, Williams JS, Fisher ND. Plasma 25-hydroxyvitamin D and regulation of the renin-angiotensin system in humans. Hypertension. 2010;55:1283–1288. doi: 10.1161/HYPERTENSIONAHA.109.148619. [DOI] [PMC free article] [PubMed] [Google Scholar]
- 20.Sugden JA, Davies JI, Witham MD, Morris A, Struthers AD. Vitamin D improves endothelial function in patients with type 2 diabetes mellitus and low vitamin D levels. Diabet Med. 2008;25:320–325. doi: 10.1111/j.1464-5491.2007.02360.x. [DOI] [PubMed] [Google Scholar]
- 21.Tarcin O, Yavuz DG, Ozben B, Telli A, Ogunc A, Yuksel M, et al. Effect of vitamin D deficiency and replacement on endothelial function in asymptomatic subjects. J Clin Endocrinol Metab. 2009;94:4023–4030. doi: 10.1210/jc.2008-1212. [DOI] [PubMed] [Google Scholar]
- 22.Schleithoff SS, Zittermann A, Tenderich G, Berthold HK, Stehle P, Koerfer R. Vitamin D supplementation improves cytokine profiles in patients with congestive heart failure: a double-blind, randomized, placebo-controlled trial. Am J Clin Nutr. 2006;83:754–759. doi: 10.1093/ajcn/83.4.754. [DOI] [PubMed] [Google Scholar]
- 23.Goossens G, Blaak E, Van Baak M. Possible involvement of the adipose tissue renin-angiotensin system in the pathophysiology of obesity and obesity-related disorders. Obes Rev. 2003;4:43–55. doi: 10.1046/j.1467-789X.2003.00091.x. [DOI] [PubMed] [Google Scholar]
- 24.Abboud M. Vitamin D supplementation and blood pressure in children and adolescents: a systematic review and meta-analysis. Nutrients. 2020;12(4):1163. doi: 10.3390/nu12041163. [DOI] [PMC free article] [PubMed] [Google Scholar]
- 25.Abboud M, Rybchyn MS, Rizk R, Fraser DR, Mason RS. Sunlight exposure is just one of the factors which influence vitamin D status. Photochem Photobiol Sci. 2017;16:302–313. doi: 10.1039/C6PP00329J. [DOI] [PubMed] [Google Scholar]
- 26.Moher D, Liberati A, Tetzlaff J, Altman DG. Preferred reporting items for systematic reviews and meta-analyses: the PRISMA statement. Int J Surg. 2010;8:336–341. doi: 10.1016/j.ijsu.2010.02.007. [DOI] [PubMed] [Google Scholar]
- 27.Guyatt GH, Oxman AD, Vist G, Kunz R, Brozek J, Alonso-Coello P, et al. GRADE guidelines: 4. Rating the quality of evidence--study limitations (risk of bias) J Clin Epidemiol. 2011;64:407–415. doi: 10.1016/j.jclinepi.2010.07.017. [DOI] [PubMed] [Google Scholar]
- 28.Al-Daghri N, Al-Attas O, Alokail M, Alkharfy K, Yousef M, Nadhrah H, et al. Hypovitaminosis D and cardiometabolic risk factors among non-obese youth. Open Medicine. 2010;5:752–757. doi: 10.2478/s11536-010-0045-2. [DOI] [Google Scholar]
- 29.Al-Daghri NM, Al-Attas O, Yakout S, Aljohani N, Al-Fawaz H, Alokail MS. Dietary products consumption in relation to serum 25-hydroxyvitamin D and selenium level in Saudi children and adults. Int J Clin Exp Med. 2015;8:1305. [PMC free article] [PubMed] [Google Scholar]
- 30.Al-Daghri NM, Alfawaz H, Aljohani NJ, Wani K, Alharbi M, Al-Saleh Y, et al. Age-specific improvements in impaired fasting glucose and vitamin D status using a lifestyle intervention programme in overweight and obese Saudi subjects. Int J Clin Exp Med. 2016;9:19850–19857. [Google Scholar]
- 31.Al Daghri NM, Al-Saleh Y, Aljohani N, Alokail M, Al-Attas O, Alnaami AM, et al. Vitamin D deficiency and cardiometabolic risks: a juxtaposition of Arab adolescents and adults. PLoS One. 2015;10:e0131315. doi: 10.1371/journal.pone.0131315. [DOI] [PMC free article] [PubMed] [Google Scholar]
- 32.Al-Daghri NM, Bukhari I, Yakout SM, Sabico S, Khattak MN, Aziz I, et al. Associations of serum nitric oxide with vitamin D and other metabolic factors in apparently healthy adolescents. Biomed Res Int. 2018. 10.1155/2018/1489132. [DOI] [PMC free article] [PubMed]
- 33.Alemzadeh R, Kichler J. Parathyroid hormone is associated with biomarkers of insulin resistance and inflammation, independent of vitamin D status, in obese adolescents. Metab Syndr Relat Disord. 2012;10:422–429. doi: 10.1089/met.2012.0056. [DOI] [PubMed] [Google Scholar]
- 34.Alemzadeh R, Kichler J. Uric acid-induced inflammation is mediated by the parathyroid hormone: 25-hydroxyvitamin D ratio in obese adolescents. Metab Syndr Relat Disord. 2016;14:167–174. doi: 10.1089/met.2015.0099. [DOI] [PubMed] [Google Scholar]
- 35.Al-Saleh Y, Al-Daghri N, Alkharfy K, Al-Attas O, Alokail M, Al-Othman A, et al. Normal circulating PTH in Saudi healthy individuals with hypovitaminosis D. Horm Metab Res. 2013;45:43–46. doi: 10.1055/s-0032-1323679. [DOI] [PubMed] [Google Scholar]
- 36.Ashraf AP, Alvarez JA, Dudenbostel T, Calhoun D, Griffin R, Wang X, et al. Associations between vascular health indices and serum total, free and bioavailable 25-hydroxyvitamin D in adolescents. PLoS One. 2014;9:e114689. doi: 10.1371/journal.pone.0114689. [DOI] [PMC free article] [PubMed] [Google Scholar]
- 37.Ashraf AP, Alvarez JA, Gower BA, Saenz KH, McCormick KL. Associations of serum 25-hydroxyvitamin D and components of the metabolic syndrome in obese adolescent females. Obesity (Silver Spring, Md) 2011;19:2214–2221. doi: 10.1038/oby.2011.110. [DOI] [PMC free article] [PubMed] [Google Scholar]
- 38.Atabek M, Eklioglu BS, Akyürek N, Alp H. Association between vitamin D level and cardiovascular risk in obese children and adolescents. J Pediatr Endocrinol Metab. 2014;27:661–666. doi: 10.1515/jpem-2013-0379. [DOI] [PubMed] [Google Scholar]
- 39.Aypak C, Türedi Ö, Yüce A. The association of vitamin D status with cardiometabolic risk factors, obesity and puberty in children. Eur J Pediatr. 2014;173:367–373. doi: 10.1007/s00431-013-2177-2. [DOI] [PubMed] [Google Scholar]
- 40.Bacha F, Bartz SK, Tomsa A, Sharma S. Free vitamin D: relationship to insulin sensitivity and vascular health in youth. J Pediatr. 2019;212:28–34e2. doi: 10.1016/j.jpeds.2019.04.057. [DOI] [PubMed] [Google Scholar]
- 41.Banzato C, Maffeis C, Maines E, Cavarzere P, Gaudino R, Fava C, et al. Hypovitaminosis D and nocturnal hypertension in obese children: an interesting link. J Hum Hypertens. 2014;28:360–366. doi: 10.1038/jhh.2013.122. [DOI] [PubMed] [Google Scholar]
- 42.Cabral M, Araújo J, Teixeira J, Barros H, Martins S, Guimarães JT, et al. Vitamin D levels and cardiometabolic risk factors in Portuguese adolescents. Int J Cardiol. 2016;220:501–507. doi: 10.1016/j.ijcard.2016.06.154. [DOI] [PubMed] [Google Scholar]
- 43.Cheraghi N, Dai H, Raghuveer G. Vitamin D deficiency is associated with atherosclerosis-promoting risk factor clustering but not vascular damage in children. Med Sci Mon Int Med J Exp Clin Res. 2012;18:CR687. doi: 10.12659/MSM.883593. [DOI] [PMC free article] [PubMed] [Google Scholar]
- 44.Choi DP, Oh SM, Lee JM, Cho HM, Lee WJ, Song BM, et al. Serum 25-hydroxyvitamin D and insulin resistance in apparently healthy adolescents. PLoS One. 2014;9:e103108. doi: 10.1371/journal.pone.0103108. [DOI] [PMC free article] [PubMed] [Google Scholar]
- 45.de Moraes ACF, Gracia-Marco L, Iglesia I, González-Gross M, Breidenassel C, Ferrari M, et al. Vitamins and iron blood biomarkers are associated with blood pressure levels in European adolescents. The HELENA study. Nutrition. 2014;30:1294–1300. doi: 10.1016/j.nut.2014.03.010. [DOI] [PubMed] [Google Scholar]
- 46.De Piero BA, Rodríguez-Rodríguez E, González-Rodríguez LG, Ortega Anta RM, López-Sobaler AM. Vitamina D sérica y factores de riesgo metabólico en un grupo de escolares españoles. Nutr Hosp. 2015;31:1154–1162. doi: 10.3305/nh.2015.31.3.8447. [DOI] [PubMed] [Google Scholar]
- 47.Durá-Travé T, Gallinas-Victoriano F, Peñafiel-Freire DM, Urretavizcaya-Martinez M, Moreno-González P, Chueca-Guindulain MJ. Hypovitaminosis D and cardiometabolic risk factors in adolescents with severe obesity. Children. 2020;7:10. doi: 10.3390/children7020010. [DOI] [PMC free article] [PubMed] [Google Scholar]
- 48.Ghobadi S, Rostami ZH, Marzijarani MS, Faghih S. Association of vitamin D status and metabolic syndrome components in Iranian children. Int J Prev Med. 2019;10(1):77. doi: 10.4103/ijpvm.IJPVM_242_17. [DOI] [PMC free article] [PubMed] [Google Scholar]
- 49.Gul A, Ozer S, Yilmaz R, Sonmezgoz E, Kasap T, Takci S, et al. Association between vitamin D levels and cardiovascular risk factors in obese children and adolescents. Nutr Hosp. 2017;34:323–329. doi: 10.20960/nh.412. [DOI] [PubMed] [Google Scholar]
- 50.Ha CD, Cho JK, Lee SH, Kang HS. Serum vitamin D, physical activity, and metabolic risk factors in Korean children. Med Sci Sports Exerc. 2013;45:102–108. doi: 10.1249/MSS.0b013e31826c6956. [DOI] [PubMed] [Google Scholar]
- 51.Hannesdóttir Þ, Hrafnkelsson H, Jóhannsson E, Sigurðsson E. Tengsl D-vítamíns og áhættuþátta hjarta-og æðasjúkdóma meðal íslenskra barna. 2017. [Google Scholar]
- 52.Hassan NE, El Masry SA, El Banna RA, Shady MMA, Al Tohamy M, Ali MM, et al. 25-Hydroxy vitamin D, adiponectin levels and cardiometabolic risk factors in a sample of obese children. Macedonian J Med Sci. 2015;7:562–566. [Google Scholar]
- 53.Hirschler V, Maccallinni G, Gilligan T, Gonzalez C, Claudia M, Smithius F, et al. Association of vitamin D with insulin resistance in argentine boys: a pilot study. J Pediatr Biochem. 2012;2:91–99. [Google Scholar]
- 54.Hirschler V, Maccallini G, Molinari C, Aranda C. Group SAdlCS. Low vitamin D concentrations among indigenous Argentinean children living at high altitudes. Pediatr Diabetes. 2013;14:203–210. doi: 10.1111/pedi.12004. [DOI] [PubMed] [Google Scholar]
- 55.Hirschler V, Molinari C, Maccallini G, Intersimone P, Gonzalez CD. Vitamin D levels and cardiometabolic markers in indigenous argentinean children living at different altitudes. Glob Pediatr Health. 2019;6:2333794X18821942. doi: 10.1177/2333794X18821942. [DOI] [PMC free article] [PubMed] [Google Scholar]
- 56.Hirschler V, Molinari C, Maccallini G, Intersimone P, Gonzalez CD. Collaborators SAdlCSG. Blood pressure levels among indigenous children living at different altitudes. Appl Physiol Nutr Metab. 2019;44:659–664. doi: 10.1139/apnm-2018-0466. [DOI] [PubMed] [Google Scholar]
- 57.Izadi A, Khedmat L, Tavakolizadeh R, Motahedi SY. The intake assessment of diverse dietary patterns on childhood hypertension: alleviating the blood pressure and lipidemic factors with low-sodium seafood rich in omega-3 fatty acids. Lipids Health Dis. 2020;19:1–13. doi: 10.1186/s12944-019-1182-5. [DOI] [PMC free article] [PubMed] [Google Scholar]
- 58.Jang HB, Lee HJ, Park JY, Kang JH, Song J. Association between serum vitamin d and metabolic risk factors in Korean schoolgirls. Osong Public Health Res Perspect. 2013;4:179–186. doi: 10.1016/j.phrp.2013.06.004. [DOI] [PMC free article] [PubMed] [Google Scholar]
- 59.Kardas F, Kendirci M, Kurtoglu S. Cardiometabolic risk factors related to vitamin d and adiponectin in obese children and adolescents. Int J Endocrinol. 2013. 10.1155/2013/503270. [DOI] [PMC free article] [PubMed]
- 60.Ke L, Mason RS, Baur LA, Cowell CT, Liu X, Garnett SP, et al. Vitamin D levels in childhood and adolescence and cardiovascular risk factors in a cohort of healthy Australian children. J Steroid Biochem Mol Biol. 2018;177:270–277. doi: 10.1016/j.jsbmb.2017.07.010. [DOI] [PubMed] [Google Scholar]
- 61.Kelishad R, Ardalan G, Motlagh ME, Shariatinejad K, Heshmat R, Poursafa P, et al. National report on the association of serum vitamin D with cardiometabolic risk factors in the pediatric population of the Middle East and North Africa (MENA): the CASPIAN-III study. Nutrition. 2014;30:33–38. doi: 10.1016/j.nut.2013.05.018. [DOI] [PubMed] [Google Scholar]
- 62.Khadgawat R, Thomas T, Gahlot M, Tandon N, Tangpricha V, Khandelwal D, et al. The effect of puberty on interaction between vitamin D status and insulin resistance in obese Asian-Indian children. Int J Endocrinol. 2012. 10.1155/2012/173581. [DOI] [PMC free article] [PubMed]
- 63.Khayyatzadeh SS, Mirmoosavi SJ, Fazeli M, Abasalti Z, Avan A, Javandoost A, et al. High-dose vitamin D supplementation is associated with an improvement in several cardio-metabolic risk factors in adolescent girls: a nine-week follow-up study. Ann Clin Biochem. 2018;55:227–235. doi: 10.1177/0004563217707784. [DOI] [PubMed] [Google Scholar]
- 64.Kim YS, Hwang JH, Song MR. The association between vitamin D deficiency and metabolic syndrome in Korean adolescents. J Pediatr Nurs. 2018;38:e7–11. doi: 10.1016/j.pedn.2017.11.005. [DOI] [PubMed] [Google Scholar]
- 65.Kumar J, Muntner P, Kaskel FJ, Hailpern SM, Melamed ML. Prevalence and associations of 25-hydroxyvitamin D deficiency in US children: NHANES 2001–2004. Pediatrics. 2009;124:e362–e370. doi: 10.1542/peds.2009-0051. [DOI] [PMC free article] [PubMed] [Google Scholar]
- 66.Kumaratne M, Early G, Cisneros J. Vitamin D deficiency and association with body mass index and lipid levels in Hispanic American adolescents. Glob Pediatr Health. 2017;4:2333794X17744141. doi: 10.1177/2333794X17744141. [DOI] [PMC free article] [PubMed] [Google Scholar]
- 67.Kwon JH, Lee SE, Lee HA, Kim YJ, Lee HY, Gwak HS, et al. Relationship of serum 25-hydroxyvitamin D (25 [OH] D) levels and components of metabolic syndrome in prepubertal children. Nutrition. 2015;31:1324–1327. doi: 10.1016/j.nut.2015.04.023. [DOI] [PubMed] [Google Scholar]
- 68.Lee DY, Kwon AR, Ahn JM, Kim YJ, Chae HW, Kim DH, et al. Relationship between serum 25-hydroxyvitamin D concentration and risks of metabolic syndrome in children and adolescents from Korean National Health and nutrition examination survey 2008-2010. Ann Pediatr Endocrinol Metab. 2015;20:46. doi: 10.6065/apem.2015.20.1.46. [DOI] [PMC free article] [PubMed] [Google Scholar]
- 69.Lee M, Ebert JR, Kadakia MP, Zhang J, Czerwinski SA. Inverse associations between cardiometabolic risk factors and 25-hydroxyvitamin D in obese American children and adolescents. Am J Hum Biol. 2016;28:736–742. doi: 10.1002/ajhb.22863. [DOI] [PubMed] [Google Scholar]
- 70.Liang X, Chen M, Qu P, Hao G, Huan Y, Chen J, et al. The association of vitamin a and vitamin D with hypertension in children: a case-control study. Int J Hypertens. 2018. 10.1155/2018/9295147. [DOI] [PMC free article] [PubMed]
- 71.MacDonald K, Godziuk K, Yap J, LaFrance R, Ansarian M, Haqq A, et al. Vitamin D status, cardiometabolic, liver, and mental health status in obese youth attending a pediatric weight management center. J Pediatr Gastroenterol Nutr. 2017;65:462–466. doi: 10.1097/MPG.0000000000001598. [DOI] [PubMed] [Google Scholar]
- 72.Matter M, El Sherbiny E, Elmougy A, Abass M, Aldossary S, Ali WA. Myocardial function in Saudi adolescents with vitamin D deficiency: tissue Doppler imaging study. J Saudi Heart Assoc. 2016;28:22–30. doi: 10.1016/j.jsha.2015.06.006. [DOI] [PMC free article] [PubMed] [Google Scholar]
- 73.Mellati AA, Sharifi F, Faghihzade S, Mousaviviri SA, Chiti H, Kazemi SAN. Vitamin D status and its associations with components of metabolic syndrome in healthy children. J Pediatr Endocrinol Metab. 2015;28:641–648. doi: 10.1515/jpem-2013-0495. [DOI] [PubMed] [Google Scholar]
- 74.Milagres LC, Rocha NP, de Santis FM, de Albuquerque FM, Castro APP, Pessoa MC, et al. Vitamin D insufficiency/deficiency is associated with insulin resistance in Brazilian children, regardless of body fat distribution. Public Health Nutr. 2017;20:2878–2886. doi: 10.1017/S136898001700194X. [DOI] [PMC free article] [PubMed] [Google Scholar]
- 75.Moore CE, Liu Y. Elevated systolic blood pressure of children in the United States is associated with low serum 25-hydroxyvitamin D concentrations related to body mass index: National Health and examination survey 2007-2010. Nutr Res. 2017;38:64–70. doi: 10.1016/j.nutres.2017.01.008. [DOI] [PubMed] [Google Scholar]
- 76.Muhairi SJ, Mehairi AE, Khouri AA, Naqbi MM, Maskari FA, Al Kaabi J, et al. Vitamin D deficiency among healthy adolescents in Al Ain, United Arab Emirates. BMC Public Health. 2013;13:1–7. doi: 10.1186/1471-2458-13-33. [DOI] [PMC free article] [PubMed] [Google Scholar]
- 77.Nam GE, Kim DH, Cho KH, Park YG, Do Han K, Choi YS, et al. Estimate of a predictive cut-off value for serum 25-hydroxyvitamin D reflecting abdominal obesity in Korean adolescents. Nutr Res. 2012;32:395–402. doi: 10.1016/j.nutres.2012.05.002. [DOI] [PubMed] [Google Scholar]
- 78.Nam GE, Kim DH, Cho KH, Park YG, Do Han K, Kim SM, et al. 25-Hydroxyvitamin D insufficiency is associated with cardiometabolic risk in Korean adolescents: the 2008–2009 Korea National Health and nutrition examination survey (KNHANES) Public Health Nutr. 2014;17:186–194. doi: 10.1017/S1368980012004855. [DOI] [PMC free article] [PubMed] [Google Scholar]
- 79.Nandi Munshi D, Afkarian M, Whitlock KB, Crandell JL, Bell RA, D’Agostino R, et al. Vitamin D and albuminuria in youth with and without type 1 diabetes. Horm Res Paediatr. 2017;87:385–395. doi: 10.1159/000475711. [DOI] [PMC free article] [PubMed] [Google Scholar]
- 80.Nsiah-Kumi PA, Erickson JM, Beals JL, Ogle EA, Whiting M, Brushbreaker C, et al. Vitamin D insufficiency is associated with diabetes risk in native American children. Clin Pediatr. 2012;51:146–153. doi: 10.1177/0009922811417290. [DOI] [PubMed] [Google Scholar]
- 81.Nwosu BU, Maranda L, Cullen K, Ciccarelli C, Lee MM. Vitamin D status is associated with early markers of cardiovascular disease in prepubertal children. J Pediatr Endocrinol Metab. 2013;26:1067–1075. doi: 10.1515/jpem-2013-0086. [DOI] [PubMed] [Google Scholar]
- 82.Öhlund I, Lind T, Hernell O, Silfverdal SA, Liv P, Karlsland ÅP. Vitamin D status and cardiometabolic risk markers in young Swedish children: a double-blind randomized clinical trial comparing different doses of vitamin D supplements. Am J Clin Nutr. 2020;111:779–786. doi: 10.1093/ajcn/nqaa031. [DOI] [PMC free article] [PubMed] [Google Scholar]
- 83.Oliveira RM, Novaes JF, Azeredo LM, Cândido APC, Leite IC. Association of vitamin D insufficiency with adiposity and metabolic disorders in Brazilian adolescents. Public Health Nutr. 2014;17:787–794. doi: 10.1017/S1368980013001225. [DOI] [PMC free article] [PubMed] [Google Scholar]
- 84.Olson ML, Maalouf NM, Oden JD, White PC, Hutchison MR. Vitamin D deficiency in obese children and its relationship to glucose homeostasis. J Clin Endocrinol Metab. 2012;97:279–285. doi: 10.1210/jc.2011-1507. [DOI] [PMC free article] [PubMed] [Google Scholar]
- 85.Pacifico L, Anania C, Osborn J, Ferraro F, Bonci E, Olivero E, et al. Low 25 (OH) D3 levels are associated with total adiposity, metabolic syndrome, and hypertension in Caucasian children and adolescents. Eur J Endocrinol. 2011;165:603. doi: 10.1530/EJE-11-0545. [DOI] [PubMed] [Google Scholar]
- 86.Parikh S, Guo D, Pollock NK, Petty K, Bhagatwala J, Gutin B, et al. Circulating 25-hydroxyvitamin D concentrations are correlated with cardiometabolic risk among American black and white adolescents living in a year-round sunny climate. Diabetes Care. 2012;35:1133–1138. doi: 10.2337/dc11-1944. [DOI] [PMC free article] [PubMed] [Google Scholar]
- 87.Petersen RA, Dalskov SM, Sørensen LB, Hjorth MF, Andersen R, Tetens I, et al. Vitamin D status is associated with cardiometabolic markers in 8–11-year-old children, independently of body fat and physical activity. Br J Nutr. 2015;114:1647–1655. doi: 10.1017/S0007114515003372. [DOI] [PubMed] [Google Scholar]
- 88.Pirgon O, Cekmez F, Bilgin H, Eren E, Dundar B. Low 25-hydroxyvitamin D level is associated with insulin sensitivity in obese adolescents with non-alcoholic fatty liver disease. Obes Res Clin Pract. 2013;7:e275–e283. doi: 10.1016/j.orcp.2012.01.004. [DOI] [PubMed] [Google Scholar]
- 89.Prodam F, Zanetta S, Ricotti R, Marolda A, Giglione E, Monzani A, et al. Influence of ultraviolet radiation on the association between 25-hydroxy vitamin D levels and cardiovascular risk factors in obesity. J Pediatr. 2016;171:83–89. doi: 10.1016/j.jpeds.2015.12.032. [DOI] [PubMed] [Google Scholar]
- 90.Rafraf M, Hasanabad SK, Jafarabadi MA. Vitamin D status and its relationship with metabolic syndrome risk factors among adolescent girls in Boukan. Iran Public Health Nutr. 2014;17:803–809. doi: 10.1017/S1368980013003340. [DOI] [PMC free article] [PubMed] [Google Scholar]
- 91.Reis JP, Von Mühlen D, Miller ER, Michos ED, Appel LJ. Vitamin D status and cardiometabolic risk factors in the United States adolescent population. Pediatrics. 2009;124:e371–e379. doi: 10.1542/peds.2009-0213. [DOI] [PMC free article] [PubMed] [Google Scholar]
- 92.Simpson CA, Zhang JH, Vanderschueren D, Fu L, Pennestri TC, Bouillon R, et al. Relationship of total and free 25-hydroxyvitamin D to biomarkers and metabolic indices in healthy children. J Clin Endocrinol Metab. 2020;105:e1631–e1640. doi: 10.1210/clinem/dgz230. [DOI] [PMC free article] [PubMed] [Google Scholar]
- 93.Skrzypczyk P, Ofiara A, Szyszka M, Dziedzic-Jankowska K, Sołtyski J, Pańczyk-Tomaszewska M. Vitamin D in children with primary hypertension. Arter Hypertens. 2018;22:127–134. doi: 10.5603/AH.2018.0015. [DOI] [Google Scholar]
- 94.Smith TJ, Tripkovic L, Hauger H, Damsgaard CT, Molgaard C, Lanham-New SA, et al. Winter cholecalciferol supplementation at 51 degrees N has no effect on markers of cardiometabolic risk in healthy adolescents aged 14-18 years. J Nutr. 2018;148:1269–1275. doi: 10.1093/jn/nxy079. [DOI] [PubMed] [Google Scholar]
- 95.Smotkin-Tangorra M, Purushothaman R, Gupta A, Nejati G, Anhalt H, Ten S. Prevalence of vitamin D insufficiency in obese children and adolescents. J Pediatr Endocrinol Metab. 2007;20:817–824. doi: 10.1515/JPEM.2007.20.7.817. [DOI] [PubMed] [Google Scholar]
- 96.Teixeira JS, Campos ABF, Cordeiro A, Pereira SE, Saboya CJ, Ramalho A. El estado nutricional de la vitamina D y su relación con los cambios metabólicos en adolescentes y adultos con obesidad severa. Nutr Hosp. 2018;35:847–853. doi: 10.20960/nh.1657. [DOI] [PubMed] [Google Scholar]
- 97.Tomaino K, Romero KM, Robinson CL, Baumann LM, Hansel NN, Pollard SL, et al. Association between serum 25-hydroxy vitamin D levels and blood pressure among adolescents in two resource-limited settings in Peru. Am J Hypertens. 2015;28:1017–1023. doi: 10.1093/ajh/hpu264. [DOI] [PMC free article] [PubMed] [Google Scholar]
- 98.Valle DF, Giannini DT. Correlation between vitamin D and blood pressure in adolescents. Int J Adolesc Med Health. 2019. 10.1515/ijamh-2017-0165. [DOI] [PubMed]
- 99.Wang G, Liu X, Bartell TR, Pearson C, Cheng TL, Wang X. Vitamin D trajectories from birth to early childhood and elevated systolic blood pressure during childhood and adolescence. Hypertension. 2019;74:421–430. doi: 10.1161/HYPERTENSIONAHA.119.13120. [DOI] [PMC free article] [PubMed] [Google Scholar]
- 100.Williams DM, Fraser A, Lawlor DA. Associations of vitamin D, parathyroid hormone and calcium with cardiovascular risk factors in US adolescents. Heart. 2011;97:315–320. doi: 10.1136/hrt.2010.203224. [DOI] [PMC free article] [PubMed] [Google Scholar]
- 101.Williams DM, Fraser A, Sayers A, Fraser WD, Hingorani A, Deanfield J, et al. Associations of 25-hydroxyvitamin D2 and D3 with cardiovascular risk factors in childhood: cross-sectional findings from the Avon longitudinal study of parents and children. J Clin Endocrinol. 2012;97:1563–1571. doi: 10.1210/jc.2011-2335. [DOI] [PMC free article] [PubMed] [Google Scholar]
- 102.Williams DM, Fraser A, Sayers A, Fraser WD, Hyppönen E, Smith GD, et al. Associations of childhood 25-hydroxyvitamin D2 and D3 and cardiovascular risk factors in adolescence: prospective findings from the Avon longitudinal study of parents and children. Eur J Prev Cardiol. 2014;21:281–290. doi: 10.1177/2047487312465688. [DOI] [PMC free article] [PubMed] [Google Scholar]
- 103.Williams R, Novick M, Lehman E. Prevalence of hypovitaminosis D and its association with comorbidities of childhood obesity. Perm J. 2014;18:32. doi: 10.7812/TPP/14-016. [DOI] [PMC free article] [PubMed] [Google Scholar]
- 104.Wojcik M, Janus D, Kalicka-Kasperczyk A, Sztefko K, Starzyk JB. The potential impact of the hypovitaminosis D on metabolic complications in obese adolescents–preliminary results. Ann Agric Environ Med. 2017;24:636–639. doi: 10.5604/12321966.1230676. [DOI] [PubMed] [Google Scholar]
- 105.Xiao P, Dong H, Li H, Yan Y, Cheng H, Liu J, et al. Adequate 25-hydroxyvitamin D levels are inversely associated with various cardiometabolic risk factors in Chinese children, especially obese children. BMJ Open Diabetes Res Care. 2020. 10.1136/bmjdrc-2019-000846. [DOI] [PMC free article] [PubMed]
- 106.Yousefichaijan P, Ezatti F, Ghandi Y, Ezatti B, Khosrobeigi A. Blood pressure status in children with vitamin D insufficiency. Nephro-Urol Monthly. 2019. 10.5812/numonthly.96443.
- 107.Zhou P, Schechter C, Cai Z, Markowitz M. Determinants of 25 (OH) D sufficiency in obese minority children: selecting outcome measures and analytic approaches. J Pediatr. 2011;158:930–934. doi: 10.1016/j.jpeds.2010.11.034. [DOI] [PubMed] [Google Scholar]
- 108.Малявская С, Лебедев А, Кострова Г. Компоненты метаболического синдрома у детей и подростков с различным уровнем витамина d: результаты одномоментного исследования. Вопросы современной педиатрии. 2017;16(3):213–9. doi: 10.15690/vsp.v16i3.1731. [DOI] [Google Scholar]
- 109.Al-Daghri NM, Sabico S, Al-Saleh Y, Al-Attas OS, Alnaami AM, AlRehaili MM, et al. Calculated adiposity and lipid indices in healthy Arab children as influenced by vitamin D status. J Clin Lipidol. 2016;10:775–781. doi: 10.1016/j.jacl.2016.02.005. [DOI] [PubMed] [Google Scholar]
- 110.Mendes M, Charlton K, Thakur S, Ribeiro H, Lanham-New S. Future perspectives in addressing the global issue of vitamin D deficiency. P Nutr Soc. 2020;79:246–251. doi: 10.1017/S0029665119001538. [DOI] [PubMed] [Google Scholar]
- 111.Hilger J, Friedel A, Herr R, Rausch T, Roos F, Wahl DA, et al. A systematic review of vitamin D status in populations worldwide. Br J Nutr. 2014;111:23–45. doi: 10.1017/S0007114513001840. [DOI] [PubMed] [Google Scholar]
- 112.Palacios C, Gonzalez L. Is vitamin D deficiency a major global public health problem? J Steroid Biochem Mol Biol. 2014;144:138–145. doi: 10.1016/j.jsbmb.2013.11.003. [DOI] [PMC free article] [PubMed] [Google Scholar]
- 113.Cashman KD, Sheehy T, O’Neill CM. Is vitamin D deficiency a public health concern for low middle income countries? A systematic literature review. Eur J Nutr. 2019;58:433–453. doi: 10.1007/s00394-018-1607-3. [DOI] [PubMed] [Google Scholar]
- 114.Jeyakumar A, Shinde V. A systematic review and meta-analysis of prevalence of vitamin D deficiency among adolescent girls in selected Indian states. Nutr Health. 2019;25:61–70. doi: 10.1177/0260106018805360. [DOI] [PubMed] [Google Scholar]
- 115.Manios Y, Moschonis G, Lambrinou CP, Tsoutsoulopoulou K, Binou P, Karachaliou A, et al. A systematic review of vitamin D status in southern European countries. Eur J Nutr. 2018;57:2001–2036. doi: 10.1007/s00394-017-1564-2. [DOI] [PubMed] [Google Scholar]
- 116.Mogire RM, Mutua A, Kimita W, Kamau A, Bejon P, Pettifor JM, et al. Prevalence of vitamin D deficiency in Africa: a systematic review and meta-analysis. Lancet Glob Health. 2020;8:e134–e142. doi: 10.1016/S2214-109X(19)30457-7. [DOI] [PMC free article] [PubMed] [Google Scholar]
- 117.Prestwich B, Daly S. What is the prevalence of vitamin D deficiency in the United States? Evidence-Based Practice. 2018;21:8–9. doi: 10.1097/EBP.0000000000000121. [DOI] [Google Scholar]
- 118.van Schoor NM, Lips P. Worldwide vitamin D status. Best Prac Res Clin Endocrinol Metabol. 2011;25:671–680. doi: 10.1016/j.beem.2011.06.007. [DOI] [PubMed] [Google Scholar]
- 119.Grant WB, Bhattoa HP, Pludowski P. Determinants of vitamin D deficiency from Sun exposure: a global perspective. In: Vitamin D (fourth edition), volume 2: health, disease and therapeutics: Elsevier; 2018. p. 79–90.
- 120.Pilz S, Tomaschitz A, Ritz E, Pieber TR. Vitamin D status and arterial hypertension: a systematic review. Nat Rev Cardiol. 2009;6:621–630. doi: 10.1038/nrcardio.2009.135. [DOI] [PubMed] [Google Scholar]
- 121.Chen S, Sun Y, Agrawal DK. Vitamin D deficiency and essential hypertension. J Am Soc Hypertens. 2015;9:885–901. doi: 10.1016/j.jash.2015.08.009. [DOI] [PMC free article] [PubMed] [Google Scholar]
- 122.Dekkers OM, Vandenbroucke JP, Cevallos M, Renehan AG, Altman DG, Egger M. COSMOS-E: guidance on conducting systematic reviews and meta-analyses of observational studies of etiology. PLoS Med. 2019;16:e1002742. doi: 10.1371/journal.pmed.1002742. [DOI] [PMC free article] [PubMed] [Google Scholar]
- 123.Rothman KJ, Greenland S, Lash TL. Modern epidemiology: Lippincott Williams & Wilkins; 2008.
- 124.Ardissino G, Ghiglia S, Salice P, Perrone M, Piantanida S, De Luca FL, et al. Multiple office blood pressure measurement: a novel approach to overcome the weak cornerstone of blood pressure measurement in children. Data from the SPA project. Pediatr Nephrol. 2020;35:687–693. doi: 10.1007/s00467-019-04368-7. [DOI] [PubMed] [Google Scholar]
- 125.Gimpel C, Wühl E, Arbeiter K, Drozdz D, Trivelli A, Charbit M, et al. Superior consistency of ambulatory blood pressure monitoring in children: implications for clinical trials. J Hypertens. 2009;27:1568–1574. doi: 10.1097/HJH.0b013e32832cb2a8. [DOI] [PubMed] [Google Scholar]
- 126.Stabouli S, Kotsis V, Zakopoulos N. Ambulatory blood pressure monitoring and target organ damage in pediatrics. J Hypertens. 2007;25:1979–1986. doi: 10.1097/HJH.0b013e3282775992. [DOI] [PubMed] [Google Scholar]
- 127.Urbina E, Alpert B, Flynn J, Hayman L, Harshfield GA, Jacobson M, et al. Ambulatory blood pressure monitoring in children and adolescents: recommendations for standard assessment: a scientific statement from the American Heart Association atherosclerosis, hypertension, and obesity in youth committee of the council on cardiovascular disease in the young and the council for high blood pressure research. Hypertension. 2008;52:433–451. doi: 10.1161/HYPERTENSIONAHA.108.190329. [DOI] [PubMed] [Google Scholar]
- 128.Hauger H, Laursen RP, Ritz C, Mølgaard C, Lind MV, Damsgaard CT. Effects of vitamin D supplementation on cardiometabolic outcomes in children and adolescents: a systematic review and meta-analysis of randomized contr olled trials. Eur J Nutr. 2020;12(4):1163. [DOI] [PubMed]
- 129.Beveridge LA, Struthers AD, Khan F, Jorde R, Scragg R, Macdonald HM, et al. Effect of vitamin D supplementation on blood pressure: a systematic review and meta-analysis incorporating individual patient data. JAMA Intern Med. 2015;175:745–744. doi: 10.1001/jamainternmed.2015.0237. [DOI] [PMC free article] [PubMed] [Google Scholar]
- 130.Pittas AG, Chung M, Trikalinos T, Mitri J, Brendel M, Pate K, et al. Vitamin D and cardiometabolic outcomes: a systematic review. Ann Intern Med. 2010;152:307. doi: 10.7326/0003-4819-152-5-201003020-00009. [DOI] [PMC free article] [PubMed] [Google Scholar]
- 131.Rejnmark L, Bislev LS, Cashman KD, Eiríksdottir G, Gaksch M, Grübler M, et al. Non-skeletal health effects of vitamin D supplementation: a systematic review on findings from meta-analyses summarizing trial data. PLoS One. 2017;12:e0180512. doi: 10.1371/journal.pone.0180512. [DOI] [PMC free article] [PubMed] [Google Scholar]
- 132.Witham MD, Nadir MA, Struthers AD. Effect of vitamin D on blood pressure: a systematic review and meta-analysis. J Hypertens. 2009;27:1948–1954. doi: 10.1097/HJH.0b013e32832f075b. [DOI] [PubMed] [Google Scholar]
- 133.Autier P, Boniol M, Pizot C, Mullie P. Vitamin D status and ill health: a systematic review. Lancet Diabetes Endocrinol. 2014;2:76–89. doi: 10.1016/S2213-8587(13)70165-7. [DOI] [PubMed] [Google Scholar]
- 134.Holick MF. Vitamin D deficiency. N Engl J Med. 2007;357:266–281. doi: 10.1056/NEJMra070553. [DOI] [PubMed] [Google Scholar]
- 135.Chandar J, Zilleruelo G. Hypertensive crisis in children. Pediatr Nephrol. 2012;27:741–751. doi: 10.1007/s00467-011-1964-0. [DOI] [PubMed] [Google Scholar]
- 136.Randev S, Kumar P, Guglani V. Vitamin D supplementation in childhood–a review of guidelines. Indian J Pediatr. 2018;85:194–201. doi: 10.1007/s12098-017-2476-0. [DOI] [PubMed] [Google Scholar]
- 137.Wimalawansa SJ. Non-musculoskeletal benefits of vitamin D. J Steroid Biochem Mol Biol. 2018;1:60–81. doi: 10.1016/j.jsbmb.2016.09.016. [DOI] [PubMed] [Google Scholar]
- 138.Mailhot G, White JH. Vitamin D and immunity in infants and children. Nutrients. 2020;12:1233. doi: 10.3390/nu12051233. [DOI] [PMC free article] [PubMed] [Google Scholar]
- 139.Saad K, Abdel-Rahman AA, Elserogy YM, Al-Atram AA, Cannell JJ, Bjørklund G, et al. Vitamin D status in autism spectrum disorders and the efficacy of vitamin D supplementation in autistic children. Nutr Neurosci. 2016;19:346–351. doi: 10.1179/1476830515Y.0000000019. [DOI] [PubMed] [Google Scholar]
- 140.Savastio S, Pozzi E, Tagliaferri F, Degrandi R, Cinquatti R, Rabbone I, et al. Vitamin D and cardiovascular risk: which implications in children? Int J Mol Sci. 2020;21:3536. doi: 10.3390/ijms21103536. [DOI] [PMC free article] [PubMed] [Google Scholar]
Associated Data
This section collects any data citations, data availability statements, or supplementary materials included in this article.
Supplementary Materials
Data Availability Statement
Not applicable.