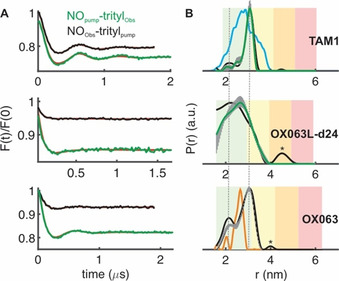
Figure 4.

PELDOR/DEER spectroscopy of BtuB in E. coli. Distances were measured between position 188 and the spin labeled substrate (T‐CNCbl). BtuB was labeled with the three different trityls as indicated. a) Background corrected PELDOR/DEER data with the fits from Tikhonov regularization overlaid in red. b) The corresponding distance distributions. The reliability of the probability distribution is color coded using the longer trace as the reference. In the green zone, shape, width, and mean of the distribution are reliable, whereas in the yellow zone the width and the mean are reliable. The vertical lines indicate the total variation of the probability from a combined validation by changing the background and the noise level (see experimental procedures for details). For TAM1, the corresponding simulation (using MMM) [39] is shown in cyan, and the distribution obtained after labeling with MTSL [5] is shown in orange with the OX063 data. Asterix indicates artifact due to poor signal to noise.
