

Summary
Biological market theory provides a conceptual framework to analyse trade strategies in symbiotic partnerships. A key prediction of biological market theory is that individuals can influence resource value – meaning the amount a partner is willing to pay for it – by mediating where and when it is traded. The arbuscular mycorrhizal symbiosis, characterised by roots and fungi trading phosphorus and carbon, shows many features of a biological market. However, it is unknown if or how fungi can control phosphorus value when exposed to abrupt changes in their trade environment.
We mimicked an economic ‘crash’, manually severing part of the fungal network (Rhizophagus irregularis) to restrict resource access, and an economic ‘boom’ through phosphorus additions. We quantified trading strategies over a 3‐wk period using a recently developed technique that allowed us to tag rock phosphate with fluorescing quantum dots of three different colours.
We found that the fungus: compensated for resource loss in the ‘crash’ treatment by transferring phosphorus from alternative pools closer to the host root (Daucus carota); and stored the surplus nutrients in the ‘boom’ treatment until root demand increased.
By mediating from where, when and how much phosphorus was transferred to the host, the fungus successfully controlled resource value.
Keywords: arbuscular mycorrhizal fungi, biological markets, quantum dots, symbiosis, trading strategies
Introduction
Underground, arbuscular mycorrhizal fungi and plant roots form a trade partnership to exchange resources. The fungus depends on the host plant for carbon (C) (sugars and fats) to fuel the development of a hyphal network foraging for nutrients in the soil (Jiang et al., 2017; Luginbuehl et al., 2017). In return, the fungus delivers phosphorus (P) and nitrogen (N), and other essential elements to the host root (Luginbuehl & Oldroyd, 2017; Field et al., 2019). These nutrients are often physically and chemically less accessible to the host, but can be taken up by the fungus and actively transported through the mycelium (Timonen et al., 2001). With evolutionary origins dating back roughly 450 Myr, the mycorrhizal symbiosis, emerging from the Mucoromycotina and/or Glomeromycota (Field et al., 2015; Hoysted et al., 2018; Strullu‐Derrien et al., 2018), is responsible for mediating nutrient cycles (Johnson et al., 2016), and transferring c. 5 billion tons of C yr–1 from plants to belowground ecosystems (Redecker et al., 2000; Bago et al., 2000).
Unlike many symbioses, which involve one‐to‐one or one‐to‐many interactions, the mycorrhizal symbiosis is characterised by multiple partners transferring nutrients to multiple partners simultaneously (Field & Pressel, 2018). A single plant host is colonised by multiple fungal species and a single fungal mycelium network can colonise multiple plant hosts (Selosse et al., 2006; Montesinos‐Navarro et al., 2012). These interactions mean that there is potential variation in resource transfer depending on environmental context, for example the number of partners (Hart et al., 2013; Perez‐Lamarque et al., 2020), the quality of those partners (Lekberg et al., 2010; Kiers et al., 2011; Argüello et al., 2016) and the local resource availability (Johnson et al., 2015; Ji & Bever, 2016; Whiteside et al., 2019).
Variation in resource transfer is a defining feature of so‐called ‘biological markets’ in which partners compete to provide resources, and those offering the best rate of exchange are favoured (Tasoff et al., 2015; Hammerstein & Noë, 2016; Noë & Kiers, 2018). Biological market theory argues that exchanges of resources and services among organisms can be analysed in market terms, with individuals making strategic trading investments depending on the context of the exchange (Werner et al., 2014). However, it is unknown how applicable the theory is across diverse systems, as it requires that individuals are able to compare and discriminate among competing traders. Past work has demonstrated that some plants are able to discriminate among competing fungal strains, and allocate more C to the higher quality fungi (Kiers et al., 2011; Grman, 2012; Ji & Bever, 2016; Werner et al., 2018). It has likewise been shown that fungal partners allocate more P to plant partners providing more C (Lekberg et al., 2010; Fellbaum et al., 2012, 2014; Konvalinková et al., 2015). Empirical work on partner discrimination is similarly supported by theoretical work showing that the act of individuals dividing resources among trading partners, in direct relationship to the relative amount of resources they receive, is the predicted outcome of natural selection (Wyatt et al., 2014).
Although the principles of biological market theory are generally well supported in mycorrhizal studies, there are also well documented examples of resource exchange between plants and fungi that do not follow market theory predictions (Olsson et al., 2010; Walder et al., 2012; Walder & van der Heijden, 2015; Field & Pressel, 2018; Charters et al., 2020). Some of these examples, including elegant work on mycoheterotrophic plant species (Bidartondo, 2005; Courty et al., 2011; Gomes et al., 2019; Perez‐Lamarque et al., 2020), are clear illustrations of how reciprocal exchange patterns can be violated depending on context. While neither the disappearance of cheating nor perfect partner choice is predicted by biological market theory (Kiers et al., 2016; Noë & Kiers, 2018), many open questions remain on the mechanisms that underlie recipiorocal exchange patterns. One of these questions is how partners respond to abrupt changes in local resource abundance and if/how they adapt their trade patterns to these conditions.
A key prediction of biological market theory is that partners can control or influence the ‘exchange rate’ (amount received : given) as resource availability becomes higher or lower (Noë & Hammerstein, 1994, 1995; Hammerstein & Noë, 2016). For mycorrhizal symbiosis, the exchange rate is defined as the units of C that a fungus receives from a partner plant per unit P provided by the fungus (Noë & Kiers, 2018). Because carbon allocation to the fungal symbiont is costly (c. up to 20% of carbon, Douds et al., 1988; Jakobsen & Rosendahl, 1990), the host is expected to respond to changes in fungal phosphorus transfer by modifying how much carbon it allocates to the fungus (i.e. reciprocal rewards, Kiers et al., 2011). From the fungal vantage point, the value of phosphorus increases if the host is willing to pay more for it (Whiteside et al., 2019). Quantitatively, this value is defined by a higher C : P exchange rate for the fungus. However, measuring how exchange rates respond to changing resource availability has been challenging because of difficulties in precisely manipulating resource availability in mycorrhizal systems, and quantifying resource transfer over time.
We recently developed a fluorescing tagged P that can help resolve some of these constraints (Whiteside et al., 2019; van’t Padje et al., 2020). Specifically, we tagged apatite, a form of rock phosphate, with nanoparticles called quantum dots (QDs) that fluoresce bright and pure colours when excited with UV light. We tagged apatite with a class of QDs that fluoresce in different colours depending on chemical composition of the QD core (Fig. 1a), with each colour having the same size and weight (Jang et al., 2003; Bailey & Nie, 2003; Whiteside et al., 2019). The outer layer of carboxyl polymers protects the organisms from the toxicity of the heavy metal core, and allowed us to conjugate the QDs to P. In this study, we use our QD‐apatite technique to synthesise three colours of fluorescent QD‐apatite. We added a single colour of QD‐apatite to each of three compartments. The root compartment contained the in vitro colonised mycorrhizal root. The other two fungus‐only compartments contained the symbiotic fungal network (i.e. filamentous mycelium of arbuscular mycorrhizal fungi) (Fig. 1).
Fig. 1.
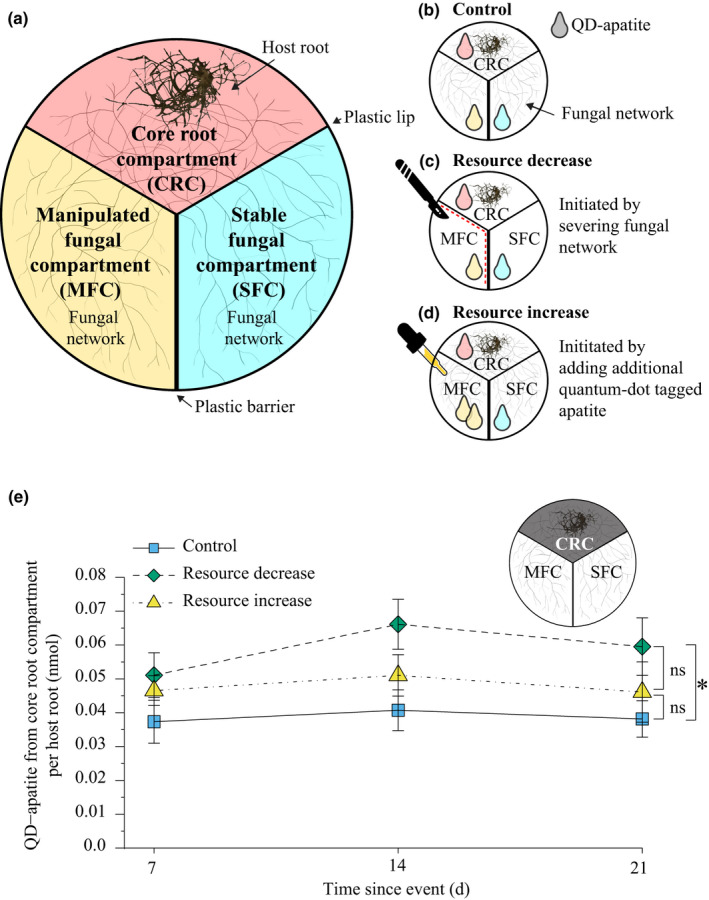
Experimental design and quantum‐dot (QD) apatite from core root compartment (CRC) per host root (Daucus carota). (a) Petri plates were divided into three compartments separated by a plastic lip (crossable by fungus) between the core root and the two fungal compartments (manipulated fungal compartment (MFC) and stable fungal compartment (SFC)) and a plastic barrier between the MFC and SFC (not crossable by fungus). The host root was grown in the CRC, which was filled with standard Modified Strullu–Romand (MSR) medium. The two fungal compartments, the MFC and the SFC, were filled with adjusted MSR medium with no added phosphorus (P). (b) In each treatment, P was supplied as QD‐apatite. Red QD‐apatite was added to the CRC, yellow QD‐apatite to the MFC, and cyan QD‐apatite to the SFC. (c) In the resource decrease treatment, the hyphae (Rhizophagus irregularis) were severed crossing the plastic lip into the MFC to restrict P from that compartment. (d) In the resource increase treatment, additional QD‐apatite was added to the MFC to double the P availability. (e) The amount of QD‐apatite from the CRC in the host roots was significantly influenced by treatment (two‐way ANOVA for treatment: F 2,132 = 6.955, P = 0.001; time: F 2,132 = 1.035, P = 0.358; interaction: F 4,132 = 0.248, P = 0.911). Higher amounts of QD‐apatite from the CRC were found in the resource decrease treatment (green diamonds), than in the control (blue squares) or resource increase treatment (yellow triangles). The amount of QD‐apatite was not significantly different between the control and resource increase treatment. n control,7 = 14, n control,14 = 14, n control,21 = 21, n decrease,7 = 16, n decrease,14 = 18, n decrease,21 = 13, n increase,7 = 16, n increase,14 = 17, n increase,21 = 14; mean ± SE. Significant differences between the treatments are indicated by an asterisk; ns, nonsignificant differences.
Our aim was to determine how the P transfer strategies of the fungus changed in response to sudden changes in resource availability. In biological market language, abrupt and extreme changes in resource availability are analogous to market ‘crashes’ and ‘booms’ because resource access to one partner is directly enhanced or diminished. In nature, this can happen for example when fungal networks experience regional changes in edaphic conditions (e.g. Stevens et al., 2020) such an influx of nutrients or when they are cut off from existing nutrient sources.
Specifically, it is unknown if the exchange rate (C : P ratio) will change when the fungus is exposed to a sudden change in resource availability. The fungus, for example, could modify when, from where or how much nutrients it transfers to the host. This has the potential to change the value, with the fungus mediating the C : P exchange rate. Therefore, we monitored the transfer of QD‐apatite from the fungus to the host under three different resource treatments. To mimic a market ‘crash’, we manually severed the fungal network growing in one of the compartments to abruptly restrict QD‐apatite access (Fig. 1c). Likewise, we mimicked an economic ‘boom’ through a sudden, one‐time phosphorus addition into a fungus‐only compartment. This extra P was available to the fungus only, not the host root (Fig. 1d). These treatments were compared with the control treatment in which resource access remained constant (Fig. 1b).
To be able to follow this dynamic over time, we sequentially harvested replicates over a 3‐wk period. In each replicate, we quantified when the QD‐apatite was transferred by the fungus, from which compartment (Fig. 1), and how much was transferred. Using fungal biomass as a proxy for host carbon allocation (Olsson, 2002; Hammer et al., 2011b; Fortuna et al., 2012; Engelmoer et al., 2014; Whiteside et al., 2019; van’t Padje et al., 2020), we then calculated how the exchange rate changed as conditions became more (or less) favourable for the fungus.
Ultimately, our aim was to determine whether a resource boom was associated with a less favourable exchange rate for the fungus. This would be expected if the host plant was paying less C per unit of P received (i.e. a decrease in C : P ratio). Alternatively, if the fungus was successful at mediating the exchange rate in its favour – potentially via retention rather than immediate trading of the resource – we should see no change or a more favourable exchange rate associated with the addition of a resource pulse. We therefore calculated how the fungal network gained biomass in relation to the amount of nutrients transferred from the manipulated and stable fungus‐only compartments.
Materials and methods
Experimental design
We used a three‐compartment in vitro root mycorrhizal system in which the host root was grown in the core root compartment colonised by a fungal network that extended across two separate fungus‐only compartments (Fig. 1a). Resource increases and decreases were initiated in a single ‘manipulated’ fungus‐only compartment, while the other half of the fungal network grew under control conditions in the ‘stable’ fungus‐only compartment (Fig. 1c,d). P was supplied to each of the three compartments as QD‐apatite in different colours: red QD‐apatite to the core root compartment, yellow QD‐apatite to the manipulated fungal compartment and cyan QD‐apatite to the stable fungal compartment (Fig. 1a). In all replicates, the fungus was physically connected across the compartments. However, two plastic lips and the higher plastic barrier between the two fungal compartments restricted any nonfungal network movement of added nutrients (Whiteside et al., 2019). This ensured that all movement of tagged P was restricted to fungal network transport.
Cultures and growing conditions
We grew in vitro Ri T‐DNA transformed carrot root (Daucus carota), inoculated with a single strain of arbuscular mycorrhizal fungus Rhizophagus irregularis (strain A5 Sanders Laboratory) in a three‐compartment 9‐cm Petri dish (Fig. 1a). Because only a single strain was used, this is considered ‘monopolistic competition’ (Hammerstein & Noë, 2016). We filled the core root compartment with Modified Strullu–Romand (MSR) medium (Fortin et al., 2002; Declerck et al., 2005; Kiers et al., 2011; Engelmoer et al., 2014), and the two fungus‐only compartments with a modified version of MSR medium that contained no additional P other than present in the solidifying agent (Phytagel, Sigma–Aldrich, St. Louis, MO, USA). For each treatment, we transferred 2 cm of a 3‐wk‐old branching root segment to the core root compartment. Directly after transfer, we inoculated the root by adding a 1 × 1 cm2 square of MRS medium with c. 400 spores and hyphae from a 3‐month‐old root organ culture (Engelmoer et al., 2014). Following colonisation of the host root, the fungal network, but not the roots, crossed over the plastic lips into the fungal compartments (Fig. 1a). We stored plates in the dark at 25°C, tilted at a 45° angle with the fungal compartments elevated, as an additional measure to prevent the roots from crossing to fungal compartments.
QD‐apatite
To quantify the movement of P from three separate compartments and into the host, we tagged hydroxyapatite, a natural occurring rock phosphate (Ness & Vlek, 2000; Pel et al., 2018), with fluorescent nanoparticles (Whiteside et al., 2019). Apatite is difficult for plant roots to dissolve directly, however arbuscular mycorrhizal fungi can help break down apatite (Reynolds et al., 2006; Pel et al., 2018). Past work has shown that arbuscular mycorrhizal fungi can increase the dissolution and uptake of apatite, even under sterile conditions when no other microbes are present (Reynolds et al., 2006; Pel et al., 2018; van’t Padje et al., 2020). We constructed three colours of QD‐apatite (cyan (490 nm), yellow (576 nm) and red (666 nm)) that were equal in size and mass. We synthesised the QD‐apatite solution by adding 150 mg l−1 of carboxyl CdSeS core nanocrystals (Crystalplex, Pittsburg, PA, USA) into 1 L 50% modified simulated body fluid (MSBF) : 50% simulated body fluid (SBF) solution (11.9919 g NaCl; 1.96577 g NaHCO3; 0.447 g KCl; 0.4574 g MgCl26H2O; 0.261 g K2HPO4; 0.4162 g CaCl2; 0.1062 g Na2SO4) (Tang et al., 2010; Kawashita et al., 2012; Whiteside et al., 2019). The carboxyl terminals of the QDs served as an anionic binding site to coat the QDs in apatite via the MSBF–SBF solution. To conjugate crystals, we performed a two‐phase reaction. In the first reaction, we exposed the solutions to 37°C for 24 h to conjugate the reagents to small crystals of c. 8 nm diameter. After this initial reaction, we placed the solutions at room temperature on a shaker for 60 h (100 oscillations per min). We then exposed the solutions to another 48 h to 37°C to initiate the second to conjugated bigger crystals of c. 200 nm, closely mimicking natural apatite (Sun et al., 2014). To remove unbound reagents, we washed the solutions twice by replacing 80% of the supernatant with Nanopure H2O, we shook the solutions by hand to re‐precipitate in between. We characterised the surface structure of the crystalised QD‐apatite using X‐ray photoelectron spectroscopy and determined that each nmol QD‐apatite contained c. 700 nmol of P (nmol P : QD = 708 : 1, Whiteside et al., 2019). We brought the solutions to a concentration of 1.39 mM P by diluting the solutions with Nanopure H2O. We autoclaved the solutions and stored them in the dark at 4°C. All technical controls (toxicity controls, colour controls, verification of fluorescing compounds in fungal and plant tissue, diffusion controls and unconjugated controls in which QDs lacked apatite and were not taken up) and method development are all described in detail in Whiteside et al. (2019).
At 5 wk after fungal inoculation, to each biological replicate (25 replicates per treatment per timepoint) we added three QD‐apatite solutions. In the stable fungal compartment, we added 0.33 ml cyan QD‐apatite. In the manipulated fungal compartment, we added 0.33 ml yellow QD‐apatite solution. In the root core compartment, we added 0.165 ml of the red QD‐apatite. At 1 wk after QD‐apatite addition, we initiated the resource increase and decrease treatments. For a resource increase, we doubled the amount of P available from that compartment by introducing an additional 0.33 ml yellow QD‐apatite solution to the manipulated fungal compartment. For a resource decrease, we physically severed and removed all hyphae in a 2‐mm strip of the MSR medium that was crossing the barrier between the manipulated compartment and the core root compartment and the hyphae were crossing the barriers to the manipulated compartment. The control plates experienced neither hyphal severing nor addition of extra QD‐apatite.
Harvest
We destructively harvested 20 plates from each treatment at days 7, 14 and 21 after QD addition or severing events, and discarded contaminated plates (control: 26 out of 75, increase: 27 out of 75, decrease: 28 out of 75). We removed roots from the core root compartment with tweezers and placed them in paper bags to be dried for 48 h at 50°C. We placed the MSR medium, containing the extraradical mycelia from each compartment in 50 ml centrifuge tubes (Greiner Bio‐One International GmbH, Kremsmünster, Austria) and stored them for at least 24 h at −80°C to stop all metabolic reactions. We recorded dry weight (DW) of the roots and collected subsamples of roots (c. 7 mg) for epifluorescence analysis and for DNA extraction (c. 20 mg). To extract the extraradical fungal biomass, we dissolved the MSR medium from each compartment by adding 25 ml 10 mM sodium citrate solution. We then incubated the tubes in a water bath for 2 h at 65°C. We vacuum filtered the dissolved MSR medium over a 47 mm cellulose nitrate Whatman membrane filter (0.45 µm). As previously described, we then carefully removed the membrane filter from the vacuum filter and placed it on aluminium foil. We then slid a metal spatula systematically along the membrane filter to collect all extraradical fungal hyphae (Engelmoer & Kiers, 2014). We freeze dried the extraradical mycelia for 24 h (Engelmoer et al., 2014). We pulverised both root and extraradical mycelia samples using glass beads and a bead beater for 40 s on the highest speed (Thermo Savant FastPrep Fp120 Cell homogeniser).
DNA isolation and real time qPCR
To determine extraradical fungal growth and intraradical fungal abundance, we isolated DNA from the roots and the extraradical mycelia using a DNeasy Plant Mini Kit (Qiagen, Hombrechtikon, Switzerland). We followed the manufacturer’s extraction protocol, with the exception that, after the lysis step, we added 10 µl of an internal standard, a plasmid of the cassava mosaic virus to control for DNA extraction efficiency (Whiteside et al., 2019). After DNA extraction, we quantified fungal abundance by measuring the copy numbers of the mtDNA SSU locus with TaqMan probe‐based qPCR using a CFX96 PRC detection system (Bio‐Rad, Hercules, CA, USA). We diluted root samples 100‐fold, and prepared all DNA samples for qPCR. We exported the resulting Cq values at a baseline threshold of 500 relative fluorescence units, and converted Cq values to copy numbers as described by Kiers et al. (2011). We then converted the mtDNA copy numbers to biomass (Voříšková et al., 2017) with a calibration curve described by Whiteside et al. (2019).
Fluorescence analysis
We next quantified QD‐apatite fluorescence in the roots (Whiteside et al., 2019). We prepared the ground roots by adding 150 µl 10 mM borate buffer per mg of root. From each root sample, we took five replicates of 150 µl and pipetted them in a 96‐well plate with a glass bottom (Eppendorf AG, Hamburg, Germany). To circumvent edge effects, we left the outermost wells empty. We measured the emission spectra using a standard 96‐well epifluorescence microplate reader (Syngery• Mx monochromator‐based multimode microplate reader; BioTek, Winooski, VT, USA). We measured the emission at 325 nm excitation, ranging from 450 to 800 nm, with interval steps of 2 nm.
We translated the emission spectra to QD‐apatite concentrations using emission finger printing. This technique allowed us to separate the emission curves from the three differently coloured QDs even if these curves were overlapping. We used a custom script in Matlab Code (MathWorks, Natick, MA, USA) to detect low levels of QDs (> 0.000 001 nmol quantum dot per mg of plant tissue). For specific details see Whiteside et al. (2019). We converted fluorescence intensities to specific QD‐apatite transfer rates using a calibration gradient of QD‐apatite for each colour, composing of seven concentrations: 13.1, 9.83, 7.37, 5.53, 4.15, 3.11 and 2.33 mM.
Statistical analysis
We performed all statistical analyses in R v.3.3.1. For each response variable, we checked the residuals for normality with a Shapiro–Wilk test. We checked the distribution of the residuals with QQ plots and analysed the homogeneity of variance across groups using Levene's test. We separately analysed root growth, the uptake of three colours of QD‐apatite in host roots, the extraradical fungal abundance, the logarithm of the intraradical fungal abundance and the total amount of QD‐apatite (sum of the three colours) with a linear model using treatment (resource increase, resource decrease or control), the time of harvest (ordered categorical variable), and the treatment × harvest interaction as explanatory variables.
Finally, we analysed resource exchange rate as the logarithm of C allocation to the fungus to P transfer to the root. We measured C allocation as the sum of fungal copy numbers in the two fungal compartments and P transfer as the sum of QDs from those compartments per host root. To analyse how the exchange rate changed over time, we analysed each treatment with a linear model with an explanatory ordered categorical variable the days after the event. To look for absolute differences between the two treatments, we tested the differences between the resource exchange rates at specific time points with a Wilcoxon rank sum test because the data were not normally distributed.
Results
Transfer of P across fungal network
We first determined total amount of QD‐apatite transfer to host roots from the fungal network exposed to the resource treatments. By quantifying and summing the fluorescence of all three colours, we found that total QD‐apatite transferred to the host roots increased over time, but with no significant difference across treatments (Supporting Information Fig. S1). This gradual increase over time is an indication that the QD‐apatite acts similarly to nontagged apatite transferred from mycorrhizal fungi (Pel et al., 2018). Specifically, the fungus transferred an average of 0.143 ± 0.006 nmol QD‐apatite per total root, or 0.002 ± 0.0001 nmol per mg of root over the 21 d after treatments were initiated. This amount was similar that found in previous studies with QD‐apatite (Whiteside et al., 2019; van’t Padje et al., 2020). Similarly, total root biomass was not significantly affected by nutrient treatments to fungal network (Fig. S2). However, roots became larger over time, independent of the ‘crash’ or ‘boom’ resource treatment. This further confirms that QD‐apatite acts similarly to other P resources, and that the host root continued to receive sufficient P to sustain its growth, regardless of the resource treatment to the fungal network (Fig. S1).
Because we labelled the three apatite pools with QDs fluorescing with different colours (Fig. 1a), we could determine from which compartment the QD‐apatite was transferred (Fig. S3). Here, we found a strong treatment effect: severing the fungal network in the resource decrease treatment was associated with a significantly greater QD‐apatite contribution from the core root compartment compared to the core treatment of the control treatment and resource increase treatment, but not different when comparing the control and the resource increase treatment (Fig. 1e). We also did not find evidence that exposing the fungal network to a pulse of QD‐apatite in the boom treatment increased QD transfer from that pool to the root (Fig. S3). Despite a doubling of resource availability to the fungus, we did not observe a significant increase in transfer to the host (Fig. S3).
Fungal growth patterns in response to pulses and restrictions of nutrients
We found a significant effect of treatment on the extraradical fungal biomass of the fungal network (sum of all compartments). Specifically, severing the fungal network stimulated hyphal growth at day 7, followed by a subsequent decrease and stabilisation of biomass at a lower level compared with other treatments (Fig. 2a). No such stimulation was found in overall biomass measurements of the fungal network exposed to the resource increase or control treatments (Fig. 2a).
Fig. 2.
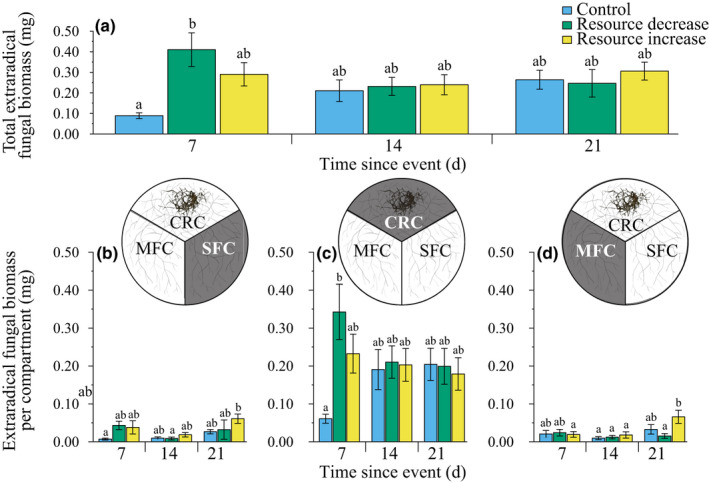
Extraradical fungal biomass (Rhizophagus irregularis) over time. (a) Total extraradical fungal biomass was significantly influenced by treatment and the interaction between treatment and time (two‐way ANOVA for treatment: F 2,132 = 3.091, P = 0.049; time: F 2,132 = 0.949, P = 0.390; interaction: F 4,132 = 2.898, P = 0.024). Total extraradical fungal biomass steadily increased over time in the control treatment (blue). In the resource decrease treatment (green) the total fungal biomass was highest 7 d after the event, then decreased. In the resource increase treatment (yellow) the fungal biomass did not change over time. (b) In the stable fungal compartment, fungal biomass was significantly influenced by treatment and time effect (two‐way ANOVA for treatment: F 2,132 = 3.655, P = 0.029; time: F 2,132 = 5.071, P = 0.008; interaction: F 4,132 = 1.076, P = 0.371). (c) In the core root compartment (CRC) the fungal biomass was a four‐fold higher than in the two fungal compartments. The fungal biomass in the CRC was significantly influenced by the interaction between treatment and time (two‐way ANOVA for treatment: F 2,132 = 2.606, P = 0.078, time: F 2,132 = 0.071, P = 0.931; interaction: F 4,132 = 2.770, P = 0.030). (d) In the manipulated fungal compartment, the fungal biomass was not significantly influenced treatment, only by time (two‐way ANOVA for treatment: F 2,132 = 2.119, P = 0.124; time: F 2,132 = 5.000, P = 0.008; interaction: F 4,132 = 2.064, P = 0.089). n control,7 = 14, n control,14 = 14, n control,21 = 21, n decrease,7 = 16, n decrease,14 = 18, n decrease,21 = 13, n increase,7 = 16, n increase,14 = 17, n increase,21 = 14. Mean ± SE. CRC, Core root compartment; MFC = manipulated fungal compartment; SFC, stable fungal compartment. Bars with the same letter do not have a significantly different mean extraradical fungal biomass based on post hoc test.
Because the fungal network was divided into sections exposed both directly (manipulated compartment) and indirectly (stable compartment) to the resource treatments, we could then compare how different parts of the same network grew in response to an influx and restriction of nutrients. First, we quantified the fungal network biomass in the stable compartment, where we found a significant treatment effect. Resource addition was characterised by a burst of extraradical hyphae growth, which was most pronounced 21 d after nutrient addition, whereas the resource decrease treatment showed erratic increases and decreases of biomass. In the control treatment, we documented a steady increase in fungal biomass over time, as expected (Fig. 2b). We did not find a treatment nor timing effect on the extraradical fungal biomass in the core root compartment (Fig. 2c), nor in the manipulated fungal compartment (Fig. 2d). The only significant trend in the manipulated fungal compartment was again a bust of extraradical fungal biomass 21 d after the nutrient addition (Fig. 2d).
A symbiotic fungus can change its trading strategy by expanding the size of its fungal network, or by increasing colonisation inside the root where the trading takes place. We therefore measured fungal abundance inside host roots (i.e. intraradical colonisation) via quantitative PCR (Kiers et al., 2011; Voříšková et al., 2017). We found that the intraradical fungal abundance was significantly influenced by treatment and time. Intraradical fungal abundance increased over time in all treatments, with the highest increase in the resource increase treatment 21 d after nutrient addition. In comparison, we found the lowest intraradical fungal abundance in the resource decrease treatment (Fig. 3a). This means that severing the mycelium in the resource decrease treatment was costly for the fungus, with 21% lower intraradical colonisation compared with the control treatment, and a 67% lower colonisation compared with the resource increase treatment.
Fig. 3.
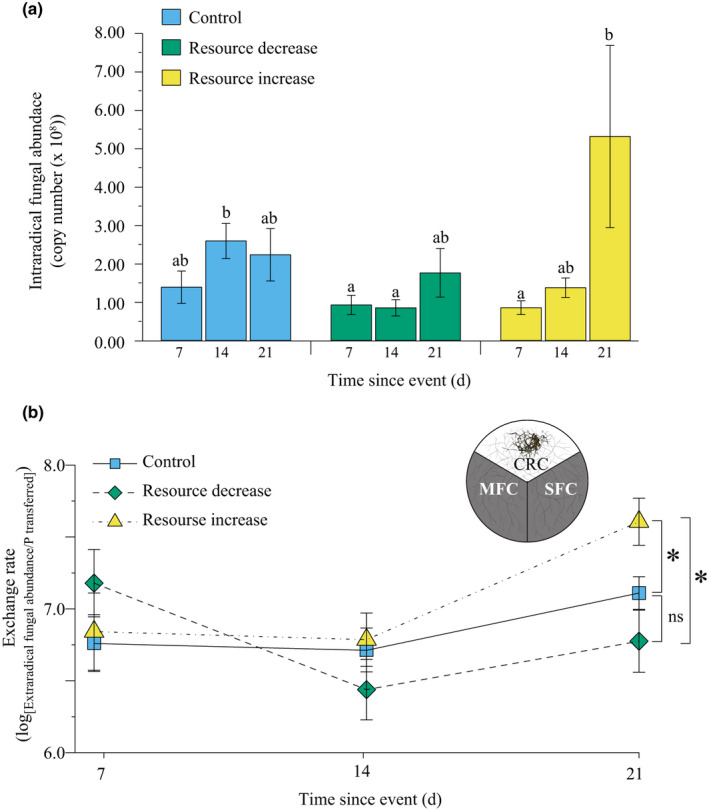
Intraradical fungal abundance (Rhizophagus irregularis) and exchange rate (extraradical fungal abundance/P transferred). (a) Intraradical fungal abundance was significantly influenced by treatment and time (two‐way ANOVA for treatment: F 2,130 = 4.953, P = 0.008; time: F 2,130 = 6.804, P = 0.002; interaction: F 4,130 = 1.408, P = 0.235). In the control treatment (blue) the fungal abundance steadily increased over time. The fungal abundance was lowest in the resource decrease treatment (green). In the resource increase treatment (yellow) the fungal abundance peaked 21 time after the event. n control,7 = 7, n control,14 = 14, n control,21 = 22, n decrease,7 = 14, n decrease,14 = 20, n decrease,21 = 13, n increase,7 = 19, n increase,14 = 16, n increase,21 = 14; means ± SE. Bars with the same letters do not have a significantly different mean, based on post hoc test. (b) We found a significant time effect on the exchange rate, defined as the amount of carbon (C) received by the fungus over the amount of phosphorus (P) transferred to the host root, expressed as the sum of the fungal abundance in the two fungal compartments over the sum of P transferred from the two fungal compartments, in the resource increase treatment (yellow triangles) (one‐way ANOVA: F 2,44 = 4.341, P = 0.019), but not in the other two treatments (one‐way ANOVA: control (blue squares): F 2,46 = 2.308, P = 0.111; resource decrease (green diamonds): F 2,42 = 2.953, P = 0.063). At day 21, we found a significantly higher exchange rate for the resource increase treatment compared with the control (Wilcoxon rank sum test P = 0.002) and the resource decrease treatment (Wilcoxon rank sum test P = 0.003), indicated by an asterisk. n control,7 = 14, n control,14 = 14, n control,21 = 21, n decrease,7 = 14, n decrease,14 = 18, n decrease,21 = 13, n increase,7 = 16, n increase,14 = 17, n increase,21 = 14, means ± SE. CRC, Core root compartment; MFC, manipulated fungal compartment; SFC, stable fungal compartment.
Changes in exchange rate
We found that the exchange rate was significantly different among harvest dates in fungal networks exposed to resource increase in the boom treatment, with an increase in C : P ratio over time (Fig. 3b). By the termination of the experiment (day 21), the fungal networks exposed to a resource increase had a significantly higher exchange rate as measured by total fungal biomass per unit of P transferred across the two fungal compartments, compared with the control and the resource decrease treatments. By contrast, there was no increase or decrease in exchange rate in the control or resource decrease treatment (Fig. 3b).
Discussion
In the resource decrease treatment, we effectively reduced access of the fungal network to P by c. 40%. The fungus responded in two ways. First, severing the fungal network appeared to stimulate fungal growth, especially at day 7. This growth response mirrors mechanisms of regrowth documented in plants after being pruned (Prusinkiewicz et al., 2009), and growth in fungal gardens after pruning by leaf cutter ants (Bass & Cherrett, 1994, 1996), suggesting a process by which the fungus reallocated reserves from other parts of the fungal network. This was supported by evidence of intraradical colonisation, which was lower in the severing treatment, especially at day 14, possibly as a result of resources being reallocated to growing tips (Fig. 3a). Such flexibility in biomass allocation is an important adaptation in fungal networks because extending hyphae are vulnerable to disturbances, consumption by animals or other physical damage (Moore et al., 1985; Jasper et al., 1989; Klironomos & Kendrick, 1996). Second, we found that the fungus responded to resource restriction by accessing an alternative P pool closer to the host root, changing where across the fungal network QD‐apatite was transferred. This resulted in more resource transfer from the core root compartment (Fig. 1e). This is the first evidence to suggest a compensation mechanism by the fungus, whereby when one source of QD‐apatite was lost, transfer is augmented from another source across the fungal network. In this case, the augmented source was closer to the root, where the fungal network is likely to be more dense, compared with further away from the root (Thonar et al., 2011). This also suggested that the fungal network is able to cope with major changes in external resource environment, including both the physical severing of the fungal network and doubling of the available QD‐apatite, and still maintain a steady supply of nutrients to hosts.
An alternative explanation for the increase in resources from the core root compartment (Fig. 1e) is that the host root – which also has direct access to the QD‐apatite in the core root compartment – increased its own uptake when the extended fungal network failed to deliver sufficient P. While we could not rule out this possibility, this was unlikely. First, we utilised apatite, a form of rock P that is difficult for plant roots to obtain directly, but that arbuscular mycorrhizal fungi can help break down (Reynolds et al., 2006; Pel et al., 2018). Our aim was to use a form of phosphorus that was difficult for the host to take up directly (Reynolds et al., 2006; Pel et al., 2018), essentially increasing the ‘bargaining’ position of the fungi (Noë & Kiers, 2018). Past work on split‐root systems has shown that root systems colonised with arbuscular mycorrhizal fungi are better able to take up of apatite compared with noncolonised roots (Whiteside et al., 2019). Once inside the root, the QD‐apatite is transported to the growing leaves, suggesting that QD‐tagged nutrients are transported in a similar manner to other P sources (Whiteside et al., 2009). While the exact apatite uptake mechanism for arbuscular mycorrhizal fungi is still unknown, fungi generally use endocytic pathways to take up large particles, with invaginating cells reaching diameters of 100 nm (Fischer‐Parton et al., 2000; Read & Kalkman, 2003; Epp et al., 2013; Lu et al., 2016). The ability of the fungus to take up apatite was supported with bright‐field imaging videos of nutrient flows that showed vacuoles inside hyphae when the fungus was given access to QD‐tagged apatite and the absence of large vacuoles when QD‐tagged apatite is absent (van’t Padje et al., 2020). Second, while no studies directly investigated whether R. irregularis can repress the ‘direct uptake’ pathway of P by D. carota roots, the fungus R. irregularis can repress direct P uptake in roots of Medicago truncatula (Watts‐Williams et al., 2015) and there is evidence that colonisation by arbuscular mycorrhizal fungi can suppress the direct P uptake in several other roots (Smith et al., 2004; Javot et al., 2007; Grønlund et al., 2013; Watts‐Williams et al., 2015), such that highly colonised mycorrhizal roots are unlikely to rely solely on the direct uptake pathway. We confirmed this increased host reliance on the fungus in the core compartment by measurement of intraradical colonisation that, although low compared with other treatments, increased rather than decreased over time in the resource decrease treatment (Fig. 3a). Third, past work has shown that plant hosts can control of levels of intraradical colonisation depending on levels of available nutrients. For example, plant roots suppress the formation of intraradical fungal structures if nutrient levels are high (Vierheilig et al., 2000; Catford et al., 2003; Gu et al., 2011; Foo et al., 2014), and can actively regulate the amount of C located to arbuscular mycorrhizal fungi (Konvalinková et al., 2017). If the host was responsible for all the QD‐apatite uptake (vs QD‐apatite transfer from the fungal network), this would have been associated with less, rather than more, reliance on the fungus and a decrease in intraradical colonisation over time.
We next studied resource increase by exposing part of the fungal network to a pulse of QD‐apatite. Rather than an influx of QD‐apatite driving a decrease in the exchange rate (less C received per unit of P), we found that the fungus benefited from the resource pulse (Fig. 3b). These data suggested that the fungus was able to capitalise on the nutrient addition, perhaps by controlling the transfer of the phosphorus to the host over time (Fig. 3b). Under this scenario, the fungus would store the surplus nutrient – rather than immediately trading it – until plant demand, and thus value to the root, increased. This hypothesis was supported by several lines of evidence. First, despite doubling the amount of QD‐apatite to the fungal network, we did not observe any statistically significant increase in overall amount of QD‐apatite transferred to the host root in the boom treatment (Figs S1, S3). This is likely to be a reflection of the fungus retaining the QD‐apatite in the fungal network over the time frame of our experiment. It has been hypothesised that such retention, as documented in other studies, is an effective strategy by which nutrients are stored until they become scarce again, allowing the fungus to potentially gain a better exchange rate over time (Hammer et al., 2011b; Kiers et al., 2011; Whiteside et al., 2019; van’t Padje et al., 2020). Second, we found an increase in total fungal abundance over time in both the stable and manipulated fungal compartments in the resource increase treatment (Fig. 2b,d). Such an increase in biomass increase is not expected if the nutrients from the P pulse remained immobilised, for example in the medium. This biomass increase was not found in the resource decrease or control treatments. This suggested that fungal networks exposed to the resource boom were gaining a C benefit that is realised over time, rather than a benefit realised immediately. This suggestion is supported by data on intraradical colonisation (Fig. 3a), in which the roots given the resource increase treatment showed the highest densities of intraradical fungal abundance compared with the other treatments, but only at the 21 d harvest. Higher densities of intraradical colonisation are necessary for higher exchange of P to C resources, and indicative of fungal growth and benefit (Grace et al., 2009; Campos et al., 2018). Lastly, if the nutrients were stored until their value increased, we should also be able to see if this was reflected in a changing exchange rate over time. We found that when exposed to a resource increase, the exchange rate increased over time, with a higher C : P ratio received for the fungus, a trend not found in the other treatments (Fig. 3b). At the 21 d harvest, the fungus exposed to the resource increase treatment had gained significantly more biomass per unit QD‐apatite compared with the control and resource decrease treatment samples. Given that this trend was only evident 21 d after the QD‐apatite pulse, it highlights the importance of studying exchange rates over multiple harvests, rather than at only one time point.
While these data are in line with the idea that the fungus should ultimately benefit from an addition of nutrients accessible only to the fungus, there is an open question of how to accurately measure host allocation to the fungal network. Because arbuscular mycorrhizal fungi are obligate biotrophs, all C gained by the fungus to form and maintain fungal networks is derived from the host (Jiang et al., 2017; Luginbuehl et al., 2017). We used biomass as a proxy for host allocation (Olsson, 2002; Hammer et al., 2011b; Fortuna et al., 2012; Engelmoer et al., 2014; Whiteside et al., 2019; van’t Padje et al., 2020). This approach did not take into account potential metabolic differences in the fungi among treatments. However, loss of carbon via respiration in arbuscular fungal networks is orders of magnitude lower than the accumulation of C biomass in the network. This has been estimated at c. 0.2 μg C g−1 d−1 (Heinemeyer et al., 2006). It is hypothesised that arbuscular mycorrhizal fungi have low carbon loss because their fine hyphal networks have relatively high carbon use efficiency (CUE), also reflective of high accumulation of lipids in their mycelia (Konvalinková et al., 2017). Ideally, C allocation should be calculated based on a similar method of tagging C with QDs, as we have done for P. This would also allow us to visually confirm where and when the host transferred C to the fungal network. However, it is also unknown if QD‐tagged hexose could ever serve as a relevant C allocation measurement. Tagging C with QDs remains methodologically challenging, and the product may be toxic (Rispail et al., 2014).
An important next step is to scale up our findings to whole plants. While root organ cultures are an established model system for metabolism and transport processes in the arbuscular mycorrhizal symbiosis (Bago et al., 2000; Fortin et al., 2002; Olsson, 2002; Declerck et al., 2005), we do not know how the lack of a direct shoot sink for P influences our results. Past work has demonstrated that root organ cultures possess similar nutrient and resource transfer and metabolic characteristics as whole‐plant systems (Olsson, 2002; Bago et al., 2003; Pfeffer et al., 2004; Govindarajulu et al., 2005; Olsson & Johnson, 2005; Olsson et al., 2005; Bücking & Shachar‐Hill, 2005; Tian et al., 2010; Hammer et al., 2011a), but these dynamics need to be tested more extensively with QD‐apatite in whole plants. We have shown previously that QD‐apatite can be taken up by whole Medicago truncatula plants and translocated and retained in the leaves and shoots, as expected under natural conditions (Whiteside et al., 2019). We have also confirmed that inoculation with arbuscular mycorrhizal fungi facilitated the uptake of QD‐apatite in plants compared with nonmycorrhizal controls. However, additional tests are now needed in which exchange rates of fungal networks are monitored in whole plants, with natural source‐sink dynamics, over time. One idea is to further develop an in vitro autotrophic whole‐plant systems in which the mycorrhizal root and mycelium develop in a 2D agar system (Voets et al., 2005). This would allow the high precision monitoring and quantification of nutrient transfer needed to test biological market theory, combined with more natural source‐sink dynamics (Gyuricza et al., 2010).
More generally, an open question is how these nutrient transfer dynamics change when more additional partners are introduced into the system. Using the QD‐tagging approach of three colours, we were able to document how trading strategies of a single laboratory‐cultured fungus in monopolistic competition varied spatially under resource perturbations. However, competition is another key aspect driving trade dynamics (Jones et al., 2012; Chamberlain et al., 2014). Under our experimental conditions, the fungal network had a monopoly on P resources: there was no competition from other fungi. As a result, there were no forces preventing the fungus from retaining, and thus driving up, the value of the QD‐apatite resource (Fig. 3b). In scaling up to more complex communities with multiple traders (e.g. Lekberg & Waller, 2016), there is the potential for underbidding by competitors that is predicted to drive down the price of P (Wyatt et al., 2014; Noë & Kiers, 2018). Our results suggested that fungal networks may act as a buffer for plants against extreme changes in resource environment. However, when harnessing root microbiomes for use in sustainable agriculture, multiple competing fungal partners will be present (Toju et al., 2018). While we have shown that the host received a consistent P supply – regardless of external nutrient perturbations to the fungal network – future work is needed to manipulate fungal diversity, and thus competitive dynamics, to determine where and how fungal trade strategies change across the network in the presence of other traders.
Author contributions
AP designed and ran experiments. She performed statistical analyses, generated figures and led manuscript writing. GDAW was involved in the experimental design, statistical design and writing. ETK was involved in the experimental design, and manuscript writing.
Supporting information
Fig. S1 Total QD‐apatite per host root per treatment over time.
Fig. S2 Dry root biomass treatment over time.
Fig. S3 QD‐apatite per host root per treatment per compartment.
Please note: Wiley Blackwell are not responsible for the content or functionality of any Supporting Information supplied by the authors. Any queries (other than missing material) should be directed to the New Phytologist Central Office.
Acknowledgements
We thank Ronald Noë, Jacintha Ellers, Stuart West, James Weedon, Marc‐André Selosse, and the three anonymous reviewers for their feedback on the manuscript, Matthew Whiteside for methodological developments, and Simon Dupin and the Department of Ecological Science for technical support. This research was supported by European Research Council ERC 335542 (ETK), and the Ammodo Foundation (ETK). GDAW was supported by a Royal Society Newton International Fellowship and a Junior Research Fellowship (Balliol College). The authors declare no competing interests.
Data availability
Upon publication, all scripts, analyses and data, will be available from: https://github.com/anoukvantpadje/Market_crash.
References
- Argüello A, O’Brien MJ, van der Heijden MGA, Wiemken A, Schmid B, Niklaus PA. 2016. Options of partners improve carbon for phosphorus trade in the arbuscular mycorrhizal mutualism. Ecology Letters 19: 648–656. [DOI] [PubMed] [Google Scholar]
- Bago B, Pfeffer PE, Abubaker J, Jun J, Allen JW, Brouillette J, Douds DD, Lammers PJ, Shachar‐Hill YY. 2003. Carbon export from Arbuscular Mycorrhizal roots involves the translocation of carbohydrate as well as lipid. Plant Physiology 131: 1496–1507. [DOI] [PMC free article] [PubMed] [Google Scholar]
- Bago B, Pfeffer PE, Shachar‐Hill Y. 2000. Carbon metabolism andtransport in Arbuscular Mycorrhizas. Plant Physiology 124: 949–958. [DOI] [PMC free article] [PubMed] [Google Scholar]
- Bailey RE, Nie S. 2003. Alloyed semiconductor Quantum Dots: Tuning the optical properties without changing the particle size. Journal of the American Chemical Society 125: 7100–7106. [DOI] [PubMed] [Google Scholar]
- Bass M, Cherrett JM. 1994. The role of leaf‐cutting ant workers (Hymenoptera: Formicidae) in fungus garden maintenance. Ecological Entomology 19: 215–220. [Google Scholar]
- Bass M, Cherrett JM. 1996. Leaf‐cutting ants (Formicidae, Attini) prune their fungus to increase and direct its productivity. Functional Ecology 10: 55–61. [Google Scholar]
- Bidartondo MI. 2005. The evolutionary ecology of myco‐heterotrophy. New Phytologist 167: 335–352. [DOI] [PubMed] [Google Scholar]
- Bücking H, Shachar‐Hill Y. 2005. Phosphate uptake, transport and transfer by the arbuscular mycorrhizal fungus Glomus intraradices is stimulated by increased carbohydrate availability. New Phytologist 165: 899–912. [DOI] [PubMed] [Google Scholar]
- Campos P, Borie F, Cornejo P, López‐Ráez JA, López‐García Á, Seguel A. 2018. Phosphorus acquisition efficiency related to root traits: is mycorrhizal symbiosis a key factor to wheat and barley cropping? Frontiers in Plant Science 9: 1–21. [DOI] [PMC free article] [PubMed] [Google Scholar]
- Catford JG, Staehelin C, Lerat S, Piché Y, Vierheilig H. 2003. Suppression of arbuscular mycorrhizal colonization and nodulation in split‐root systems of alfalfa after pre‐inoculation and treatment with Nod factors. Journal of Experimental Botany 54: 1481–1487. [DOI] [PubMed] [Google Scholar]
- Chamberlain SA, Bronstein JL, Rudgers JA. 2014. How context dependent are species interactions? Ecology Letters 17: 881–890. [DOI] [PubMed] [Google Scholar]
- Charters MD, Sait SM, Field KJ. 2020. Aphid herbivory drives asymmetry in carbon for nutrient exchange between plants and an arbuscular mycorrhizal fungus. Current Biology 30: 1801–1808.e5. [DOI] [PMC free article] [PubMed] [Google Scholar]
- Courty PE, Walder F, Boller T, Ineichen K, Wiemken A, Rousteau A, Selosse MA. 2011. Carbon and nitrogen metabolism in mycorrhizal networks and mycoheterotrophic plants of tropical forests: a stable isotope analysis. Plant Physiology 156: 952–961. [DOI] [PMC free article] [PubMed] [Google Scholar]
- Declerck S, Fortin JA, Strullu DG, eds. 2005. In vitro culture of mycorrhizas. Berlin/Heidelberg, Germany: Springer. [Google Scholar]
- Douds DD, Johnson CR, Koch KE. 1988. Carbon cost of the fungal symbiont relative to net leaf p accumulation in a split‐root VA mycorrhizal symbiosis. Plant Physiology 86: 491–496. [DOI] [PMC free article] [PubMed] [Google Scholar]
- Engelmoer DJP, Behm JE, Kiers ET. 2014. Intense competition between arbuscular mycorrhizal mutualists in an in vitro root microbiome negatively affects total fungal abundance. Molecular Ecology 23: 1584–1593. [DOI] [PubMed] [Google Scholar]
- Engelmoer DJP, Kiers ET. 2014. Host diversity affects the abundance of the extraradical arbuscular mycorrhizal network. New Phytologist 205: 1485–1491. [DOI] [PubMed] [Google Scholar]
- Epp E, Nazarova E, Regan H, Douglas LM, Konopka JB, Vogel J, Whiteway M. 2013. Clathrin‐ and arp2/3‐independent endocytosis in the fungal pathogen Candida albicans . mBio 4: e00476‐13. [DOI] [PMC free article] [PubMed] [Google Scholar]
- Fellbaum CR, Gachomo EW, Beesetty Y, Choudhari S, Strahan GD, Pfeffer PE, Kiers ET, Bucking H. 2012. Carbon availability triggers fungal nitrogen uptake and transport in arbuscular mycorrhizal symbiosis. Proceedings of the National Academy of Sciences, USA 109: 2666–2671. [DOI] [PMC free article] [PubMed] [Google Scholar]
- Fellbaum CR, Mensah JA, Cloos AJ, Strahan GE, Pfeffer PE, Kiers ET, Bücking H. 2014. Fungal nutrient allocation in common mycorrhizal networks is regulated by the carbon source strength of individual host plants. New Phytologist 203: 646–656. [DOI] [PubMed] [Google Scholar]
- Field KJ, Bidartondo MI, Rimington WR, Hoysted GA, Beerling DJ, Cameron DD, Duckett JG, Leake JR, Pressel S. 2019. Functional complementarity of ancient plant–fungal mutualisms: contrasting nitrogen, phosphorus and carbon exchanges between Mucoromycotina and Glomeromycotina fungal symbionts of liverworts. New Phytologist 223: 908–921. [DOI] [PubMed] [Google Scholar]
- Field KJ, Pressel S. 2018. Unity in diversity: structural and functional insights into the ancient partnerships between plants and fungi. New Phytologist 220: 996–1011. [DOI] [PubMed] [Google Scholar]
- Field KJ, Pressel S, Duckett JG, Rimington WR, Bidartondo MI. 2015. Symbiotic options for the conquest of land. Trends in Ecology & Evolution 30: 477–486. [DOI] [PubMed] [Google Scholar]
- Fischer‐Parton S, Parton RM, Hickey PC, Dijksterhuis J, Atkinson HA, Read ND. 2000. Confocal microscopy of FM4‐64 as a tool for analysing endocytosis and vesicle trafficking in living fungal hyphae. Journal of Microscopy 198: 246–259. [DOI] [PubMed] [Google Scholar]
- Foo E, Ferguson BJ, Reid JB. 2014. Common and divergent roles of plant hormones in nodulation and arbuscular mycorrhizal symbioses. Plant Signaling and Behavior 9: 1–4. [DOI] [PMC free article] [PubMed] [Google Scholar]
- Fortin JA, Bécard G, Declerck S, Dalpé Y, St‐Arnaud M, Coughlan AP, Piché Y. 2002. Arbuscular mycorrhiza on root‐organ cultures. Canadian Journal of Botany 80: 1–20. [Google Scholar]
- Fortuna P, Avio L, Morini S, Giovannetti M. 2012. Fungal biomass production in response to elevated atmospheric CO2 in a Glomus mosseae‐Prunus cerasifera model system. Mycological Progress 11: 17–26. [Google Scholar]
- Gomes SIF, van Bodegom PM, Merckx VSFT, Soudzilovskaia NA. 2019. Environmental drivers for cheaters of arbuscular mycorrhizal symbiosis in tropical rainforests. New Phytologist 223: 1575–1583. [DOI] [PMC free article] [PubMed] [Google Scholar]
- Govindarajulu M, Pfeffer PE, Jin H, Abubaker J, Douds DD, Allen JW, Bücking H, Lammers PJ, Shachar‐Hill Y. 2005. Nitrogen transfer in the arbuscular mycorrhizal symbiosis. Nature 435: 819–823. [DOI] [PubMed] [Google Scholar]
- Grace EJ, Cotsaftis O, Tester M, Smith FA, Smith SE. 2009. Arbuscular mycorrhizal inhibition of growth in barley cannot be attributed to extent of colonization, fungal phosphorus uptake or effects on expression of plant phosphate transporter genes. New Phytologist 181: 938–949. [DOI] [PubMed] [Google Scholar]
- Grman E. 2012. Plant species differ in their ability to reduce allocation to non‐beneficial arbuscular mycorrhizal fungi. Ecology 93: 711–718. [DOI] [PubMed] [Google Scholar]
- Grønlund M, Albrechtsen M, Johansen IE, Hammer EC, Nielsen TH, Jakobsen I. 2013. The interplay between P uptake pathways in mycorrhizal peas: A combined physiological and gene‐silencing approach. Physiologia Plantarum 149: 234–248. [DOI] [PubMed] [Google Scholar]
- Gu M, Chen A, Dai X, Liu W, Xu G. 2011. How does phosphate status influence the development of the arbuscular mycorrhizal symbiosis? Plant Signaling and Behavior 6: 1300–1304. [DOI] [PMC free article] [PubMed] [Google Scholar]
- Gyuricza V, Thiry Y, Wannijn J, Declerck S, Dupré de Boulois H. 2010. Radiocesium transfer between Medicago truncatula plants via a common mycorrhizal network. Environmental Microbiology 12: 2180–2189. [DOI] [PubMed] [Google Scholar]
- Hammer EC, Nasr H, Pallon J, Olsson PA, Wallander H. 2011a. Elemental composition of arbuscular mycorrhizal fungi at high salinity. Mycorrhiza 21: 117–129. [DOI] [PubMed] [Google Scholar]
- Hammer EC, Pallon J, Wallander H, Olsson PA. 2011b. Tit for tat? A mycorrhizal fungus accumulates phosphorus under low plant carbon availability. FEMS Microbiology Ecology 76: 236–244. [DOI] [PubMed] [Google Scholar]
- Hammerstein P, Noë R. 2016. Biological trade and markets. Philosophical Transactions of the Royal Society B: Biological Sciences 371: 20150101. [DOI] [PMC free article] [PubMed] [Google Scholar]
- Hart MM, Forsythe J, Oshowski B, Bücking H, Jansa J, Kiers ET. 2013. Hiding in a crowd ‐ Does diversity facilitate persistence of a low‐quality fungal partner in the mycorrhizal symbiosis? Symbiosis 59: 47–56. [Google Scholar]
- Heinemeyer A, Ineson P, Ostle N, Fitter AH. 2006. Respiration of the external mycelium in the arbuscular mycorrhizal symbiosis shows strong dependence on recent photosynthates and acclimation to temperature. New Phytologist 171: 159–170. [DOI] [PubMed] [Google Scholar]
- Hoysted GA, Kowal J, Jacob A, Rimington WR, Duckett JG, Pressel S, Orchard S, Ryan MH, Field KJ, Bidartondo MI. 2018. A mycorrhizal revolution. Current Opinion in Plant Biology 44: 1–6. [DOI] [PubMed] [Google Scholar]
- Jakobsen I, Rosendahl L. 1990. Carbon flow into soil and external hyphae from roots of mycorrhizal cucumber plants. New Phytologist 115: 77–83. [Google Scholar]
- Jang E, Jun S, Pu L. 2003. High quality CdSeS nanocrystals synthesized by facile single injection process and their electroluminescence. Chemical Communications 24: 2964–2965. [DOI] [PubMed] [Google Scholar]
- Jasper DA, Abbott LK, Robson AD. 1989. Soil disturbance reduces the infectivity of external hyphae of vesicular—arbuscular mycorrhizal fungi. New Phytologist 112: 93–99. [Google Scholar]
- Javot H, Pumplin N, Harrison MJ. 2007. Phosphate in the arbuscular mycorrhizal symbiosis: Transport properties and regulatory roles. Plant, Cell & Environment 30: 310–322. [DOI] [PubMed] [Google Scholar]
- Ji B, Bever JD. 2016. Plant preferential allocation and fungal reward decline with soil phosphorus: Implications for mycorrhizal mutualism. Ecosphere 7: 1–11. [Google Scholar]
- Jiang Y, Wang W, Xie Q, Liu N, Liu L, Wang D, Zhang X, Yang C, Chen X, Tang D et al 2017. Plants transfer lipids to sustain colonization by mutualistic mycorrhizal and parasitic fungi. Science 356: 1172–1173. [DOI] [PubMed] [Google Scholar]
- Johnson NC, Gehring CA, Jansa J. 2016. Mycorrhizal mediation of soil: fertility, structure, and carbon storage. Amsterdam, the Netherlands: Elsevier Inc. [Google Scholar]
- Johnson NC, Wilson GWT, Wilson JA, Miller RM, Bowker MA. 2015. Mycorrhizal phenotypes and the law of the minimum. New Phytologist 205: 1473–1484. [DOI] [PubMed] [Google Scholar]
- Jones EI, Bronstein JL, Ferrière R. 2012. The fundamental role of competition in the ecology and evolution of mutualisms. Annals of the New York Academy of Sciences 1256: 66–88. [DOI] [PubMed] [Google Scholar]
- Kawashita M, Taninai K, Li Z, Ishikawa K, Yoshida Y. 2012. Preparation of low‐crystalline apatite nanoparticles and their coating onto quartz substrates. Journal of Materials Science: Materials in Medicine 23: 1355–1362. [DOI] [PubMed] [Google Scholar]
- Kiers ET, Duhamel M, Beesetty Y, Mensah JA, Franken O, Verbruggen E, Fellbaum CR, Kowalchuk GA, Hart MM, Bago A et al 2011. Reciprocal rewards stabilize cooperation in the mycorrhizal symbiosis. Science 333: 880–882. [DOI] [PubMed] [Google Scholar]
- Kiers ET, West SA, Wyatt GAK, Gardner A, Bücking H, Werner GDA. 2016. Misconceptions on the application of biological market theory to the mycorrhizal symbiosis. Nature Plants 2: 16063. [DOI] [PubMed] [Google Scholar]
- Klironomos JN, Kendrick WB. 1996. Palatability of microfungi to soil arthropods in relation to the functioning of arbuscular mycorrhizae. Biology and Fertility of Soils 21: 43–52. [Google Scholar]
- Konvalinková T, Püschel D, Janoušková M, Gryndler M, Jansa J. 2015. Duration and intensity of shade differentially affects mycorrhizal growth‐ and phosphorus uptake responses of Medicago truncatula . Frontiers in Plant Science 6: 1–11. [DOI] [PMC free article] [PubMed] [Google Scholar]
- Konvalinková T, Püschel D, Řezáčová V, Gryndlerová H, Jansa J. 2017. Carbon flow from plant to arbuscular mycorrhizal fungi is reduced under phosphorus fertilization. Plant and Soil 2017: 1–15. [Google Scholar]
- Lekberg Y, Hammer EC, Olsson PA. 2010. Plants as resource islands and storage units – adopting the mycocentric view of arbuscular mycorrhizal networks. FEMS Microbiology Ecology 74: 336–345. [DOI] [PubMed] [Google Scholar]
- Lekberg Y, Waller LP. 2016. What drives differences in arbuscular mycorrhizal fungal communities among plant species? Fungal Ecology 24: 135–138. [Google Scholar]
- Lu R, Drubin DG, Sun Y. 2016. Clathrin‐mediated endocytosis in budding yeast at a glance. Journal of Cell Science 129: 1531–1536. [DOI] [PMC free article] [PubMed] [Google Scholar]
- Luginbuehl LH, Menard GN, Kurup S, Van Erp H, Radhakrishnan GV, Breakspear A, Oldroyd GED, Eastmond PJ. 2017. Fatty acids in arbuscular mycorrhizal fungi are synthesized by the host plant. Science 356: 1175–1178. [DOI] [PubMed] [Google Scholar]
- Luginbuehl LH, Oldroyd GED. 2017. Understanding the Arbuscule at the heart of endomycorrhizal symbioses in plants. Current Biology 27: R952–R963. [DOI] [PubMed] [Google Scholar]
- Montesinos‐Navarro A, Segarra‐Moragues J, Valiente‐Banuet A, Verdú M. 2012. The network structure of plant – arbuscular mycorrhizal fungi. New Phytologist 194: 536–547. [DOI] [PubMed] [Google Scholar]
- Moore JC, St John TV, Coleman DC. 1985. Ingestion of vesicular–arbuscular mycorrhizal Hyphae and spores by soil microarthropods. Ecology 66: 1979–1981. [Google Scholar]
- Ness RLL, Vlek PLG. 2000. Mechanism of calcium and phosphate release from hydroxy‐apatite by mycorrhizal hyphae. Soil Science Society of America Journal 64: 949–955. [Google Scholar]
- Noë R, Hammerstein P. 1994. Biological markets: supply and demand determine the effect of partner choice in cooperation, mutualism and mating. Behavioral Ecology and Sociobiology 35: 1–11. [Google Scholar]
- Noë R, Hammerstein P. 1995. Biological markets. Trends in Ecology & Evolution 10: 336–339. [DOI] [PubMed] [Google Scholar]
- Noë R, Kiers ET. 2018. Mycorrhizal Markets, firms, and co‐ops. Trends in Ecology & Evolution 33: 777–789. [DOI] [PubMed] [Google Scholar]
- Olsson PA. 2002. Phosphorus effects on metabolic processes in monoxenic Arbuscular Mycorrhiza cultures. Plant Physiology 130: 1162–1171. [DOI] [PMC free article] [PubMed] [Google Scholar]
- Olsson PA, Burleigh SH, Van Aarle IM. 2005. The influence of external nitrogen on carbon allocation to Glomus intraradices in monoxenic arbuscular mycorrhiza. New Phytologist 168: 677–686. [DOI] [PubMed] [Google Scholar]
- Olsson PA, Johnson NC. 2005. Tracking carbon from the atmosphere to the rhizosphere. Ecology Letters 8: 1264–1270. [Google Scholar]
- Olsson PA, Rahm J, Aliasgharzad N. 2010. Carbon dynamics in mycorrhizal symbioses is linked to carbon costs and phosphorus benefits. FEMS Microbiology Ecology 72: 125–131. [DOI] [PubMed] [Google Scholar]
- van't Padje A, Oyarte Galvez L, Klein M, Hink MA, Postma M, Shimizu T, Kiers ET. 2020. Temporal tracking of quantum‐dot apatite across in vitro mycorrhizal networks shows how host demand can influence fungal nutrient transfer strategies. The ISME Journal. doi: 10.1038/s41396-020-00786-w. [DOI] [PMC free article] [PubMed] [Google Scholar]
- Pel R, Dupin S, Schat H, Ellers J, Kiers ET, van Straalen NM. 2018. Growth benefits provided by different arbuscular mycorrhizal fungi to Plantago lanceolata depend on the form of available phosphorus. European Journal of Soil Biology 88: 89–96. [Google Scholar]
- Perez‐Lamarque B, Selosse M, Öpik M, Morlon H, Martos F. 2020. Cheating in arbuscular mycorrhizal mutualism: a network and phylogenetic analysis of mycoheterotrophy. New Phytologist 226: 1822–1835. [DOI] [PubMed] [Google Scholar]
- Pfeffer PE, Douds DD, Bücking H, Schwartz DP, Shachar‐Hill Y. 2004. The fungus does not transfer carbon to or between roots in an arbuscular mycorrhizal symbiosis. New Phytologist 163: 617–627. [DOI] [PubMed] [Google Scholar]
- Prusinkiewicz P, Crawford S, Smith RS, Ljung K, Bennett T, Ongaro V, Leyser O. 2009. Control of bud activation by an auxin transport switch. Proceedings of the National Academy of Sciences, USA 106: 17431–17436. [DOI] [PMC free article] [PubMed] [Google Scholar]
- Read ND, Kalkman ER. 2003. Does endocytosis occur in fungal hyphae? Fungal Genetics and Biology 39: 199–203. [DOI] [PubMed] [Google Scholar]
- Redecker D, Kodner R, Graham LE. 2000. Glomalean Fungí from the Ordovician. Science 289: 1920–1922. [DOI] [PubMed] [Google Scholar]
- Reynolds HL, Vogelsang KM, Hartley AE, Bever JD, Schultz PA. 2006. Variable responses of old‐field perennials to arbuscular mycorrhizal fungi and phosphorus source. Oecologia 147: 348–358. [DOI] [PubMed] [Google Scholar]
- Rispail N, De Matteis L, Santos R, Miguel AS, Custardoy L, Testillano PS, Risueño MC, Pérez‐De‐Luque A, Maycock C, Fevereiro P et al 2014. Quantum dot and superparamagnetic nanoparticle interaction with pathogenic fungi: Internalization and toxicity profile. ACS Applied Materials & Interfaces 6: 9100–9110. [DOI] [PubMed] [Google Scholar]
- Selosse MA, Richard F, He X, Simard SW. 2006. Mycorrhizal networks: des liaisons dangereuses? Trends in Ecology and Evolution 21: 621–628. [DOI] [PubMed] [Google Scholar]
- Smith SE, Smith FA, Jakobsen I. 2004. Functional diversity in arbuscular mycorrhizal (AM) symbioses: The contribution of the mycorrhizal P uptake pathway is not correlated with mycorrhizal responses in growth or total P uptake. New Phytologist 162: 511–524. [Google Scholar]
- Stevens BM, Propster JR, Öpik M, Wilson GWT, Alloway SL, Mayemba E, Johnson NC. 2020. Arbuscular mycorrhizal fungi in roots and soil respond differently to biotic and abiotic factors in the Serengeti. Mycorrhiza 30: 79–95. [DOI] [PubMed] [Google Scholar]
- Strullu‐Derrien C, Selosse MA, Kenrick P, Martin FM. 2018. The origin and evolution of mycorrhizal symbioses: from palaeomycology to phylogenomics. New Phytologist 220: 1012–1030. [DOI] [PubMed] [Google Scholar]
- Sun S, Chan LS, Li Y‐L. 2014. Flower‐like apatite recording microbial processes through deep geological time and its implication to the search for mineral records of life on Mars. American Mineralogist 99: 2116–2125. [Google Scholar]
- Tang I‐M, Krishnamra N, Charoenphandhu N, Hoonsawat R, Pon‐On W. 2010. Biomagnetic of apatite‐coated Cobalt ferrite: A core–shell particle for protein adsorption and pH‐controlled release. Nanoscale Research Letters 6: 19. [DOI] [PMC free article] [PubMed] [Google Scholar]
- Tasoff J, Mee MT, Wang HH. 2015. An economic framework of microbial trade. PLoS ONE 10: 1–20. [DOI] [PMC free article] [PubMed] [Google Scholar]
- Thonar C, Schnepf A, Frossard E, Roose T, Jansa J. 2011. Traits related to differences in function among three arbuscular mycorrhizal fungi. Plant and Soil 339: 231–245. [Google Scholar]
- Tian C, Kasiborski B, Koul R, Lammers PJ, Bucking H, Shachar‐Hill Y. 2010. Regulation of the nitrogen transfer pathway in the arbuscular mycorrhizal symbiosis: Gene characterization and the coordination of expression with nitrogen flux. Plant Physiology 153: 1175–1187. [DOI] [PMC free article] [PubMed] [Google Scholar]
- Timonen S, Smith FA, Smith SE. 2001. Microtubules of the mycorrhizal fungus Glomus intraradices in symbiosis with tomato roots. Canadian Journal of Botany 79: 307–313. [Google Scholar]
- Toju H, Peay KG, Yamamichi M, Narisawa K, Hiruma K, Naito K, Fukuda S, Ushio M, Nakaoka S, Onoda Y et al 2018. Core microbiomes for sustainable agroecosystems. Nature Plants 4: 247–257. [DOI] [PubMed] [Google Scholar]
- Vierheilig H, Garcia‐Garrido JM, Wyss U, Piché Y. 2000. Systemic suppression of mycorrhizal colonization of barley roots already colonized by AM fungi. Soil Biology and Biochemistry 32: 589–595. [Google Scholar]
- Voets L, De Boulois HD, Renard L, Strullu DG, Declerck S. 2005. Development of an autotrophic culture system for the in vitro mycorrhization of potato plantlets. FEMS Microbiology Letters 248: 111–118. [DOI] [PubMed] [Google Scholar]
- Voříšková A, Jansa J, Püschel D, Krüger M, Cajthaml T, Vosátka M, Janoušková M. 2017. Real‐time PCR quantification of arbuscular mycorrhizal fungi: does the use of nuclear or mitochondrial markers make a difference? Mycorrhiza 27: 577–585. [DOI] [PubMed] [Google Scholar]
- Walder F, Niemann H, Natarajan M, Lehmann MF, Boller T, Wiemken A. 2012. Mycorrhizal networks: Common goods of plants shared under unequal terms of trade. Plant Physiology 159: 789–797. [DOI] [PMC free article] [PubMed] [Google Scholar]
- Walder F, van der Heijden MGA. 2015. Regulation of resource exchange in the arbuscular mycorrhizal symbiosis. Nature Plants 1: 1–7. [DOI] [PubMed] [Google Scholar]
- Watts‐Williams SJ, Jakobsen I, Cavagnaro TR, Grønlund M. 2015. Local and distal effects of arbuscular mycorrhizal colonization on direct pathway Pi uptake and root growth in Medicago truncatula . Journal of Experimental Botany 66: 4061–4073. [DOI] [PMC free article] [PubMed] [Google Scholar]
- Werner GDA, Strassmann JE, Ivens ABF, Engelmoer DJP, Verbruggen E, Queller DC, Noë R, Johnson NC, Hammerstein P, Kiers ET. 2014. Evolution of microbial markets. Proceedings of the National Academy of Sciences, USA 111: 1237–1244. [DOI] [PMC free article] [PubMed] [Google Scholar]
- Werner GDA, Zhou Y, Pieterse CMJ, Kiers ET. 2018. Tracking plant preference for higher‐quality mycorrhizal symbionts under varying CO2 conditions over multiple generations. Ecology and Evolution 8: 78–87. [DOI] [PMC free article] [PubMed] [Google Scholar]
- Whiteside MD, Treseder KK, Atsatt PR. 2009. The brighter side of soils: Quantum dots track organic nitrogen through fungi and plants. Ecology 90: 100–108. [DOI] [PubMed] [Google Scholar]
- Whiteside MD, Werner GDA, Caldas VEA, van't Padje A, Dupin SE, Elbers B, Bakker M, Wyatt GAK, Klein M, Hink MA et al 2019. Mycorrhizal fungi respond to resource inequality by moving phosphorus from rich to poor patches across networks. Current Biology 29: 2043–2050.e8. [DOI] [PMC free article] [PubMed] [Google Scholar]
- Wyatt GAK, Kiers ET, Gardner A, West SA. 2014. A biological market analysis of the plant‐mycorrhizal symbiosis. Evolution 68: 2603–2618. [DOI] [PubMed] [Google Scholar]
Associated Data
This section collects any data citations, data availability statements, or supplementary materials included in this article.
Supplementary Materials
Fig. S1 Total QD‐apatite per host root per treatment over time.
Fig. S2 Dry root biomass treatment over time.
Fig. S3 QD‐apatite per host root per treatment per compartment.
Please note: Wiley Blackwell are not responsible for the content or functionality of any Supporting Information supplied by the authors. Any queries (other than missing material) should be directed to the New Phytologist Central Office.
Data Availability Statement
Upon publication, all scripts, analyses and data, will be available from: https://github.com/anoukvantpadje/Market_crash.