Abstract
Glycans possess unparalleled structural complexity arising from chemically similar monosaccharide building blocks, configurations of anomeric linkages and different branching patterns, potentially giving rise to many isomers. This level of complexity is one of the main reasons that identification of exact glycan structures in biological samples still lags behind that of other biomolecules. Here, we introduce a methodology to identify isomeric N‐glycans by determining gas phase conformer distributions (CDs) by measuring arrival time distributions (ATDs) using drift‐tube ion mobility spectrometry‐mass spectrometry. Key to the approach is the use of a range of well‐defined synthetic glycans that made it possible to investigate conformer distributions in the gas phase of isomeric glycans in a systematic manner. In addition, we have computed CD fingerprints by molecular dynamics (MD) simulation, which compared well with experimentally determined CDs. It supports that ATDs resemble conformational populations in the gas phase and offer the prospect that such an approach can contribute to generating a library of CCS distributions (CCSDs) for structure identification.
Keywords: carbohydrates, chemo-enzymatic synthesis, conformations, ion mobility spectrometry, mass spectrometry, molecular dynamics
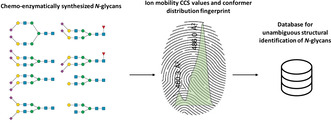
Well‐defined synthetic glycans were used to show that ATDs in IMS‐MS resemble gas‐phase conformational populations, which was also confirmed by molecular dynamics simulation. By applying a database with intrinsic gas‐phase conformer distribution fingerprints, protein‐released N‐glycans, including isomeric structures, could be identified rapidly and unambiguously without the need for MS/MS experiments.
Glycosylation is a posttranslational modification that has been implicated in multiple biological and disease processes. [1] The identification of exact structures of glycans is key to understand their biology at a molecular level and for the development of bio‐pharmaceuticals and biomarkers. Determination of glycan compositions in biological samples is rather straightforward and usually entails glycan release followed by a separation step, such as liquid chromatography or capillary electrophoresis, followed by accurate mass spectrometry (MS) measurements. [2] The assignment of exact glycan structures, which requires MS/MS fragmentation experiments, is much more challenging due to the presence of multiple isomeric forms, often resulting in similar MS/MS spectra with signals of fragment ions that are difficult to univocally assign to a single structure. [3] Complementary techniques, such as ion mobility spectrometry (IMS), have been combined with MS to facilitate unambiguous identification of glycans or their MS/MS derived fragments. [4] In IMS, gas‐phase ions are separated based on their mobility through a drift gas under the influence of an electric field. The measured arrival time and derived ion mobility depends on the charge, size and shape and can provide an intrinsic collision cross section value (CCS) that can be used for glycan structure assignment.[ 4a , 4b , 5 ]
Simple oligosaccharides usually adopt a limited number of gas phase conformations, and as a result their IMS arrival time distributions (ATDs) often show a single peak. [6] In these cases, CCS values can be derived from the apex of the peak, and in general differ sufficiently to discriminate between isomeric structures. For example, it has been shown that N‐acetyl lactosamine having either an α(2,3)‐ or α(2,6)‐linked N‐acetylneuraminic acid (Neu5Ac) can be differentiated based on CCS values. [7] Larger glycans often exhibit smaller differences in CCS values, especially in the case of isomeric structures, [8] and therefore it is more difficult to distinguish them only based on CCS values.
Elegant studies have shown that ATDs of positively charged ions resemble conformational populations in the gas phase.[ 6 , 9 ] Furthermore, such distributions can reveal the presence of isomeric N‐glycans. [10] The ability to determine conformational distributions (CDs) by measuring ATDs is potentially attractive for the assignment of exact isomeric glycan structures. The exploitation of CDs for this purpose, however, is hampered by a lack of well‐defined N‐glycan standards to systematically investigate the relationship between molecular structure and ATD. The recent introduction of facile chemoenzymatic synthetic methods for the preparation of N‐glycans, [11] offers the prospect of obtaining unique collections of glycan standards for the development of new glycomic approaches such as IMS‐based glycan identification.
Here, we demonstrate, for the first time, that intrinsic CD fingerprints can be obtained in ion mobility ATDs, which can be applied for glycan identification. We show that CD fingerprints are unique even for closely related glycans and allow, for example, to differentiate all Neu5Ac linkage‐isomers of biantennary N‐glycans. Computational studies support the ATDs resemble conformational populations in the gas phase.
Complex N‐glycans possess multiple flexible glycosidic linkages and as a result can adopt a number of distinct conformations, [12] which are stabilized in the gas phase by inter‐residue H‐bonds. [13] The assemble of conformational isomers is influenced by branching, [14] anomeric configuration and positions of N‐acetylglucosamine (GlcNAc), [13a] fucosides (Fuc) and Neu5Ac residues [15] as well as adduct formation [9] and charge localization. The latter plays an important role in conformation stabilization and influences CCS value,[ 6 , 16 ] in particular for small compounds in combination with a polarizable drift gas. [17]
To develop the approach, we prepared a range of symmetrical and asymmetrical bi‐antennary N‐glycans 1–15 (Figure 1) that often are found on therapeutic glycoproteins such as IgG antibodies. For example, compounds 3 and 5 are positional isomers in which a galactoside (Gal) is present at the α6 and α3 arm, respectively. Glycans 10–15 differ in the pattern of sialic acid linkage types and have either α2,6‐ (10) or α2,3‐linked (11) bis‐sialosides or at one arm an α2,3‐ and at the other arm an α2,6‐linked sialoside (12 and 13). To investigate the influence of core fucosylation on ATDs, compounds were prepared with (14, 15) and without this modification (11, 10).
Figure 1.

Library of N‐glycan standards used to obtain collision cross sections and conformer distribution with IMS‐MS. Symbols of carbohydrate units are shown below the structure.
The synthesis started by treating a sialoglycopeptide (SGP) isolated from egg‐yolk [18] with PNGase F to remove the peptide followed by exposure to a sialidase and galactosidase to provide 1 (Scheme S1, Supporting Information). Treatment of the latter compound with FUT8 in the presence of GDP‐Fuc and calf intestine alkaline phosphatase (CIAP) provided core fucosylated 2. Glycans 1 and 2 were extended at both arms by a galactosyl moiety to give 6 and 7, respectively by treatment with B4GalT1 and UDP‐Gal. Branch selective extensions of the antennae were accomplished by exploiting the inherent preference of the galactosidase of E. coli and α2,6‐sialyltransferase (ST6GAL1) for the 1,3‐arm of N‐glycans followed by further remodeling of the resulting asymmetrical glycans with a panel of glycosyl transferases to provide the target compounds. [19]
The synthetic glycan standards and bovine fetuin released N‐glycans were labeled with 2‐aminobenzoic acid (2‐AA), [20] separated by hydrophilic liquid interaction chromatography (HILIC) and the electrospray generated ions were measured with low‐field drift tube IMS in nitrogen drift gas coupled to quadrupole time‐of‐flight MS/MS for accurate CD and CCS determination in negative ion mode. [21] The labeled glycans were diluted until no concentration‐dependent changes were observed in the ATDs to ensure the peak shapes were due to conformational properties of the glycans (supporting information, Figure S62–S98). IMS separation variables were kept constant, including the applied voltage, drift gas pressures and temperature. We employed negative ion mode because pilot studies had shown that ATDs of intact deprotonated glycans give more information‐rich multimodal ATDs, while protonated N‐glycans had mainly unimodal character, which was previously also observed for high mannose glycans. [5e] Negative ion mode is also preferred for MS/MS experiments as it provides spectra with additional cross‐ring fragment ions, which can reveal essential structural features.[ 5b , 22 ] Thus, measurements in negative ion mode IMS‐MS will in general give richer data and unique CD fingerprints for exact structure assignment of isomeric glycans.
The ATDs showed predominantly [M−H]− ions for the smallest glycans lacking sialosides, [M−2H]2− ions for the larger and mono‐sialylated glycans and [M−3H]3− ions for the di‐sialylated glycans (Figure 2). These results indicate that the glycans have lost protons at the acidic moieties of the sialosides and the 2‐AA tag. Core fucosylated glycans (2, 4, 7, 9, 14 and 15) do not only have larger CCS values compared to their non‐fucosylated counterparts (1, 5, 6, 8, 10 and 11), but also appear at the upper level in the CCS‐m/z plot, following a somewhat different CCS‐m/z trend line compared to the other glycan classes. [23] Sialylated N‐glycans also followed a slightly different CCS‐m/z trend line compared to the non sialylated N‐glycans, probably due to differences in preferred conformations and flexibility of the antennae. [15] It was also observed that the presence of a core Fuc and terminal Neu5Ac residues alter the CDs. [13a] The CCS values of specific classes of N‐glycans (e.g. fucosylated, sialylated etc.) clustered together and only differ marginally.
Figure 2.
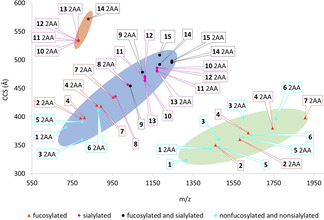
Conformational space plot of free and labeled (2‐AA) N‐glycan standards as [M−H] − (green marked area), [M−2H]2− (blue marked area) and [M−3H]3− ions (orange marked area). Several standards showed multiple conformers at identical m/z values, in particular the fucosylated and sialylated glycan standards, although in this Figure only the CCS values from the most intense signals are visualized.
On the other hand, the labeled glycans exhibited distinctive ATDs (Figure 3 and Supporting Information Figures S1–S15), which were independent of the solvent used for the analysis (Supporting Information Figure S106). These were multimodal or showed partly coinciding signals probably arising from several stable conformers having different CCS values and different peak intensities, thereby creating a unique molecular fingerprint. To confirm the presence of different conformers, ATDs were acquired using increased trapping funnel radiofrequency, which results in ion heating. Only changes in peak intensities were observed, supporting the ATD signals correspond to different CDs (Supporting Information Figure S99). It cannot be excluded that the shape of the ATDs arises from different deprotomers. However, in negative ion mode MS, charges are predominantly positioned at the acidic residues of sialic acid and 2‐AA. Glycans have additional sites that can be deprotonated, however, the resulting anions are not static and acidic protons at other sites can migrate fast towards the negative charge, creating charges on multiple sites within the IMS separation time. Therefore, the ATD reflects averaged conformations that closely resemble that of an uncharged glycan. [9] Thus, charge locations on glycans, other than on the sialic acids and 2‐AA tag, are expected to have a minor influence on the ATD.
Figure 3.
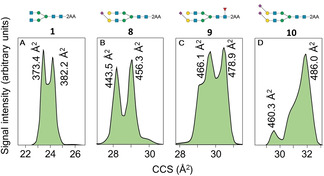
Arrival time distribution fingerprints and collision cross section values of 2‐AA labeled N‐glycans as [M−2H]2− ions at m/z 717.67 (A), m/z 1025.36 (B), m/z 1098.39 (C) and m/z 1170.91 (D).
ATDs and CCS values (Figures S1–S15) of each glycan were repeatable with relative standard deviations (RSDs) of 0.05–0.25 % for intraday (n=3) and interday CCS values (n=3), using both single‐ and stepped‐field approaches. These RSDs are in accordance with values obtained in inter‐laboratory studies for other classes of molecules [21] and allow for the unique intrinsic ATDs to be used, in combination with CCS and m/z values, for unambiguous glycan identification. Additionally, the ATDs can be converted to CCS distributions [24] to compare fingerprints obtained with different instruments or different separation parameters.
The ATDs can be employed to identify isomeric glycans. For example, compounds 3 and 5, which have the same m/z but differ in the position of Gal, have very close CCS values at the peak apex (Figure 4). The ATDs, however, are distinctive and a broader CD was observed for the derivative having Gal on the more flexible α6‐arm (3; Figure 4 A, B).
Figure 4.
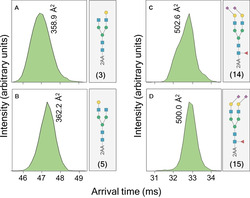
Arrival time distribution fingerprints and collision cross section values of 2‐AA labeled N‐glycan standards as [M−H]− ions at m/z 1598.58 (A and B) and [M−2H]2− ions at m/z 1243.94 (C and D).
Compounds 10–13 are isomers having sialic acid residues linked to Gal in α2,3‐ or α2,6‐fashion covering—possible natural configurations. Their CCS values at the peak apex (Figure 2) are very close and the m/z values identical. However, the ATDs of the glycan standards as [M−2H]2− and [M−3H]3− ions (Figure 5, marked in blue) are distinctive and can be employed to distinguish the various isomers without a need for demanding MS/MS fragmentation experiments. These differences likely arise from differences in conformational properties of α2,3‐ and α2,6‐linked sialosides. [25] The isomers 14 and 15, which have an additional core Fuc, have close CCS values but can also be differentiated based on ATDs (Figure 4 C, D). Interestingly, the CD of these compounds differ substantially from glycans 10 and 11 (Figure 5), lacking the core Fuc, indicating the latter functionality exerts conformational control. Indeed, a previous study has shown that a core Fuc changes specific inter‐residue hydrogen bonds thereby altering conformational properties. [26]
Figure 5.
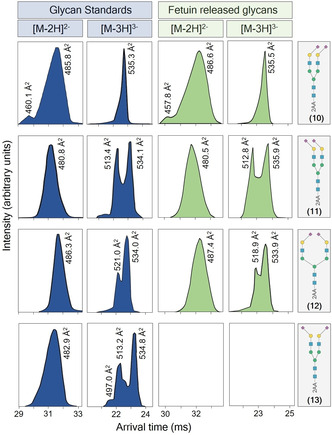
Arrival time/conformer distribution fingerprints as [M−2H]2− and [M−3H]3− ions of intact 2‐AA labeled N‐glycans released from bovine fetuin (marked in green) and matching regioisomeric standards 10–13 (marked in blue), obtained with IMS‐MS.
To demonstrate the applicability of the approach for analysis of protein glycosylation, glycans released from bovine fetuin and labeled with 2‐AA were analyzed by IMS‐MS and the results were compared with the ATDs and CCS values of the glycan standards (Figure S117). A total of 135 released N‐glycans were detected (Table S1). The ATDs of released glycans matched with ATDs of the glycan standards with an average deviation between CCS values at the peak apex of 0.27 % (Figure S118–128). Retention times of the HILIC separated standards and the protein released glycans, assigned by ATD, matched for all compounds, confirming the assignment through ATDs and CCS values is correct.
The presence of the regioisomeric glycans 10–12 in bovine fetuin was confirmed by comparing their ATD fingerprint (Figure 5, marked in green) with the ATDs of standards (Figure 5, marked in blue). Compounds 12 and 13 have identical retention times in HILIC and identical m/z values. The ATDs, however, are different and sufficiently characteristic to distinguish the compounds and to assign the exact structure of a fetuin released glycan as compound 12 and to exclude the presence of 13. Standard 11 and 13 are distinguished from the other isomers by a small difference in CCS values (2.1 Å2) of the [M−2H]2− ion cluster and a different ATD (Figure 5). The difference in CCS values for the [M−3H]3− ions is even smaller (0.2 and 0.7 Å2), but here again the clear difference in ATDs was used for exact structure assignment. Standards 10 and 12 also show similar CCS values (0.5 Å2 difference for [M−2H]2− and 1.3 Å2 for [M−3H]3− ions) and ATD fingerprints were used to assign the correct structures.
We employed a computational approach to calculate CCSDs to further validate that the ATDs resemble conformational distributions and to explore if a computational approach can provide such distributions for database development. Isomeric unlabeled glycans 10 and 11, which are modified by α(2,6)‐ and α(2,3)‐linked sialosides, respectively were used as models. Firstly, low‐energy conformers for both derivatives were generated using a carbohydrate builder [27] (see supplemental information), which were subjected to 5 μs MD simulations in vacuo. In this way, it is possible to circumvent the limitations of current force fields that in general fail to sample the conformational landscape due to high‐energy barriers between conformers in vacuo. Up to 10 000 frames were collected at regular intervals for each trajectory and high performance collision cross section (HPCCS) software [28] was used to calculate their CCS values. For each glycan, all ensembles derived from the different initial MD simulations were scored, and the contribution of each ensemble to the CD and CCS values were scaled according to the relative energy at 25 °C of the starting structure used in the MD simulations. Figure 6 E–G shows the resulting structural ensembles, which have folded conformations to maximize intramolecular hydrogen bonding. The calculated structures of 10 (Figure 6 E and F) correspond to conformers that mainly differ in dihedral angle ψ of the Manα(1,6)Man linkage and torsional angle ϕ of the GlcNAcβ(1,2)Man linkage (Supporting Information Figure S121). As a result, 10 adopts a globular conformation with a calculated CCS value of 511.5 Å2, and a more rigid conformation, in which the lower (Manα(1,3)Man) branch is positioned parallel to the Manβ(1,4)GlcNAcβ(1,4)GlcNAc trisaccharide having a CCS value of 537.4 Å2. Compound 11 has a higher rigidity with less disperse torsional angles (Supporting Information S122) and therefore shows a less complex CD having a CCS value of 522.1 Å2 at the peak apex (Figure 6 C). Gratifyingly, the shapes of the computed CDs (Figure 6, marked in blue) are in close agreement with the experimentally determined conformer clusters providing further support that ATDs resemble conformational distributions (Figure 6, marked in green). The deviations of the calculated CCS values from the experimental values are probably caused by variance in computation, but can also be due to biased mobility measurements. [29]
Figure 6.
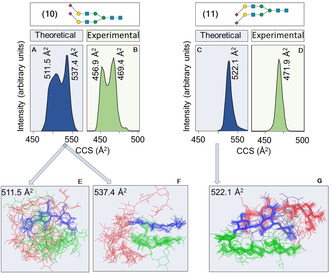
Theoretical CDs (A and C; marked in blue) and experimental CDs (B and D; marked in green) for the unlabeled isomers 10 and 11 as [M−2H]2− ions. Overlay of conformational ensembles derived from MD simulations of 10 (E and F) and 11 (G), at CCS values that correspond to the peak apex in the CDs. Each set of structures, evenly spaced along the trajectory, have been aligned to the trisaccharide Manβ(1,4)GlcNAcβ(1,4)GlcNAc (depicted in blue). The upper branch (Manα(1,6)Man) is depicted in red, the lower branch (Manα(1,3)Man) in green.
In summary, we have shown that assembles of glycan gas phase conformations can be resolved by IMS to obtain intrinsic CD fingerprints in the ATDs that can be exploited for the identification of isomeric N‐glycans. The approach is facilitated by the emergence of high‐resolution IMS instrumentation[ 8 , 30 ] that makes it possible to resolve such conformers. The power of the approach was demonstrated by identifying all Neu5Ac linkage‐isomers of biantennary N‐glycans. The results highlight that a database of CD fingerprints will facilitate fast identification of protein released N‐glycans, including isomers, without the need for demanding MS/MS experiments.
During the past few years, facile methods for the chemoenzymatic synthesis of highly complex glycans have become available. [19] Furthermore, automation platforms have been introduced that can further speed up the preparation of these compounds. [31] Thus, it is now possible to prepare sufficiently large collections of compounds for IMS‐MS data base development. Unknown N‐glycans that are not incorporated in a database, can be identified by MS/MS experiments in combination with IMS of fragment ions, [32] when synthesis of possible structure candidates is not an option. In addition, we developed an approach to compute CCSDs for N‐glycan identification, and although refinements are required, such an approach can also contribute to database development.
Conflict of interest
The authors declare no conflict of interest.
Supporting information
As a service to our authors and readers, this journal provides supporting information supplied by the authors. Such materials are peer reviewed and may be re‐organized for online delivery, but are not copy‐edited or typeset. Technical support issues arising from supporting information (other than missing files) should be addressed to the authors.
Supplementary
Acknowledgements
This project was supported by the Basque Government (postdoctoral fellowship to O.A.O.), EU Commission (Marie Skłodowska‐Curie 749996 to V.J.S.), Spanish Ministry of Science and Innovation (MCI) (FEDER funds RTI2018‐099592‐B‐C21 to F.C and RTI2018‐099592‐B‐C22 to G.J.O, the Human Frontier Science Program (postdoctoral fellowship LT000747/208‐C to L.U.) and the National Institute of Standard and Technology (NIST) (60NANB16D265 to G.J.B.).
J. Sastre Toraño, O. Aizpurua-Olaizola, N. Wei, T. Li, L. Unione, G. Jiménez-Osés, F. Corzana, V. J. Somovilla, J. M. Falcon-Perez, G.-J. Boons, Chem. Eur. J. 2021, 27, 2149.
References
- 1.
- 1a. Varki A., Glycobiology 2017, 27, 3–49; [DOI] [PMC free article] [PubMed] [Google Scholar]
- 1b. Cummings R. D., Pierce J. M., Chem. Biol. 2014, 21, 1–15; [DOI] [PMC free article] [PubMed] [Google Scholar]
- 1c. Wolfert M. A., Boons G. J., Nat Chem. Biol 2013, 9, 776–784; [DOI] [PMC free article] [PubMed] [Google Scholar]
- 1d. Scott H., Panin V. M., Glycobiology 2014, 24, 407–417; [DOI] [PMC free article] [PubMed] [Google Scholar]
- 1e. Dalziel M., Crispin M., Scanlan C. N., Zitzmann N., Dwek R. A., Science 2014, 343, 1235681; [DOI] [PubMed] [Google Scholar]
- 1f. Hudak J. E., Bertozzi C. R., Chem. Biol. 2014, 21, 16–37. [DOI] [PMC free article] [PubMed] [Google Scholar]
- 2.
- 2a. Aizpurua-Olaizola O., Sastre Torano J., Falcon-Perez J. M., Williams C., Reichardt N., Boons G. J., TrAC Trends Anal. Chem. 2018, 100, 7–14; [Google Scholar]
- 2b. W. R. Alley, Jr. , Mann B. F., Novotny M. V., Chem. Rev. 2013, 113, 2668–2732; [DOI] [PMC free article] [PubMed] [Google Scholar]
- 2c. Dotz V., Haselberg R., Shubhakar A., Kozak R. P., Falck D., Rombouts Y., Reusch D., Somsen G. W., Fernandes D. L., Wuhrer M., TrAC Trends Anal. Chem. 2015, 73, 1–9. [Google Scholar]
- 3.
- 3a. Ruhaak L. R., Xu G., Li Q., Goonatilleke E., Lebrilla C. B., Chem. Rev. 2018, 118, 7886–7930; [DOI] [PMC free article] [PubMed] [Google Scholar]
- 3b. Gray C. J., Migas L. G., Barran P. E., Pagel K., Seeberger P. H., Eyers C. E., Boons G. J., Pohl N. L. B., Compagnon I., Widmalm G., Flitsch S. L., J. Am. Chem. Soc. 2019, 141, 14463–14479. [DOI] [PMC free article] [PubMed] [Google Scholar]
- 4.
- 4a. Gray C. J., Thomas B., Upton R., Migas L. G., Eyers C. E., Barran P. E., Flitsch S. L., Biochim. Biophys. Acta Gen. Subj. 2016, 1860, 1688–1709; [DOI] [PubMed] [Google Scholar]
- 4b. Both P., Green A. P., Gray C. J., Sardzik R., Voglmeir J., Fontana C., Austeri M., Rejzek M., Richardson D., Field R. A., Widmalm G., Flitsch S. L., Eyers C. E., Nat. Chem. 2014, 6, 65–74; [DOI] [PubMed] [Google Scholar]
- 4c. Plasencia M. D., Isailovic D., Merenbloom S. I., Mechref Y., Novotny M. V., Clemmer D. E., J. Am. Soc. Mass Spectrom. 2008, 19, 1706–1715; [DOI] [PMC free article] [PubMed] [Google Scholar]
- 4d. Zhu F., Lee S., Valentine S. J., Reilly J. P., Clemmer D. E., J. Am. Soc. Mass Spectrom. 2012, 23, 2158–2166. [DOI] [PMC free article] [PubMed] [Google Scholar]
- 5.
- 5a. Hofmann J., Stuckmann A., Crispin M., Harvey D. J., Page K., Struwe W. B., Anal. Chem. 2017, 89, 2318–2325; [DOI] [PubMed] [Google Scholar]
- 5b. Harvey D. J., Watanabe Y., Allen J. D., Rudd P., Pagel K., Crispin M., Struwe W. B., J. Am. Soc. Mass Spectrom. 2018, 29, 1250–1261; [DOI] [PubMed] [Google Scholar]
- 5c. Hofmann J., Pagel K., Angew. Chem. Int. Ed. 2017, 56, 8342–8349; [DOI] [PubMed] [Google Scholar]; Angew. Chem. 2017, 129, 8458–8466; [Google Scholar]
- 5d. Pagel K., Harvey D. J., Anal. Chem. 2013, 85, 5138–5145; [DOI] [PubMed] [Google Scholar]
- 5e. Struwe W. B., Benesch J. L., Harvey D. J., Pagel K., Analyst 2015, 140, 6799–6803; [DOI] [PubMed] [Google Scholar]
- 5f. Hofmann J., Hahm H. S., Seeberger P. H., Pagel K., Nature 2015, 526, 241–244; [DOI] [PubMed] [Google Scholar]
- 5g. Hofmann J., Struwe W. B., Scarff C. A., Scrivens J. H., Harvey D. J., Pagel K., Anal. Chem. 2014, 86, 10789–10795; [DOI] [PubMed] [Google Scholar]
- 5h. Struwe W. B., Pagel K., Benesch J. L., Harvey D. J., Campbell M. P., Glycoconjugate J. 2016, 33, 399–404. [DOI] [PubMed] [Google Scholar]
- 6. Re S., Watabe S., Nishima W., Muneyuki E., Yamaguchi Y., A. D. MacKerell, Jr. , Sugita Y., Sci. Rep. 2018, 8, 1644. [DOI] [PMC free article] [PubMed] [Google Scholar]
- 7. Guttman M., Lee K. K., Anal. Chem. 2016, 88, 5212–5217. [DOI] [PMC free article] [PubMed] [Google Scholar]
- 8. May J. C., Goodwin C. R., Lareau N. M., Leaptrot K. L., Morris C. B., Kurulugama R. T., Mordehai A., Klein C., Barry W., Darland E., Overney G., Imatani K., Stafford G. C., Fjeldsted J. C., McLean J. A., Anal. Chem. 2014, 86, 2107–2116. [DOI] [PMC free article] [PubMed] [Google Scholar]
- 9. Struwe W. B., Baldauf C., Hofmann J., Rudd P. M., Pagel K., Chem. Commun. 2016, 52, 12353–12356. [DOI] [PubMed] [Google Scholar]
- 10.
- 10a. Harvey D. J., Crispin M., Bonomelli C., Scrivens J. H., J. Am. Soc. Mass Spectrom. 2015, 26, 1754–1767; [DOI] [PMC free article] [PubMed] [Google Scholar]
- 10b. Manz C., Grabarics M., Hoberg F., Pugini M., Stuckmann A., Struwe W. B., Pagel K., Analyst 2019, 144, 5292–5298; [DOI] [PubMed] [Google Scholar]
- 10c. Yamaguchi Y., Nishima W., Re S., Sugita Y., Rapid Commun. Mass Spectrom. 2012, 26, 2877–2884. [DOI] [PubMed] [Google Scholar]
- 11.
- 11a. Wang Z., Chinoy Z. S., Ambre S. G., Peng W., McBride R., de Vries R. P., Glushka J., Paulson J. C., Boons G. J., Science 2013, 341, 379–383; [DOI] [PMC free article] [PubMed] [Google Scholar]
- 11b. Li T., Huang M., Liu L., Wang S., Moremen K. W., Boons G. J., Chem. Eur. J. 2016, 22, 18742–18746. [DOI] [PMC free article] [PubMed] [Google Scholar]
- 12. Re S., Nishima W., Miyashita N., Sugita Y., Biophys. Rev. Lett. 2012, 4, 179–187. [DOI] [PMC free article] [PubMed] [Google Scholar]
- 13.
- 13a. Nishima W., Miyashita N., Yamaguchi Y., Sugita Y., Re S., J. Phys. Chem. B 2012, 116, 8504–8512; [DOI] [PubMed] [Google Scholar]
- 13b. Almond A., Petersen B. O., Duus J. O., Biochemistry 2004, 43, 5853–5863; [DOI] [PubMed] [Google Scholar]
- 13c. Almond A., Carbohydr. Res. 2005, 340, 907–920; [DOI] [PubMed] [Google Scholar]
- 13d. Woods R. J., Pathiaseril A., Wormald M. R., Edge C. J., Dwek R. A., Eur. J. Biochem. 1998, 258, 372–386. [DOI] [PubMed] [Google Scholar]
- 14. Montreuil J., Biol. Cell 1984, 51, 115–131. [DOI] [PubMed] [Google Scholar]
- 15. Guillot A., Dauchez M., Belloy N., Jonquet J., Duca L., Romier B., Maurice P., Debelle L., Martiny L., Durlach V., Baud S., Blaise S., Sci. Rep. 2016, 6, 35666. [DOI] [PMC free article] [PubMed] [Google Scholar]
- 16. Jin L., Barran P. E., Deakin J. A., Lyon M., Uhrin D., Phys. Chem. Chem. Phys. 2005, 7, 3464–3471. [DOI] [PubMed] [Google Scholar]
- 17. Warnke S., Seo J., Boschmans J., Sobott F., Scrivens J. H., Bleiholder C., Bowers M. T., Gewinner S., Schollkopf W., Pagel K., von Helden G., J. Am. Chem. Soc. 2015, 137, 4236–4242. [DOI] [PubMed] [Google Scholar]
- 18.
- 18a. Seko A., Koketsu M., Nishizono M., Enoki Y., Ibrahim H. R., Juneja L. R., Kim M., Yamamoto T., Biochim. Biophys. Acta Gen. Subj. 1997, 1335, 23–32; [DOI] [PubMed] [Google Scholar]
- 18b. Liu L., Prudden A. R., Bosman G. P., Boons G. J., Carbohydr. Res. 2017, 452, 122–128. [DOI] [PMC free article] [PubMed] [Google Scholar]
- 19. Liu L., Prudden A. R., Capicciotti C. J., Bosman G. P., Yang J. Y., Chapla D. G., Moremen K. W., Boons G. J., Nat. Chem. 2019, 11, 161–169. [DOI] [PMC free article] [PubMed] [Google Scholar]
- 20. Ruhaak L. R., Zauner G., Huhn C., Bruggink C., Deelder A. M., Wuhrer M., Anal. Bioanal. Chem. 2010, 397, 3457–3481. [DOI] [PMC free article] [PubMed] [Google Scholar]
- 21. Stow S. M., Causon T. J., Zheng X., Kurulugama R. T., Mairinger T., May J. C., Rennie E. E., Baker E. S., Smith R. D., McLean J. A., Hann S., Fjeldsted J. C., Anal. Chem. 2017, 89, 9048–9055. [DOI] [PMC free article] [PubMed] [Google Scholar]
- 22. Harvey D. J., Struwe W. B., J. Am. Soc. Mass Spectrom. 2018, 29, 1179–1193. [DOI] [PMC free article] [PubMed] [Google Scholar]
- 23. Harvey D. J., Scarff C. A., Edgeworth M., Pagel K., Thalassinos K., Struwe W. B., Crispin M., Scrivens J. H., J. Mass Spectrom. 2016, 51, 1064–1079. [DOI] [PMC free article] [PubMed] [Google Scholar]
- 24. Marchand A., Livet S., Rosu F., Gabelica V., Anal. Chem. 2017, 89, 12674–12681. [DOI] [PubMed] [Google Scholar]
- 25. De Leoz M. L. A., Simon-Manso Y., Woods R. J., Stein S. E., J. Am. Soc. Mass Spectrom. 2019, 30, 426–438. [DOI] [PMC free article] [PubMed] [Google Scholar]
- 26. André S., Kozar T., Kojima S., Unverzagt C., Gabius H. J., Biol. Chem. 2009, 390, 557–565. [DOI] [PubMed] [Google Scholar]
- 27.R. J. Woods, Complex Carbohydrate Research Center, University of Georgia, Athens, GA, GLYCAM web, http://glycam.org 2013.
- 28. Zanotto L., Heerdt G., Souza P. C. T., Araujo G., Skaf M. S., J. Comput. Chem. 2018, 39, 1675–1681. [DOI] [PubMed] [Google Scholar]
- 29. Gabelica V., Shvartsburg A. A., Afonso C., Barran P., Benesch J. L. P., Bleiholder C., Bowers M. T., Bilbao A., Bush M. F., Campbell J. L., Campuzano I. D. G., Causon T., Clowers B. H., Creaser C. S., De Pauw E., Far J., Fernandez-Lima F., Fjeldsted J. C., Giles K., Groessl M., C. J. Hogan, Jr. , Hann S., Kim H. I., Kurulugama R. T., May J. C., McLean J. A., Pagel K., Richardson K., Ridgeway M. E., Rosu F., Sobott F., Thalassinos K., Valentine S. J., Wyttenbach T., Mass Spectrom. Rev. 2019, 38, 291–320. [DOI] [PMC free article] [PubMed] [Google Scholar]
- 30. Giles K., Ujma J., Wildgoose J., Pringle S., Richardson K., Langridge D., Green M., Anal. Chem. 2019, 91, 8564–8573. [DOI] [PubMed] [Google Scholar]
- 31. Li T. H., Liu L., Wei N., Yang J. Y., Chapla D. G., Moremen K. W., Boons G. J., Nat. Chem. 2019, 11, 229–236. [DOI] [PMC free article] [PubMed] [Google Scholar]
- 32. Sastre Toraño J., Gagarinov I. A., Vos G. M., Broszeit F., Srivastava A. D., Palmer M., Langridge J. I., Aizpurua-Olaizola O., Somovilla V. J., Boons G. J., Angew. Chem. Int. Ed. 2019, 58, 17616–17620; [DOI] [PubMed] [Google Scholar]; Angew. Chem. 2019, 131, 17780–17784. [Google Scholar]
Associated Data
This section collects any data citations, data availability statements, or supplementary materials included in this article.
Supplementary Materials
As a service to our authors and readers, this journal provides supporting information supplied by the authors. Such materials are peer reviewed and may be re‐organized for online delivery, but are not copy‐edited or typeset. Technical support issues arising from supporting information (other than missing files) should be addressed to the authors.
Supplementary


