

Abstract
A compact and negatively charged acceptor group, N‐(cyanamino)sulfonyl, is introduced for dye design and its influence on the absorption and emission spectra of the “push–pull” chromophores is demonstrated with 1,3,6‐tris[(cyanamino)sulfonyl]‐8‐aminopyrene. The new sulfonamides, including O‐phosphorylated (3‐hydroxyazetidine)‐N‐sulfonyl, are negatively charged electron acceptors and auxochromes. 1‐Aminopyrenes decorated with the new sulfonamides have three or six negative charges (pH ≥8), low m/z ratios, high mobilities in an electric field, and yellow to orange emission. We labeled maltodextrin oligomers by reductive amination, separated the products by electrophoresis, and demonstrated their high brightness in a commercial DNA analyzer and the distribution of the emission signal among the detection channels.
Keywords: chromophores, donor–acceptor systems, electrophoresis, fluorescent probes, glycoconjugates
Negatively charged electron acceptors and auxochromes? New sulfonamides make it possible! 1‐Aminopyrenes decorated with the new sulfonamides had low m/z ratios and high mobility in an electric field. Their glycoconjugates with reducing sugars were separated and detected at sub‐picomolar concentration by multicolor emission in a DNA analyzer (see picture).

Introduction
Glycosylation—the attachment of a carbohydrate to another biomolecule—is an important transformation studied in biology, pharmaceutical science and clinical chemistry. [1] Glycans—oligo‐ and polysaccharides with glycosidic bonds between monomeric units—participate in the formation of glycoproteins, cellular homeostasis, immune regulation and diseases. [2] Further progress in glycomics and glycobiology depends on the advances in analytic techniques applicable to sugars, including mass spectrometry (MS),[ 3 , 4 ] chromatographic methods, [5] capillary electrophoresis (CE), [6] and their combinations. [7] In most cases, derivatization of glycans is necessary, because native carbohydrates do not absorb light and their ionization abilities are poor. Labeling with bright and well‐detectable fluorescent tags facilitates glycan analysis. Capillary gel electrophoresis with laser induced fluorescence detection (CGE‐LIF) is widely used as a very sensitive and powerful technique for separation and detection. [8] In this method, the enzymatically or chemically released glycans are labeled with a fluorescent tag, which is charged, and its conjugates move in an electric field. The high throughput analysis of fluorescent glycan derivatives is performed on commercial DNA sequencers equipped with a CGE‐LIF module with a 488 nm (argon) or 505 nm lasers. [7] For the sensitive detection, the sugar–dye conjugate must strongly absorb at 488–505 nm and emit light with a high fluorescence quantum yield. Additionally, the fluorescent dyes must have a reactive group for binding with glycans, be multicharged (to provide low m/z ratio and high mobility in the electric field) and chemically stable. At present, reductive amination is the most widely employed derivatization method applicable to glycans released (enzymatically or chemically cleaved) from the protein matrix. [9]
8‐Aminopyrene‐1,3,6‐trisulfonic acid (APTS, Figure 1) is up to now the best reagent [10] which can be used in CE with fluorescence or MS (MALDI TOF) detection. [11] However, the overall performance of APTS as a single fluorescent tag, with one emission color, improvable brightness and three negative charges is limited. Other negatively charged dyes were developed for CE‐LIF and CE‐MS analysis of glycans, but their structures are either unknown, [12] or they emit in the blue spectral region and cannot be excited with 488 nm light. For example, Cascade Blue [(3,6,8‐trisulfo‐1‐pyrenyloxy)acetic acid hydrazide] is much more reactive in reductive amination than APTS, was successfully applied for labeling of glycans, and the conjugates were separated by CE‐LIF, [13] but its fluorescence cannot be excited with 488 nm light (the absorption maximum at 400 nm). The bright and negatively charged fluorescent dyes suitable for reductive amination of carbohydrates are rare. Rhodamines and cyanines decolorize in reduction with borohydrides; [14] 2,9‐diaminoacridines [15] and 2‐aminoacridones [16] have been applied successfully but proved to be rather “dark”; with large Stokes shifts, low absorption and low fluorescence quantum yields. The positively charged aminopyrene sulfonamides APTMP and APTDP (Figure 1) have been reported very recently. [17] They may be used in CE with the “reversed” polarity of the electric field (Agilent). We prepared negatively charged aminopyrene sulfone PSU and sulfonamide PSN dyes (Figure 1) as brighter alternatives of APTS having multiple negative charges and higher mobility in an electric field. [18] One of the motivations was to reduce or even eliminate the cross‐talk with APTS detection window (ca. 520 nm in a DNA sequencing equipment). The conjugates of PSU and PSN dyes have absorption and emission maxima at ca. 500 nm and 560 nm, respectively, six negative charges (pH ≥8), and low m/z ratios. Due to higher absorption at 488–506 nm, the conjugates of PSU and PSN dyes are ca. 3 times brighter than APTS derivatives, the excitation is performed with the 488 nm or 503 nm light. The new dyes provide different selectivity profile for isomeric carbohydrates. The aminopyrene core remains an attractive scaffold for fluorescent dyes whose emission is red‐shifted, after N‐alkylation occurred in the reaction with carbohydrates. Here we report a very compact negatively charged N‐(cyanamino)sulfonyl residue and a more powerful acceptor—O‐phosphorylated (3‐hydroxyazetidine)‐N‐sulfonyl group, establish their electronic properties, introduce them into 1‐aminopyrenes, and study the optical spectra and mobility of the new dyes and their conjugates with carbohydrates.
Figure 1.

Commercial APTS dye, cationic pyrene APTDP, negatively charged PSN and PSU reported previously; new tris(N‐cyanosulfonamide) PCN and triple O‐phosphorylated tris(3‐hydroxyazetidine)sulfonamide PAZ dyes.
Results and Discussion
Design of New Dyes
The cationic pyrene APTDP, PSN and PSU (Figure 1) have the powerful acceptor groups (sulfonamide or alkyl sulfone) in “active” positions of 1‐aminopyrene. These groups shift the absorption and emission maxima to the red and make the new dyes brighter than APTS.[ 17 , 18 ] As one of the most intriguing, promising and least studied, we found the compact N‐cyanosulfonamide SO2NHCN group and introduced it into the aminopyrene. This substituent was reported in the context of medicinal chemistry, [19] and its impact on spectra and electric charge remained unknown. It was not clear, if this group will be negatively charged at basic pH and have electron–acceptor properties. Nevertheless, we expected that due to the presence of cyano group, SO2NHCN would be a more powerful acceptor than SO3 −. The acidity of the NH proton is enhanced due to the neighboring effects of two strong electron‐acceptor residues, SO2 and CN, and delocalization of the negative charge between two nitrogen atoms:

To prove these assumptions, we prepared aminopyrene PCN with three N‐cyanosulfonamide groups. A simple two‐step synthesis involves APTS as a starting material and the corresponding tris(chlorosulfonyl)aminopyrene as an intermediate (Scheme 1). The new PCN dye has absorption and emission maxima at 454 nm and 531 nm, respectively (Table 1). A bathochromic shift of 30 nm increases the absorption of the PCN dye (and its conjugates with carbohydrates) at 488 nm, so that the detection ability of PCN dye is 3–4 times higher than that of APTS.
Scheme 1.

A) Synthesis of the new dyes; B) reductive amination of glucose with new dyes.
Table 1.
Spectral properties of the dyes and their conjugates with glucose (dye‐G) in aqueous solutions (pH 7.3).
|
Dye |
Absorption λ max, nm (ϵ)[a] |
Emission λ max, nm (Φ fl)[b] |
Fluorescence lifetime τ, ns |
|---|---|---|---|
|
APTS [c] |
424 (20 600) |
500 (0.95) |
– |
|
APTS‐G6 [d] |
455 (17 160) |
511 (0.92) |
5.1 |
|
PCN |
454 (23 900) |
531 (0.93) |
5.6 |
|
PCN‐G |
484 (29 000) |
544 (0.92) |
5.5 |
|
PSN |
471 (18 000) |
544 (0.91) |
5.6 |
|
PSN‐G |
496 (30 000) |
558 (0.91) |
5.7 |
|
PAZ |
476 (19 000) |
543 (0.92) |
5.9 |
|
PAZ‐G |
505 |
564 (0.90) |
5.8 |
|
PSU |
477 (19 600) |
542 (0.92) |
5.8 |
|
PSU‐G |
506 |
558 (0.95) |
5.8 |
We also prepared a new PAZ dye with three O‐phosphorylated (3‐hydroxyazetidine)sulfonamide groups (Figure 1). We expected that this dye would have smaller hydrodynamic radius and provide higher mobility in conjugates than its acyclic analogue PSN. The electrophoretic mobility is inversely proportional to hydrodynamic radius. [21] Sulfonamides PSN and PAZ differ only by 6 hydrogen atoms, but the azetidine‐containing molecule of PAZ has 3 cycles and, therefore, enjoys much less “conformational freedom” than the linear sulfonamides PSN and PSU.
Due to the presence of sulfonyl groups (into which the lone pair on nitrogen may delocalize), the inversion barrier of nitrogen in N‐sulfonyl azetidines is possibly lower than 30 kJ mol−1 observed for azetidine itself or N‐alkylated derivatives. This became visible in the sum of the bond angles centered at the nitrogen atom (334° for N‐methylsulfonylazetidine), [22] which is higher than the value for azetidine (320°). We measured 1H NMR spectra of 3‐hydroxy‐N‐(3‐/4‐fluorophenyl)sulfonyl azetidines between 25 and −100 °C in [D10]diethyl ether, and observed no broadening or signal splitting, which indicates the free inversion of the nitrogen “pyramide” in 3‐hydroxy‐N‐arylazetidines and the absence of syn–anti isomerism in PAZ.
In conjugates with glucose (G), PAZ‐G demonstrated a small (+6 nm) red‐shift of the emission maximum (Table 1) compared to PSN‐G and PSU‐G. This feature is important, as it further reduces the cross‐talk with APTS detection window. For all dyes, the Stokes shifts are rather large (60–77 nm), and the fluorescence quantum yields high (>0.9). This combination is valuable and rare, because large Stokes shifts are often associated with reduced emission efficiencies. The large Stokes shifts allow more freedom in choosing the excitation wavelength and detection window, which is an important condition for the envisaged cross‐talk reduction between color channels in DNA analyzer (APTS on the one hand, and PSN/PSU/PAZ on the other hand).
Evaluation of Electronic Effects and Their Influence on Spectra
We considered the values of Hammett and constants for the acceptor substituents “opposing” the donor amino group in 1‐aminopyrene and providing the red‐shifts in the spectra. These values, as well as the field and resonance parameters and ), for SO2NHCN and SO2NC3H5OH (N‐[3‐hydroxyazetidine]sulfonyl) groups were unknown. [23] The new substituents are interesting as polar acceptor groups not only for 1‐aminopyrene, but also for other “push–pull” chromophores. [24] We assessed the donor–acceptor properties of SO2NHCN and SO2NC3H5OH groups by calculating their and values and included them into the row of common electron‐acceptor groups. The parameter reflects the polar effect of the substituent: a combination of inductive and field effects (transferred along σ‐bonds and through space). The parameter is associated with a pure resonance (mesomeric) effect of the group (transferred via π‐systems, d‐orbitals, and their combination). Taft et al. demonstrated that it is possible to separate the polar ( ) and resonance ( ) effects. [25a] The chemical shifts in 19F NMR spectra relate to the electron density on fluorine nuclei and are very sensitive to the nature of meta or para substituents in the benzene ring. Therefore, the chemical shifts in 19F NMR spectra of meta‐ and para‐substituted fluorobenzenes allow to calculate and values of the new groups. [25] There is a good linear correlation between 19F shielding parameters (derived from the values of 19F chemical shifts) and the values of and . The inductive and resonance constants of the new substituents may be estimated by fitting the measured 19F NMR shielding parameters to straight line plotted for other groups with already known values of and . Figure 2 illustrates this approach, provides the required values for the new substituents (SO2NHCN and SO2NC3H5OH) and quantifies their polar and resonance effects. A good correlation is observed with R 2=0.92 and 0.94 for parameters and , respectively.
Figure 2.

Linear correlation of 19F NMR shielding parameters and (referenced to fluorobenzene) with A) and B) . 19F NMR spectra were measured in this study; the known values of and are taken from Ref. [23].
Knowing the values of and , it is possible to calculate the Hammett substituent constants and according to Equations 1 and 2: [25]
| (1) |
| (2) |
The physical sense of Equations (1) and (2) follows from the clear separation of the polar and resonance effects: is simply the sum of the parameters reflecting these two effects, while includes only a constant part of the resonance effect (due to less efficient conjugation with the meta position). According to Taft, [25c] we applied α≈0.5. We compared the calculated values of and for the new groups (SO2NHCN and SO2NC3H5OH) with the known data for sulfonamides and sulfones (Table 2). Importantly, the N‐(cyanamino)sulfonyl group turned out to be a stronger acceptor than sulfonic acid, but weaker than unsubstituted sulfonamide. The N‐(3‐hydroxyazetidine)sulfonyl group is a stronger acceptor than the N,N‐dimethylaminosulfonyl residue, though both are tertiary sulfonyl amides.
Table 2.
Hammett and values for sulfonamides, sulfones, and sulfonic acid.
|
Substituent |
|
|
||
|---|---|---|---|---|
|
SO3 − |
0.35[a] |
0.30[a] |
||
|
SO2NHCN |
0.55[b] |
0.49[b] |
||
|
SO2NH2 |
0.60[a] |
0.53[a] |
||
|
SO2NMe2 |
0.65[a] |
0.51[a] |
||
|
SO2Alk |
0.72–0.77[a] |
0.60–0.66[a] |
||
|
SO2NC3H5OH |
0.74[b] |
0.58[b] |
[a] Data from Ref. [23]. [b] Calculated values from the present study.
Figure 2 lists the and values for electron acceptors. This data and , values in Table 2 indicate the trend and suggest substituents useful for the design of the new “push–pull” dyes. [24] If an electron‐donor (“push”) group is directly attached to the aromatic system, it can be opposed by one or several electron‐acceptor (“pull”) groups selected from sulfonic acid, N‐(cyanamino)sulfonyl, sulfonamide and alkylsulfone residues. Alkyl sulfonates are the strongest acceptors, but they are too reactive. The previous studies report the correlations between photophysical properties (e.g., positions of absorption and/or fluorescence maxima) and Hammett constants.[ 26 , 27 ] We evaluated the relationship between the positions of the absorption and emission maxima of new dyes (and their conjugates) and Hammett constants of the substituents present in the structures (Figure 3). Remarkably, a better correlation was observed for absorption (R 2=0.97; 0.99) than for emission (R 2=0.89; 0.93). All these results support the power and accuracy of 19F NMR method that allowed to determine the complete set of values with their predictive force.
Figure 3.

Correlation of with the positions of A) absorption and B) emission maxima of the free dyes and their conjugates with glucose.
Reductive Amination and Detection of Sugars
The reductive amination of sugars is a two‐step process involving the reversible formation of the Schiff base, which is then irreversibly reduced to a stable secondary amine. The influence of concentration, temperature, time, [28] the nature of acid [29] and reducing agent [10d] were optimized for APTS. Further improvements such as evaporative reductive amination have been published recently. [30] We found that the new compounds PCN and PAZ are applicable for reductive amination of sugars under water‐free conditions (2‐picoline–borane complex and malonic acid) reported previously for PSN and PSU dyes. [18] APTS, PCN and PSN were applied in recovery experiments with glucose using classic protocol with NaBH3CN and citric acid. [31]
The conjugates with glucose were prepared, isolated, and characterized by 1H NMR, HRMS, UV/Vis, and fluorescence spectra (Table 1, Figure 4, and Supporting Information). As mentioned above, the red‐shift in absorption and emission is important, as it reduces the cross‐talk with APTS detection window (shown with a vertical line at 510 nm in Figure 4). The absorption maxima of PCN and PAZ conjugates nicely match the emission lines (488 nm or 505 nm) of the excitation lasers used in DNA analyzers. Higher absorption at 488 nm and 505 nm improves the brightness of the new fluorescent tags by a factor of 3–4 (compared with APTS).
Figure 4.

Normalized absorption (dashed lines) and emission spectra (solid lines) in aqueous buffer (pH 7.3) of conjugates with glucose prepared from APTS as well as new PCN and PAZ dyes.
Recovery experiments were performed with glucose and three dyes, APTS, PCN and PSN taken in 5 or 10‐fold excess. [31] The isolated and purified compounds APTS‐G, PCN‐G and PSN‐G were used as standards for determining the degree of conversion by means of HPLC analysis. Using the reagents which are most widely applied for labeling of glycans, NaBH3CN in THF and aqueous citric acid (40 °C, 18 h), [31] we observed high degrees of recovery of 90–120 % for glucose and each of these dyes (see Supporting Information for details).
PAGE Electrophoresis
We labeled commercially available maltodextrin oligosaccharides ladder (G2 to G15, Carbosynth) with new dyes PCN and PAZ, previously reported PSN and PSU, as well as APTS. We used a water‐free protocol for reductive amination, [18] in which the excess of free dye had been removed prior to electrophoresis by flash chromatography on reversed phase (15C18AQ‐F0025 cartridge). Then the mixtures of conjugates were analyzed by PAGE electrophoresis according to P. Jackson [32] and separated into individual fluorescent zones (Figure 5). The runs with APTS (q=−3, SO3H) and PCN (q=−3, SO2NHCN) are shown in lanes 1 and 2, and the runs with phosphorylated six‐charged PSN, PSU and PAZ dyes (q=−6, OPO(OH)2) in lanes 3–5. The conjugates migrate according to their charge‐to‐mass ratio, or, more strictly, the charge‐to‐hydrodynamic volume. [21] The bands of individual saccharides were well resolved and detectable up to G12. APTS and PCN in lanes 1 and 2 have the same net electrical charge (q=−3), but due to slightly higher molecular mass, PCN conjugates move slower. PCN dye is fully ionized at pH 8.3. Owing to much higher brightness, PCN dye has perspective as an alternative or complementary reagent (in the sense of separation performance and selectivity towards isomeric carbohydrates) to APTS.
Figure 5.
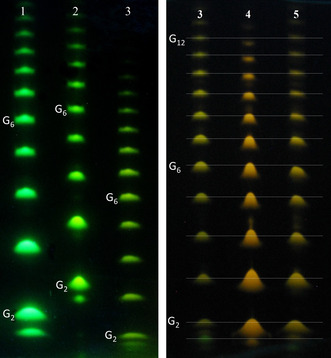
PAGE plates (migration from “north” to “south”, pH 8.3) show maltodextrin ladder labeled with negatively charged aminopyrenes from Figure 1 (fluorescent spots under excitation with 365 nm light). Left: triply charged APTS and PCN (lanes 1 and 2, respectively), and PSN (lane 3) with 6 charges; right: triply phosphorylated pyrenes PSN, PAZ and PSU (lanes 3, 4, and 5, respectively). Weak horizontal lines enable the positions of spots to be compared.
Conjugates of all phosphorylated dyes (Figure 5, lanes 3–5) with 6 negative charges move faster than APTS and PCN derivatives having three negative charges (lanes 1, 2). The m/z ratio of PAZ is not lower than m/z values of PSN and PSU (Figure 1), but PAZ (lane 4) shows higher mobility in conjugates. It is visible for heavier oligomers (G8–G12) on the right panel of Figure 5. Due to the gel's sieving effect, electrophoretic mobility of a labeled sugar depends on the size (shape) of the molecule. [21] Azetidine‐containing PAZ dye has 3 cycles and therefore, it is more compact has less “conformational freedom” than linear sulfonamides (PSN) or alkyl sulfones (PSU).
A desialysation study was performed for PCN dye. The loss of sialic acid residues often occurs if glycans are kept for longer times in acidic media at elevated temperatures. [28] Two commercially available 3′‐ and 6′‐sialyllactoses as well as lactose were labeled with PCN. To show the separation power of the dye, we analyzed the reaction mixtures by HPLC and PAGE. We measured the peak areas of the sialylated and desialylated (lactose) conjugates in HPLC. A slight degree of desialysation was observed (ca. 5 %; see Supporting Information for details).
Capillary Electrophoresis with Laser‐Induced Fluorescence Detection (CE‐LIF)
Commercial DNA sequencers represent standard devises for glycan analysis. [7] The DNA analyzers are equipped with LIF detectors and excitation sources. These devises offer the possibility of multicolor detection. [33] There are 5 color channels, blue, green, yellow, orange and red, reserved for four nucleotides and a reference (DNA ladder labeled with a red‐emitting dye). We used the ABI 3730 XL DNA Analyzer platform having a CE‐LIF unit and a laser diode emitting 503 nm light. Figure 6 illustrates the CE‐LIF results obtained with glucose oligomers labeled with APTS (ca. 1 pmol), PCN (ca. 1 pmol) and PSU (ca. 0.1 pmol) dyes. The PCN dye provides ca. fourfold better signal level than APTS, but somewhat higher cross‐talk with the “green” detection window. If the dye is used alone in the application (this is now the case with APTS), the cross‐talk with any detection windows, except the red one, may be tolerated. The PSU dye in the green detection channel provides the similar signal level as PCN. However, nearly half of the emission “leaks” into the yellow slot.
Figure 6.
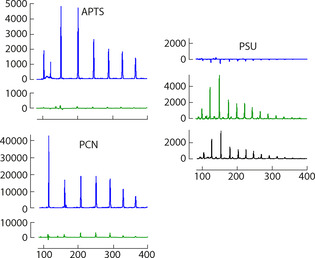
CE‐LIF of a maltodextrin ladder labeled with APTS (1 pmol), PCN (1 pmol) and PSU (0.1 pmol) dyes. For structures, see Figure 1; for PAGE electrophoresis, see Figure 5; x‐axis: retention time (a.u.), y‐axis: emission intensity (a.u.). Blue, green and yellow detection channels are shown with the corresponding colors. The averaged relative peak widths at half‐maxima are 1.42, 1.35 and 1.00 for APTS, PCN and PSU conjugates, respectively.
With the color settings standard for a DNA analyzer, the PSU dye has a non‐zero cross‐talk with the “blue” detection window (positive or negative signal; it depends on concentration of PSU conjugates). The recalibration of the color settings of a DNA analyzer is possible by using a new set of fluorescent dye conjugates and creating a new matrix file. [33] For the PSU dye, that would enable to collect more light, which is now distributed between green and yellow detectors, and probably fully avoid the cross‐talk with the APTS detection window. If so, PSU or acridine dyes [15] could be used not only as brighter or “rapid” (swifter moving) alternatives to APTS (which is now possible), but also for creating new internal standards for glycan analysis based on natural carbohydrates and compatible with APTS in one run.
Conclusion
We introduced a compact and negatively charged acceptor group, N‐(cyanamino)sulfonyl, to dye design and demonstrated its influence on the absorption and emission spectra of the “push‐pull” chromophores (exemplified by 1,3,6‐tris[(cyanamino)sulfonyl]‐8‐aminopyrene). N‐(Cyanamino)sulfonyl or O‐phosphorylated (3‐hydroxyazetidine)‐N‐sulfonyl residues are electron acceptors and auxochromes. Three of them confer three or six negative charges (pH ≥8) to the dye, provide low m/z ratios, high mobilities in electric field and the red‐shifted absorption and emission spectra. Aminopyrenes were decorated with these sulfonamides, conjugated with reducing sugars and compared with the corresponding APTS derivatives, as references. We found that the brightness of the new dyes is superior to APTS. Conjugates of APTS, PCN and PSU dyes were analyzed by means of CE‐LIF in a DNA sequencer. An average peak width at half maximum is ca. 30 % smaller for PSU‐conjugates, compared with APTS‐ or PCN‐labeled sugars: an advantage for an analytical reagent. The PCN derivatives were detected in the blue channel (the same as for APTS) with approximately fourfold higher signal intensity than APTS derivatives (at equal amounts); a low cross‐talk with a green detection window was detected. The signal of PSU derivatives was equally distributed between the green and yellow detectors. We expect that the new color calibration (which is technically possible) will further improve the signal intensity by collecting emission in one detection window; e.g., by a factor of 2 for PSU detection. By using new fluorescent dyes for glycans, we plan to recalibrate the color settings of commercial DNA analyzers. The new internal standards based on dye–glycan oligomers of various lengths and detected separately from APTS–glycan conjugates are highly needed for improving the precision of glycan analysis. The “ideal” standards (not yet available) based on natural glycans (not on DNA strands, like now) and co‐injectable with analytes (glycans labeled with APTS or other dye) are expected to properly align the retention times, compensate drift, and make the double calibration unnecessary. Thus, new dyes superior to APTS or complementary to it (in emission, electric charge and mobility) are expected to accelerate the progress in glycomics.
Conflict of interest
The authors declare no conflict of interest.
Supporting information
As a service to our authors and readers, this journal provides supporting information supplied by the authors. Such materials are peer reviewed and may be re‐organized for online delivery, but are not copy‐edited or typeset. Technical support issues arising from supporting information (other than missing files) should be addressed to the authors.
Supplementary
Acknowledgements
We are grateful to Dr. Michael John, Dr. Holm Frauendorf and their co‐workers (Institut für Organische und Biomolekulare Chemie, Georg‐August‐Universität Göttingen) for recording high‐resolution NMR and mass spectra. We gratefully acknowledge the excellent assistance of Jürgen Bienert with HPLC analysis (MPI BPC). Open access funding enabled and organized by Projekt DEAL.
E. A. Savicheva, J. Seikowski, J. I. Kast, C. R. Grünig, V. N. Belov, S. W. Hell, Angew. Chem. Int. Ed. 2021, 60, 3720.
References
- 1. Pinho S. S., Reis C. A., Nat. Rev. Cancer 2015, 15, 540–555. [DOI] [PubMed] [Google Scholar]
- 2. Dalziel M., Crispin M., Scanlan C. N., Zitzmann N., Dwek R. A., Science 2014, 343, 1235681. [DOI] [PubMed] [Google Scholar]
- 3. de Haan N., Yang S., Cipollo J., Wuhrer M., Nat. Rev. Chem. 2020, 4, 229–242. [DOI] [PubMed] [Google Scholar]
- 4. Ruhaak L. R., Xu G., Li Q., Goonatilleke E., Lebrilla C. B., Chem. Rev. 2018, 118, 7886–7930. [DOI] [PMC free article] [PubMed] [Google Scholar]
- 5. Ikegami T., J. Sep. Sci. 2019, 42, 130–213. [DOI] [PubMed] [Google Scholar]
- 6. Mantovani V., Galeotti F., Maccari F., Volpi N., Electrophoresis 2018, 39, 179–189. [DOI] [PubMed] [Google Scholar]
- 7. Lu G., Crihfield C. L., Gattu S., Veltri L. M., Holland L. A., Chem. Rev. 2018, 118, 7867–7885. [DOI] [PMC free article] [PubMed] [Google Scholar]
- 8. Laroy W., Contreras R., Callewaert N., Nat. Protoc. 2006, 1, 397–405. [DOI] [PubMed] [Google Scholar]
- 9.
- 9a. Villadsen K., Martos-Maldonado M. C., Jensen K. J., Thygesen M. B., ChemBioChem 2017, 18, 574–612; [DOI] [PubMed] [Google Scholar]
- 9b. Shilova N. V., Bovin N. V., Russ. J. Bioorg. Chem. 2003, 29, 309–324. [Google Scholar]
- 10.For APTS in CGE-LIF, see:
- 10a. Evangelista R. A., Liu M.-S., Chen F.-T. A., Anal. Chem. 1995, 67, 2239–2245; [Google Scholar]
- 10b. Chen F.-T. A., Evangelista R. A., Electrophoresis 1998, 19, 2639–2644; [DOI] [PubMed] [Google Scholar]
- 10c. Chen F.-T. A., Dobashi T. S., Evangelista R. A., Glycobiology 1998, 8, 1045–1052; [DOI] [PubMed] [Google Scholar]
- 10d. Ruhaak L. R., Hennig R., Huhn C., Borowiak M., Dolhain R. J. E. M., Deelder A. M., Rapp E., Wuhrer M., J. Proteome Res. 2010, 9, 6655–6664; [DOI] [PubMed] [Google Scholar]
- 10e. Kawai T., Ota N., Imasato A., Shirasaki Y., Otsuka K., Tanaka Y., J. Chromatogr. A 2018, 1565, 138–144. [DOI] [PubMed] [Google Scholar]
- 11.For APTS in CE-MS, see:
- 11a. Suzuki H., Müller O., Guttman A., Karger B., Anal. Chem. 1997, 69, 4554–4559; [DOI] [PubMed] [Google Scholar]
- 11b. Callewaert N., Geysens S., Molemans F., Contreras R., Glycobiology 2001, 11, 275–281; [DOI] [PubMed] [Google Scholar]
- 11c. Bunz S.-C., Cutillo F., Neusüß C., Anal. Bioanal. Chem. 2013, 405, 8277–8284. [DOI] [PubMed] [Google Scholar]
- 12. Feng H.-T., Li P., Rui G., Stray J., Khan S., Chen S.-M., Li S. F. Y., Electrophoresis 2017, 38, 1788–1799. [DOI] [PubMed] [Google Scholar]
- 13. Krenkova J., Dusa F., Cmelik R., Electrophoresis 2020, 41, 684–690. [DOI] [PubMed] [Google Scholar]
- 14.
- 14a. Kundu K., Knight S. F., Willett N., Lee S., Taylor W. R., Murthy N., Angew. Chem. Int. Ed. 2009, 48, 299–303; [DOI] [PMC free article] [PubMed] [Google Scholar]; Angew. Chem. 2009, 121, 305–309; [Google Scholar]
- 14b. Carlini L., Benke A., Reymond L., Lukinavičius G., Manley S., ChemPhysChem 2014, 15, 750–755. [DOI] [PubMed] [Google Scholar]
- 15. Fomin M. A., Seikowski J., Belov V. N., Hell S. W., Anal. Chem. 2020, 92, 5329–5336. [DOI] [PMC free article] [PubMed] [Google Scholar]
- 16. Hill E. K., de Mello A. J., Birrell H., Charlwood J., Camilleri P., J. Chem. Soc. Perkin Trans. 2 1998, 2337–2341. [Google Scholar]
- 17. Krenkova J., Liskova M., Cmelik R., Vigh G., Foret F., Anal. Chim. Acta 2020, 1095, 226–232. [DOI] [PubMed] [Google Scholar]
- 18. Savicheva E. A., Mitronova G. Y., Thomas L., Böhm M. J., Seikowski J., Belov V. N., Hell S. W., Angew. Chem. Int. Ed. 2020, 59, 5505–5509; [DOI] [PMC free article] [PubMed] [Google Scholar]; Angew. Chem. 2020, 132, 5547–5551. [Google Scholar]
- 19. Supuran C. T., Scozzafava A., Briganti F., J. Enzyme Inhib. 1999, 14, 289–306. [DOI] [PubMed] [Google Scholar]
- 20. Sabnis R. W. in Handbook of Fluorescent Dyes and Probes, Wiley, Hoboken, 2015, chap. 22, p. 63. [Google Scholar]
- 21. Mittermayr S., Guttman A., Electrophoresis 2012, 33, 1000–1007. [DOI] [PubMed] [Google Scholar]
- 22. Blahun O. P., Rozhenko A. B., Rusanov E., Zhersh S., Tolmachev A. A., Volochnyuk D. M., Grygorenko O. O., J. Org. Chem. 2020, 85, 5288–5299. [DOI] [PubMed] [Google Scholar]
- 23. Hansch C., Leo A., Taft R. W., Chem. Rev. 1991, 91, 165–195. [Google Scholar]
- 24.
- 24a. Bureš F., RSC Adv. 2014, 4, 58826–58851; [Google Scholar]
- 24b. Pigot C., Noirbent G., Brunel D., Dumur F., Eur. Polym. J. 2020, 133, 109797. [Google Scholar]
- 25.
- 25a. Taft R. W., Price E., Fox I. R., Lewis I. C., Andersen K. K., Davis G. T., J. Am. Chem. Soc. 1963, 85, 3146–3156; [Google Scholar]
- 25b. Taft R. W., J. Phys. Chem. 1960, 64, 1805–1815; [Google Scholar]
- 25c. Taft R. W., Price E., Fox I. R., Lewis I. C., Andersen K. K., Davis G. T., J. Am. Chem. Soc. 1963, 85, 709–724. [Google Scholar]
- 26.
- 26a. Cisse L., Djande A., Capo-Chichi M., Khonté A., Bakhoum J.-P., Delattre F., Yoda J., Saba A., Tine A., Aaron J.-J., J. Phys. Org. Chem. 2020, 33, e4014, 10.1002/poc.4014; [DOI] [Google Scholar]
- 26b. Marchesi A., Brenna S., Ardizzoia G. A., Dyes Pigm. 2019, 161, 457–463; [Google Scholar]
- 26c. Yamaguchi E., Shibahara F., Murai T., J. Org. Chem. 2011, 76, 6146–6158. [DOI] [PubMed] [Google Scholar]
- 27. Rouxel C., Le Droumaguet C., Macé Y., Clift S., Mongin O., Magnier E., Blanchard-Desce M., Chem. Eur. J. 2012, 18, 12487–12497. [DOI] [PubMed] [Google Scholar]
- 28. Guttman A., Chen F.-T. A., Evangelista R. A., Cooke N., Anal. Biochem. 1996, 233, 234–242. [DOI] [PubMed] [Google Scholar]
- 29.
- 29a. Evangelista R. A., Chen F.-T. A., Guttman A., J. Chromatogr. A 1996, 745, 273–280; [Google Scholar]
- 29b. Evangelista R. A., Guttman A., Chen F.-T. A., Electrophoresis 1996, 17, 347–351. [DOI] [PubMed] [Google Scholar]
- 30. Reider B., Szigeti M., Guttman A., Talanta 2018, 185, 365–369. [DOI] [PubMed] [Google Scholar]
- 31. Szabo Z., Guttman A., Rejtar T., Karger B. L., Electrophoresis 2010, 31, 1389–1395. [DOI] [PMC free article] [PubMed] [Google Scholar]
- 32. Jackson P., Biochem. J. 1990, 270, 705–713. [DOI] [PMC free article] [PubMed] [Google Scholar]
- 33.ABI PRISM®, 310 Genetic Analyzer, User's Manual, 2010 Applied Biosystems, pp. 2.20–2.22.
Associated Data
This section collects any data citations, data availability statements, or supplementary materials included in this article.
Supplementary Materials
As a service to our authors and readers, this journal provides supporting information supplied by the authors. Such materials are peer reviewed and may be re‐organized for online delivery, but are not copy‐edited or typeset. Technical support issues arising from supporting information (other than missing files) should be addressed to the authors.
Supplementary