Abstract
Purpose
Blood–brain barrier (BBB) disruption is commonly measured with DCE‐MRI using continuous dynamic scanning. For precise measurement of subtle BBB leakage, a long acquisition time (>20 minutes) is required. As extravasation of the contrast agent is slow, discrete sampling at strategic time points might be beneficial, and gains scan time for additional sequences. Here, we aimed to explore the feasibility of a sparsely sampled MRI protocol at 7 T.
Methods
The scan protocol consisted of a precontrast quantitative T1 measurement, using an MP2RAGE sequence, and after contrast agent injection, a fast‐sampling dynamic gradient‐echo perfusion scan and two postcontrast quantitative T1 measurements were applied. Simulations were conducted to determine the optimal postcontrast sampling time points for measuring subtle BBB leakage. The graphical Patlak approach was used to quantify the leakage rate (Ki) and blood plasma volume (vp) of normal‐appearing white and gray matter.
Results
The simulations showed that two postcontrast T1 maps are sufficient to detect subtle leakage, and most sensitive when the last T1 map is acquired late, approximately 30 minutes, after contrast agent administration. The in vivo measurements found Ki and vp values in agreement with other studies, and significantly higher values in gray matter compared with white matter (both p = .04).
Conclusion
The sparsely sampled protocol was demonstrated to be sensitive to quantify subtle BBB leakage, despite using only three T1 maps. Due to the time‐efficiency of this method, it will become more feasible to incorporate BBB leakage measurements in clinical research MRI protocols.
Keywords: 7T, BBB leakage, DCE‐MRI, T1 mapping
1. INTRODUCTION
An intact healthy blood–brain barrier (BBB) maintains the brain homeostasis by preventing neurotoxins from entering the brain tissue, ensuring delivery of nutrients and removal of waste products. 1 Disruption of the BBB leads to an increased permeability, allowing unwanted biomolecules to leak from the cerebral circulation into the brain parenchyma. Previous studies have shown that disruption of the BBB is associated with developing cerebral diseases, such as Alzheimer’s disease, multiple sclerosis, stroke, and dementia. 1 , 2
The commonly used in vivo imaging method to quantify BBB permeability is DCE‐MRI. 3 , 4 During DCE‐MRI, a contrast agent (CA) is injected intravenously, while continuously acquiring T1‐weighted images with a high temporal resolution. 5 The CA leakage, resulting from a disrupted BBB, can be detected on the T1‐weighted images, as CA molecules lower the longitudinal relaxation time (T1) of the brain tissue and therefore affect the MR signal intensity. These changes in signal intensity can be converted to CA concentrations, and these concentrations can be used as input for a suitable pharmacokinetic model to calculate the leakage rate. However, despite becoming widely applied at various clinical research sites, measurements of subtle BBB leakage are performed with a large variation in DCE‐ MRI acquisition settings, such as temporal and spatial resolution, and total acquisition time, which complicates the comparison among the leakage rate values reported. 4 , 6 Recommendations for a more standardized DCE‐ MRI protocol have been published; however, further improvements need to be made regarding the time‐efficiency of subtle BBB leakage measurements. 4
For measurements of subtle leakage rates, with slow extravasation of CA, it is recommended to use a long acquisition time (> 20 minutes), to ensure that a sufficient amount of CA has leaked into the extravascular space of the brain parenchyma. 4 , 6 , 7 , 8 Therefore, the signal intensity changes in brain tissue are relatively small between two consecutive T1‐weighted images, which are typically acquired within 30‐60 seconds after each other. Considering these slow signal intensity changes, it might be sufficient to sample only a few data points over a longer time interval, with a higher SNR, rather than a continuous dynamic measurement, in which each time point has a lower SNR and spatial resolution, as performed in conventional DCE‐MRI. Moreover, measuring at only two time points after contrast injection could gain scanning time, which can be used for additional sequences, such as contrast‐enhanced MRA, fluid‐attenuated inversion recovery (FLAIR), DTI, or SWI. 9 , 10 , 11
Another challenge for comparing leakage rates measured with different DCE‐protocols on various scanners is the machine‐dependent implementation of pulse sequences. However, using quantitative T1 measurements for the calculation of the CA concentration, rather than signal intensity changes, the influence of interscanner inconsistencies, coil inhomogeneities, scanner drift, and acquisition parameter details on BBB leakage‐rate measurements should be reduced. 4 , 12 , 13 , 14
In this proof‐of‐principle study, we explore the feasibility of a sparsely time‐sampled DCE‐protocol, consisting of a limited number of quantitative T1 maps, for the detection and quantification of subtle BBB leakage at 7 T MRI. Computer simulations were performed to determine the most optimal sampling time points of the postcontrast T1 measurements. In vivo measurements were performed in subjects without neurological conditions to measure BBB leakage rates (Ki) and blood plasma volume fractions (vp) in white matter (WM) and gray matter (GM), and to demonstrate the possibilities and settings of the time points of the sparsely time‐sampled in vivo MRI protocol.
2. METHODS
2.1. Computer simulations
Computational simulations were performed in MATLAB (R2016a; MathWorks, Natick, MA) to investigate two properties of the sparsely time‐sampled protocol: (1) minimum number of T1 maps required for leakage detection and (2) the optimal time interval between two postcontrast T1 maps.
In each simulation, realistic brain tissue concentration curves over time were generated by the extended Tofts model. 15 This model was used because it allows CA transfer back into the vascular compartment, which may become relevant for long scan periods. Based on our in vivo results, the “true” leakage rate (Ki, true) was chosen to be 5.0 × 10⁻⁴ min−1 for WM and 8.0 × 10⁻⁴ min−1 for GM, and vp was chosen to be 0.036 and 0.049, respectively. Furthermore, to simulate an impaired BBB, 20% higher Ki values were used as input, which was approximately the mean effect size reported by Montagne et al. 16 The vascular input function, based on the concentration in the superior sagittal sinus, and the volume fraction of the extravascular extracellular space (ve = 0.05) were given as additional input to the model. 7 Subsequently, normally distributed noise of 2.0 × 10⁻³ mM was added to the brain tissue concentration curves to mimic noise that was present in our in vivo data.
For each set of input parameters, the simulations were repeated with 250,000 runs. The graphical Patlak analysis was used to determine Ki [min−1] and vp, as this method is considered most suitable for quantifying subtle BBB leakages. 7 , 17 , 18 In the Patlak plot, the slope of the regression line represents Ki, and the intercept with the vertical axis resembles vp.
Moreover, the simulations were used to evaluate the precision and accuracy of the Ki obtained with the sparsely time‐sampled protocol. The SD of Ki, calculated, representing the SD over all simulations, was calculated for evaluation of the precision. As a measure of accuracy, the percentage difference, defined as (Ki, calculated/Ki, true − 1) × 100%, was used.
-
1
Minimum number of T1 maps required for leakage detection
The effect on the precision and accuracy of Ki measurements when acquiring different numbers of postcontrast T1 maps, with a minimum of two postcontrast T1 maps, was investigated by performing simulations. The time points of the first and the last T1 map were set to 4 minutes and 20 seconds, and 30 minutes after the start of CA injection, respectively. This final time point considered the benefits of scanning as late as possible against clinical feasibility. The number of additional T1 maps that were acquired in the free time slot was varied from 0 to 5, where 5 corresponds to continuously acquiring T1 maps (i.e. no time gap). The time points of the additional T1 maps were equally distributed between the first and the last T1 map.
-
2
Optimal time interval between two postcontrast T1 maps
The time point of the second postcontrast T1 map was varied in these simulations to obtain the most suitable timing of this scan based on Ki accuracy and precision. This time point was varied from 9 minutes after CA injection to 39 minutes, in steps of 2 minutes. In these simulations, only two postcontrast T1 maps were used.
2.2. In vivo measurements
2.2.1. Study population
Five subjects without neurological conditions (mean age 62 years; range 45‐74 years; 3 males) were included in this study. Exclusion criteria were contraindications for undergoing MRI or gadolinium administration (estimated glomerular filtration rate <30 mL/min, allergy), diabetes mellitus, history of cardiovascular disease, and body mass index > 32 kg/m2.
All subjects provided written informed consent before participating in the study. The study was approved by the local Medical Ethical Committee of Maastricht University Medical Center.
2.2.2. Magnetic resonance imaging acquisition
All subjects were scanned with a 7 T MRI system (Magnetom; Siemens Healthineers, Erlangen, Germany) using a 32‐element channel phased‐array head coil. For improvement of field homogeneity across the brain, dielectric pads were placed on both sides of the neck, proximal to the temporal lobes. 19 The DCE‐protocol consisted of a precontrast T1 map, a 3D fast gradient‐echo T1‐weighted (volumetric interpolated brain examination) sequence, capturing only a small midsagittal part of the brain, to sufficiently sample the CA bolus peak, and two postcontrast T1 maps (see Figures 1 and 2). First, the precontrast T1 map was acquired using an MP2RAGE sequence. 20 Subsequently, the dynamic perfusion scan was applied. After the first three volumes were acquired, the contrast agent (1.0 M gadobutrol, 3 mL for each subject) was injected with an infusion rate of 0.3 mL/s followed by a saline flush (20 mL). Due to the slow infusion rate, the bolus peak appeared approximately at the 30th dynamic scan of the 90 volumes. The first postcontrast T1 map was acquired immediately after the dynamic perfusion scan series, and the last T1 map was acquired approximately 25 minutes after the start of CA injection. The details of these sequences are listed in Table 1. The precontrast T1 map was optimized for optimal delineation of WM and GM, whereas the acquisition parameters of the postcontrast T1 maps enabled an accurate measurement of the expected postcontrast T1 values of brain tissue and blood.
FIGURE 1.
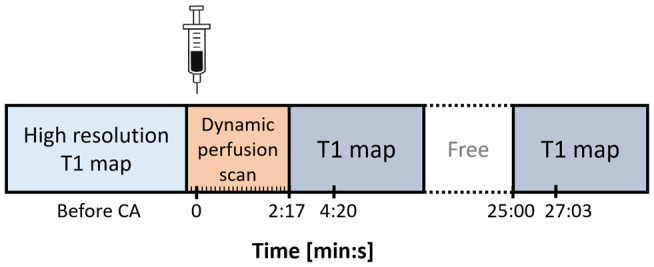
The approximate time points of the sparsely sampled protocol applied for the in vivo measurements. The time point of the last T1 map is scheduled to be acquired approximately 25 minutes after contrast agent injection. The second time point for each postcontrast T1 map represents the time point at which the center of the k‐space is acquired
FIGURE 2.
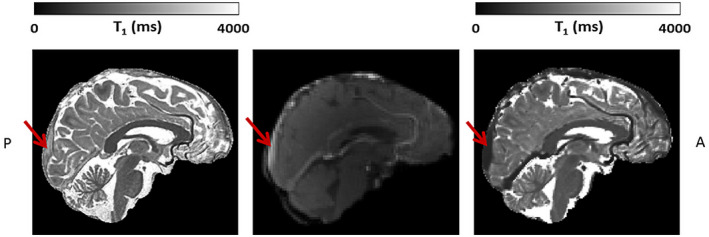
Example slice of the high‐resolution precontrast T1 map (left), one dynamic perfusion slice obtained after contrast agent (CA) administration (middle), and the postcontrast T1 map (right) (all images skull‐stripped). The FOV of the dynamic perfusion scan captures only a small midsagittal part of the brain, containing the superior sagittal sinus (SSS), indicated with the red arrow. Note the lower T1 relaxation time values in the SSS, seen as a high signal intensity after CA administration on the dynamic perfusion scan (middle), and as a lower signal intensity on the T1 map (right)
TABLE 1.
Scan parameters of the two MP2RAGE sequences, which yielded the T1 maps, and the sequence parameters of the dynamic perfusion sequence
| Precontrast MP2RAGE | Postcontrast MP2RAGE | Dynamic perfusion scan | |
|---|---|---|---|
| TR/TE (ms) | 5000/2.47 | 4000/2.32 | 3.7/1.3 |
| TI1/TI2 (ms) | 900/2750 | 900/2200 | N/A |
| α1/α2 (degrees) | 5/3 | 4/5 | 6.5 |
| Voxel size (mm3) | 0.7 × 0.7 × 0.7 | 1.2 × 1.2 × 1.2 | 2.0 × 2.0 × 2.0 |
| FOV (mm3) | 168 × 224 × 224 | 192 × 230 × 230 | 192 × 192 × 32 |
| Total acquisition time (minutes) | 8:00 | 4:16 | 2:47 |
| GRAPPA factor | 3 | 3 | 3 |
| Partial Fourier | 6/8 | 6/8 | 6/8 |
| Number of volumes | 1 | 1 | 90 |
| Time interval (seconds) | N/A | N/A | 1.86 |
To facilitate optimal segmentation of WM and GM, a T2‐weighted FLAIR sequence (TR/TE/TI = 8000/303/2330 ms; FOV = 192 × 192 × 176 mm3; voxel size = 1 × 1 × 1 mm3; acquisition time = 6:59 minutes) was applied in between the two postcontrast T1 maps.
2.2.3. Data analysis
All images were spatially registered to the first postcontrast T1 map (FMRIB’s linear image registration tool, version 6.0) to correct for head displacements. 21 The precontrast T1 map and the FLAIR images were used as input for automated brain tissue segmentation (FreeSurfer version 6.0.5). 22 The output was visually inspected and manually corrected when required.
To obtain the vascular input function, the concentration in the blood was derived from a region of interest with a diameter of approximately 4 mm, which was manually drawn in the superior sagittal sinus. The CA concentration of blood was corrected for the hematocrit level (Hct = 0.45) to obtain the concentration in blood plasma (Cp(t)).
For calculation of the leakage rate maps, pharmacokinetic analysis was performed using the graphical Patlak approach. The tissue concentrations were obtained directly from the T1 maps, as the change in the longitudinal relaxation rate (ΔR1) is linearly related to the CA concentration. 14 The relaxivity constant was set to 4.2 mM−1s−1 for 7 T. 23 The blood plasma curve was fitted by a mono‐exponential curve through the last data point of the concentration time curve of the dynamic perfusion scan, and the two MP2RAGE data points.
The Ki and vp were calculated for all brain voxels, derived from the Patlak plot; and for WM and GM regions the average values were calculated. To correct for outliers, all voxel Ki and vp values in these regions of interest within the 95% confidence interval were included in the analysis.
2.2.4. Statistics
The Ki and vp values were compared between WM and GM using a nonparametric two‐sided paired Wilcoxon signed‐rank test, with a significance level α of 0.05.
3. RESULTS
3.1. Computer simulations
-
1
Minimum number of T1 maps required for leakage detection
Figure 3 shows the decrease in SD of the calculated Ki for an increasing number of postcontrast T1 maps for WM (Figure 3A) and GM (Figure 3B). For these two input values of Ki, and impaired WM and GM, the measurement precision, which is inversely proportional to the SD of Ki, decreased by a factor 1.2 when two (SD[Ki] = 6.9 ×10⁻⁴ min−1) instead of seven (SD[Ki] = 5.5 × 10⁻⁴ min−1) postcontrast T1 maps were acquired, the latter representing continuous scanning. The difference in the accuracy of the Ki calculated for seven postcontrast T1 maps versus two postcontrast T1 maps was less than 0.5%. It could be observed that for an increased leakage rate, the accuracy decreased.
-
2
Optimal time interval between two postcontrast T1 maps
FIGURE 3.
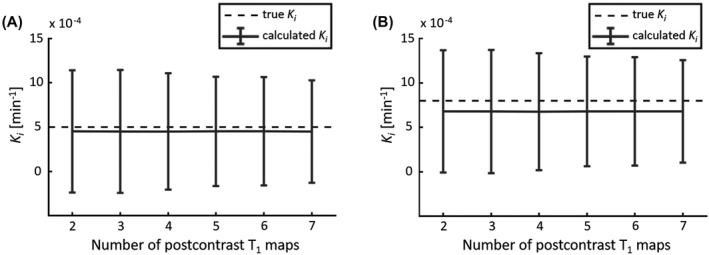
The mean and SD (error bars) of the calculated K i obtained with simulating a varying number of postcontrast T1 maps. The dashed line represents the mean “true” K i value of white matter (WM) (A) and gray matter (GM) (B). Note the relatively large SD, which is due to the high noise level, and the slightly decreasing SD when more T1 maps are acquired
The simulations showed a higher precision in Ki when the last T1 map is acquired at a later time point (Figure 4A,B). This figure also shows that acquiring the last T1 map later than 25 minutes after CA injection yielded a lower SD (< 8.2 × 10⁻⁴ min−1) compared with earlier time points (e.g. 9 minutes after CA injection [SD = 3.2 × 10⁻³ min−1]). The SD still decreases for later time points; however, the results obtained at 25 minutes (8.2 × 10⁻⁴ min−1) and 39 minutes (5.5 × 10⁻⁴ min−1) show a small difference. From Figure 4C,D it can be noted that a negative bias for Ki was found for all time points, when comparing the mean calculated Ki to the true Ki. Due to the incorporated backflux, this effect increased for T1 maps acquired at later time points. Comparison of the underestimation of the calculated Ki for WM from the sampling time points at 25 versus 9 minutes after CA injection showed that the percentage difference was −8.5% versus −4.2%, respectively. For increasing Ki, an increasing underestimation of the calculated Ki was observed. For GM, the percentage difference was −13.3% and −6.1% for 25 minutes and 9 minutes, respectively.
FIGURE 4.
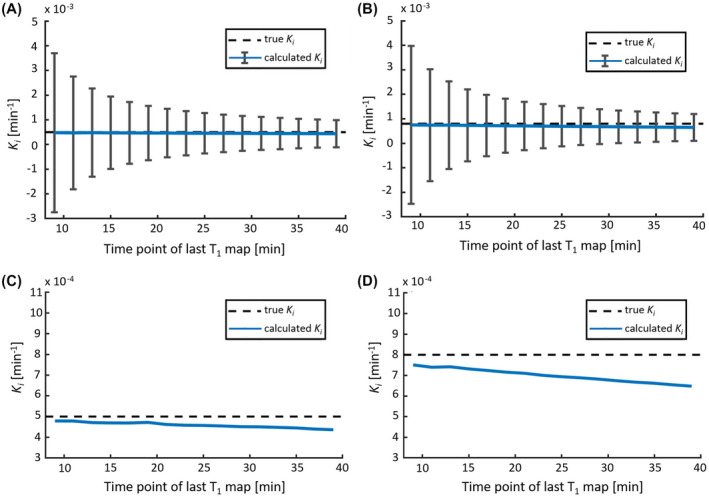
The calculated leakage rate K i as a function of the time point of the second postcontrast T1 map (varying from 9 to 39 minutes after CA administration), which is the last T1 map in this simulation. The mean calculated K i (blue line) with the SD (error bars) for WM (A) and GM (B). Note that the SD decreases when the last T1 map is acquired at a later time point after CA administration. C,D, The mean calculated K i in comparison with the “true” K i (dashed line), as a function of the time point of the last T1 map in more detail for WM (C) and GM (D). Note that the accuracy (negative bias) of K i slightly decreases for a later T1 map, and the accuracy is lower for higher “true” K i values
3.2. In vivo measurements
Representative concentration curves of venous blood, WM, and GM for 1 subject are depicted in Figure 5. A representative histogram of the Ki values of WM and GM for 1 subject is shown in Figure 6. This figure illustrates the variation of voxel Ki values, and shows a higher mean Ki in GM compared with WM.
FIGURE 5.
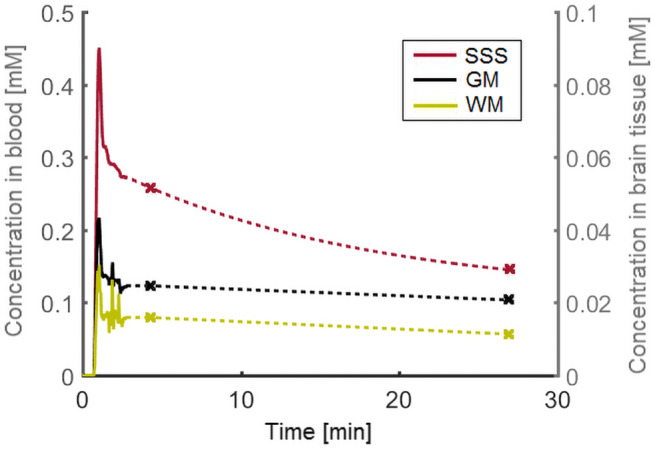
Example of the measured concentration curves for venous blood (SSS), WM, and GM. The solid line represents the sample points obtained with the dynamic perfusion sequence. The two data points derived from the postcontrast T1 maps are indicated with a marker. Note the different concentration axes for blood (left) and tissue (right)
FIGURE 6.
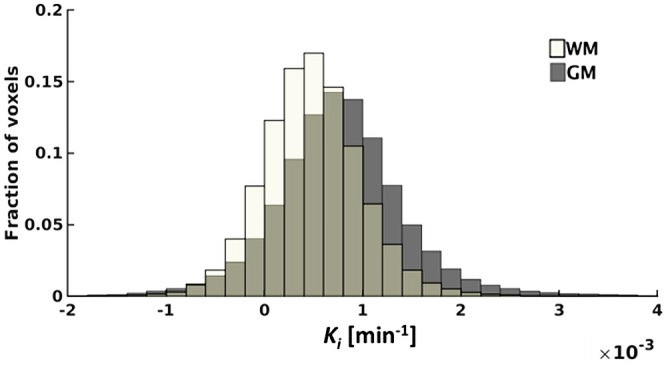
A representative example of the histogram acquired from 1 subject containing the Ki values obtained in WM and GM
The mean Ki in WM over all subjects was 4.8 × 10⁻⁴ (SD 1.6 × 10⁻⁴) min−1, whereas the mean Ki in GM was 8.0 × 10⁻⁴ (SD 1.3 × 10⁻⁴) min−1. Figure 7 shows the Ki values of WM and GM for each subject. Significantly higher Ki values were found in GM compared with WM (p = .04).
FIGURE 7.
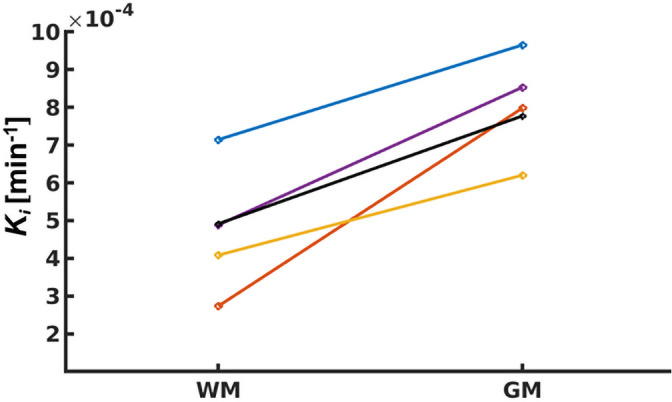
Pair‐wise plot of Ki for WM and GM for each individual subject
The mean vp in WM and GM was 3.4 × 10⁻² (SD 0.5 × 10⁻²) and 4.9 × 10⁻² (SD 0.4 × 10⁻²), respectively. The vp values also showed significantly higher values in GM compared with WM (p = .04).
4. DISCUSSION
In this study, we explored the feasibility of a sparsely time sampled DCE‐protocol using three T1 maps, for the detection and quantification of subtle BBB leakage at 7 T MRI. The conducted computer simulations showed that two postcontrast T1 maps with a most suitable time interval of approximately 20 minutes were able to detect the difference in subtle BBB leakage between normal WM and GM. Furthermore, the in vivo measurements demonstrated that the protocol had sufficient sensitivity to detect subtle leakage in normal‐appearing brain tissue.
The number of studies using DCE‐MRI to measure BBB integrity is increasing. Many studies complete DCE MRI examinations within several minutes (e.g., Chassidim et al 5 ), which is sufficient to measure highly increased BBB permeability, occurring in cerebral diseases such as brain tumors and acute stroke. 3 , 24 , 25 , 26 However, for subtle BBB leakage, which has been linked to various types of cerebrovascular disorders (e.g. dementia, multiple sclerosis, cerebral small vessel disease), a long acquisition time is required, as was shown by simulations and in vivo measurements in previous studies. 4 , 7 , 18 , 27 , 28 The need of a long acquisition time was supported by the findings of the simulations performed in the current study, which showed a better precision for later sample points.
Our study considered the long acquisition time required to detect subtle BBB leakage, and used the slow extravasation of CA to explore whether sparse time sampling would enable the detection of subtle leakage. Sparse sampling has the additional advantage of using the available scanning time more efficiently, as other relevant sequences can be scanned in between those few sample points. Because the CA strongly shortens the T1 relaxation time, the influence of CA on T1‐weighted scans should be evaluated before performing this type of sequences in the free time interval. T2‐weighted and ‐weighted images are less sensitive to the presence of gadolinium, and depending on the research question, can be performed with the presence of contrast agent. For example, Firat et al performed DWI 6‐10 minutes after contrast administration and reported no significant changes in the results. 9 Contrast‐enhanced FLAIR can even facilitate the detection of lesions, 10 and contrast‐enhanced SWI can be beneficial for visualizing deep veins 11 ; however, it can be disadvantageous when focusing on the detection of microbleeds. Adding these sequences may make the BBB measurements more clinically attractive, as it is easier to incorporate these scans in the MRI protocol, without substantially increasing the total scan time.
The leakage measurements were performed by acquiring quantitative T1 maps. Previously, Taheri et al performed a continuous acquisition of a series of quantitative T1 maps with a relatively low temporal resolution of 3 minutes and 30 seconds, instead of the conventionally used dynamic T1‐weighted images with a high temporal resolution. 14 Their study already recognized the advantage of directly converting the T1 values into CA concentrations, without the use of lookup tables or computational conversions, as is custom for T1‐weighted sequences used in conventional DCE‐MRI. Furthermore, T1 mapping has the advantage of being less influenced by interscanner inconsistencies, coil inhomogeneities, scanner drift, and acquisition parameter details, which have been reported to increase the noise for subtle BBB leakage. 14 , 27 , 29 , 30 , 31 Because T1 mapping is more robust than T1‐weighted sequences, this might enable quantitative comparison of the results between different centers. Our proposed protocol combines these benefits with the advantages of an ultrahigh‐field 7 T MRI scanner, which allows the acquisition of high spatial‐resolution images in combination with a high SNR. The spatial resolution obtained in this study (i.e. 1.7 mm3) is higher compared with the typical spatial resolution in conventional DCE‐protocols (i.e. 2‐10 mm3). 4
In this study, a relatively slow CA infusion rate was used, as pilot experiments using a clinically more common injection rate (3.0 mL/s) resulted in signal enhancement with a substantial signal decay for the fast perfusion scan. Such induced signal degradation results in underestimation of the CA concentration. Therefore, we chose to use a lower injection rate of 0.3 mL/s, which minimized any effects.
Computer simulations were conducted to assess the optimal sampling time points for the detection of subtle BBB leakage. As input for these simulations, we used leakage rates of WM and GM in normal brain tissue and leakage rates found in cerebrovascular disease. The values for the latter were based on the results reported by Montagne et al, which corresponded to an increase in Ki of 20%. This range of values enabled investigating the effect of increasing leakage rates to find the most suitable time point. 16
As a first objective of these simulations, the minimum number of sampling points after CA administration required for the detection of BBB leakage was determined by comparing the precision of Ki for varying numbers of T1‐map acquisitions. Compared with the continuous scanning of T1 maps, the acquisition of the minimum of two postcontrast T1 maps resulted in a relatively small decrease in precision (−18%), while the bias was negligible (−0.5 %). It should be noted that a higher SD contributes to more variation in leakage rates between subjects. A lower precision, therefore, potentially leads to an increase in the required sample size to detect group‐level effects. However, this lower precision is still sufficient to detect subtle BBB leakage in WM and GM and the corresponding differences. Considering the trade‐off between obtaining the highest precision as possible for the quantification of subtle BBB leakage, and being able to scan other relevant sequences in between the (DCE) sampling points, we feel the increase in precision therefore does not outweigh the benefits of including additional sequences.
The simulations determining the optimal time interval between the two postcontrast T1 maps showed that it was beneficial to acquire the last T1 map as late as possible, to ensure the most precise leakage rates. This precision increase can be explained by the larger horizontal distance between the two data points in the Patlak plot, due to the longer time interval between the sampling time points. Assuming that the volume of distribution ratio Ct(t)/Cp(t) has the same error, this error will propagate into a larger uncertainty in the slope value (i.e. the Ki) for a shorter time interval. Another advantage of a later time point is that the CA has more time to leak into the tissue, which results in an increased contrast‐to‐noise ratio. 32 However, the simulations showed that when acquiring the T1 map at a later time point, the accuracy decreases (bias). This effect increased when the “true” Ki was higher (e.g. in GM, aging, cerebrovascular disease). This decrease in accuracy can be explained as the Patlak approach ignores backflux of CA into the blood, which will result in an underestimation of Ki. Because the bias was very small, we acquired the last T1 map as late as possible in this study. Most importantly, the simulations show that acquiring a late postcontrast T1 map is much more beneficial to improve the precision than acquiring multiple T1 maps (Figure 3 vs. Figure 4A,B).
The in vivo measurements show promising results for the protocol with sparse time sampling. Realistic concentration curves were obtained for blood, WM and GM, with measured leakage rates in the same order as reported in literature. 6 , 14 , 26 Furthermore, the measurements were sensitive enough to detect significantly higher leakage rates and blood plasma volume fractions in GM compared with WM. These results for v p are in accordance with histology and other in vivo imaging studies, which show a higher vascular volume and vessel surface area in GM compared with WM. 33 , 34 , 35 The higher Ki values found in this study can be explained by the larger vessel surface area in GM, as argued by Varatharaj et al. 36 This study has some limitations. First, a small sample size was used in this study.
However, even given this small sample size, the potential of the sparsely sampled MRI protocol, especially the high sensitivity to low gadolinium concentrations in brain tissue, was shown. Second, due to the relatively long acquisition time of the T1 maps, subject motion was observed in a few subjects. This resulted in blurring and mixing of the signal intensities of WM and GM at the tissue transitions, despite the high spatial resolution obtained with 7 T. Furthermore, the precontrast and postcontrast T1 maps have different spatial resolutions, and therefore will be subject to different levels of partial volume effects. This error propagates to the Ki maps when converting the MR signals to concentrations. When comparing the Ki values of all subjects, these were all in agreement with biological expectations and literature, as discussed previously. Therefore, one could argue that the motion artifacts and partial volume effects mostly influence the local Ki values and are averaged out when quantifying the Ki of larger regions of interest. The effects of subject motion may be further reduced using shorter T1 mapping sequences. The T1 mapping sequence used in this study had an acquisition time of approximately 4 minutes, and yielded one data point. With emerging acceleration techniques, this acquisition time might be reduced to obtain a shorter scan time per time point with comparable spatial resolution and SNR. 37 As an additional advantage, the shortening of acquisition time would expand the available time for other sequences even further.
5. CONCLUSIONS
This proof‐of‐principle study demonstrates that a sparsely time‐sampled DCE‐ MRI protocol, which consists of one precontrast, a dynamic perfusion scan, and two postcontrast T1 maps with a 20‐minute interval, is able to detect subtle BBB leakage in normal‐appearing brain tissue with sufficient accuracy and precision. The time efficiency of this protocol provides possibilities for future studies to incorporate BBB measurements more easily in clinical and research protocols. Moreover, acquiring temporally sampled quantitative T1 maps for leakage measurements, rather than continuous dynamic scanning T1‐weighted images, may reduce the influence of interscanner variability on the leakage‐rate measurements and should facilitate the comparison of data acquired in different centers.
ACKNOWLEDGMENT
We thank the technicians of Scannexus for assisting with the scanning and the administration of the contrast agent.
van den Kerkhof M, Voorter PHM, Canjels LPW, et al. Time‐efficient measurement of subtle blood–brain barrier leakage using a T1 mapping MRI protocol at 7 T. Magn Reson Med. 2021;85:2761–2770. 10.1002/mrm.28629
Marieke van den Kerkhof and Paulien H.M. Voorter contributed equally to this work.
Funding information
European Union’s Horizon 2020 Research and Innovation program; Grant/Award No. 848109
REFERENCES
- 1. Sweeney MD, Zhao Z, Montagne A, Nelson AR, Zlokovic BV. Blood‐brain barrier: from physiology to disease and back. Physiol Rev. 2019;99:21‐78. [DOI] [PMC free article] [PubMed] [Google Scholar]
- 2. Setiadi A, Korim WS, Elsaafien K, Yao ST. The role of the blood‐brain barrier in hypertension. Exp Physiol. 2018;103:337‐342. [DOI] [PubMed] [Google Scholar]
- 3. Larsson HBW, Courivaud F, Rostrup E, Hansen AE. Measurement of brain perfusion, blood volume, and blood‐brain barrier permeability, using dynamic contrast‐enhanced T1 ‐weighted MRI at 3 Tesla. Magn Reson Med. 2009;62:1270‐1281. [DOI] [PubMed] [Google Scholar]
- 4. Thrippleton MJ, Backes WH, Sourbron S, et al. Quantifying blood‐brain barrier leakage in small vessel disease: review and consensus recommendations. Alzheimers Dement. 2019;15:840‐858. [DOI] [PMC free article] [PubMed] [Google Scholar]
- 5. Chassidim Y, Veksler R, Lublinsky S, Pell GS, Friedman A, Shelef I. Quantitative imaging assessment of blood‐brain barrier permeability in humans. Fluids Barriers CNS. 2013;10:9. [DOI] [PMC free article] [PubMed] [Google Scholar]
- 6. Raja R, Rosenberg GA, Caprihan A. MRI measurements of blood‐brain barrier function in dementia: a review of recent studies. Neuropharmacology. 2018;134:259‐271. [DOI] [PMC free article] [PubMed] [Google Scholar]
- 7. Barnes SR, Ng TSC, Montagne A, Law M, Zlokovic BV, Jacobs RE. Optimal acquisition and modeling parameters for accurate assessment of low Ktrans blood‐brain barrier permeability using dynamic contrast‐enhanced MRI: optimal parameters for accurate low permeability DCE‐MRI estimation. Magn Reson Med. 2016;75:1967‐1977. [DOI] [PMC free article] [PubMed] [Google Scholar]
- 8. Haar HJ, Jansen JFA, Jeukens CRLPN, et al. Subtle blood‐brain barrier leakage rate and spatial extent: considerations for dynamic contrast‐enhanced mri . Med Phys. 2017;44:4112‐4125. [DOI] [PubMed] [Google Scholar]
- 9. Fırat AK, Şanlı B, Karakaş HM, Erdem G. The effect of intravenous gadolinium‐DTPA on diffusion‐weighted imaging. Neuroradiology. 2006;48:465‐470. [DOI] [PubMed] [Google Scholar]
- 10. Splendiani A, Puglielli E, Amicis RD, Necozione S, Masciocchi C, Gallucci M. Contrast‐enhanced FLAIR in the early diagnosis of infectious meningitis. Neuroradiology. 2005;47:591‐598. [DOI] [PubMed] [Google Scholar]
- 11. Noebauer‐Huhmann I‐M, Pinker K, Barth M, et al. Contrast‐enhanced, high‐resolution, susceptibility‐weighted magnetic resonance imaging of the brain: dose‐dependent optimization at 3 Tesla and 1.5 Tesla in healthy volunteers. Invest Radiol. 2006;41:249‐255. [DOI] [PubMed] [Google Scholar]
- 12. Hart BL, Taheri S, Rosenberg GA, Morrison LA. Dynamic contrast‐enhanced MRI evaluation of cerebral cavernous malformations. Transl Stroke Res. 2013;4:500‐506. [DOI] [PMC free article] [PubMed] [Google Scholar]
- 13. Heye AK, Thrippleton MJ, Armitage PA, et al. Tracer kinetic modelling for DCE‐MRI quantification of subtle blood–brain barrier permeability. Neuroimage. 2016;125:446‐455. [DOI] [PMC free article] [PubMed] [Google Scholar]
- 14. Taheri S, Gasparovic C, Shah NJ, Rosenberg GA. Quantitative measurement of blood‐brain barrier permeability in human using dynamic contrast‐enhanced MRI with fast T1 mapping. Magn Reson Med. 2011;65:1036‐1042. [DOI] [PMC free article] [PubMed] [Google Scholar]
- 15. Tofts PS. Modeling tracer kinetics in dynamic Gd‐DTPA MR imaging. J Magn Reson Imaging. 1997;7:91‐101. [DOI] [PubMed] [Google Scholar]
- 16. Montagne A, Barnes S, Sweeney M, et al. Blood‐brain barrier breakdown in the aging human hippocampus. Neuron. 2015;85:296‐302. [DOI] [PMC free article] [PubMed] [Google Scholar]
- 17. Patlak CS, Blasberg RG, Fenstermacher JD. Graphical evaluation of blood‐to‐brain transfer constants from multiple‐time uptake data. J Cereb Blood Flow Metab. 1983;3:1‐7. [DOI] [PubMed] [Google Scholar]
- 18. Cramer SP, Larsson HB. Accurate determination of blood‐brain barrier permeability using dynamic contrast‐enhanced T1‐weighted MRI: a simulation and in vivo study on healthy subjects and multiple sclerosis patients. J Cereb Blood Flow Metab. 2014;34:1655‐1665. [DOI] [PMC free article] [PubMed] [Google Scholar]
- 19. Teeuwisse WM, Brink WM, Webb AG. Quantitative assessment of the effects of high‐permittivity pads in 7 Tesla MRI of the brain. Magn Reson Med. 2012;67:1285‐1293. [DOI] [PubMed] [Google Scholar]
- 20. Marques JP, Kober T, Krueger G, van der Zwaag W, Van de Moortele P‐F, Gruetter R. MP2RAGE, a self bias‐field corrected sequence for improved segmentation and T1‐mapping at high field. Neuroimage. 2010;49:1271‐1281. [DOI] [PubMed] [Google Scholar]
- 21. Jenkinson M, Bannister P, Brady M, Smith S. Improved optimization for the robust and accurate linear registration and motion correction of brain images. Neuroimage. 2002;17:825‐841. [DOI] [PubMed] [Google Scholar]
- 22. Fischl B, Salat DH, Busa E, et al. Whole brain segmentation. Neuron. 2002;33:341‐355. [DOI] [PubMed] [Google Scholar]
- 23. Shen Y, Goerner FL, Snyder C, et al. T1 relaxivities of gadolinium‐based magnetic resonance contrast agents in human whole blood at 1.5, 3, and 7 T. Invest Radiol. 2015;50:330‐338. [DOI] [PubMed] [Google Scholar]
- 24. Larsson HBW, Stubgaard M, Frederiksen JL, Jensen M, Henriksen O, Paulson OB. Quantitation of blood‐brain barrier defect by magnetic resonance imaging and gadolinium‐DTPA in patients with multiple sclerosis and brain tumors. Magn Reson Med. 1990;16:117‐131. [DOI] [PubMed] [Google Scholar]
- 25. Vidarsson L, Thornhill RE, Liu F, Mikulis DJ, Kassner A. Quantitative permeability magnetic resonance imaging in acute ischemic stroke: how long do we need to scan? Magn Reson Imaging. 2009;27:1216‐1222. [DOI] [PubMed] [Google Scholar]
- 26. Heye AK, Culling RD, Valdés Hernández MDC, Thrippleton MJ, Wardlaw JM. Assessment of blood–brain barrier disruption using dynamic contrast‐enhanced MRI. A systematic review. Neuroimage Clin. 2014;6:262‐274. [DOI] [PMC free article] [PubMed] [Google Scholar]
- 27. van de Haar HJ, Burgmans S, Jansen JFA, et al. Blood‐brain barrier leakage in patients with early Alzheimer disease. Radiology. 2017;282:615. [DOI] [PubMed] [Google Scholar]
- 28. Wong SM, Jansen JFA, Zhang CE, et al. Blood‐brain barrier impairment and hypoperfusion are linked in cerebral small vessel disease. Neurology. 2019;92:e1669‐e1677. [DOI] [PubMed] [Google Scholar]
- 29. Quarles CC, Bell LC, Stokes AM. Imaging vascular and hemodynamic features of the brain using dynamic susceptibility contrast and dynamic contrast enhanced MRI. Neuroimage. 2019;187:32‐55. [DOI] [PMC free article] [PubMed] [Google Scholar]
- 30. Li K‐L, Zhu X, Zhao S, Jackson A. Blood‐brain barrier permeability of normal‐appearing white matter in patients with vestibular schwannoma: a new hybrid approach for analysis of T 1‐W DCE‐MRI: BBB leakage of WM in VS assessed by DCE. J Magn Reson Imaging. 2017;46:79‐93. [DOI] [PMC free article] [PubMed] [Google Scholar]
- 31. Armitage PA, Farrall AJ, Carpenter TK, Doubal FN, Wardlaw JM. Use of dynamic contrast‐enhanced MRI to measure subtle blood–brain barrier abnormalities. Magn Reson Imaging. 2011;29:305‐314. [DOI] [PMC free article] [PubMed] [Google Scholar]
- 32. Wong SM, Jansen JFA, Zhang CE, et al. Measuring subtle leakage of the blood‐brain barrier in cerebrovascular disease with DCE‐MRI: test‐retest reproducibility and its influencing factors: reproducibility of DCE‐MRI in subtle leakage. J Magn Reson Imaging. 2017;46:159‐166. [DOI] [PubMed] [Google Scholar]
- 33. Lierse W, Horstmann E. Quantitative anatomy of the cerebral vascular bed with especial emphasis on homogeneity and inhomogeneity in small ports of the gray and white matter. Acta Neurol Scand Suppl. 1965;14:15‐19. [DOI] [PubMed] [Google Scholar]
- 34. Rempp KA, Brix G, Wenz F, Becker CR, Gückel F, Lorenz WJ. Quantification of regional cerebral blood flow and volume with dynamic susceptibility contrast‐enhanced MR imaging. Radiology. 1994;193:637‐641. [DOI] [PubMed] [Google Scholar]
- 35. Phelps ME, Huang SC, Hoffman EJ, Kuhl DE. Validation of tomographic measurement of cerebral blood volume with C‐11‐labeled carboxyhemoglobin. J Nucl Med Off Publ Soc Nucl Med. 1979;20:328‐334. [PubMed] [Google Scholar]
- 36. Varatharaj A, Liljeroth M, Darekar A, Larsson HBW, Galea I, Cramer SP. Blood–brain barrier permeability measured using dynamic contrast‐enhanced magnetic resonance imaging: a validation study. J Physiol. 2019;597:699‐709. [DOI] [PMC free article] [PubMed] [Google Scholar]
- 37. Tsao J, Kozerke S. MRI temporal acceleration techniques. J Magn Reson Imaging. 2012;36:543‐560. [DOI] [PubMed] [Google Scholar]


