

Abstract
Alveologenesis is a developmental step involving the expansion of the lung surface area which is essential for gas exchange. The gas exchange process is mediated by alveolar type I (AT1) cells, which are known to be differentiated from alveolar type II (AT2) or bipotent cells. Due to the difficulty of isolating and culturing primary AT1 cells, the mechanism underlying their differentiation is not completely understood. We performed single‐cell RNA sequencing (scRNA‐seq) of fibroblast‐dependent alveolar organoids (FD‐AOs), including human induced pluripotent stem cell (hiPSC)‐derived epithelial cells and fetal lung fibroblasts, and identified hiPSC‐derived AT1 (iAT1) cells. A comparison of the FD‐AOs and fibroblast‐free alveolar organoids showed that iAT1 cells were mainly present in the FD‐AOs. Importantly, the transcriptomes of iAT1 cells were remarkably similar to those of primary AT1 cells. Additionally, XAV‐939, a tankyrase inhibitor, increased iAT1 cells in passaged FD‐AOs, suggesting that these cells were differentiated from hiPSC‐derived AT2 (iAT2) cells through the inhibition of canonical Wnt signaling. Consequently, our scRNA‐seq data allowed us to define iAT1 cells and identify FD‐AOs as a useful model for investigating the mechanism underlying human AT1 cell differentiation from AT2 cells in vitro.
Keywords: alveolar epithelial cells, lung, pluripotent stem cells, single‐cell analysis, Wnt signaling pathway
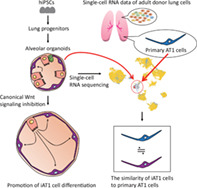
We generated human induced pluripotent stem cell‐derived alveolar type I (iAT1) cells in alveolar organoids (AOs) and showed that the transcriptomes of iAT1 cells were similar to those of primary AT1 cells. We generated iAT1 cells by inhibiting canonical Wnt signaling and propose AOs as a useful tool for understanding the differentiation of alveolar type II (AT2) cells into AT1 cells.
Significance statement.
While the differentiation mechanism of alveolar type II (AT2) cells into alveolar type I (AT1) cells is important for understanding the recovery from lung injury, it remains to be elucidated. This study identified human iPS cell‐derived AT1 (iAT1) cells using single‐cell RNA sequencing. Furthermore, the iAT1 cells in fibroblast‐dependent alveolar organoids (FD‐AOs) resembled primary AT1 cells. Chemical inhibition of canonical Wnt signaling increased iAT1 cells in FD‐AOs, demonstrating a robust in vitro model for the differentiation of AT2 cells into AT1 cells.
1. INTRODUCTION
Alveolar type I (AT1) cells are essential for gas exchange in alveoli and are differentiated from alveolar type II (AT2) cells which produce surfactant proteins. 1 , 2 Recent studies have demonstrated that aberrant differentiation of AT2 cells into AT1 or conductive airway lineage marker‐positive cells (intermediate cells) was associated with pulmonary fibrosis. 3 Thus, it is of paramount importance to understand the pathological and physiological roles of human AT1 cells.
AT1 cells have been previously reported to be differentiated from AT2 cells in two‐dimensional (2D) cultures. 1 Several AT1 cell markers, including advanced glycosylation end‐product specific receptor (AGER), podoplanin (PDPN), caveolin‐1 (CAV1), and aquaporin (AQP5), have been identified. 1 , 2 A mouse alveolar organoid (AO) culture was subsequently reported, demonstrating the differentiation of primary AT2 cells into AT1 cells. 4 In a more recent study, the Wnt‐responsible subpopulation of AT2 cells was reported to have the potential to differentiate into AT1 cells in human AOs. 5 Given that many researchers face great difficulties in obtaining these primary cells, it is necessary to develop a stable human AO model including human induced pluripotent stem cell (hiPSC)‐derived AT1 (iAT1) and AT2 (iAT2) cells. Therefore, it is crucial to define iAT1 cells and evaluate the potential of iAT2 cells to differentiate into iAT1 cells. Methods of generating and culturing iAT2 cells have been previously reported. 6 , 7 , 8 Although Jacob et al described a seminal protocol for the differentiation of iAT2 cells in three‐dimensional (3D) cultures without the need for mesenchymal feeder cells, their alveolar spheroids did not include AT1 cells. 6 In contrast, we reported a method of generating and expanding iAT2 cells in 3D coculture with fetal lung fibroblasts as well as generating iAT2 cells without feeder fibroblasts. 7 , 8 Interestingly, we noted that iAT2 cells cultured with fibroblasts in AOs seemed to include surfactant protein C (SFTPC)− other lineage cells. 7 However, a detailed analysis of these cells was not performed in previous studies. Here, iAT1 cells were defined as the cell population expressing AGER, CAV1, and/or PDPN with low or no expression of SFTPC (marker‐defined iAT1 cells). We identified iAT1 cell cluster highly similar to iAT1 cells in hiPSC‐derived AOs using single‐cell RNA sequencing (scRNA‐seq). Additionally, we demonstrated that the transcriptomic profiles of iAT1 cell cluster were similar to those of primary AT1 cells and that hiPSC‐derived AOs were useful for studying the differentiation mechanism of AT2 cells into AT1 cells.
2. MATERIAL AND METHODS
2.1. hiPSC and fibroblast culture
B2‐3 SFTPC‐GFP reporter hiPSCs 8 were maintained without feeder cells in Essential 8 medium (Thermo Fisher Scientific) under 5% CO2 at 37°C, as previously described. 7 Human fetal lung fibroblasts (HFLF) (17.5 weeks of gestation; DV Biologics; PP002‐F‐1349, lot 121109VA) were cultured under 5% CO2 at 37°C in Dulbecco's Modified Eagle's Medium (DMEM; Nacalai Tesque) supplemented with 10% fetal bovine serum and 50 U/mL penicillin‐streptomycin, and used to generate AOs at passage 9 or 10. Cells were routinely tested for mycoplasma contamination and found to be negative. All human samples were used under the ethical approval of the Institutional Review Board and Ethics Committee of Kyoto University Graduate School and Faculty of Medicine.
2.2. Differentiation of hiPSCs
B2‐3 cells were stepwise differentiated into NKX2‐1+ lung progenitor cells, as previously described. 7 A total of 1.5 × 10⁶ B2‐3 cells were seeded onto a Geltrex‐coated (Thermo Fisher Scientific) 6‐well plate with induction medium containing 100 ng/mL Activin A (100‐14; PeproTech or 47154000; Oriental Yeast Co. Ltd.), 1 μM CHIR99021 (Axon 1386; Axon Medchem), 2% B27 supplement, and 50 U/mL penicillin‐streptomycin in RPMI medium on day 0. Y‐27632 (10 μM; Y5301; LC Laboratories) was supplemented to the induction medium on day 0. The medium was changed every 2 days. Sodium butyrate (193‐01522; Wako) was supplemented to the induction medium at a concentration of 0.25 mM on day 1 and 0.125 mM on days 2 and 4. On day 6, the medium was switched to the basal medium containing Glutamax (Thermo Fisher Scientific), 2% B27 supplement, 0.05 mg/mL l‐ascorbic acid (Wako), 0.4 mM monothioglycerol (Wako), and 50 U/mL penicillin‐streptomycin in DMEM/F12 (Thermo Fisher Scientific) supplemented with 100 ng/mL Noggin (HZ‐1118; Proteintech), and 10 μM SB431542 (198‐16543; Wako). From day 10, cells were cultured in basal medium supplemented with 20 ng/mL BMP4 (HZ‐1045; Proteintech), 0.05 μM all‐trans retinoic acid (R2625; Sigma‐Aldrich), and 3 μM CHIR99021 until day 14. From day 14, cells were cultured in basal medium supplemented with 3 μM CHIR99021, 10 ng/mL FGF10 (100‐26; PeproTech), 10 ng/mL keratinocyte growth factor (KGF; 100‐19; PeproTech), and 20 μM DAPT (043‐33581; Wako) until day 21. NKX2‐1+ cells were isolated using mouse anti‐human CPM (014‐27501; Wako) on day 21, as previously described. 7 For antibody information and dilutions, see Table S9.
2.3. Induction and passages of iAT2 cells in fibroblast‐dependent (FD)‐AOs
A total of 1 × 10⁴ CPMhigh cells and 5 × 10⁵ HFLF were suspended in 100 μL of DCIK medium consisting of 50 nM dexamethasone (D4902; Sigma‐Aldrich), 100 μM 8‐Br‐cAMP (B007; Biolog), 100 μM 3‐isobutyl‐1‐methylxanthine (095‐03413; Wako), 10 ng/mL KGF, 1% B‐27 supplement (Thermo Fisher Scientific), 0.25% bovine serum albumin (BSA; Thermo Fisher Scientific), 15 mM HEPES (Sigma‐Aldrich), 0.8 mM calcium chloride (Wako), 0.1% ITS premix (Corning), and 50 U/mL penicillin‐streptomycin in Ham's F12 (Wako) supplemented with 10 μM Y‐27632 and mixed with an equal volume of growth factor reduced Matrigel (Corning), and placed on 12‐well cell culture inserts. DCIK medium in the lower chamber of the cell culture inserts was changed every other day until day 14. On day 14 ± 1, cells were passaged, as previously described. 7 AOs were dissociated with 0.1% trypsin/EDTA and stained with allophycocyanin (APC)‐conjugated mouse anti‐human EpCAM antibody (130‐113‐260; Miltenyi Biotec) at 4°C for 20 minutes. Next, cells were washed twice, and EpCAM+SFTPC‐GFP+ cells were isolated by fluorescence‐activated cell sorting (FACS) and analyzed or passaged. Furthermore, FACS‐isolated hiPSC‐derived EpCAM+ cells were subjected to scRNA‐seq analysis.
2.4. Fibroblast‐free (FF) induction of iAT2 cells
The FF medium was prepared by supplementing CHIR99021 (3 μM), SB431542 (10 μM), and Y27632 (10 μM) to DCIK medium. A total of 2.0 × 10⁵ isolated CPMhigh progenitor cells were suspended in 250 μL of FF medium and seeded onto a nonadherent surface 96‐well plate (SQ 200100 NA 96; Kuraray) for 3D culture to form cell aggregates. The cell aggregates were centrifuged after 2‐day incubation at 37°C under 5% CO2, and the cell pellets were gently resuspended in 20 μL of growth factor reduced Matrigel and then incubated onto a 12‐well cell culture plate (Corning). After a 20 minutes incubation, 1 mL of FF medium was added to the Matrigel‐embedded cell aggregates and replaced every other day until day 7. For the scRNA‐seq analysis, fibroblast‐free alveolar organoids (FF‐AOs) were dissociated and stained with APC‐conjugated mouse anti‐human EpCAM antibody, and then FACS‐isolated hiPSC‐derived EpCAM+ cells were subjected to scRNA‐seq.
2.5. Drug treatment of fibroblast‐dependent alveolar organoids
Fibroblast‐dependent alveolar organoids (FD‐AOs) passaged two to five times every 2 weeks (P2‐P5) were treated with 0.1% dimethyl sulfoxide (DMSO) or 10 μM XAV‐939 from day 2 to 14, and the medium was replaced every 2 days. For the scRNA‐seq analysis on day 14, FD‐AOs were dissociated and stained with APC‐conjugated mouse anti‐human EpCAM antibody, and then FACS‐isolated hiPSC‐derived EpCAM+ cells were subjected to scRNA‐seq. For flow cytometry, FD‐AOs were dissociated and stained with phycoerythrin‐conjugated mouse anti‐human EpCAM (1:10, 347198; BD Bioscience) and APC‐conjugated rat anti‐human PDPN (1:100, 17‐9381‐42; eBioscience) or APC‐conjugated rat isotype control (1:10, 17‐4321‐41; eBioscience) antibodies in FACS buffer, including 1% BSA and 10 μM Y‐27632 in phosphate buffered saline (PBS; 14249‐24; Nacalai Tesque), at 4°C for 30 minutes. The proportions of each fraction were measured using a FACS Aria III (BD Biosciences) and evaluated using the FlowJo software program (version 10.6.1; BD Bioscience). Fluorescence microscopic images were obtained using a BZ‐X710 microscope (Keyence). The thickness of the AO was measured by taking three measurements per an AO using the Hybrid Cell Count/BZ‐H3 (Keyence), and the average of these three measurements was designated as the thickness of the AO. The average thickness of DMSO‐ or XAV‐939‐treated AOs was quantified using six randomly selected AOs in each condition.
2.6. Differentiation of iAT2 cells into 2D‐iAT1 cells
A total of 8 × 10⁴ FD‐SFTPC+ cells (P2) were seeded onto an iMatrix‐coated (Takara bio) 48‐well plate in DCIK medium supplemented with Y27632 (10 μM). On day 7, cells were dissociated and subjected to scRNA‐seq.
2.7. The scRNA‐seq library preparation and analysis
FACS‐isolated hiPSC‐derived EpCAM+ cells from FD‐AOs (FD‐EpCAM+ cells) or FF‐AOs (FF‐EpCAM+ cells) and 2D‐iAT1 cells were dissociated and prepared at a concentration of 400 cells/μL for single‐cell analyses. Single cells were loaded onto a 10‐ to 17‐μm‐diameter C1 Integrated Fluidic Circuit (#100‐6041; Fluidigm) for FD‐AOs and FF‐AOs and 17‐ to 25‐μm‐diameter C1 Integrated Fluidic Circuit (#100‐5761; Fluidigm) for 2D‐iAT1 cells with the C1 system (Fluidigm). A SMART‐Seq v4 Ultra Low Input RNA kit (635025; Takara Bio) was used for first‐strand cDNA synthesis and amplification in accordance with the manufacturer's instructions. Before first‐strand cDNA synthesis, RNA spike‐in controls (spikes 1, 4, and 7) (AM1780; Thermo Fisher Scientific) were added to cell lysates to evaluate the subsequent quantification according to the manufacturer's instructions. Sequencing libraries were prepared with a Nextera XT kit (Illumina). Sequencing was performed using an Illumina HiSeq2500 sequencer (Illumina). For the Chromium Single Cell Gene Expression Solution Platform (10x Genomics), single cells derived from FD‐AO (P0) were processed using the 3' Library and Gel Bead Kit following the manufacturer's user guide (v2, rev B). Sequencing was performed using an Illumina HiSeq3000 sequencer (Illumina). Bioinformatic analyses are described in the Materials and Methods in Supporting Information.
2.8. Statistical analyses
Statistical analyses were performed using the GraphPad Prism 8 software program (GraphPad). The data are expressed as the mean ± SEM and analyzed using a two‐tailed unpaired Student's t test or analysis of variance (ANOVA; one‐way) as indicated in each figure legend. P values <.05 were considered statistically significant. The exact “n” values are described in the corresponding figure legends.
3. RESULTS
3.1. Identification of iAT1 cells in FD‐AOs
To define the SFTPC− other lineage cells in FD‐AOs, we isolated single cells from two independent FD‐AOs (P2) and performed scRNA‐seq using the Fluidigm C1 system (Figure 1A,B). To define AT2 and AT1 cells by scRNA‐seq, 86 FD‐EpCAM+ cells (P2) and 78 FD‐EpCAM+ cells (P2) treated with DMSO (used as vehicle controls for the subsequent experiment of XAV‐939 treatment described in Figure 7) between days 2 and 14, and 39 FD‐SFTPC+ cells (P2) (GSE90813) 7 were used for downstream analysis. The Uniform Manifold Approximation and Projection (UMAP) analysis showed that each cluster contained two independent FD‐EpCAM+ cells and that those FD‐EpCAM+ cells were divided into five clusters (Figure 1C‐E). Clusters 0, 1, 3, and 4 expressed the alveolar epithelial markers CPM and NKX2‐1 (Figure 1D,E). 8 Cluster 0 was associated with a high expression of SFTPC and SFTPB; thus, it was annotated as FD‐iAT2 cells. 7 Cluster 2 was annotated as ASCL1+ pulmonary neuroendocrine cells (PNECs) based on the high expression of ASCL1. Cluster 3 represented mitotic cells, given the high expression of TOP2A. Cluster 4 was annotated as iAT1 cells based on the high expression of AGER, CAV1, and/or PDPN and low or no expression of SFTPC. 9 Cluster 1 was annotated as NKX2‐1+ cells based on the low or no expression of SFTPC, AGER, CAV1, or PDPN, despite the broad expression of NKX2‐1. The expression of other lineage markers of basal cells, ciliated cells, goblet cells, and club cells was quite low in the FD‐EpCAM+ cells (P2) and FD‐EpCAM+/DMSO cells (P2) (Figure S1A). In addition, pathway enrichment analyses showed that the genes involved in FD‐iAT2 cells were significantly enriched for surfactant homeostasis and surfactant metabolism, which is in line with our previous findings (P = 3.07 × 10⁻¹⁰ and P = 3.62 × 10⁻⁹, respectively) (Figure S1B and Table S1). 7 The genes involved in iAT1 cells were significantly enriched for actin filament‐based process and focal adhesion (P = 5.08 × 10⁻¹⁴ and P = 6.51 × 10⁻⁸, respectively) (Figure S8A and Table S1), and those in mitotic cells were significantly enriched for cell cycle and cell division (P = 1.53 × 10−100 and P = 4.39 × 10−70, respectively) (Figure S1B and Table S1). Furthermore, the heatmap of the top 10 genes for each cluster showed that FD‐iAT2 cells expressed AT2 markers (PGC, SFTPC, SFTPB, and SLC34A2), 10 and iAT1 cells expressed EMP2, an AT1 cell marker 11 (Figure S1C). Consistent with our scRNA‐seq data, cells expressing AT1 markers (AGER, PDPN, HOPX, and/or HT1‐56) were observed in FD‐AOs (P3) (Figures 1F,G and S2A,B). Additionally, immunofluorescence analysis showed that PNEC markers (CHGA, PGP9.5, or SYP) but not basal cell marker (KRT5) were detected in FD‐AOs (P3) (Figure S2A,C,E). NKX2‐1 was expressed in SFTPC− cells in FD‐AOs (P3) (Figure S2D). A trajectory analysis using monocle2 12 excluding mitotic cells as previously described 13 suggested that FD‐iAT2 cells differentiated into iAT1 cells, NKX2‐1+ cells, or ASCL1+ PNECs (Figure S3A‐D). In addition, RNA velocity was calculated using scVelo, 14 which also supported that FD‐iAT2 cells differentiated into iAT1 cells or NKX2‐1+ cells (Figure S3E). Overall, we identified five independent cell types (iAT1, FD‐iAT2, mitotic, NKX2‐1+ cells, and ASCL1+ PNECs) using scRNA‐seq data.
FIGURE 1.
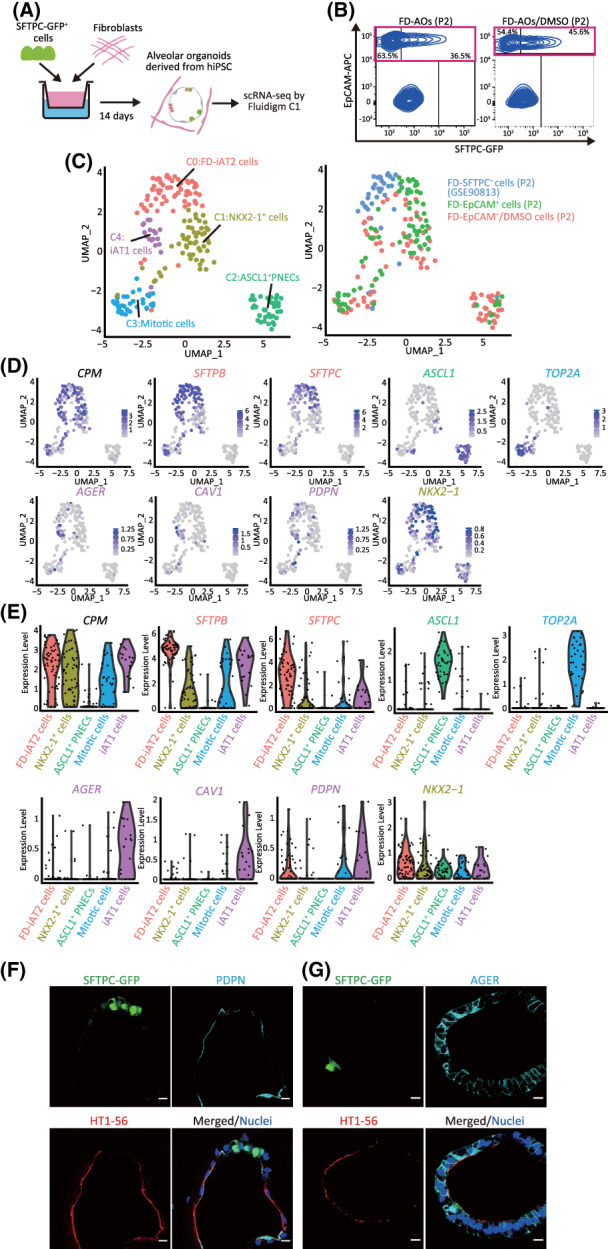
Identification of iAT1 cells in FD‐AOs. A, A schematic representation of the analysis of scRNA‐seq in FD‐AOs. FD‐EpCAM+ cells (P2) were collected from two independent FD‐AOs using FACS, followed by single‐cell isolation using a Fluidigm C1 system and RNA sequencing. Bioinformatics data were processed using Seurat (version 3.1.2) including FD‐SFTPC+ cells (P2) (GSE90813). B, Flow cytometric analyses of FD‐AOs (P2) with or without treatment with DMSO from day 2 to 14 before being subjected to scRNA‐seq. C, UMAP plots displaying cell clusters of FD‐EpCAM+ cells (P2) in FD‐AOs. We defined five major types of FD‐EpCAM+ cells: iAT1 cells, FD‐iAT2 cells, mitotic cells, ASCL1+ PNECs, and NKX2‐1+ cells. D, UMAP plots showing the expression of the selected marker genes; AT1 cells (AGER, CAV1, and PDPN), AT2 cells (SFTPB and SFTPC), mitotic cells (TOP2A), ASCL1+ PNECs (ASCL1), NKX2‐1+ cells (NKX2‐1), and alveolar epithelial cells (CPM). E, Violin plots showing the gene expression distributions of the selected marker genes across cell types. F,G, Immunostaining of AT1 markers (HT1‐56, PDPN, and AGER) and SFTPC‐GFP in FD‐AOs (P3). Scale bars = 10 μm. DMSO, dimethyl sulfoxide; FACS, fluorescence‐activated cell sorting; FD‐AOs, fibroblast‐dependent alveolar organoids; scRNA‐seq, single‐cell RNA sequencing; UMAP, uniform manifold approximation and projection
3.2. iAT1 cells are present in hiPSC‐derived EpCAM + cell population in FD‐AOs but poorly detected in FF‐AOs
Since we previously reported the induction of CPMhigh cells into GFP‐SFTPC+ cells in FF‐AOs, we evaluated the transcriptomic difference between FD‐AOs and FF‐AOs. CPMhigh cells cultured with or without HFLF in 3D cultures were designated as FD‐EpCAM+ cells (P0) or FF‐EpCAM+ cells (P0), respectively. scRNA‐seq of FD‐EpCAM+ cells (P0) and FF‐EpCAM+ cells (P0) was performed (Figure 2A,B). In addition to 86 FD‐EpCAM+ cells (P2), 78 FD‐EpCAM+/DMSO cells (P2), and 39 FD‐SFTPC+ cells (P2), 87 FF‐EpCAM+ cells (P0) and 87 FD‐EpCAM+ cells (P0) were analyzed, as the FD‐EpCAM+ cells (P0) and FF‐EpCAM+ cells (P0) derived from CPMhigh cells were composed of various lineages. Based on the UMAP analysis, we divided the cells into eight clusters, five of which were FD‐iAT2 cells, iAT1 cells, mitotic cells, ASCL1+ PNECs, and NKX2‐1+ cells, which corresponded to those described in Figures 1C, 2C, and 3B (Figures 2C and S4D). Cluster 3 was annotated as FF‐EpCAM+ cells and appeared to be a homogenous population. While pathway enrichment analysis showed that the genes involved in the FF‐EpCAM+ cell cluster were not significantly enriched for surfactant homeostasis and surfactant metabolism compared to the FD‐iAT2 cell cluster, the FF‐EpCAM+ cell cluster included a substantial number of SFTPC+ cells (Figure S4A,C and Table S2). Cluster 0 was annotated as ID1+ cells due to the high expression of ID1 (Figures 2D and S4A). Cluster 7 was annotated as gastric‐like cells due to the expression of TFF1. In addition, a subpopulation of AT2 cells expressing AXIN2, a marker of distal lung regulators, 15 , 16 was detected in FD‐iAT2 and FF‐EpCAM+ cell clusters (Figure S4A). Interestingly, while FD‐EpCAM+ cells (P2) and FD‐EpCAM+/DMSO cells (P2) were present in the iAT1 cell cluster, FD‐EpCAM+ cells (P0) and FF‐EpCAM+ cells (P0) were absent (Figure 2C). To confirm this, we immunostained FD‐AOs (P0 and P3). Surprisingly, both FD‐AOs contained marker‐defined iAT1 cells represented by alveolar organoid cells expressing AGER and/or PDPN protein and low or no SFTPC protein (Figures 2E and S5C). However, as expected, the result of immunostaining indicated only a few marker‐defined iAT1 cells in FF‐AO (P0) (Figure 2E). Therefore, we investigated the proportion of marker‐defined iAT1 cells in each AO cell population. As expected, FD‐EpCAM+ cells (P0), FD‐EpCAM+ cells (P2), and FD‐EpCAM+/DMSO cells (P2) contained many marker‐defined iAT1 cells, while FF‐EpCAM+ cells (P0) contained few (Figure S4B). Next, we compared the transcriptomes of our FD‐EpCAM+ cells (P0 and P2), FD‐EpCAM+/DMSO cells (P2), and FF‐EpCAM+ cells (P0) with those of FF‐EpCAM+ cells (P5) (GSE137799), which were previously published. 17 The expression of AGER, CAV1, and PDPN in iAT1 cells was higher than that in FF‐EpCAM+ cells (P5), which contained mitotic, FF‐iAT2, and CCL20high‐iAT2 cells (Figure S5A). Furthermore, FF‐EpCAM+ cells (P5) did not present marker‐defined iAT1 cells (data not shown). In addition, quantitative real‐time polymerase chain reaction (qRT‐PCR) analysis demonstrated that the FD‐EpCAM+ cells (P2 or P3) expressed a higher level of AGER, PDPN, and HOPX than the FF‐EpCAM+ cells (P0) (Figure S5B). Taken together, iAT1 cells were mostly present among FD‐EpCAM+ cells, while FF‐EpCAM+ cells contained few iAT1 cells.
FIGURE 2.
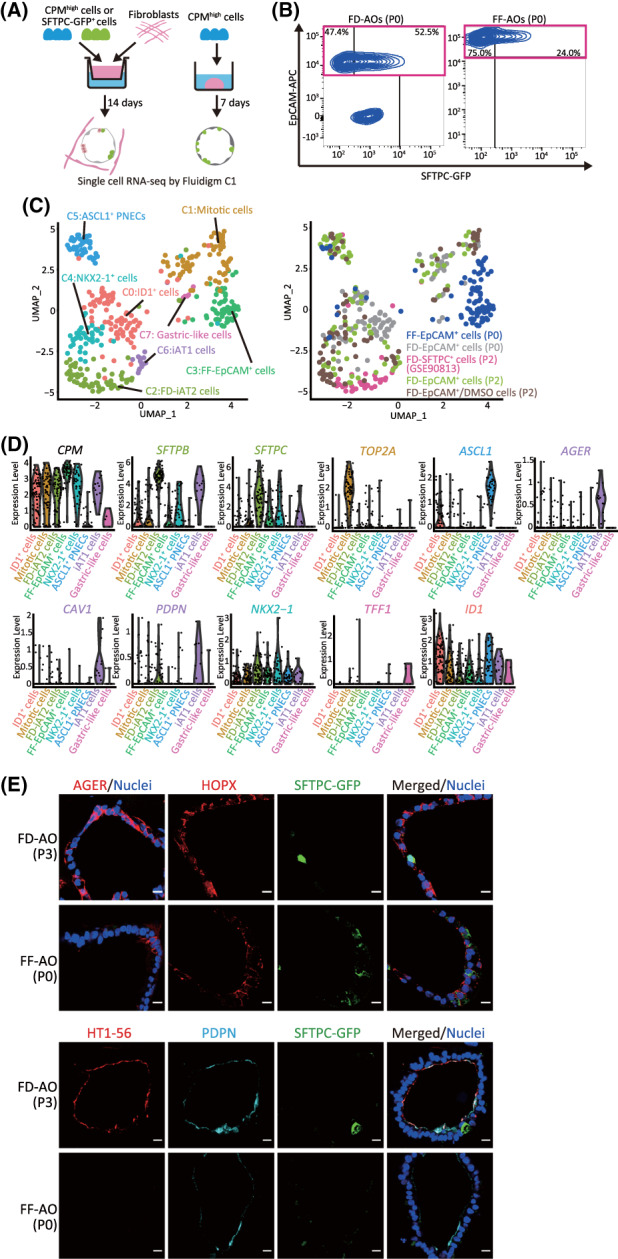
iAT1 cells are present in hiPSC‐derived EpCAM+ cell population in FD‐AOs but poorly detected in FF‐AOs. A, A schematic representation of the analysis of scRNA‐seq in FD‐AOs and FF‐AOs. FD‐EpCAM+ cells (P0) and FF‐EpCAM+ cells (P0) were isolated using FACS. Next, scRNA‐seq was performed and sequencing data, including that of FD‐EpCAM+ cells (P2), FD‐EpCAM+/DMSO cells (P2), and FD‐SFTPC+ cells (P2), were analyzed. B, Flow cytometric analyses of FD‐EPCAM+ cells (P0) and FF‐EpCAM+ cells (P0) used for scRNA‐seq. C, UMAP plots displaying cell clusters in FD‐AOs and FF‐AOs. We defined eight major types of hiPSC‐derived EpCAM+ cells: iAT1 cells, FD‐iAT2 cells, mitotic cells, ASCL1+ PNECs, ID1+ cells, NKX2‐1+ cells, gastric‐like cells, and FF‐EpCAM+ cells. D, Violin plots showing the gene expression distributions of each representative marker gene. E, Immunostaining of AT1 markers (HT1‐56, PDPN, and/or AGER) and SFTPC‐GFP in the FD‐AO (P3) and FF‐AO (P0). Scale bars = 10 μm. DMSO, dimethyl sulfoxide; FACS, fluorescence‐activated cell sorting; FD‐AOs, fibroblast‐dependent alveolar organoids; FF‐AOs, fibroblast‐free alveolar organoids; hiPSC, human induced pluripotent stem cell; scRNA‐seq, single‐cell RNA sequencing; UMAP, uniform manifold approximation and projection
FIGURE 3.
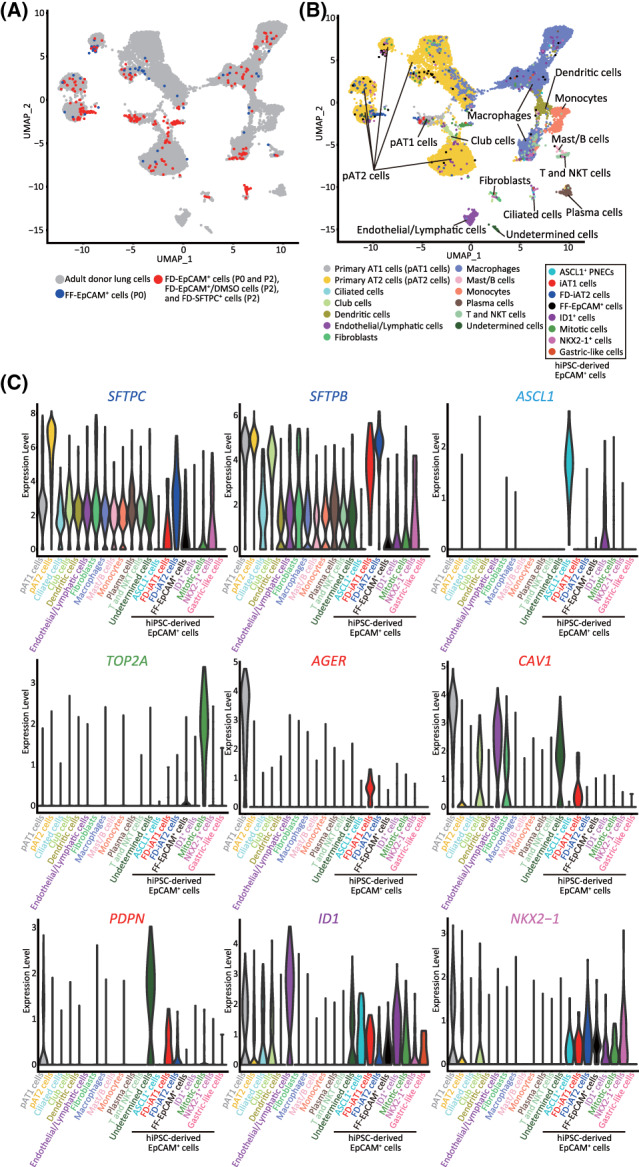
The transcriptomic profiles of iAT1 cells were similar to those of primary AT1 cells. A,B, Combined UMAP plots of single cells from FD‐EpCAM+ cells (P0 and P2), FD‐EpCAM+/DMSO cells (P2), FD‐SFTPC+ cells (P2), and FF‐EpCAM+ cells (P0) and adult donor lung cells extracted from the database (GSE122960) described in Figure S6. Adult donor lung cells are shown in gray, FD‐EpCAM+ cells (P0 and P2), FD‐EpCAM+/DMSO cells (P2), and FD‐SFTPC+ cells (P2) in red, and FF‐EpCAM+ cells (P0) in blue (A). UMAP plots revealed 13 clusters in adult donor lung cells and 8 clusters in FD‐EpCAM+ and FF‐EpCAM+ cells (B). C, Violin plots showing the gene expression distributions of the representative markers indicated in Figure 1C. AT1, alveolar type I
3.3. The transcriptomic profile of iAT1 cells was similar to that of primary AT1 cells
To elucidate the transcriptomic similarities among iAT1 cells and primary AT1 cells, the iAT1 cell scRNA‐seq results were compared to those of primary AT1 cells. According to the cell marker‐based clustering presented in a previous study, 18 we found that 22 254 adult donor lung cells were divided into 12 major types of cells: AT1 cells (AGER and CAV1), AT2 cells (SFTPB and SFTPC), ciliated cells (SNTN1), club cells (SCGB1A1 and SYP2F1), fibroblasts (DCN), macrophages (CD68), monocytes (FCN1), dendritic cells (CLEC10A), endothelial/lymphatic cells (VWF), plasma cells (IGHG4), T and NKT cells (CD3D), and Mast/B cells (MS4A1 and TPSB2) (Figure S6A,B and Table S3). Further UMAP analysis of the combined data sets with adult donor lung cells and FD‐EpCAM+ cells (P0 and P2), FD‐EpCAM+/DMSO cells (P2), FD‐SFTPC+ cells (P2), and FF‐EpCAM+ cells (P0) indicated that the gene expression profiles of iAT1 cells were more similar to those of primary AT1 cells than those of FD‐iAT2 cells, FF‐EpCAM+ cells, or primary AT2 cells (Figure 3A,B). Furthermore, although the FF‐EpCAM+ cells resembled primary AT2 cells, they were not annotated as primary AT1 cells (Figure 3A). iAT1 cells expressed the AT1 marker genes (AGER, CAV1, and/or PDPN) as primary AT1 cells (Figure 3C). Additionally, to clarify the heterogeneity within alveolar epithelial populations, we performed further epithelial cell analyses. A UMAP analysis showed that primary AT2 cells were divided into eight clusters dependent on donors and that primary AT1 cells converged into a single cluster (Figure S7A). The majority of iAT1 cells merged into the cluster of primary AT1 cells irrespective of FD‐iAT2, FF‐EpCAM+ (P0), and primary AT2 cells as well as each cluster of adult donor lung cells (Figure S7B‐D). Taken together, these findings indicate that all iAT1 cells resemble primary AT1 cells in their transcriptomic profiles.
3.4. iAT1 cells exhibited higher transcriptomic similarities to primary AT1 cells than 2D‐AT1‐like cells
Since primary AT2 cells have been reported to differentiate into AT1‐like cells in 2D culture (2D‐AT1‐like cells), 1 we revealed how close the transcriptomes of iAT1 cells resemble primary AT1 cells and primary 2D‐AT1‐like cells (GSE38569). 19 According to a gene set enrichment analysis (GSEA), the genes upregulated in primary AT1 cells or AT1 cells on human postnatal day 1 in the LungGENS database were significantly enriched (false discovery rate, FDR q‐value = 0.005 and <0.001, respectively) in iAT1 cells, whereas those genes were not enriched in primary 2D‐AT1‐like cells (FDR q‐value = 0.134 and 0.529, respectively) (Figure 4A and Table S1). Furthermore, a pathway enrichment analysis showed that 17 of the 20 pathways involved in iAT1 cells were coincident with those in primary AT1 cells, while 8 of the 20 pathways in the primary 2D‐AT1‐like cells overlapped with those in primary AT1 (Figure S8A and Table S6). To validate our analysis, FD‐SFTPC+ cells (P2) were differentiated in 2D culture for 7 days (2D‐iAT1 cells) and subjected to scRNA‐seq. UMAP analysis demonstrated that 2D‐iAT1 cells were distributed into the three clusters of iAT1, COL4A1+ 2D‐iAT1, and TP63+ 2D‐iAT1 cells (Figures 4B,C and S8B, and Table S4). In accordance with a recent study reporting that prealveolar type‐I transitional cell state (PATS)‐like cells, expressing SFN and KRT17, accumulated in idiopathic pulmonary fibrosis patients, 20 both COL4A1+ and TP63+ 2D‐iAT1 cell clusters expressed SFN and KRT17, suggesting that some of the 2D‐iAT1 cells had transdifferentiated into abnormal cells, including PATS‐like cells (Figure 4C). Overall, these results showed that the transcriptomes of iAT1 cells were more similar to those of primary AT1 cells than those of 2D‐AT1‐like cells and PATS‐like cells were detected in subpopulations of 2D‐iAT1 cells (COL4A1+ and TP63+ 2D‐iAT1 cells) but not in FD‐AOs.
FIGURE 4.
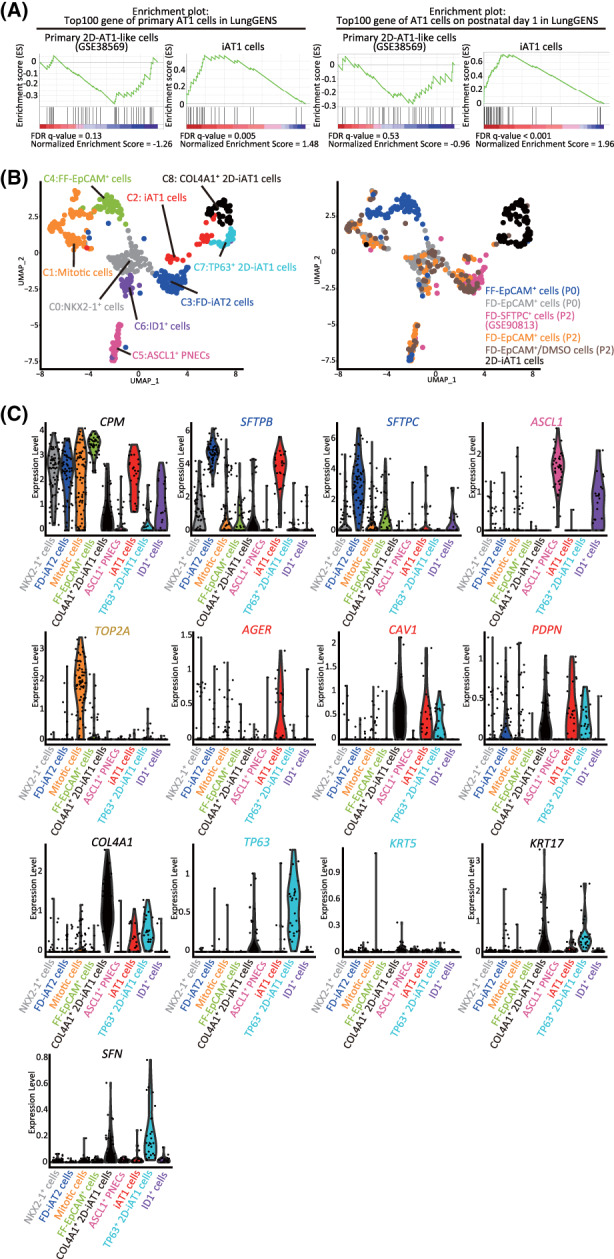
The transcriptomes of iAT1 cells were more similar to those of primary AT1 cells than those of 2D‐AT1‐like cells. A, GSEA using the top 100 gene sets of primary AT1 cells or AT1 cells on human postnatal day 1 from the LungGENS database. Significantly up‐ or downregulated genes (P < .05) ranked by the log difference in average gene expression between FD‐iAT2 and iAT1 cells, or primary 2D‐AT1‐like and AT2 cells (GSE38569) were used for the analysis. B, UMAP plots of 2D‐iAT1 cells added to those of Figure 2C. FD‐SFTPC+ cells (P2) were differentiated in 2D cultures for 7 days and subjected to scRNA‐seq. Next, scRNA‐seq was performed and sequencing data, including that of FD‐EpCAM+ cells (P0 and P2), FD‐EpCAM+/DMSO cells (P2), FD‐SFTPC+ cells (P2), and FF‐EpCAM+ cells (P0), were analyzed. C, Violin plots showing the gene expression distributions of the representative lineage markers with COL4A1, TP63, KRT5, KRT17, and SFN for characterizing 2D‐iAT1 cells. AT1, alveolar type I; GSEA, gene set enrichment analysis; scRNA‐seq, single‐cell RNA sequencing
3.5. HFLF in FD‐AOs are associated with Wnt signaling
To elucidate the role of HFLF in FD‐AOs, FD‐AOs (P0) were dissociated into single cells and subjected to scRNA‐seq using 10x Chromium technology (Figure 5A). We identified six epithelial and three HFLF clusters (Figure 5B,C and Table S5). Four of the six epithelial clusters were FD‐iAT2 cells, mitotic cells, ASCL1+ PNECs, and NKX2‐1+ cells, which corresponded to those described in Figures 1C and 2C (Figure S9A,B). While we identified the INSM1+ PNEC cluster based on the high expression of INSM1 as well as hepatic‐like cells, based on APOA2 expression, in epithelial clusters (Figure S9A,B), the read depth was not sufficient to discriminate iAT1 cells from other epithelial cells. Among the HFLF clusters, cluster 1, cluster 4, and cluster 6 were annotated as PDGFRA+ fibroblasts, WNT5A+/PDGFRA+ fibroblasts, and RARRES1+ fibroblasts, based on the gene expression of PDGFRA, WNT5A/PDGFRA, and RARRES1, respectively. Pathway enrichment analysis showed that pathways associated with “epithelial cell differentiation,” “negative regulation of cell differentiation,” “epithelial cell proliferation,” “regulation of epithelial cell differentiation,” and “Wnt signaling pathway” were significantly enriched in PDGFRA+ fibroblasts and WNT5A+/PDGFRA+ fibroblasts (Figure 5D and Tables S5‐S7). Considering that the GSEA using genes associated with the degradation of β‐catenin by the destruction complex showed that the β‐catenin destruction pathway (R‐HSA‐195253) was activated in iAT1 cells (Figure 5E and Table S1), Wnt signaling in HFLF might contribute to the differentiation of iAT2 cells into iAT1 cells.
FIGURE 5.
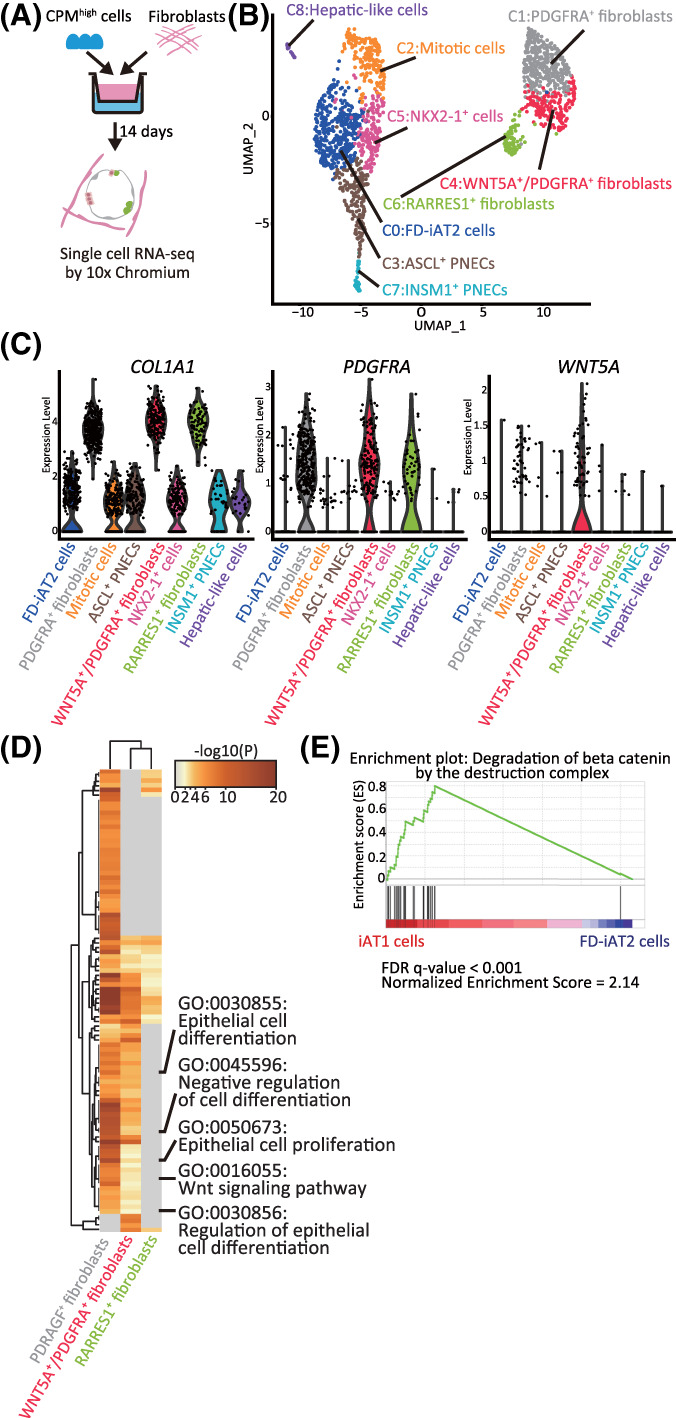
The transcriptomes of HFLF and hiPSC‐derived EpCAM+ cells in FD‐AOs. A, A schematic diagram of scRNA‐seq analysis of FD‐AOs. B, UMAP plots displaying cell clusters in FD‐AOs. Six major types of FD‐EpCAM+ cells (FD‐iAT2 cells, mitotic cells, ASCL1+ PNECs, INSM1+ cells, NKX2‐1+ cells, and hepatic‐like cells) and three types of fibroblasts (PDGFRA+, WNT5A+/PDGFRA+, and RARRES1+ fibroblasts) were identified. C, Violin plots indicating the gene expression distributions of each fibroblast cluster marker genes. D, Pathway enrichment analysis of PDGFRA+, WNT5A+/PDGFRA+, and RARRES1+ fibroblasts. Significantly upregulated genes (P < .05) among PDGFRA+, WNT5A+/PDGFRA+, or RARRES1+ fibroblasts compared with either or both of the other cell clusters were used for analysis. The top 100 differential pathways with a P < .05 are shown. E, GSEA using the gene set of β‐catenin degradation by the destruction complex. Significantly up‐ or downregulated genes (P < .05) ranked by the log difference in average gene expression between iAT1 cells and FD‐iAT2 cells were used for analysis. FD‐AOs, fibroblast‐dependent alveolar organoids; GSEA, gene set enrichment analysis; HFLF, human fetal lung fibroblasts; hiPSC, human induced pluripotent stem cell; scRNA‐seq, single‐cell RNA sequencing; UMAP, uniform manifold approximation and projection
3.6. XAV‐939 promotes iAT1 cell differentiation in FD‐AOs
Next, we investigated whether Wnt signaling was involved in the differentiation of iAT2 cells into iAT1 cells. FD‐AOs (P2‐P5) treated with XAV‐939, an inhibitor of the canonical Wnt signaling pathway, were compared with DMSO‐treated FD‐AOs and were subjected to FACS analysis of SFTPC and PDPN (Figure 6A). We showed that the rate of SFTPC−PDPN+ cells significantly increased following 10 μM XAV‐939 treatment for 12 days (Figures 6B,C and S10A,B). Fluorescence microscopy of XAV‐939‐treated FD‐AOs (P2‐P5) showed that the morphology of the cells was thinner, more similar to that of adult AT1 cells than that of DMSO‐treated cells (Figure 6D,E). Furthermore, cells expressing AT1 markers (AGER, HT1‐56, PDPN, and/or HOPX) and no SFTPC‐GFP were contained in XAV‐939‐treated FD‐AO (P3) (Figure 6F), indicating that XAV‐939 increased the proportion of SFTPC−PDPN+ cells in FD‐AOs.
FIGURE 6.
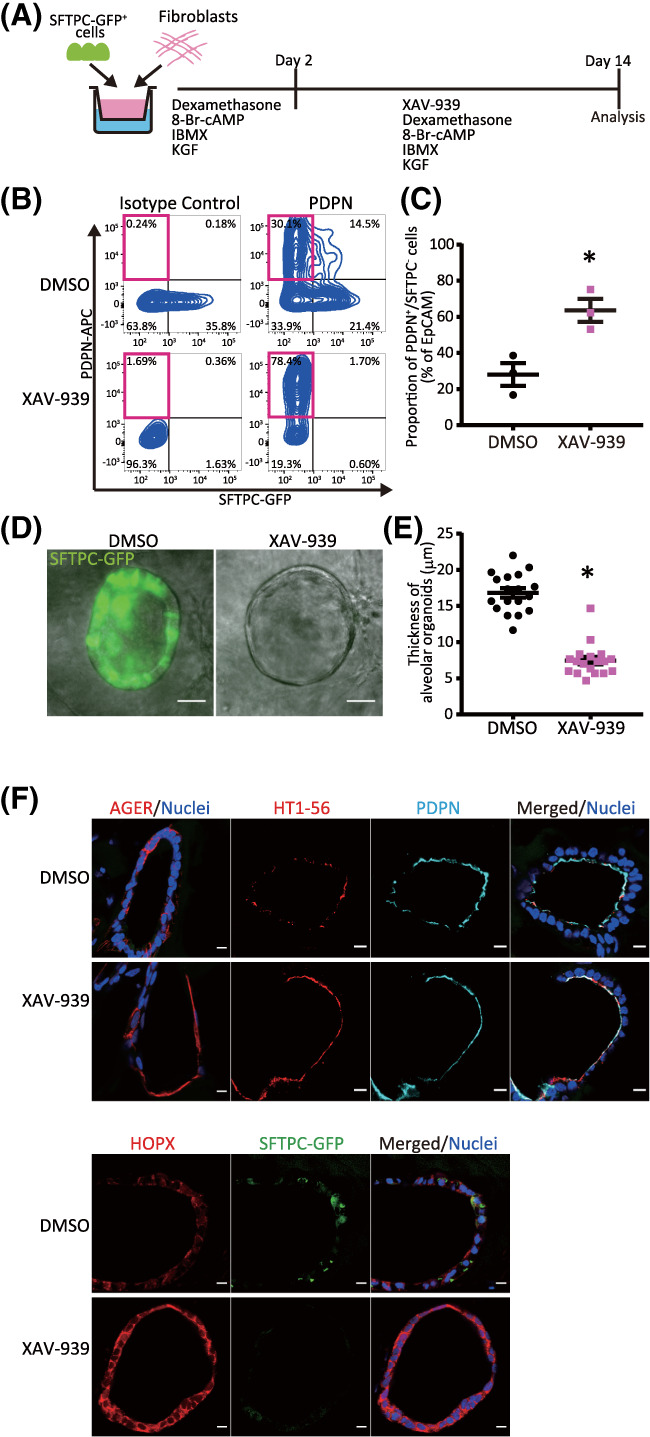
XAV‐939 increases the population of iAT1 cells in FD‐AOs. A, A schematic diagram of the analysis of the effect of XAV‐939 on FD‐AOs. B,C, Flow cytometric analyses of the PDPN and SFTPC expression of FD‐EpCAM+ cells (P2‐5). FD‐AOs (P2‐5) were treated with 10 μM XAV‐939 or DMSO from day 2 to 14, and then the proportion of SFPTC−PDPN+ cells in FD‐AOs was measured on day 14 (mean ± SEM, n = 3 from three independent experiments). The values indicate the percentage of each population. *P < .05 vs DMSO‐treated hiPSC‐derived SFTPC−PDPN+ cells (unpaired two‐tailed Student's t test). D,E, Representative bright‐field and SFTPC‐GFP fluorescence microscopic live cell images of FD‐AOs (P2‐5) treated with DMSO or 10 μM XAV‐939 from day 2 to 14. Thickness of each FD‐AO (P2‐P5) treated with DMSO or 10 μM XAV‐939 was measured (mean ± SEM, n = 18 spheres from three independent experiments). Scale bars = 50 μm. *P < .05 vs DMSO‐treated FD‐AO (unpaired two‐tailed Student's t test). F, Immunostaining of AT1 markers (AGER, HOPX, HT1‐56, and/or PDPN) and SFTPC‐GFP in DMSO‐ or XAV‐939‐treated FD‐AOs (P3). Scale bars = 10 μm. DMSO, dimethyl sulfoxide; FD‐AOs, fibroblast‐dependent alveolar organoids; hiPSC, human induced pluripotent stem cell
Next, we investigated whether XAV‐939 promoted iAT1 cell differentiation at the transcriptomic level. Following treatment with 10 μM XAV‐939 or DMSO for 12 days, FD‐AOs (P2) were subjected to scRNA‐seq (Figure 7A). A total of 87 XAV‐939‐treated FD‐EpCAM+ cells (P2) were analyzed in addition to FD‐EpCAM+ cells (P0 and P2), FD‐EpCAM+/DMSO cells (P2), FD‐SFTPC+ cells (P2), and FF‐EpCAM+ cells (P0). A GSEA using genes associated with the degradation of β‐catenin by the destruction complex (R‐HSA‐195253) indicated that β‐catenin destruction was promoted by XAV‐939 treatment in FD‐EpCAM+ cells (P2), which is consistent with the mechanism through which tankyrase 1/2 inhibitor stimulates β‐catenin degradation (Figure 7B and Table S8). Moreover, immunostaining indicated that XAV‐939 inhibited the nuclear localization of β‐catenin in FD‐AOs (P3) (Figure S10C). Furthermore, the scRNA‐seq and qRT‐PCR data revealed that XAV‐939 treatment increased the proportion of iAT1 cells in FD‐AOs (P2) (Figure 7C‐E) and the levels of HOPX and PDPN in FD‐AOs (Figure S11A). The trajectory analysis excluding mitotic cells and including EpCAM+ cells of XAV‐939‐treated FD‐AOs (P2) indicated that the proportion of iAT1 to iAT2 cells increased, compared to the results presented in Figure S3A‐C (Figure S11B‐D), suggesting that XAV‐939 promoted differentiation of iAT2 cells into iAT1 cells in FD‐AOs.
FIGURE 7.
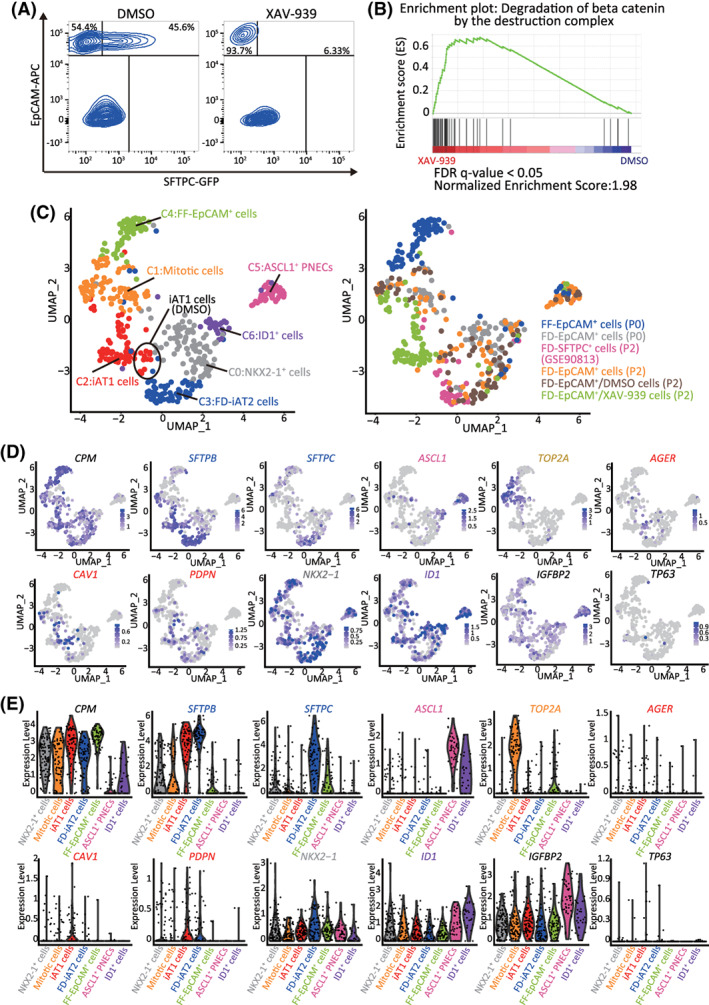
XAV‐939 promotes iAT1 cell differentiation in FD‐AOs. A, FD‐AOs (P2) were treated with 10 μM XAV‐939 or DMSO (vehicle control) from day 2 to 14, and then the FD‐EpCAM+ cells collected using FACS were subjected to scRNA‐seq. B, GSEA using the gene set of β‐catenin degradation by the destruction complex. Significantly up‐ or downregulated genes (P < .05) ranked by the log difference in average gene expression between DMSO‐ and XAV‐939‐treated FD‐EpCAM+ cells (P2) were used for the analysis. C, UMAP analysis showing cell clusters in XAV‐939‐treated FD‐AOs. XAV‐939‐treated FD‐EpCAM cells (P2) were included among iAT1 cells. D,E, UMAP and violin plots showing the expression of the representative lung epithelial cell marker genes; AT1 cells (AGER, CAV1, and PDPN), AT2 cells (SFTPB and SFTPC), mitotic cells (TOP2A), ASCL1+ PNECs (ASCL1), ID1+ cells (ID1), NKX2‐1+ cells (NKX2‐1), basal cells (TP63), subpopulation of AT1 cells (IGFBP2), and alveolar epithelial cells (CPM). DMSO, dimethyl sulfoxide; FACS, fluorescence‐activated cell sorting; FD‐AOs, fibroblast‐dependent alveolar organoids; GSEA, gene set enrichment analysis; scRNA‐seq, single‐cell RNA sequencing; UMAP, uniform manifold approximation and projection
4. DISCUSSION
We demonstrated that iAT1 cells were mainly present in FD‐AOs. Using scRNA‐seq, we revealed that the transcriptomic profiles of iAT1 cells were similar to those of primary AT1 cells, and that XAV‐939 increased the population of iAT1 cells among FD‐AOs. Thus, our results clarified the transcriptomes of iAT1 cells and provided a new model for investigating the mechanism underlying human AT1 cell differentiation from AT2 cells in vitro, based on the ability of isolated FD‐SFTPC+ cells to derive iAT1 cells. While the trajectory analysis results supported these observations and the theory that AT2 produces AT1 during alveologenesis, 21 genetic lineage tracing studies might provide more direct evidence. Interestingly, few marker‐defined iAT1 cells were present in both FD‐EpCAM+ cells (P0) and FF‐EpCAM+ cells (P0) and EpCAM+ cells (P0) were not merged into the iAT1 cell cluster in the UMAP plot (Figure 2C), suggesting that marker‐defined iAT1 cells in FD‐EpCAM+ cells (P0) and FF‐EpCAM+ cells (P0) are immature alveolar epithelial cells, as they seemed to be directly derived from CPMhigh cells. The transcriptomes of iAT1 cells resembled those of primary AT1 cells to a higher degree than those of primary 2D‐AT‐1 like cells. While the GSEA indicated that there are 17 overlapping pathways between iAT1 cells and primary AT1 cells, eight overlapping pathways were found between primary 2D‐AT1‐like and AT1 cells (Figure S8A). Additionally, 2D‐cultured cells derived from FD‐SFTPC+ cells (P2) included abnormally differentiated KRT17+ and/or SFN+ PATS‐like cells as well as iAT1 cells. Unlike mouse alveolar organoids, in which AT1 cells were shown to differentiate from primary AT2 cells inward, 4 we showed that in FD‐AOs iAT1 cells lined up with FD‐iAT2 cells and were thin‐shaped in response to XAV‐939 treatment, in consistence with the morphological features of AT1 cells. In contrast, FF‐AOs include only a few marker‐defined iAT1 cells (Figure 2), which is in line with the findings of a previous report, 6 , 17 suggesting the crucial function of cocultured fibroblasts to support AT1 cell induction. Furthermore, we found that XAV‐939‐treated FD‐iAT2 cells were converted to iAT1 cells. The expression of the proliferation marker was observed in a few iAT1 cells at single‐cell resolution (Figure 7D,E), but, since the FD‐AO culture was started only with iAT2 cells, it would be considered that most iAT1 cells differentiated from iAT2 cells. While recent reports indicated that AT1 cells expressed VEGFA and were a heterogeneous population including IGFBP2+ AT1 cells, 22 , 23 we were not able to identify this subpopulation of iAT1 cells, suggesting that XAV‐939 would homogeneously induce iAT1 cells (Figure 7E). Although in vitro regeneration models 5 , 15 , 24 and an iPSC differentiation model 24 suggested that Wnt inhibition increases certain AT1 marker‐positive cells, this study reports, for the first time, the changes induced by XAV‐939 treatment to the transcriptomic profiles of iAT1 cells at single‐cell resolution. Furthermore, whereas TM4SF1+ adult AT2 cells were reported to be differentiated into AT1 cells by inhibition of Wnt signaling upon alveolar injury, illustrating the regeneration of adult lung, 5 the model in the present study does not cover the regeneration from injury, but it describes the differentiation of iAT2 cells into iAT1 cells, thus recapitulating lung development in humans. Further studies are needed to demonstrate whether it would be applicable to a lung injury model. PDGFRA+ cells were reported to contribute to the retention of AT2 cells, 4 and WNT5A+ fibroblasts were shown to activate Wnt signaling in AT2 cells. 16 Consistent with these findings, our scRNA‐seq data from epithelial cells and fibroblasts in FD‐AOs illustrated that HFLF contained PDGFRA+ and PDGFRA+/WNT5A+ fibroblasts and that XAV‐939 inhibited the nuclear localization of β‐catenin in iAT1 cells, indicating that XAV‐939 inhibited Wnt signaling in iAT2 cells. This might have impaired the HFLF‐mediated maintenance of iAT2 cells, thereby promoting iAT2‐to‐iAT1 cell differentiation. On the other hand, GSEA revealed that the pathway of β‐catenin degradation was activated in iAT1 cells that were not treated with XAV‐939 treatment (Figure 5E), suggesting that there is another endogenous mechanism through which Wnt signaling is inhibited and iAT2‐to‐iAT1 differentiation is promoted. Describing the underlying mechanism of this endogenous counter regulation should be elucidated in a future study. Interestingly, while AT1 cells are generally considered quiescent and nonproliferative at baseline, 13 some of the mitotic cells in the present study were annotated as primary AT1 cells (Figure S7C). In fetal mice, it was reported that HOPX+ cells proliferated and differentiated into AT2 cells in 3D cultures. 25 Here, some of the mitotic iAT1 cells expressed HOPX (Figure S4A). Although XAV‐939 was reported to attenuate bleomycin‐induced pulmonary fibrosis in mice, 26 whether XAV‐939 promotes AT2‐to‐AT1 cell differentiation in these mice remains to be elucidated. Based on our current findings, the use of alveolar organoids as disease models should be further assessed in future mechanistic studies. In addition, AT1 cells express vascular endothelial growth factor (VEGF) for alveolar angiogenesis 23 and have the function of gas exchange. While gene expression was enriched for “blood vessel development” in iAT1 cells as well as primary AT1 cells and iAT1 cells expressed VEGFA (Figure S7E), the FD‐AOs did not include endothelial cells in the present study. Thus, the functions of iAT1 cells should be evaluated in terms of alveolar angiogenesis and gas exchange by using microfluidic devices such as organ‐on‐a‐chip in future studies. We believe that FD‐AOs might be a useful tool for evaluating the physiological and pathological mechanisms involved in AT2 cell differentiation in humans.
5. CONCLUSION
We discovered iAT1 cells whose transcriptomic profiles were similar to those of primary AT1 cells and revealed that canonical Wnt inhibition promoted the differentiation of AT2 cells into AT1 cells. Thus, our results clarified the definition of iAT1 cells and provided a new model for investigating the mechanism underlying human AT1 cell differentiation from AT2 cells in vitro.
CONFLICT OF INTEREST
Kyoto University has applied for patents related to the method of alveolar cell differentiation from iPSCs. S.K. and T.S. are employees, received research funding, and are shareholders of Kyorin Pharmaceutical Co., Ltd. Y.Y., M.H., and S.G. are founders and shareholders of HiLung Inc. T.H. received research funding from Kyorin Pharmaceutical. The other authors declared no potential conflicts of interest.
AUTHOR CONTRIBUTIONS
S.G.: conception and design, financial support, provision of study material or patients, data analysis and interpretation, manuscript writing, final approval of manuscript; S.K., S.I.: conception and design, collection and/or assembly of data, data analysis and interpretation, manuscript writing; T.S.: collection and/or assembly of data; Y.Y.: conception and design, data analysis and interpretation, manuscript writing; M.S.: collection and/or assembly of data, data analysis and interpretation; T.H., M.H.: administrative support; Y.S.: financial support, administrative support, collection and/or assembly of data, final approval of manuscript.
Supporting information
Appendix S1: Supplementary Information
Supplementary Figure 1 Cell type identification of FD‐EpCAM + cells in FD‐AOs.
(A) UMAP plots showing the expression of the representative lung epithelial cell marker genes; basal cells (KRT5 and TP63), ciliated cells (FOXJ1 and SNTN), goblet cells (MUC5AC and MUC5B), and club cells (SCGB1A1 and CYP2F1).
(B) Pathway enrichment analysis of FD‐iAT2 cells, ASCL1+ cells, mitotic cells, and NKX2‐1+ cells. Significantly upregulated genes (P < 0.05) from each cluster were used for the analysis. The top 20 differential pathways with P < 0.05 are shown.
(C) Heatmap showing the gene expression pattern of the top 10 differentially expressed genes in each cell type.
Supplementary Figure 2 Immunostaining of marker proteins in human fetal lung and FD‐AO.
(A) Immunostaining of AT1 markers (AGER, HOPX, HT1‐56, and/or PDPN) or PNECs markers (CHGA, PGP9.5, or SYP) in human fetal lung tissue. Scale bars = 10 μm.
(B) Immunostaining of HOPX in FD‐AO (P3). Scale bars = 10 μm.
(C and D) Immunostaining of CHGA, PGP9.5, SYP, and NKX2‐1 showing that FD‐AOs (P3) contain ASCL+ PNECs and NKX2‐1+ cells. Scale bars = 10 μm.
(E) Immunostaining of KRT5 in FD‐AOs (P3) and human fetal lung tissue, indicating that FD‐AOs did not include KRT5+ cells. Scale bars = 10 μm.
Supplementary Figure 3 The trajectory analysis of FD‐iAT2 cells differentiation into other clusters.
(A‐D) Monocle analysis excluding mitotic cells suggesting that FD‐iAT2 cells differentiated into iAT1 cells, NKX2‐1+ cells, and ASCL+ PNECs (A‐C). The Expression of AT2 markers (SFTPB and SFTPC), AT1 markers (AGER, CAV1, and PDPN), and PNEC marker (ASCL1) along pseudo‐time trajectories (D).
(E) The trajectory analysis using scVelo indicating that FD‐iAT2 cells differentiated into iAT1 cells and NKX2‐1+ cells.
Supplementary Figure 4 Cell type identification of hiPSC‐derived EpCAM + cells in FF‐AOs and FD‐AOs.
(A) UMAP plots showing the expression of the representative lung epithelial cell marker genes; AT1 cells (AGER, CAV1, HOPX, and PDPN), AT2 cells (SFTPB and SFTPC), mitotic cells (TOP2A), ASCL1+ cells (ASCL1), ID1+ cells (ID1), gastric‐like cells (TFF1), alveolar epithelial cells (CPM and NKX2‐1), and Wnt‐responsible AT2 cells (AXIN2).
(B) Proportion of marker‐defined iAT1 cells to hiPSC‐derived EpCAM+ cells.
(C) Pathway enrichment analysis of FF‐EpCAM+, ID1+, and gastric‐like cells. Significantly upregulated genes (P < 0.05) in each cluster were used for analysis. The top 20 differential pathways with P < 0.05 are shown.
(D) Heatmap showing the gene expression pattern of the top 10 differentially expressed genes in each cell type.
Supplementary Figure 5 Difference of cell types between FF‐AOs and FD‐AOs.
(A) Combined dot plots of scRNA‐seq data from FD‐EpCAM+ cells (P0 and P2), FD‐EpCAM+/DMSO cells (P2), FD‐SFTPC+ cells (P2) and, FF‐EpCAM+ cells (P0) from the present study with the data of FF‐EpCAM+ cells (P5) previously published (GSE137799). The gene expression of AT1 markers (AGER, CAV1, and PDPN) in FF‐AOs (P5) and FF‐EpCAM+ cells was lower than the gene expression of these markers in FD‐AOs (P0 and P2).
(B) Gene expression levels of AGER, PDPN, and HOPX in FF‐EpCAM+ (P0) and FD‐EpCAM+ cells (P2 or P3) (mean ± s.e.m., n = 3 from 3 independent experiments). *P < 0.05 vs FF‐EpCAM+ cells (P0) (unpaired two‐tailed Student's t‐test).
(C) Immunofluorescence staining of AT1 markers (AGER, HOPX, HT1‐56, and/or PDPN) and SFTPC‐GFP in FD‐AO (P0). Scale bars = 10 μm.
Supplementary Figure 6 Clustering of human adult donor lung cells.
(A) UMAP displaying clusters in human adult donor lung cells using public data (GSE122960). We defined 13 major types of adult donor lung cells, including AT2 cells, macrophages, dendritic cells, club cells, monocytes, endothelial/lymphatic cells, AT1 cells, plasma cells, T and NKT cells, Mast/B cells, fibroblasts, undetermined cells, and ciliated cells.
(B) UMAP plots showing the expression of the representative lung cell marker genes: AT1 cells (AGER and CAV1), AT2 cells (SFTPB and SFTPC), ciliated cells (FOXJ1), club cells (SCGB1A1 and CYP2F1), fibroblasts (DCN), macrophages (CD68), monocytes (FCN1), dendritic cells (CLEC10A), endothelial/lymphatic cells (VWF), plasma cells (IGHG4), T and NKT cells (CD3D), and B/Mast cells (MS4A1 and TPSB2).
Supplementary Figure 7 Comparison among hiPSC‐derived EpCAM + cells, primary AT1, and AT2 cell.
(A, B, C, and D) Combined UMAP plots of single cells from FD‐EpCAM+ cells (P0 and P2), FD‐EpCAM+/DMSO cells (P2), FD‐SFTPC+ cells (P2), and FF‐EpCAM+ cells (P0) with those of the primary AT1 and AT2 cells extracted from the database (GSE122960) in Figure S6. Combined UMAP plots were labeled using the name of each subject or cell type (A). Primary AT1 and AT2 cells annotated as adult donor lung cells are shown in gray, FD‐EpCAM+ (P0 and P2), FD‐EpCAM+/DMSO cells (P2), and FD‐SFTPC+ cells (P2) in red, and FF‐EpCAM+ cells (P0) in blue (B). UMAP plots reveal primary AT1 cells, primary AT2 cells, and 8 clusters in FD‐EpCAM+ cells (P0 and P2), FD‐EpCAM+/DMSO cells (P2), FD‐SFTPC+ cells (P2), and FF‐EpCAM+ cells (P0) (C). Primary AT1 and AT2 cells are shown in gray, iAT1 cells in red, and hiPSC‐derived EpCAM+ cells without iAT1 cells in cyan (D).
(E) Violin plots showing the gene expression distributions of the representative marker genes.
Supplementary Figure 8 Cell type characterization of primary 2D‐AT1‐like cells and 2D‐iAT1 cells.
(A) Pathway enrichment analysis of the transcriptomes of iAT1 cells from the present study and those of previously reported primary AT1 and primary 2D‐AT1‐like cells (GSE38569). Significantly upregulated genes in iAT1 cells and primary AT1 cells compared to either or both of the other cell clusters, and primary 2D‐AT1‐like cells compared to primary AT2 cells, respectively, were used for analysis. The top 20 differential pathways with P < 0.05 are shown.
(B) UMAP plots showing the expression of the representative lung epithelial cell marker genes; AT1 cells (AGER, CAV1, and PDPN), AT2 cells (SFTPB and SFTPC), mitotic cells (TOP2A), ASCL1+ cells (ASCL1), alveolar epithelial cells (CPM), COL4A1+ i2D‐AT1‐like cells (COL4A1), TP63+ i2D‐AT1‐like cells (TP63 and KRT5), and PATS‐like cells (KRT17 and SFN).
Supplementary Figure 9 Cell type characterization of an FD‐AO.
(A) UMAP plots showing the expression of the representative lung epithelial cell and fibroblasts marker genes; fibroblasts (COL1A1), PDGFRA+ fibroblasts (PDGFRA), WNT5A+/PDGFRA+ fibroblasts (WNT5A and PDGFRA), RARRES1+ fibroblast (RARRES1), AT1 cells (AGER, CAV1, and PDPN), AT2 cells (SFTPB and SFTPC), mitotic cells (TOP2A), ASCL1+ cells (ASCL1), alveolar epithelial cells (EPCAM and NKX2‐1), INSM1+ PNECs (INSM1), and hepatic‐like cells (APOA2).
(B) Heatmap showing the gene expression pattern of the top 10 differentially expressed genes in each cell type.
Supplementary Figure 10 Dose response and time course study of XAV‐939 in FD‐AOs.
(A and B) Flow cytometric analyses of the PDPN and SFTPC expression of FD‐EpCAM+ cells (P2‐5). FD‐AOs (P2‐5) were treated with the indicated concentrations of XAV‐939 or DMSO for the indicated period, and the proportion of SFPTC−PDPN+ cells in FD‐AOs was measured (mean ± s.e.m., n = 3 from 3 independent experiments). The values indicate the percentage of each population. *P < 0.05 vs DMSO‐treated hiPSC‐derived SFTPC−PDPN+ cells (one‐way ANOVA with Dunnett's post‐hoc test).
(C) Immunostaining of β‐catenin, PDPN, and SFTPC‐GFP demonstrating that XAV‐939 inhibited nuclear localization of β‐catenin in FD‐AOs (P3). Scale bars = 10 μm.
Supplementary Figure 11 The trajectory analysis of differentiation of FD‐iAT2 cells into other cell clusters.
(A) Gene expression levels of AGER, PDPN, and HOPX in DMSO‐ or XAV‐939‐treated FD‐AOs. FD‐AOs (P2‐5) treated with DMSO or 10 μM XAV‐939 for 12 days were subjected to qRT‐PCR (mean ± s.e.m., n = 3 from 3 independent experiments). *P < 0.05 vs FF‐AO (unpaired two‐tailed Student's t‐test).
(B‐C) Monocle analysis excluding mitotic cells shows that XAV‐939 increases the number of iAT1 cells differentiated from FD‐AT2 cells, compared to Supplementary Figure 3.
Supplementary Table 1 The DEGs in each cluster of FD‐EpCAM + cells (P2) and primary 2D‐AT1‐like cells.
In the UMAP analysis, “pct. 1” is the proportion of cells that express the corresponding gene in the target cluster, as labeled in the “cluster” column. “pct.2” is the proportion of cells that express the gene in the other clusters. In the GSEA, “rank” indicates the order of the log difference in the average gene expression.
Supplementary Table 2 The DEGs in each cluster of hiPSC‐derived EpCAM + cells in FD‐AOs and FF‐AOs.
In the DEG analysis “pct. 1” is the proportion of cells that express the corresponding gene in the target cluster, as labeled in the “cluster” column. “pct.2” is the proportion of cells that express the gene in the other clusters.
Supplementary Table 3 The DEGs in each cluster of adult donor lung cells.
In the DEG analysis “pct. 1” is the proportion of cells that express the corresponding gene in the target cluster, as labeled in the “cluster” column. “pct.2” is the proportion of cells that express the gene in the other clusters.
Supplementary Table 4 The DEGs in each cluster of 2D‐iAT1 cells and hiPSC‐derived EpCAM + cells in FD‐AOs and FF‐AOs.
In the DEG analysis “pct. 1” is the proportion of cells that express the corresponding gene in the target cluster, as labeled in the “cluster” column. “pct.2” is the proportion of cells that express the gene in the other clusters.
Supplementary Table 5 The DEGs in each cluster of the cells derived from FD‐AOs (P0).
In the DEG analysis “pct. 1” is the proportion of cells that express the corresponding gene in the target cluster, as labeled in the “cluster” column. “pct.2” is the proportion of cells that express the gene in the other clusters.
Supplementary Table 6 The multiple gene lists for the analysis of HFLF or primary AT1, iAT1, and primary 2D‐AT1‐like cells.
Supplementary Table 7 A pathway enrichment analysis of HFLF.
Supplementary Table 8 The DEGs in each cluster of hiPSC‐derived EpCAM + cells in FF‐AOs and DMSO‐ or XAV‐939‐treated FD‐AOs.
In the UMAP analysis, “pct. 1” is the proportion of cells that express the corresponding gene in the target cluster, as labeled in the “cluster” column. “pct.2” is the proportion of cells that express the gene in the other clusters. In the GSEA, “rank” indicates the order of the log difference in the average gene expression.
Supplementary Table 9 Antibodies used in the present study.
Supplementary Table 10 Primers used in the present study.
ACKNOWLEDGMENTS
We thank J. Kanamune and M. Kishihata for technical assistance; K. Moriguchi, Y. Korogi, K. Tamai, N. Sone, N. Ikegami, H. Yamaki, K. Igura, and S. Ito for supporting the cell culture experiments; T. Horiuchi, Y. Kuze, K. Abe, and K. Imamura for helping with the scRNA‐seq. The fluorescence studies and scRNA‐seq studies were partly performed at the Medical Research Support Center, Kyoto University.
Kanagaki S, Ikeo S, Suezawa T, et al. Directed induction of alveolar type I cells derived from pluripotent stem cells via Wnt signaling inhibition. Stem Cells. 2021;39:156–169. 10.1002/stem.3302
Shuhei Kanagaki and Satoshi Ikeo are co‐first authors.
Funding information Japan Agency for Medical Research and Development, Grant/Award Numbers: JP19bm0804007, JP19bm0704037; Japan Society for the Promotion of Science, Grant/Award Numbers: JP16H06279, JP17H05084; Kyorin Pharmaceutical Co. Ltd
DATA AVAILABILITY STATEMENT
All scRNA‐seq data reported in this article are deposited in the Gene Expression Omnibus with accession number GSE145539 and GSE158733 and in the DNA Data Bank of Japan with accession number DRA010039.
REFERENCES
- 1. Borok Z, Danto SI, Lubman RL, Cao Y, Williams MC, Crandall ED. Modulation of T1α expression with alveolar epithelial cell phenotype in vitro. Am J Physiol Cell Mol Physiol. 1998;275:L155‐L164. [DOI] [PubMed] [Google Scholar]
- 2. Marconett CN, Zhou B, Sunohara M, et al. Cross‐species transcriptome profiling identifies new alveolar epithelial type I cell‐specific genes. Am J Respir Cell Mol Biol. 2017;56:310‐321. [DOI] [PMC free article] [PubMed] [Google Scholar]
- 3. Xu Y, Mizuno T, Sridharan A, et al. Single‐cell RNA sequencing identifies diverse roles of epithelial cells in idiopathic pulmonary fibrosis. JCI Insight. 2016;1:e90558. [DOI] [PMC free article] [PubMed] [Google Scholar]
- 4. Barkauskas CE, Cronce MJ, Rackley CR, et al. Type 2 alveolar cells are stem cells in adult lung. J Clin Invest. 2013;123:3025‐3036. [DOI] [PMC free article] [PubMed] [Google Scholar]
- 5. Zacharias WJ, Frank DB, Zepp JA, et al. Regeneration of the lung alveolus by an evolutionarily conserved epithelial progenitor. Nature. 2018;555:251‐255. [DOI] [PMC free article] [PubMed] [Google Scholar]
- 6. Jacob A, Morley M, Hawkins F, et al. Differentiation of human pluripotent stem cells into functional lung alveolar epithelial cells. Cell Stem Cell. 2017;21:472‐488. [DOI] [PMC free article] [PubMed] [Google Scholar]
- 7. Yamamoto Y, Gotoh S, Korogi Y, et al. Long‐term expansion of alveolar stem cells derived from human iPS cells in organoids. Nat Methods. 2017;14:1097‐1106. [DOI] [PubMed] [Google Scholar]
- 8. Gotoh S, Ito I, Nagasaki T, et al. Generation of alveolar epithelial spheroids via isolated progenitor cells from human pluripotent stem cells. Stem Cell Reports. 2014;3:394‐403. [DOI] [PMC free article] [PubMed] [Google Scholar]
- 9. Treutlein B, Brownfield DG, Wu AR, et al. Reconstructing lineage hierarchies of the distal lung epithelium using single‐cell RNA‐seq. Nature. 2014;509:371‐375. [DOI] [PMC free article] [PubMed] [Google Scholar]
- 10. Korogi Y, Gotoh S, Ikeo S, et al. In vitro disease modeling of Hermansky‐Pudlak syndrome type 2 using human induced pluripotent stem cell‐derived alveolar organoids. Stem Cell Reports. 2019;12:431‐440. [DOI] [PMC free article] [PubMed] [Google Scholar]
- 11. Lin W‐C, Gowdy KM, Madenspacher JH, et al. Epithelial membrane protein 2 governs transepithelial migration of neutrophils into the airspace. J Clin Invest. 2020;130:157‐170. [DOI] [PMC free article] [PubMed] [Google Scholar]
- 12. Qiu X, Mao Q, Tang Y, et al. Reversed graph embedding resolves complex single‐cell trajectories. Nat Methods. 2017;14:979‐982. [DOI] [PMC free article] [PubMed] [Google Scholar]
- 13. Little DR, Gerner‐Mauro KN, Flodby P, et al. Transcriptional control of lung alveolar type 1 cell development and maintenance by NK homeobox 2‐1. Proc Natl Acad Sci USA. 2019;116:20545‐20555. [DOI] [PMC free article] [PubMed] [Google Scholar]
- 14. Bergen V, Lange M, Peidli S, et al. Generalizing RNA velocity to transient cell states through dynamical modeling. Nat Biotechnol. 2020. [Epub ahead of print]. [DOI] [PubMed] [Google Scholar]
- 15. Frank DB, Peng T, Zepp JA, et al. Emergence of a wave of Wnt signaling that regulates lung alveologenesis by controlling epithelial self‐renewal and differentiation. Cell Rep. 2016;17:2312‐2325. [DOI] [PMC free article] [PubMed] [Google Scholar]
- 16. Nabhan A, Brownfield DG, Harbury PB, et al. Single‐cell Wnt signaling niches maintain stemness of alveolar type 2 cells. Science. 2018;359:1118‐1123. [DOI] [PMC free article] [PubMed] [Google Scholar]
- 17. Hurley K, Ding J, Villacorta‐Martin C, et al. Reconstructed single‐cell fate trajectories define lineage plasticity windows during differentiation of human PSC‐derived distal lung progenitors. Cell Stem Cell. 2020;26:593‐608. [DOI] [PMC free article] [PubMed] [Google Scholar]
- 18. Reyfman PA, Walter JM, Joshi N, et al. Single‐cell transcriptomic analysis of human lung provides insights into the pathobiology of pulmonary fibrosis. Am J Respir Crit Care Med. 2019;199:1517‐1536. [DOI] [PMC free article] [PubMed] [Google Scholar]
- 19. Marconett CN, Zhou B, Rieger ME, et al. Integrated transcriptomic and epigenomic analysis of primary human lung epithelial cell differentiation. PLoS Genet. 2013;9:e1003513. [DOI] [PMC free article] [PubMed] [Google Scholar]
- 20. Kobayashi Y, Tata A, Konkimalla A, et al. Persistence of a regeneration‐associated, transitional alveolar epithelial cell state in pulmonary fibrosis. Nat Cell Biol. 2020;22:934‐946. [DOI] [PMC free article] [PubMed] [Google Scholar]
- 21. Desai TJ, Brownfield DG, Krasnow MA. Alveolar progenitor and stem cells in lung development, renewal and cancer. Nature. 2014;507:190‐194. [DOI] [PMC free article] [PubMed] [Google Scholar]
- 22. Wang Y, Tang Z, Huang H, et al. Pulmonary alveolar type I cell population consists of two distinct subtypes that differ in cell fate. Proc Natl Acad Sci USA. 2018;115:2407‐2412. [DOI] [PMC free article] [PubMed] [Google Scholar]
- 23. Vila Ellis L, Cain MP, Hutchison V, et al. Epithelial VEGFA specifies a distinct endothelial population in the mouse lung. Dev Cell. 2020;52:617‐630. [DOI] [PMC free article] [PubMed] [Google Scholar]
- 24. Ghaedi M, Calle EA, Mendez JJ, et al. Human iPS cell‐derived alveolar epithelium repopulates lung extracellular matrix. J Clin Invest. 2013;123:4950‐4962. [DOI] [PMC free article] [PubMed] [Google Scholar]
- 25. Jain R, Barkauskas CE, Takeda N, et al. Plasticity of Hopx+ type I alveolar cells to regenerate type II cells in the lung. Nat Commun. 2015;6:6727. [DOI] [PMC free article] [PubMed] [Google Scholar]
- 26. Wang C, Zhu H, Sun Z, et al. Inhibition of Wnt/β‐catenin signaling promotes epithelial differentiation of mesenchymal stem cells and repairs bleomycin‐induced lung injury. Am J Physiol Cell Physiol. 2014;307:C234‐C244. [DOI] [PubMed] [Google Scholar]
Associated Data
This section collects any data citations, data availability statements, or supplementary materials included in this article.
Supplementary Materials
Appendix S1: Supplementary Information
Supplementary Figure 1 Cell type identification of FD‐EpCAM + cells in FD‐AOs.
(A) UMAP plots showing the expression of the representative lung epithelial cell marker genes; basal cells (KRT5 and TP63), ciliated cells (FOXJ1 and SNTN), goblet cells (MUC5AC and MUC5B), and club cells (SCGB1A1 and CYP2F1).
(B) Pathway enrichment analysis of FD‐iAT2 cells, ASCL1+ cells, mitotic cells, and NKX2‐1+ cells. Significantly upregulated genes (P < 0.05) from each cluster were used for the analysis. The top 20 differential pathways with P < 0.05 are shown.
(C) Heatmap showing the gene expression pattern of the top 10 differentially expressed genes in each cell type.
Supplementary Figure 2 Immunostaining of marker proteins in human fetal lung and FD‐AO.
(A) Immunostaining of AT1 markers (AGER, HOPX, HT1‐56, and/or PDPN) or PNECs markers (CHGA, PGP9.5, or SYP) in human fetal lung tissue. Scale bars = 10 μm.
(B) Immunostaining of HOPX in FD‐AO (P3). Scale bars = 10 μm.
(C and D) Immunostaining of CHGA, PGP9.5, SYP, and NKX2‐1 showing that FD‐AOs (P3) contain ASCL+ PNECs and NKX2‐1+ cells. Scale bars = 10 μm.
(E) Immunostaining of KRT5 in FD‐AOs (P3) and human fetal lung tissue, indicating that FD‐AOs did not include KRT5+ cells. Scale bars = 10 μm.
Supplementary Figure 3 The trajectory analysis of FD‐iAT2 cells differentiation into other clusters.
(A‐D) Monocle analysis excluding mitotic cells suggesting that FD‐iAT2 cells differentiated into iAT1 cells, NKX2‐1+ cells, and ASCL+ PNECs (A‐C). The Expression of AT2 markers (SFTPB and SFTPC), AT1 markers (AGER, CAV1, and PDPN), and PNEC marker (ASCL1) along pseudo‐time trajectories (D).
(E) The trajectory analysis using scVelo indicating that FD‐iAT2 cells differentiated into iAT1 cells and NKX2‐1+ cells.
Supplementary Figure 4 Cell type identification of hiPSC‐derived EpCAM + cells in FF‐AOs and FD‐AOs.
(A) UMAP plots showing the expression of the representative lung epithelial cell marker genes; AT1 cells (AGER, CAV1, HOPX, and PDPN), AT2 cells (SFTPB and SFTPC), mitotic cells (TOP2A), ASCL1+ cells (ASCL1), ID1+ cells (ID1), gastric‐like cells (TFF1), alveolar epithelial cells (CPM and NKX2‐1), and Wnt‐responsible AT2 cells (AXIN2).
(B) Proportion of marker‐defined iAT1 cells to hiPSC‐derived EpCAM+ cells.
(C) Pathway enrichment analysis of FF‐EpCAM+, ID1+, and gastric‐like cells. Significantly upregulated genes (P < 0.05) in each cluster were used for analysis. The top 20 differential pathways with P < 0.05 are shown.
(D) Heatmap showing the gene expression pattern of the top 10 differentially expressed genes in each cell type.
Supplementary Figure 5 Difference of cell types between FF‐AOs and FD‐AOs.
(A) Combined dot plots of scRNA‐seq data from FD‐EpCAM+ cells (P0 and P2), FD‐EpCAM+/DMSO cells (P2), FD‐SFTPC+ cells (P2) and, FF‐EpCAM+ cells (P0) from the present study with the data of FF‐EpCAM+ cells (P5) previously published (GSE137799). The gene expression of AT1 markers (AGER, CAV1, and PDPN) in FF‐AOs (P5) and FF‐EpCAM+ cells was lower than the gene expression of these markers in FD‐AOs (P0 and P2).
(B) Gene expression levels of AGER, PDPN, and HOPX in FF‐EpCAM+ (P0) and FD‐EpCAM+ cells (P2 or P3) (mean ± s.e.m., n = 3 from 3 independent experiments). *P < 0.05 vs FF‐EpCAM+ cells (P0) (unpaired two‐tailed Student's t‐test).
(C) Immunofluorescence staining of AT1 markers (AGER, HOPX, HT1‐56, and/or PDPN) and SFTPC‐GFP in FD‐AO (P0). Scale bars = 10 μm.
Supplementary Figure 6 Clustering of human adult donor lung cells.
(A) UMAP displaying clusters in human adult donor lung cells using public data (GSE122960). We defined 13 major types of adult donor lung cells, including AT2 cells, macrophages, dendritic cells, club cells, monocytes, endothelial/lymphatic cells, AT1 cells, plasma cells, T and NKT cells, Mast/B cells, fibroblasts, undetermined cells, and ciliated cells.
(B) UMAP plots showing the expression of the representative lung cell marker genes: AT1 cells (AGER and CAV1), AT2 cells (SFTPB and SFTPC), ciliated cells (FOXJ1), club cells (SCGB1A1 and CYP2F1), fibroblasts (DCN), macrophages (CD68), monocytes (FCN1), dendritic cells (CLEC10A), endothelial/lymphatic cells (VWF), plasma cells (IGHG4), T and NKT cells (CD3D), and B/Mast cells (MS4A1 and TPSB2).
Supplementary Figure 7 Comparison among hiPSC‐derived EpCAM + cells, primary AT1, and AT2 cell.
(A, B, C, and D) Combined UMAP plots of single cells from FD‐EpCAM+ cells (P0 and P2), FD‐EpCAM+/DMSO cells (P2), FD‐SFTPC+ cells (P2), and FF‐EpCAM+ cells (P0) with those of the primary AT1 and AT2 cells extracted from the database (GSE122960) in Figure S6. Combined UMAP plots were labeled using the name of each subject or cell type (A). Primary AT1 and AT2 cells annotated as adult donor lung cells are shown in gray, FD‐EpCAM+ (P0 and P2), FD‐EpCAM+/DMSO cells (P2), and FD‐SFTPC+ cells (P2) in red, and FF‐EpCAM+ cells (P0) in blue (B). UMAP plots reveal primary AT1 cells, primary AT2 cells, and 8 clusters in FD‐EpCAM+ cells (P0 and P2), FD‐EpCAM+/DMSO cells (P2), FD‐SFTPC+ cells (P2), and FF‐EpCAM+ cells (P0) (C). Primary AT1 and AT2 cells are shown in gray, iAT1 cells in red, and hiPSC‐derived EpCAM+ cells without iAT1 cells in cyan (D).
(E) Violin plots showing the gene expression distributions of the representative marker genes.
Supplementary Figure 8 Cell type characterization of primary 2D‐AT1‐like cells and 2D‐iAT1 cells.
(A) Pathway enrichment analysis of the transcriptomes of iAT1 cells from the present study and those of previously reported primary AT1 and primary 2D‐AT1‐like cells (GSE38569). Significantly upregulated genes in iAT1 cells and primary AT1 cells compared to either or both of the other cell clusters, and primary 2D‐AT1‐like cells compared to primary AT2 cells, respectively, were used for analysis. The top 20 differential pathways with P < 0.05 are shown.
(B) UMAP plots showing the expression of the representative lung epithelial cell marker genes; AT1 cells (AGER, CAV1, and PDPN), AT2 cells (SFTPB and SFTPC), mitotic cells (TOP2A), ASCL1+ cells (ASCL1), alveolar epithelial cells (CPM), COL4A1+ i2D‐AT1‐like cells (COL4A1), TP63+ i2D‐AT1‐like cells (TP63 and KRT5), and PATS‐like cells (KRT17 and SFN).
Supplementary Figure 9 Cell type characterization of an FD‐AO.
(A) UMAP plots showing the expression of the representative lung epithelial cell and fibroblasts marker genes; fibroblasts (COL1A1), PDGFRA+ fibroblasts (PDGFRA), WNT5A+/PDGFRA+ fibroblasts (WNT5A and PDGFRA), RARRES1+ fibroblast (RARRES1), AT1 cells (AGER, CAV1, and PDPN), AT2 cells (SFTPB and SFTPC), mitotic cells (TOP2A), ASCL1+ cells (ASCL1), alveolar epithelial cells (EPCAM and NKX2‐1), INSM1+ PNECs (INSM1), and hepatic‐like cells (APOA2).
(B) Heatmap showing the gene expression pattern of the top 10 differentially expressed genes in each cell type.
Supplementary Figure 10 Dose response and time course study of XAV‐939 in FD‐AOs.
(A and B) Flow cytometric analyses of the PDPN and SFTPC expression of FD‐EpCAM+ cells (P2‐5). FD‐AOs (P2‐5) were treated with the indicated concentrations of XAV‐939 or DMSO for the indicated period, and the proportion of SFPTC−PDPN+ cells in FD‐AOs was measured (mean ± s.e.m., n = 3 from 3 independent experiments). The values indicate the percentage of each population. *P < 0.05 vs DMSO‐treated hiPSC‐derived SFTPC−PDPN+ cells (one‐way ANOVA with Dunnett's post‐hoc test).
(C) Immunostaining of β‐catenin, PDPN, and SFTPC‐GFP demonstrating that XAV‐939 inhibited nuclear localization of β‐catenin in FD‐AOs (P3). Scale bars = 10 μm.
Supplementary Figure 11 The trajectory analysis of differentiation of FD‐iAT2 cells into other cell clusters.
(A) Gene expression levels of AGER, PDPN, and HOPX in DMSO‐ or XAV‐939‐treated FD‐AOs. FD‐AOs (P2‐5) treated with DMSO or 10 μM XAV‐939 for 12 days were subjected to qRT‐PCR (mean ± s.e.m., n = 3 from 3 independent experiments). *P < 0.05 vs FF‐AO (unpaired two‐tailed Student's t‐test).
(B‐C) Monocle analysis excluding mitotic cells shows that XAV‐939 increases the number of iAT1 cells differentiated from FD‐AT2 cells, compared to Supplementary Figure 3.
Supplementary Table 1 The DEGs in each cluster of FD‐EpCAM + cells (P2) and primary 2D‐AT1‐like cells.
In the UMAP analysis, “pct. 1” is the proportion of cells that express the corresponding gene in the target cluster, as labeled in the “cluster” column. “pct.2” is the proportion of cells that express the gene in the other clusters. In the GSEA, “rank” indicates the order of the log difference in the average gene expression.
Supplementary Table 2 The DEGs in each cluster of hiPSC‐derived EpCAM + cells in FD‐AOs and FF‐AOs.
In the DEG analysis “pct. 1” is the proportion of cells that express the corresponding gene in the target cluster, as labeled in the “cluster” column. “pct.2” is the proportion of cells that express the gene in the other clusters.
Supplementary Table 3 The DEGs in each cluster of adult donor lung cells.
In the DEG analysis “pct. 1” is the proportion of cells that express the corresponding gene in the target cluster, as labeled in the “cluster” column. “pct.2” is the proportion of cells that express the gene in the other clusters.
Supplementary Table 4 The DEGs in each cluster of 2D‐iAT1 cells and hiPSC‐derived EpCAM + cells in FD‐AOs and FF‐AOs.
In the DEG analysis “pct. 1” is the proportion of cells that express the corresponding gene in the target cluster, as labeled in the “cluster” column. “pct.2” is the proportion of cells that express the gene in the other clusters.
Supplementary Table 5 The DEGs in each cluster of the cells derived from FD‐AOs (P0).
In the DEG analysis “pct. 1” is the proportion of cells that express the corresponding gene in the target cluster, as labeled in the “cluster” column. “pct.2” is the proportion of cells that express the gene in the other clusters.
Supplementary Table 6 The multiple gene lists for the analysis of HFLF or primary AT1, iAT1, and primary 2D‐AT1‐like cells.
Supplementary Table 7 A pathway enrichment analysis of HFLF.
Supplementary Table 8 The DEGs in each cluster of hiPSC‐derived EpCAM + cells in FF‐AOs and DMSO‐ or XAV‐939‐treated FD‐AOs.
In the UMAP analysis, “pct. 1” is the proportion of cells that express the corresponding gene in the target cluster, as labeled in the “cluster” column. “pct.2” is the proportion of cells that express the gene in the other clusters. In the GSEA, “rank” indicates the order of the log difference in the average gene expression.
Supplementary Table 9 Antibodies used in the present study.
Supplementary Table 10 Primers used in the present study.
Data Availability Statement
All scRNA‐seq data reported in this article are deposited in the Gene Expression Omnibus with accession number GSE145539 and GSE158733 and in the DNA Data Bank of Japan with accession number DRA010039.