Abstract
Juvenile social isolation reduces sociability in adulthood, but the neural circuit mechanisms are poorly understood. We found that, in male mice, 2 weeks of social isolation immediately following weaning leads to a failure to activate medial prefrontal cortex (mPFC) neurons projecting to the posterior paraventricular thalamus (pPVT) during social exposure in adulthood. Chemogenetic or optogenetic suppression of mPFC->pPVT activity in adulthood was sufficient to induce sociability deficits without affecting anxiety-related behaviors or preference toward rewarding food. Juvenile isolation led to both reduced excitability of mPFC->pPVT neurons and increased inhibitory input drive from low-threshold spiking somatostatin interneurons in adulthood, suggesting a circuit mechanism underlying sociability deficits. Chemogenetic or optogenetic stimulation of mPFC->pPVT neurons in adulthood could rescue the sociability deficits caused by juvenile isolation. Our study identifies a pair of specific mPFC excitatory and inhibitory neuron populations required for sociability that are profoundly affected by juvenile social experience.
Introduction
Loneliness is becoming increasingly recognized as a serious threat to mental health 1–3. Social isolation during childhood in particular is detrimental to adult brain function and behavior across mammalian species 4–7. Children removed from a socially-deprived institutional care environment by being placed into foster care at a young age show improved functional outcomes compared with those who were never placed into foster care, or those placed into foster care at a later age 6,7. In mice, juvenile social isolation (jSI) immediately following weaning for two weeks (21–35 days after birth: p21–35), but not during a later period, leads to decreased sociability in adulthood, suggesting the juvenile period is a sensitive period for the establishment of adult social behavior 5.
A number of studies in both humans and rodents broadly implicate the medial prefrontal cortex (mPFC) as a key part of the brain networks that regulates social behavior 8. A recent study in mice demonstrated that subcortically projecting deep-layer mPFC neurons are particularly vulnerable to jSI and that jSI reduces their excitability and synaptic drive in adulthood 9. However, the subcortical targets of deep-layer mPFC projections that are vulnerable to jSI are unknown. Here, we sought to identify the specific mPFC circuitry that requires juvenile social experience to support normal sociability in adulthood.
Results
Juvenile social isolation impairs activation of mPFC->pPVT projection neurons upon social exposure in adulthood
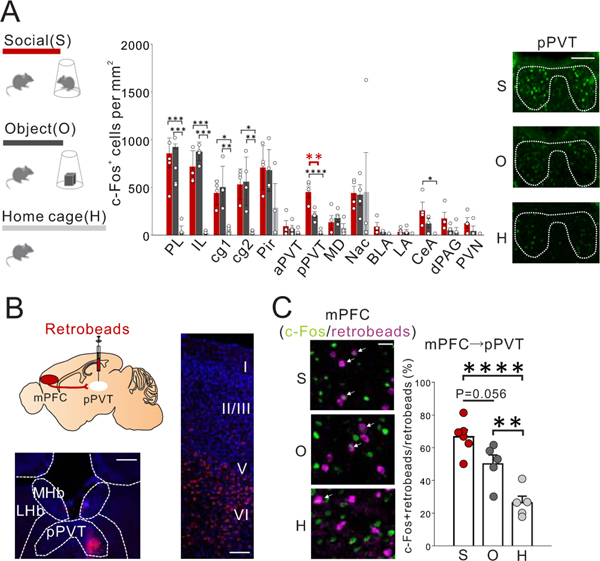
To gain insight into which subcortical regions receiving projections from the mPFC are important for social behavior, we first performed immediate early gene c-Fos expression mapping. We showed that both the posterior part of the paraventricular nucleus of thalamus (pPVT), which relays signals to various components of the classical reward circuitry10, and mPFC deep-layer neurons projecting to the pPVT were activated by exposure to a novel mouse compared with novel-object exposure (Extended Data Fig.1).
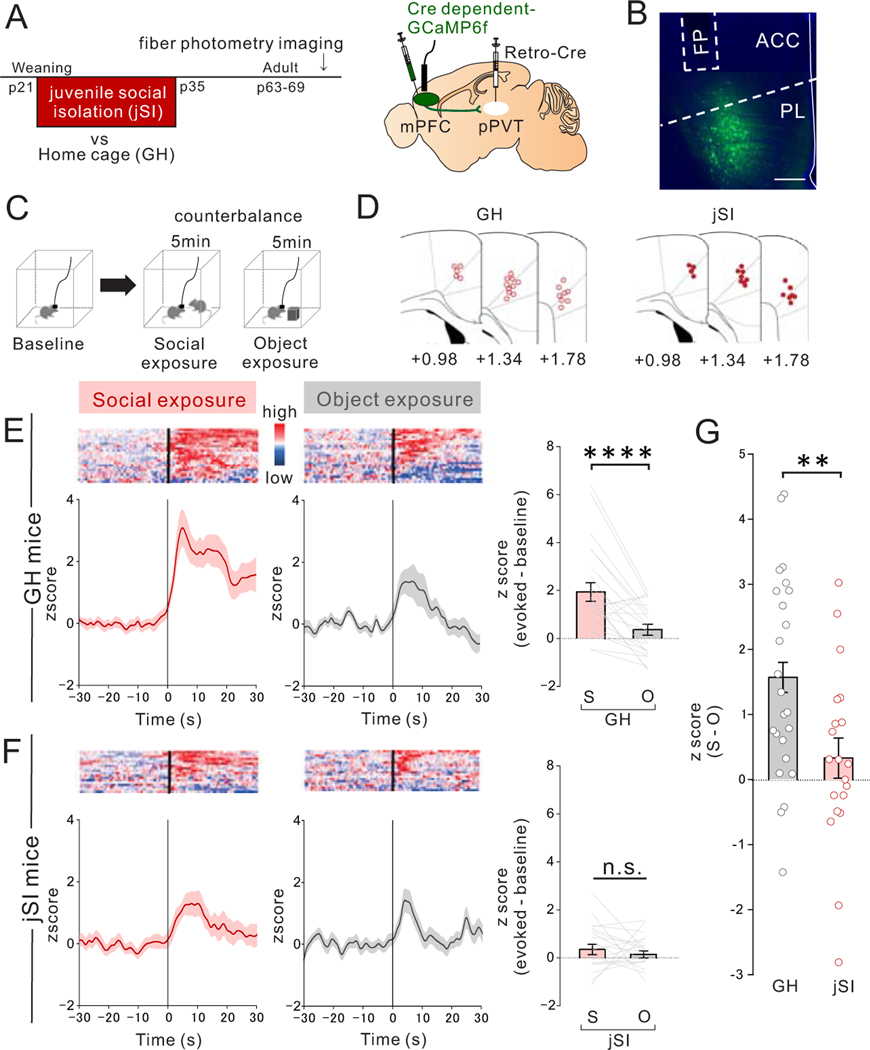
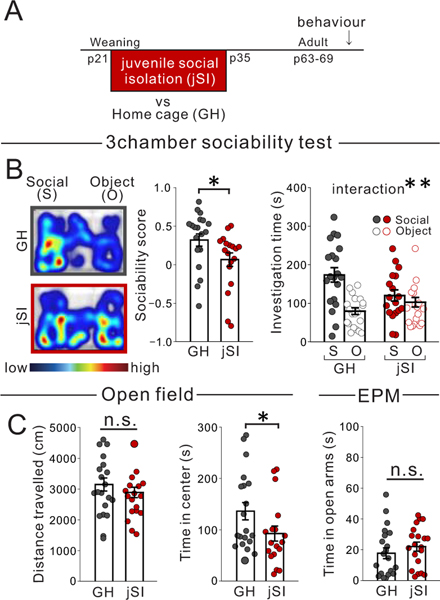
We next used fiber photometry to examine the effect of jSI on real-time activity of mPFC->pPVT projection neurons during social exploration in adult male mice (Fig.1A–D). Adult jSI mice displayed reduced sociability, compared to adult mice that were group-housed (GH) throughout their life, in the 3-chamber test as previously reported5,11 (Extended Data Fig.2). mPFC->pPVT neurons expressing the calcium indicator GCaMP6f were more robustly activated after introduction of a novel mouse than after introduction of a novel object in adult GH mice, but not in jSI mice (Fig.1E–G), demonstrating that juvenile social experience is necessary for mPFC->pPVT neurons to be fully recruited during social exploration in adulthood.
Figure 1. Juvenile social isolation impairs activation of mPFC->pPVT projection neurons upon social exposure in adulthood.
(A) (Left) Timeline showing weaning at p21, and subsequent 2 weeks of juvenile social isolation (jSI), followed by re-housing or continued control group housing (GH), and subsequent In vivo fiber photometry calcium imaging of GCaMP6f-expressing mPFC->pPVT neurons in behaving adult mice. (right) Selective viral expression of GCaMP6f in mPFC->pPVT projection neurons were achieved by injecting AAV1-DIO-GCaMP6f in mPFC and retrograde rAAV2-Cre in pPVT. (B) Representative localization of optic fiber and GCaMP6f expression in mPFC. Scale; 500μm. Experimental images were obtained from 42 mice, three images per mouse, with similar results obtained. (C) During fiber photometry imaging, mice were exposed to a novel mouse or novel object (order of object and social exploration was counterbalanced). (D) Optic fiber placement and proximity to injection sites were confirmed from all mice (GH: open circles, jSI: red circles). (E-F) Heat maps of GCaMP6f signals (red-blue: high-low) for each trial f trials (one trial per mouse) from all mice (upper panel) and averaged traces of GCaMP6f signals from mPFC->pPVT neurons (lower panel) of (E) GH mice (n=23 biologically independent mice) and (F) jSI mice (n=19 biologically independent mice). (right) Quantification of social- or object-evoked normalized GCaMP6f signals (mean Z score of 30 sec post stimulus introduction subtracted with mean Z score of 30sec baseline) from mPFC->pPVT neurons in adult GH or jSI mice. Social exposure evoked higher responses than object exposure in GH mice (two tailed paired t-test, t22=4.759, ****P=0.946×10⁻⁴) but not in jSI mice (two tailed paired t-test, t18=0.757, P=0.459). (G) jSI mice showed less difference in mPFC->pPVT neuron activity between social and object exposure (S-O) than that of GH mice (two tailed t-test, t40=2.913, **P=0.006, n=23 (GH), 19 (jSI) biologically independent mice). Data in E-G are presented as mean +/− s.e.m.
Manipulations of mPFC-> pPVT projection neuron activity bi-directionally modulate sociability in adult group-housed mice
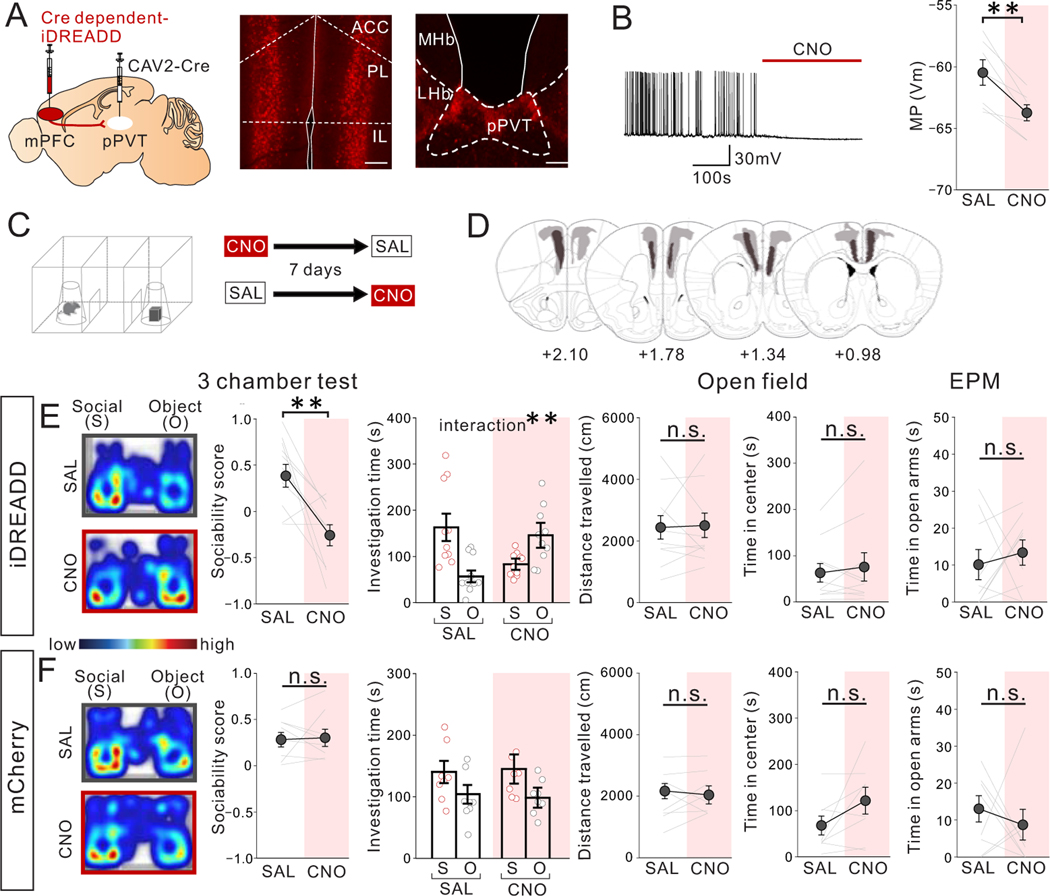
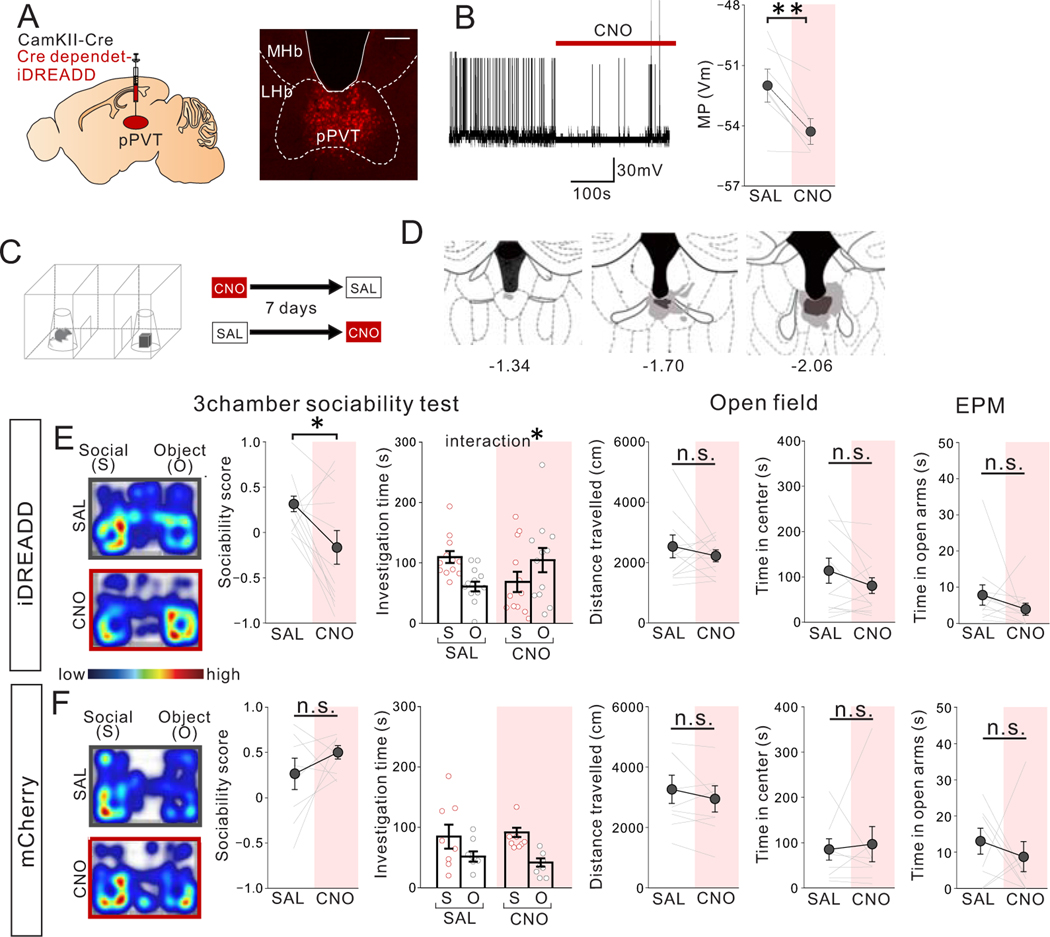
To examine the extent to which activity of mPFC->PVT projection neurons is necessary for sociability, we chemogenetically suppressed the activity of mPFC->PVT neurons expressing inhibitory (i) DREADD (Fig.2A–D). Suppression of mPFC->pPVT neuron activity through clozapine N-oxide (CNO) treatment in adult GH mice reduced sociability in the 3-chamber test, with no impact on motor activity or measurements of anxiety-related behavior (Fig.2E). CNO injection in mCherry-expressing control mice produced no significant differences in behavior compared to saline injection (Fig.2F). Chemogenetic suppression of pPVT neuron activity also reduced sociability (Extended Data Fig.3).
Figure 2. Chemogenetic suppression of mPFC->pPVT projection neuron activity reduces sociability in adult group-housed mice.
(A) (left) Cre-dependent Inhibitory DREADD (iDREADD) or mCherry vector and a retrograde CAV2-Cre were injected into the mPFC and pPVT, respectively, to express iDREADD in mPFC->pPVT neurons. Representative images from mPFC (middle) and pPVT (right) showing iDREADD-mCherry expression. (Left; Scale bar = 600 μm, Right; Scale bar = 300 μm). Experimental images were obtained from 10 mice, three images per mouse for each area were taken, with similar results obtained. (B) Validation of iDREADD in mPFC->pPVT projection neuron by whole-cell patch recording in PFC slices. (left) Representative trace of membrane potential before and after a bath application of CNO. Traces were obtained from 7 cells from 3 biologically independent mice with similar results obtained (right) Quantification of membrane potential (MP) of mPFC->pPVT neurons showing reduction after CNO application (two tailed paired t-test, t6=4.881, **P=0.003, n=7 cells from 3 biologically independent mice). (C) Group-housed adult mice were treated with saline (SAL) or CNO (10mg/kg) and then underwent the 3 chamber test of sociability. SAL and CNO session order were counter-balanced for each behavior test with a 7-day interval between tests. (D) Viral spread validation of mice expressing iDREADD in mPFC-> pPVT neurons after behavioral experiments. Gray areas represent the minimum (lighter colour) and the maximum (darker colour) spread of iDREADD. (E) (left) CNO-treated iDREADD+ mice showed reduced sociability, revealed by reduced sociability scores (calculated as (social-object)/ (social + object)) vs. SAL (two tailed paired t-test, t9=3.548, **P=0.006, n=10 biologically independent mice) and disrupted behavior in 3 chamber sociability task (two-way repeated measures (RM) ANOVA, drug (CNO/SAL) × stimulus (social/object) interaction F1,18 = 11.040, **P=0.004, effect of drug F1,18 = 0.071, P=0.793, effect of stimulus F1,18 = 0.731, P=0.404, n=10 biologically independent mice). (right) CNO-treated iDREADD+ mice showed no differences in motor activity and anxiety-related behavior (open field distance traveled; two tailed paired t-test, t9=0.183, P=0.859, n=10 biologically independent mice, open field time in center; two tailed paired t-test, t9=0.843, P=0.421, n=10 biologically independent mice, elevated plus maze (EPM) time in open arms: two tailed paired t-test, t8=0.568, P=0.586, n=9 biologically independent mice). (F) (left) Control mCherry+ mice show no difference in sociability score (two tailed paired t-test, t7=0.160, P=0.878, n=8 biologically independent mice) and investigation time (two-way RM ANOVA, drug (CNO/SAL) × stimulus (social/object) interaction F1,14 = 1.027, P=0.328, effect of drug F1,14 = 0.593, P=0.454, effect of stimulus F1,14 = 8.723, P=0.010, n=8 biologically independent mice. (right) mCherry+ mice showed no difference in motor activity or anxiety-related behaviors (Left; two tailed paired t-test, t7=0.599, P=0.568, n=8 biologically independent mice, Middle; two tailed paired t-test, t7=1.881, P=0.102, n=8 biologically independent mice, Right; two tailed paired t-test, t7=0.662, P=0.529, n=8 biologically independent mice). Data in B, E, F are presented as mean +/− s.e.m.
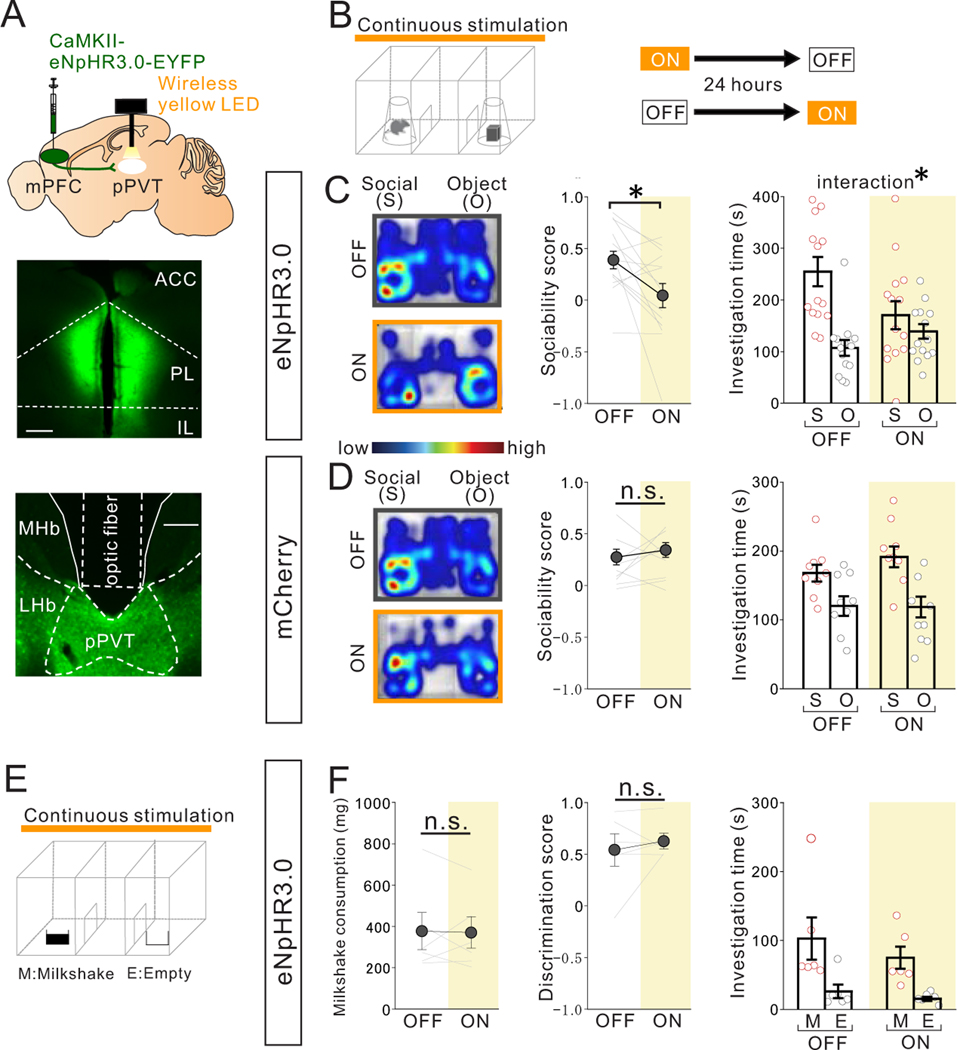
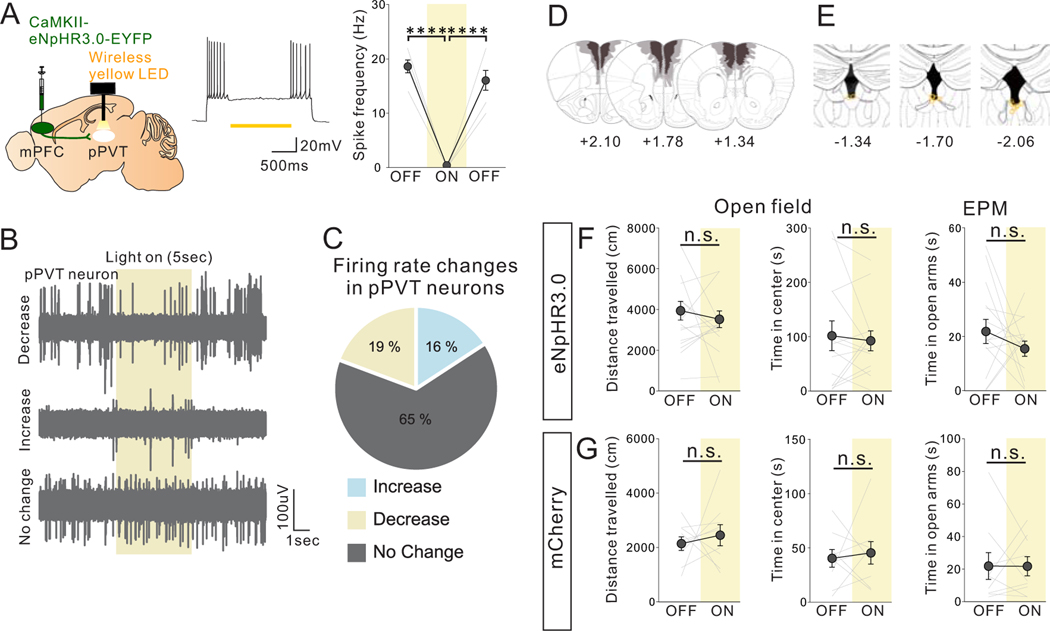
To rule out the possibility that our observed results were due to inhibition of collateral projections to other brain areas, we optogenetically suppressed the activity of mPFC projection terminals in the pPVT. mPFC->pPVT projection terminals virally expressing the inhibitory opsin eNpHR3.0 under the CaMKII promotor were wirelessly illuminated by a yellow LED light over the pPVT during behavior testing (Fig. 3A,B, Extended Data Fig.4A- E). This manipulation, which partly reduced the activity of neurons in the pPVT (Extended Data Fig.4A–C), led to reduced sociability (Fig. 3C) without impacting anxiety-related or motor behaviors (Extended Data Fig.4F). There were no light-induced behavioral effects in mCherry-expressing control mice (Fig. 3D, Extended Data Fig.4G). Importantly, this manipulation did not impact natural food preference (Fig.3E,F), suggesting that the observed sociability deficits are not a result of general impairments in natural reward-related behaviors. Collectively, these results demonstrate a causal link between mPFC->pPVT projection activity and social behavior.
Figure 3. Optogenetic suppression of mPFC->pPVT projection terminal activity reduces sociability in adult group-housed mice.
(A) (Upper) Halorhodopsin NpHR3.0 AAV under the CamKII promotor was injected into mPFC and mPFC->pPVT projection terminals were optically stimulated in the pPVT using a wireless yellow LED system. Representative images of mPFC (middle) and pPVT (lower) show selective transduction of halorhodopsin at injection areas in the mPFC and the projection target areas in the pPVT where optic fibers are located. (middle; Scale bar = 600 μm, lower; Scale bar = 300 μm). Experimental images were obtained from 14 mice, three images per mouse for each areas, with similar results obtained. (B) Mice underwent the 3 chamber test of sociability with (ON) or without (OFF) light stimulation. Order of ON and OFF sessions were counter-balanced for each behavior test with a 24 hour interval between tests. (C) Mice with optogenetic suppression showed reduced sociability scores (two tailed paired t-test, t13=2.769, *P=0.016, n=14 biologically independent mice) and loss of social preference in the 3 chamber sociability test (two-way RM ANOVA, light (ON/OFF) × stimulus (social/object) interaction F1,26 = 4.876, *P=0.036, effect of light F1,26 = 1.915, P=0.178, effect of stimulus F1,26 = 11.870, P=0.002). (D) However, control mCherry+ mice showed no difference in sociability score two tailed paired t-test, t8=0.722, P=0.491, n=9 biologically independent mice) and investigation time (two-way RM ANOVA, light (ON/OFF) × stimulus (social/object) interaction F1,16 = 0.700, P=0.415, effect of light F1,16 = 0.685, P=0.420, effect of stimulus F1,16 = 16.600, P=0.882×10⁻³, n=9 biologically independent mice). (E) Mice underwent a 3 chamber test of food preference with (ON) or without (OFF) light stimulation. ON and OFF session order is counter-balanced for each behavior test with a 24 hour interval between tests. (F) (left) Mice with optogenetic suppression showed no difference in milkshake consumption (two tailed paired t-test, t5=0.143, P=0.892, n=6 biologically independent mice), in food discrimination score (middle: two tailed paired t-test, t5=0.724, P=0.501, n=6 biologically independent mice), nor in investigation time (right: two-way RM ANOVA, light (ON/OFF) × stimulus (Milkshake/Empty) interaction F1,10 = 0.183, P=0.678, effect of light F1,10 = 1.478, P=0.252, effect of stimulus F1,10 = 12.020, P=0.006, n=6 biologically independent mice). Data in C, D, F are presented as mean +/− s.e.m.
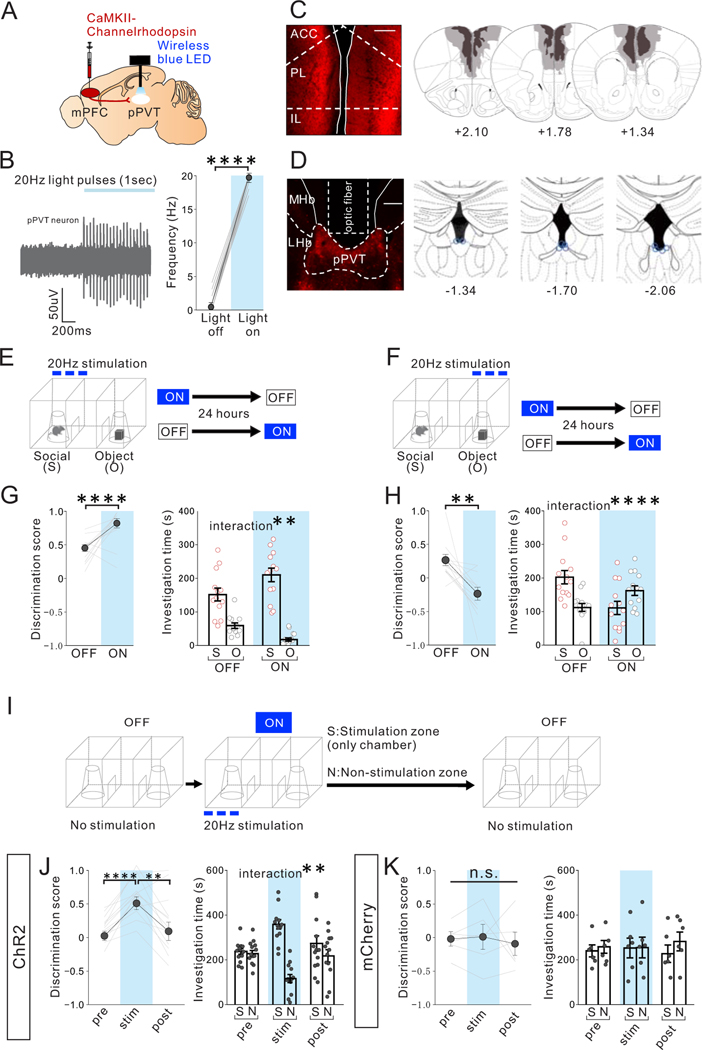
To examine whether mPFC->pPVT projection activity is sufficient to increase sociability in adult GH mice, we optogenetically activated mPFC->pPVT projections virally expressing channelrhodopsin (ChR2) under the CaMKII promotor by wirelessly illuminating a blue LED implanted over the pPVT while mice performed the 3-chamber test (Fig.4A–F). We found that optogenetic activation of mPFC->pPVT projections within the social-interaction zone led to an increase in sociability, whereas activation of mPFC->pPVT projections within the object-interaction zone reduced sociability (Fig.4E–H). Furthermore, optogenetic activation of mPFC->pPVT projections in one of two empty corral interaction zones was sufficient to increase time spent in that zone. This effect quickly disappeared after termination of light stimulation (Fig.4I–K). Altogether, these experiments demonstrate that activation of mPFC->pPVT projections is reinforcing, and is sufficient to increase sociability during social investigation.
Figure 4. Optogenetic activation of mPFC->pPVT projection terminals biases sociability in adult group-housed mice.
(A) CaMKII-ChR2 AAV1 was injected into the mPFC and a wireless blue LED was inserted above the pPVT in group-housed (GH) mice. (B) (left) A representative in vivo unit recording of pPVT neurons showing reliable spikes upon optogenetic stimulation (20Hz) of mPFC->pPVT projection terminals. Traces Experimental images were obtained from 4 mice, 5–12 cells per mouse, with similar results obtained. (right) Quantification of light-induced firing rates of pPVT neurons (light OFF vs light ON (1 s each): two tailed paired t-test, t85=160.700, ****P=0.001×10⁻¹², n=86 cells from 4 biologically independent mice,). (C) (left) Representative images of injection area of mPFC neurons expressing ChR2. Scale bar: 600μm. Experimental images were obtained from 10 mice, three images per mouse, with similar results obtained. (right) Viral spread validation from behavior-tested mice. Gray areas represent the minimum (lighter colour) and the maximum (darker colour) spread of ChR2 expression in the mPFC. (D) (left) Representative pPVT image shows selective transduction of ChR2 below the area where optic fiber tips were inserted in the pPVT. Scale bar: 300μm. Experimental images were obtained from 10 mice, three images per mouse, with similar results obtained. (right) Optic fiber tip location (blue line circles) was validated in all mice. (E-H) GH adult mice underwent the 3-chamber test of sociability with (ON) or without (OFF) light stimulation. The order of ON and OFF sessions was counter-balanced with a 24 hour interval between tests. Optogenetic stimulation was delivered to activate the mPFC->pPVT projection whenever the mouse visited the (E) mouse interaction zone or (F) object zone and was terminated immediately if the mouse exited the mouse interaction zone during the 3 chamber sociability test. Order of ON and OFF sessions was counter-balanced with a 24-hour interval between tests. (G) Optogenetic activation in the social zone led to increased sociability scores (two tailed paired t-test, t9=4.788, ****P=0.990×10⁻³, n=10 biologically independent mice,) and increased social preference (two-way RM ANOVA, light (ON/OFF) × stimulus (social/object) interaction F1,18 = 12.860, **P=0.002, effect of light F1,18= 0.488, P=0.494, effect of stimulus F1,18 = 94.020, P=0.143×10⁻⁷, n=10 biologically independent mice). (H) Optogenetic activation in the object zone led to reduced sociability scores (two tailed paired t-test, t9=3.491, **P=0.007, n=10 biologically independent mice) and increased object zone preference (two-way RM ANOVA, light (ON/OFF) × stimulus (social/object) interaction F1,18 = 15.910, ****P=0.861×10⁻³, effect of light F1,18 = 1.227, P=0.282, effect of stimulus F1,18 = 0.282, P=0.602, n=10 biologically independent mice). (I-K) Optogenetic stimulation of mPFC->pPVT projection acutely promotes place preference. (I) Adult GH mice underwent the 3 chamber test without light stimulation (pre: OFF 10 mins), followed by a stimulation period (stim: ON 10 mins), and immediately followed by another period without light stimulation (post: OFF 10 mins). During the stimulation period, optogenetic stimulation was delivered to activate the mPFC->pPVT projection whenever the mouse visited the stimulation zone (S) and was terminated immediately if the mouse exited the stimulation zone. Location of stimulation zones are counter balanced. (J) ChR2+GH mice with optogenetic stimulation showed real-time preference to the stimulation zone (S) over the non-stimulation zone (N) as indicated by increased discrimination score (calculated as (S-N)/(S+N), one-way RM ANOVA, F1.585. 19.02 = 14.760, P=0.287×10⁻³, Tukey’s multiple comparisons test: pr e vs stim ****P=0.309×10⁻⁴, stim vs post **P=0.006) as well as investigation time (two-way RM ANOVA, time (pre/stim/post) × zone (stimulation zone/Non-stimulation zone) interaction F2,36 = 7.917, **P=0.001, effect of time F2,36 = 1.325, P=0.278, effect of zone F1,36 = 16.500, P=0.251×10⁻³, n=13 biologically independent mice). (K) Control mCherry+ mice showed no difference in discrimination score (one-way RM ANOVA, F1.125, 5.624= 0.2043, P=0.696, n=6 biologically independent mice) or investigation time (two-way RM ANOVA, time (pre/stim/post) × zone (stimulation zone/Non-stimulation zone) interaction F2,15 = 0.134, P=0.876, effect of time F2,15 = 0.073, P=0.930, effect of zone F1,15 = 0.345, P=0.566, n=6 biologically independent mice). Data in B, G, H, J, K are presented as mean +/− s.e.m.
jSI leads to reduced intrinsic excitability and increased inhibitory input drive of mPFC->pPVT neurons in adulthood
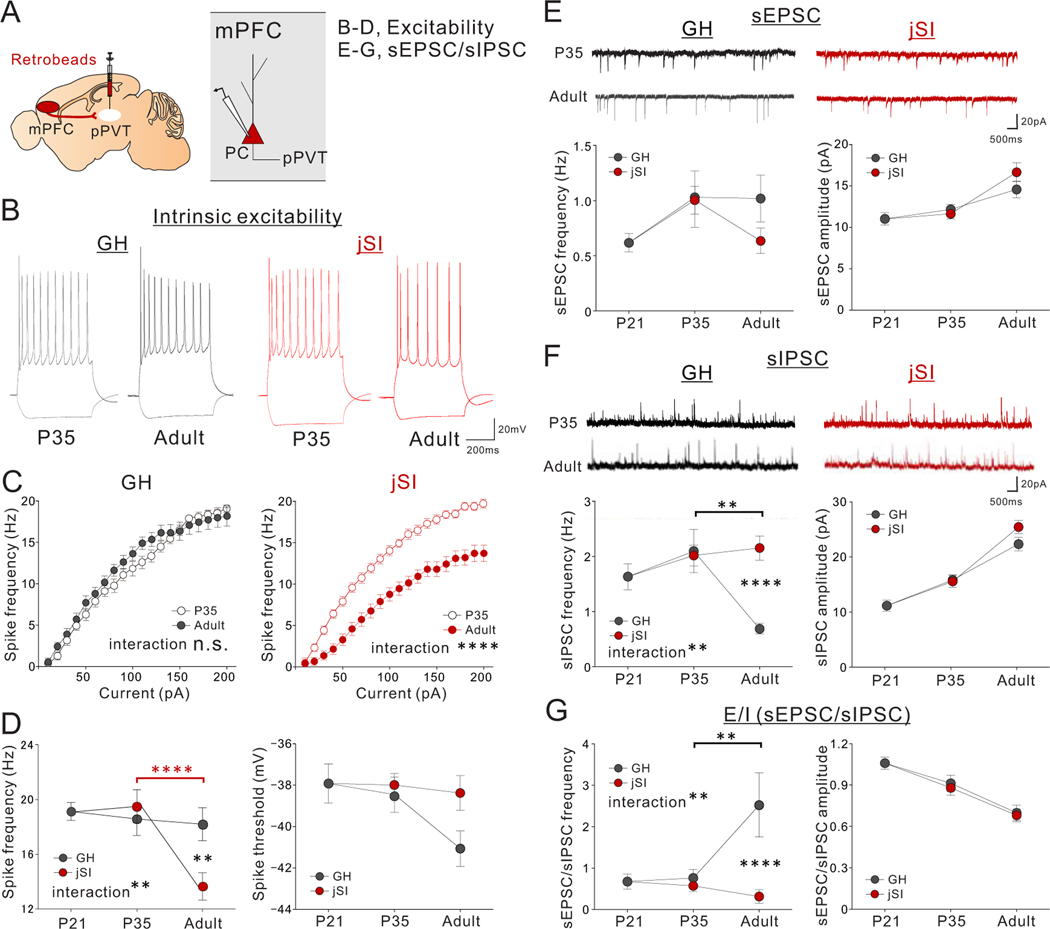
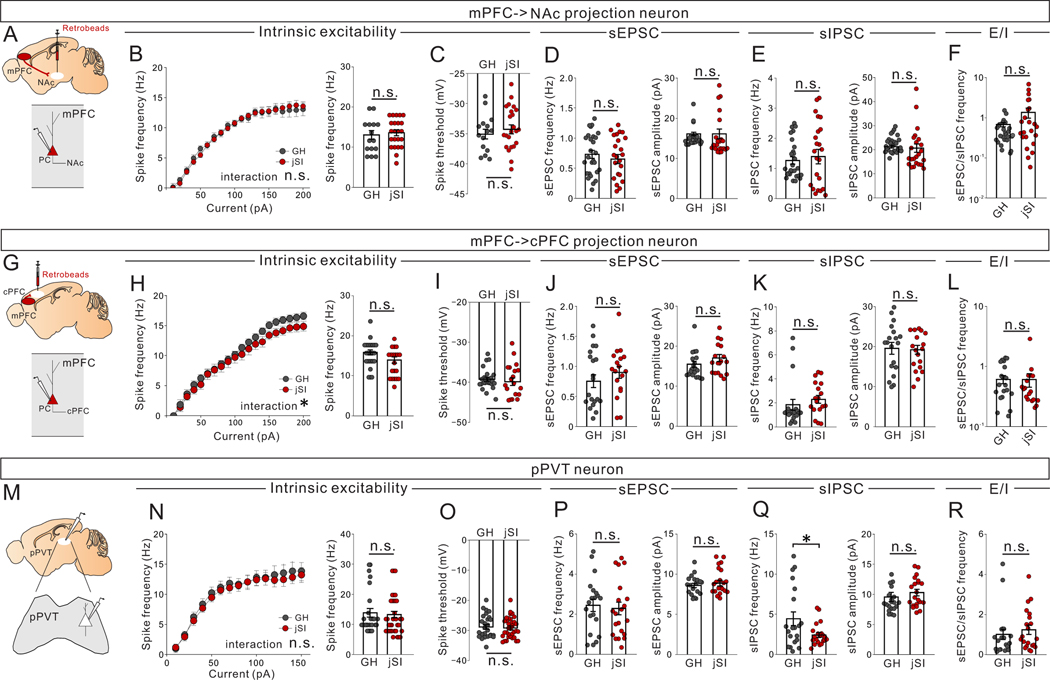
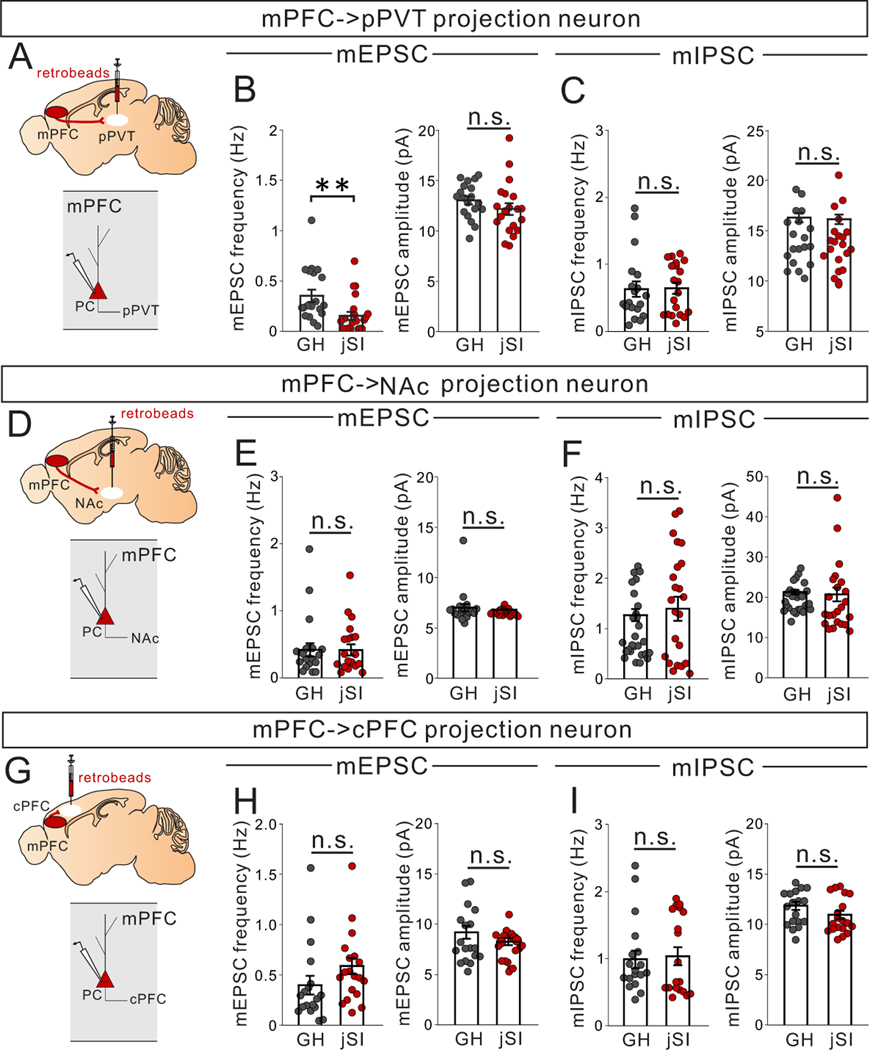
We next sought to determine the cellular and circuit-level mechanisms that underlie the failure to fully activate mPFC->pPVT neurons upon social exposure caused by jSI. Patch-clamp slice recordings of mPFC->PVT neurons from adult jSI mice revealed a reduction of intrinsic excitability (Fig.5A–D) and a significant increase in spontaneous inhibitory post synaptic currents (sIPSCs) compared with adult GH mice. In addition, there was a trend towards a decrease in spontaneous excitatory post synaptic currents (sEPSCs) in adult jSI mice compared with adult GH mice. Together, these changes contributed to a significant decrease in the ratio of sEPSC/sIPSC frequency (E/I ratio, an indicator of overall ‘drive’) in mPFC->PVT neurons from adult jSI mice compared with adult GH mice(Fig.5E–G). Of note, we did not detect any effect of jSI at the end of isolation on p35; rather, the effects of jSI only emerged in adulthood (Fig.5). In contrast, other mPFC neurons projecting to nucleus accumbens or contralateral mPFC showed no deficits in excitability or synaptic drive in jSI mice (Extended Data Fig.5A–L, Extended Data Fig.6D–I), suggesting that mPFC->pPVT neurons and the associated inhibitory circuits are particularly vulnerable to jSI.
Figure 5. jSI leads to reduced intrinsic excitability and increased inhibitory input drive of mPFC->PVT neurons in adulthood.
(A) mPFC->pPVT neurons were labeled with retrobeads injected into the pPVT of mice underwent jSI (p21-p35) or GH. Whole-cell patch clamp recordings of mPFC->pPVT neurons were performed from mPFC slices of P21, P35 (jSI, GH), or adult (jSI, GH) mice. (B-D) Assessment of intrinsic excitability of mPFC-> pPVT neurons. (B) Representative traces in the presence of DNQX (20μM), D-AP5 (50μM), and picrotoxin (30μM) at −100pA and 200pA current steps. Traces are recorded from 20–23 cells from 7–9 biologically independent mice per group, with similar results obtained. (C) Input-output curve in P35 and Adult mice in GH (left: two-way RM ANOVA, housing x current step interaction F19,779 = 1.496, P=0.079, effect of current step F19,779 = 339.700, P=0.001×10⁻¹², effect of housing F1,41 = 0.226, P=0.637, n=21, 22 cells from 7, 7 biologically independent P35 or Adult mice in GH respectively) and jSI (right: two-way RM ANOVA, housing (GH/jSI) x current step interaction F19,779 = 10.790, ****P=0.001×10⁻¹², effect of current step F19,779 = 494.400, P=0.001×10⁻¹², effect of housing F1,41 = 41.830, P=0.935×10⁻⁷, n=20, 23 cells from 7, 9 biologically independent P35 or Adult mice in jSI respectively). (D) At the 200pA current step, jSI mice showed a significantly lower spike frequency compared with GH mice only after p35 during adulthood (two-way RM ANOVA, housing (GH/jSI) x age (P21/P35/Adult) interaction F2,126 = 6.171, **P=0.003, effect of housing F1,126 = 4.128, P=0.044, effect of age F2,126 = 12.380, P=0.123×10⁻⁴, Tukey’s multiple comparisons test: **P=0.001 (Adult: jSI vs GH), ****P=0.512×10⁻⁵ (jSI: p35 vs adult), n=23 cells from 6 biologically independent mice (p21), n=20 cells from biologically independent 7 jSI mice (p35), n=21 cells from biologically independent 7 GH mice (p35), n=23 cells from biologically independent 9 jSI mice (adult), and n=22 cells from biologically independent 7 GH mice (adult)). Spike threshold showed no significant difference between GH and jSI (two-way RM ANOVA, housing (GH/jSI) x age (P21/P35/Adult) interaction F2,126 = 1.447, P=0.239, effect of housing F1,126 = 2.265, P=0.135, effect of age F2,126 = 2.611, P=0.077). (E-G) Assessment of excitatory and inhibitory drive onto mPFC->pPVT neurons. n=23 cells from biologically independent 6 mice (p21), n=21 cells from biologically independent 7 jSI mice (p35), n=22 cells from biologically independent 7 GH mice (p35), n=22 cells from biologically independent 9 jSI mice (adult), and n=21 cells from biologically independent 9 GH mice (adult). (E) (upper) Representative traces of sEPSCs. Traces were recorded from 21–22 cells from 7–9 mice per group, with similar results obtained. (lower) sEPSC showed significant developmental changes but no difference between jSI and GH (Frequency: two-way RM ANOVA, housing (GH/jSI) x age (P21/P35/Adult) interaction F2,126 = 0.975, P=0.380, effect of housing F1,126 = 1.187, P=0.278, effect of age F2,126 = 3.423, P=0.036, Amplitude: two-way RM ANOVA, housing (GH/jSI) x age (P21/P35/Adult) interaction F2,126 = 1.375, P=0.257, effect of housing F1,126 = 1.335, P=0.250, effect of age F2,126 = 20.450, P=0.203×10⁻⁷). (F) (upper) Representative traces of sIPSCs. Traces were recorded from 21–22 cells from 7–9 mice per group, with similar results obtained. (lower left) sIPSC frequency in jSI mice failed to decrease between p35 and adulthood (two-way RM ANOVA, housing (GH/jSI) x age (P21/P35/Adult) interaction F2,126 = 6.146, **P=0.003, effect of housing F1,126 = 5.267, P=0.023, effect of age F2,126 = 3.400, P=0.036, Tukey’s multiple comparisons test: ****P=0.826×10⁻³ (Adult: jSI vs GH), **P=0.001 (GH: p35 vs adult)). (lower right) sIPSC amplitude showed significant developmental changes but no difference between jSI and GH (two-way RM ANOVA, housing (GH/jSI) x age (P21/P35/Adult) interaction F2,126 = 1.408, P=0.249, effect of housing F1,126 = 2.638, P=0.107, effect of age F2,126 = 89.870, P=0.001×10⁻¹²). (G) The ratio of sEPSC/sIPSC frequency was significantly different between GH and jSI only after p35 in adulthood. jSI mice did not show a late developmental increase in the ratio between p35 and adulthood as in GH mice did (two-way RM ANOVA, housing (GH/jSI) x age (P21/P35/Adult) interaction F2,126 = 6.667, **P=0.001, effect of housing F1,126 = 8.628, P=0.004, effect of age F2,126 = 3.310, P=0.040, Tukey’s multiple comparisons test: ****P=0.130×10⁻³ (Adult: jSI vs GH), **P=0.004 (GH: p35 vs adult)). The ratio of sEPSC/sIPSC amplitude showed developmental changes but no significant difference between jSI and GH groups (two-way RM ANOVA, housing (GH/jSI) x age (P21/P35/Adult) interaction F2,126 = 0.052, P=0.949, effect of housing F1,126 = 0.163, P=0.687, effect of age F2,126 = 26.770, P=0.204×10⁻⁹). Data in C-G are presented as mean +/− s.e.m.
To examine the downstream synaptic targets of mPFC->pPVT projection neurons, we next performed whole-cell patch clamp recordings from pPVT neurons combined with optogenetic activation of ChR2-expressing mPFC->pPVT neurons (Extended Data Fig.7A). The majority of patched pPVT neurons showed evoked responses (73.3%: 22/30cells for GH, 68.8%: 22/32cells for jSI). While both groups showed comparable levels of monosynaptic excitatory connectivity (Extended Data Fig.7B,C), jSI mice showed smaller normalized amplitude of evoked EPSCs compared to GH mice (Extended Data Fig.7D), with no differences in paired pulse ratio (PPR) (Extended Data Fig.7E). These findings suggest that jSI causes a lasting reduction in evoked excitatory synaptic transmission onto pPVT neurons. In contrast to mPFC->pPVT neurons, pPVT neurons themselves showed little vulnerability to jSI (Extended Data Fig.5M–R).
jSI leads to increased intrinsic excitability of mPFC LTS-SST interneurons and impaired LTS-SST to mPFC->pPVT synaptic transmission in adulthood
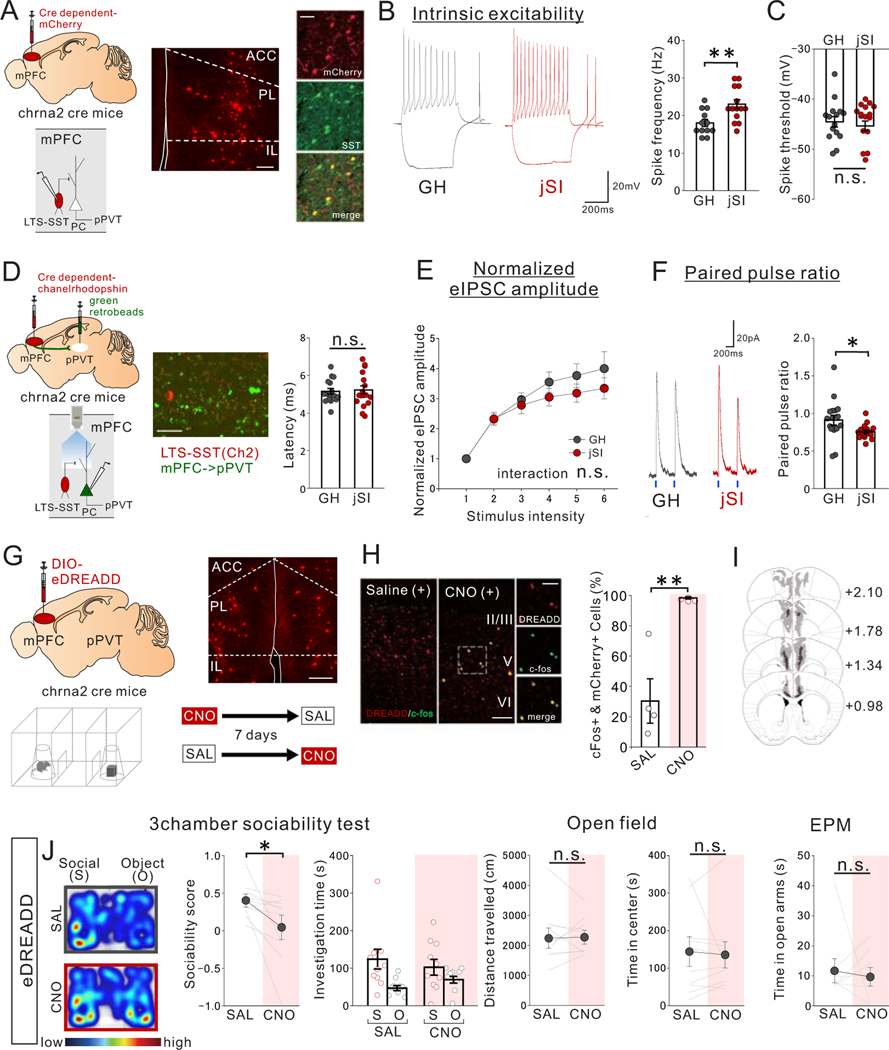
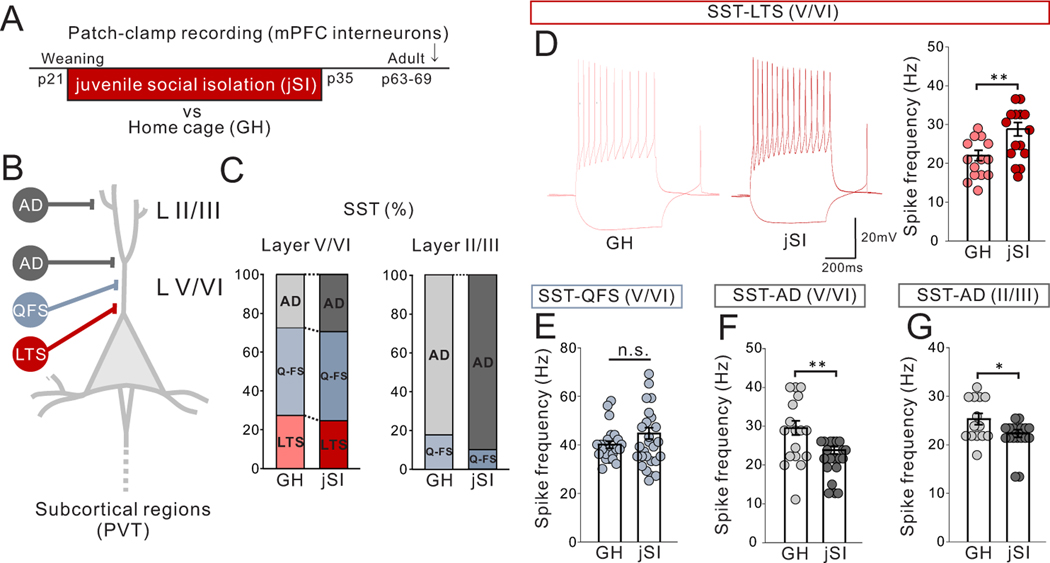
We next aimed to identify the population of neurons responsible for the increased inhibitory drive onto mPFC->pPVT neurons induced by jSI. As miniature IPSCs of mPFC->pPVT neurons were not impacted by jSI (Extended Data Fig.6A–C), the increased inhibitory drive is likely driven by an action potential-dependent increase in inhibitory neuron activity. We thus screened sub-types of mPFC interneurons expressing somatostatin (SST)12 and parvalbumin11, and found that a subclass of deep-layer SST-expressing low-threshold spiking (LTS) interneurons showed increased excitability in adult jSI mice compared with GH mice (Extended Data Fig. 8). To selectively manipulate LTS-SST interneurons, we used Chrna2-Cre mice13 in which 90.61+/−4.210% (n=6 mice) of mPFC Chrna2-Cre+cells show SST immunoreactivity (Fig.6A). Whole-cell patch-clamp recordings from mPFC Chrna2+LTS-SST interneurons showed an increase in intrinsic excitability in adult Chrna2-Cre driver mice that had undergone jSI vs GH mice (Fig.6B,C).
Figure 6. jSI leads to increased intrinsic excitability of mPFC LTS-SST interneurons and impaired LTS-SST to mPFC->pPVT synaptic transmission in adulthood.
(A-C) Whole-cell patch clamp recording from low threshold spiking (LTS)-somatostatin (SST) interneurons in mPFC slices of adult jSI or GH mice. (A) mPFC LTS-SST interneurons are fluorescently labeled by injecting a Cre-dependent mCherry vector into adult Chrna2-Cre mice. (middle) Representative image of Chrna2+LTS-SST interneurons expressing mCherry in the mPFC. (right) co-localization of mCherry and SST immunoreactivity (green) in the mPFC. Scale bar: 150 um (left), 50um (right) Experimental images were obtained from 6 mice, 3 images per mouse, with similar results obtained. (B) (left) Assessment of intrinsic excitability of Chrna2+ LTS-SST interneurons in the presence of DNQX (20μM), D-AP5 (50μM), and picrotoxin (30μM). (left) Representative traces at 200pA injection recorded from mPFC LTS-SST interneurons (traces were recorded from 12–14 cells from 7 biologically independent mice per group) and (right) quantification of spike frequency (two tailed t-test, n=14 cells from 7 biologically independent jSI mice, t24=3.186, **P=0.004, n=12 cells from 7 biologically independent GH mice). (C) There were no significant differences in spike threshold (two tailed t-test, t24=0.257, P=0.800, n=12 cells from 7 biologically independent GH mice, n=14 cells from 7 biologically independent jSI mice). (D-F) Optogenetic interrogation of LTS-SST interneuron input onto mPFC->pPVT projection neurons. (D) Cre-dependent ChR2 vector and green retrobeads were injected into the mPFC and pPVT, respectively, to express ChR2 in LTS-SST interneurons and fluorescently label mPFC->pPVT neurons for patch-clamp recordings. (middle) A representative image showing ChR2-mCherry+LTS-SST interneurons and retrobeads+mPFC->pPVT projection neurons in deep layer mPFC. Scale bar 50um. Experimental images were obtained from 3 mice, 16 images per mouse, with similar results obtained. (right) Latency of light-evoked IPSC of mPFC->pPVT neurons indicates monosynaptic inhibitory inputs from LTS-SST interneurons but indicates no significant difference between GH and jSI mice (two tailed t-test, t32=0.284, P=0.778, n=17 cells from 7 biologically independent mice for each group). (E) Stimulus Intensity–response amplitude curves of normalized eEPSC upon optical stimulation with a light intensity incrementally increased in a step-wise fashion (0.1mW/mm2/step) from the minimal stimulation level 1. Plotted eIPSC amplitudes were normalized to the amplitude of the response evoked by the minimal stimulation intensity for each patched cells individually to mitigate the impact of variations in viral expression levels. There were no significant differences in normalized eIPSC amplitude (two-way RM ANOVA, housing (GH/jSI) x light intensity step interaction F5,145 = 1.217, P=0.304, effect of housing F1,29 = 0.872, P=0.304, effect of light intensity step F5,145 = 52.460, P=0.001×10⁻¹², n=15 cells from 7 biologically independent GH mice, n=16 cells from 7 biologically independent jSI mice). (F) (left) eIPSCs elicited by optogenetic stimulation. Representative averaged waveform showing paired-pulse facilitation in eIPSCs at a 500-ms interval. Traces were recorded from 17 cells from 7 mice per group, with similar results obtained. (right) Quantification of paired pulse ratio (PPR), given by second evoked amplitude/first evoked amplitude (two tailed t-test, t32=2.220, *P=0.034, n=17 cells from 7 biologically independent mice for each group). (G-J) Chemogenetic activation of mPFC Chrna2+LTS-SST interneurons reduces sociability in adult GH mice. (G) (top left) Cre-dependent AAV8-DIO-eDREADD was injected into the mPFC of Chrna2-Cre mice. (top right) A representative image showing transduction of eDREADD-mCherry at injection areas in the mPFC. Scale bar: 150μm. Experimental images were obtained from 10 mice, four images per mouse, with similar results obtained. (bottom) Mice were treated with saline (SAL) or CNO (1mg/kg) and then underwent the 3 chamber test of sociability. For CNO and SAL injections, order was counter-balanced with a one-week interval between tests. (H) Co-localization analysis of c-Fos immunoreactivity and mCherry confirmed efficacy of the eDREADD virus in activating Chrna2+LTS interneurons. (left) Representative images for mice treated with SAL and CNO show significant co-localization between mCherry (red) and c-Fos (green) only in CNO-treated mice (Experimental images were obtained from 4 mice per group, 10 images per mouse, with similar results obtained) and quantification (two tailed t-test, t6=4.648, **P=0.004, n=4 biologically independent mice). Scale bar: 100um (left), 50um (right) (I) Viral spread validation of eDREADD expression from behavior-tested mice. Gray areas represent the minimum (lighter colour) and the maximum (darker colour) spread of eDREADD in the mPFC. (J) (left) CNO-treated eDREADD+ mice showed reduced sociability scores (two tailed paired t-test, t9=2.489, *P=0.034, n=10 biological independent mice). Breakdown of social and object investigation time (two-way RM ANOVA, drug (CNO/SAL) × stimulus (social/object) interaction F1,18 = 1.704, P=0.208, effect of drug F1,18 = 0.004, P=0.953, effect of stimulus F1,18 = 10.750, P=0.004, n=10 biologically independent mice). (right) eDREADD+ mice showed no differences in motor activity or anxiety-related behaviors when treated with SAL vs. CNO (Left; two tailed paired t-test, t9=0.167, P=0.871, n=10 biologically independent mice, Middle; two tailed paired t-test, t9=0.332, P=0.748, n=10 biologically independent mice, Right; two tailed paired t-test, t9=0.434, P=0.674, n=10 biologically independent mice). Data in B, C, E, F, H, J are presented as mean +/− s.e.m.
Next, we directly examined the synaptic inputs from mPFC LTS-SST interneurons to mPFC->pPVT neurons by performing whole-cell patch-clamp recordings from retrobead-labeled mPFC->pPVT projection neurons combined with optogenetic activation of ChR2-expressing mPFC LTS-SST interneurons (Fig.6D). Results indicated that all patched mPFC->pPVT neurons receive robust monosynaptic input from LTS-SST interneurons (Fig.6D). The amplitude of optically-evoked responses, normalized to the amplitude of the response evoked by the lowest light intensity level for each cell, was comparable between jSI and GH groups, but the paired pulse ratio (PPR) was reduced in jSI mice compared to GH mice (Fig.6E,F), suggesting changes in presynaptic mechanisms of inhibitory neurotransmitter release caused by jSI. Importantly, Chrna2+LTS-SST interneurons were previously shown to selectively target deep-layer pyramidal neurons that typically project to sub-cortical targets but not to callosal projection neurons or intratelencephalic neurons13; consistent with this finding, we observed no change in inhibitory drive in mPFC neurons projecting to the contralateral PFC (mPFC->cPFC) or nucleus accumbens (mPFC->NAc) located in the upper layer in jSI mice vs GH mice (Extended data Fig. 5).
Consistent with these results, excitatory (e)DREADD-mediated activation of mPFC LTS-SST interneurons in GH mice (which recapitulates the physiological deficit seen in jSI mice) was sufficient to reduce sociability without impacting motor activity or anxiety-related behavior (Fig.6G–J). Collectively, these experiments demonstrate that jSI leads to enduring neurophysiological deficits in mPFC->pPVT neurons and in LTS-SST interneurons, which are likely to be the cause of the sociability deficit and reduced activation of mPFC->pPVT neurons during social exploration in jSI mice.
Activation of mPFC->pPVT neurons rescues sociability deficits in adult jSI mice
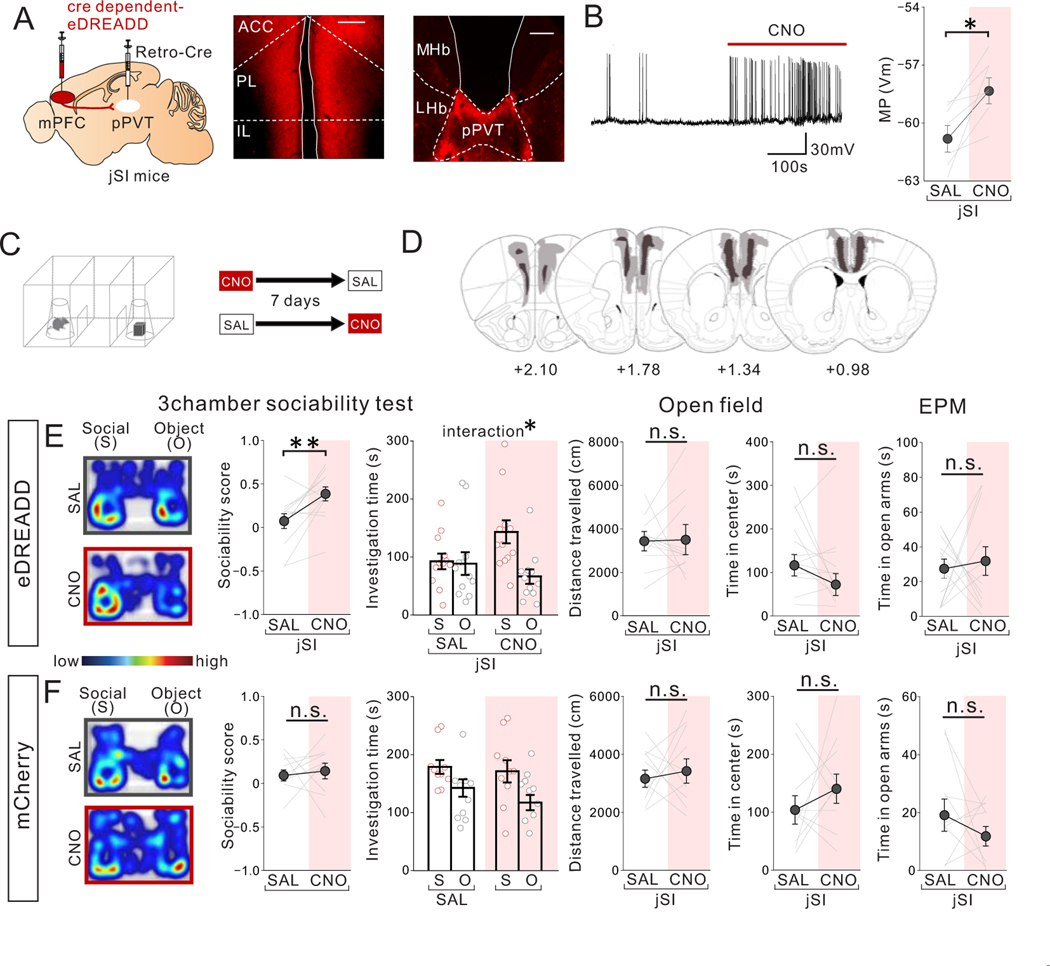
We next sought to determine whether acute restoration of mPFC->pPVT neuron activity is sufficient to ameliorate sociability deficits in adult jSI mice. We found that chemogenetic activation of mPFC->pPVT projection neurons expressing eDREADD through CNO treatment could acutely rescue sociability deficits in the adult jSI mice without impacting motor activity or anxiety-related behavior (Fig.7A–E). CNO injection in mCherry-expressing control jSI mice produced no CNO-dependent behavioral effect (Fig.7F).
Figure 7. Chemogenetic activation of mPFC-pPVT projection neurons rescues sociability deficits in adult jSI mice.
(A) (left) Cre-dependent eDREADD (or mCherry) AAV8 and a retrograde rAAV2-Cre were injected into the mPFC and pPVT, respectively, to selectively express eDREADD in mPFC->pPVT neurons. Representative images of mPFC (middle) and pPVT (right) show selective transduction of eDREADD in mPFC-pPVT projection neurons. (middle; scale bar = 600 μm, right; scale bar = 300 μm). Experimental images were obtained from 12 mice, four images per mouse for mPFC and two images per mouse for pPVT, with similar results obtained. (B) Validation of eDREADD action in mPFC->pPVT projection neurons by slice whole-cell patch clamp recordings. Representative trace (left) showing that bath application of CNO significantly increases membrane potential of mPFC->pPVT projection neuron (traces were obtained from 7 cells of biologically independent 3 mice, with similar results obtained) and (right) quantification (two tailed paired t-test, t6=3.682, *P=0.010, n=7 cells from biologically independent 3 mice). (C) jSI mice were treated with saline (SAL) or CNO (1mg/kg) in a counter balanced fashion and then underwent the 3 chamber test of sociability, the open field, and elevated plus maze (EPM). with a 7-day interval between tests. (D) Viral spread validation of behavior-tested mice. Gray areas represent the minimum (lighter colour) and the maximum (darker colour) spread of eDREADD into the mPFC. (E) CNO-treated eDREADD+jSI mice show increased sociability scores vs SAL (two tailed paired t-test, t11=3.330, **P=0.007, n=12 biologically independent mice) and increased social interaction (two-way RM ANOVA, drug (CNO/SAL) × stimulus (social/object) interaction F1,22 = 5.191, *P=0.033, effect of drug F1,22 = 0.681, P=0.418, effect of stimulus F1,22 = 6.327, P=0.020, n=12 biologically independent mice). eDREADD+jSI mice showed no differences in motor activity or anxiety-related behaviors between SAL and CNO sessions (Left; two tailed paired t-test, t11=0.097, P=0.925, n=12 biologically l independent mice, Middle; two tailed paired t-test, t11=1.498, P=0.162, n=12 biologically independent mice, Right; two tailed paired t-test, t11=0.357, P=0.728, n=12 biologically independent mice). (F) Control mCherry+ jSI mice show no difference in sociability score (two tailed paired t-test, t9=0.393, P=0.703, n=10 biologically independent mice) and investigation time (two-way RM ANOVA, drug (CNO/SAL) × stimulus (social/object) interaction F1,18 = 0.307, P=0.586, effect of drug F1,18 =1.352, P=0.260, effect of stimulus F1,18 = 7.914, P=0.012, n=10 biological independent mice). mCherry+ jSI mice showed no difference in motor activity or anxiety-related behaviors in SAL vs. CNO sessions (two tailed paired t-test, Left; t9=0.446, P=0.666, Middle; t9=0.947, P=0.368, Right; t9=1.083, P=0.307, n=10 biologically independent mice). Data in B, E, F are presented as mean +/− s.e.m.
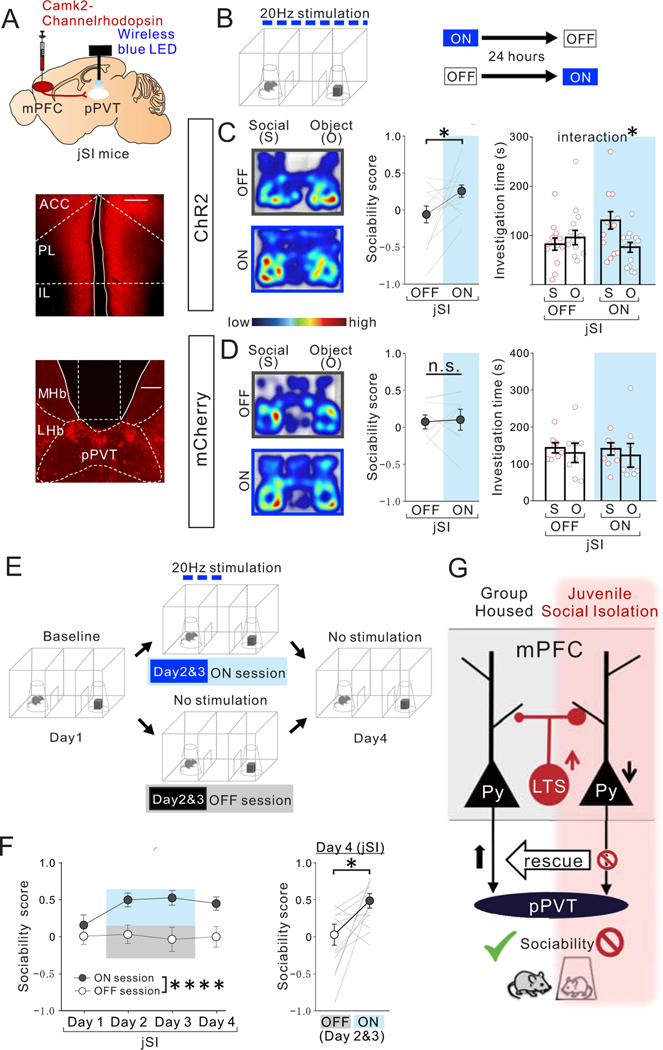
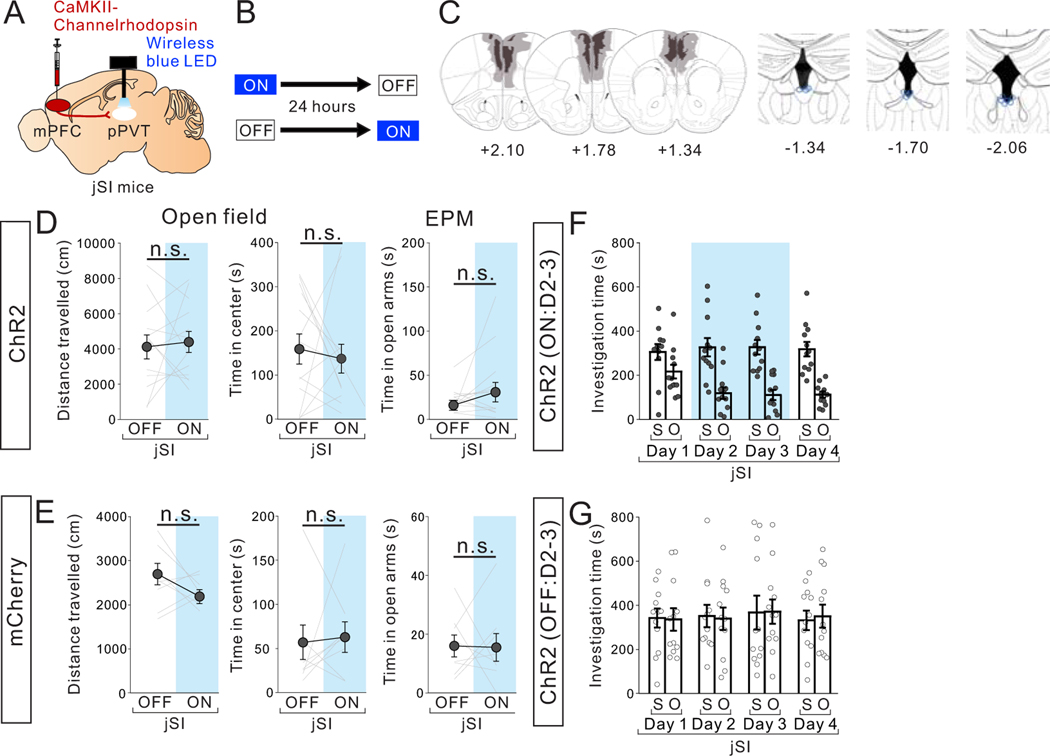
Next, to selectively examine the contribution of mPFC->pPVT projection terminals in pPVT, we optogenetically activated mPFC projection terminals in the pPVT which virally express ChR2 by wirelessly illuminating a blue LED over the pPVT during behavior testing (Fig.8A,B, Extended Data Fig.9A–C). We found that this stimulation treatment acutely rescued sociability deficits in jSI mice (Fig.8C), without impacting anxiety-related or motor behaviors (Extended Data Fig.9D). mCherry-expressing control jSI mice did not show any light-induced behavioral effects (Fig.8D, Extended Data Fig.9E).
Figure. 8. Optogenetic activation of mPFC->pPVT projection terminals rescues sociability deficits in adult jSI mice.
(A) (top) AAV encoding Channelrhodopshin ChR2 under the CamK2 promotor was injected into the mPFC and a wireless blue LED was inserted above the pPVT of adult jSI mice. Representative images of mPFC (middle) and pPVT (bottom) show selective transduction of ChR2 in injection areas in the mPFC, and at projection target areas in the pPVT where optic fibers are located (middle; scale bar = 600 μm, bottom; scale bar = 300 μm). Experimental images were obtained from 13 mice, three images per mouse for each area, with similar results obtained. (B) Adult jSI mice underwent the 3 chamber test for sociability with (ON) or without (OFF) light stimulation. ON and OFF sessions were counter-balanced with a 24-hour interval between each behavior test. (C) ChR2+ jSI mice receiving optogenetic stimulation showed increased sociability scores (two tailed paired t-test, t12=2.284, *P=0.041, n=13 biologically independent jSI mice) and increased social interaction (two-way RM ANOVA, light (ON/OFF) × stimulus (social/object) interaction F1,24 = 5.064, *P=0.034, effect of light F1,24 = 1.224, P=0.280, effect of stimulus F1,24 = 1.865, P=0.185, n=13 biologically independent jSI mice). (D) Control mCherry+ mice showed no difference in sociability score (two tailed paired t-test, t7=0.258, P=0.804, n=8 biologically independent jSI mice) and investigation time (two-way RM ANOVA, light (ON/OFF) × stimulus (social/object) interaction F1,14 = 0.007, P=0.936, effect of light F1,14 = 0.082, P=0.779, effect of stimulus F1,14 = 0.457, P=0.510, n=6 biologically independent jSI mice). (E) Experimental paradigm to examine how long the effect of optogenetic stimulation of mPFC->pPVT projection persists. Baseline day (Day1): mice (12 mice) explored the 3-chamber arena with novel mouse and novel object corrals for 20 mins. (Days 2 & 3): Mice underwent the same 3-chamber test as on Day 1, except mPFC->pPVT circuits were stimulated whenever test mice entered the social interaction zone surrounding a wire corral and the session was extended to 30 min. A probe test day (Day4): mice underwent the 3-chamber test in the absence of optogenetic stimulation for 20 mins. (F) (Left) Sociability scores from Day1 to Day4 (first 20 mins) show a significant sustained effect of light stimulation on Day 2 and 3 (two-way RM ANOVA, light (ON/OFF) × day (Day1/Day2/Day3/Day4) interaction F3,66 = 1.172, P=0.327, effect of light F1,22 = 45.940, ****P=0.823×10⁻⁶, effect of day F2.054, 45.18 = 1.012, P=0.373, n=12 biologically independent jSI mice). (Right) On Day 4, recovery of sociability persisted in the absence of light stimulation (two tailed paired t-test, t11=2.654, *P=0.022, n=12 biologically independent jSI mice). Data in C, D, F are presented as mean +/− s.e.m. (G) Summary Scheme: Activation of mPFC->pPVT projection neurons is essential for normal sociability in adult GH mice. However, these neurons show decreased intrinsic excitability and an increased inhibitory input drive from mPFC LTS-SST interneurons when deprived of juvenile social experience, a manipulation that leads to decreased social interaction in adulthood. Decreased social interaction can be induced in GH animals by inhibiting mPFC->pPVT projection or activating mPFC LTS-SST interneurons in adulthood and sociability of jSI mice can be rescued by increasing PFC->pPVT projection neuron activity.
Finally, to examine if repeated optogenetic activation of mPFC->pPVT terminals can lead to a sustained rescue of sociability deficits, jSI mice participated in two sessions where optogenetic stimulation was triggered whenever the subject investigated the mouse in the 3-chamber test setting, and then underwent sociability testing on the next day without optogenetic stimulation. We found that this intervention leads to a rescue effect that is sustained 24 hours after the final day of optogenetic stimulation (Fig.8E,F, Extended Data Fig.9F,G).
Discussion
Overall, our study identifies a pair of mPFC excitatory and inhibitory neuron populations required for normal adult sociability which are affected by social experience during juvenile period (Fig.8G). The finding that these deficits are not observed immediately after the isolation period but only emerge in adulthood suggests that the deficits may be caused by a mismatch between the jSI mouse’s adult social environment and adaptations resulting from experience during development. The juvenile period may be a sensitive window for behavioral plasticity, and once closed, mice may not be able to adjust their social strategy. Given that the PVT projects to various reward-associated areas including the NAc, bed nucleus of the stria terminalis, and central amygdala through collateralized projections 10,14, mPFC->pPVT neurons are well-positioned to provide top-down control of brain networks. Our study sheds light on a previously unrecognized role of mPFC->PVT projections in naturalistic (unconditioned) social processing in addition to their known function in Pavlovian conditioning and extinction 15–18. Among diverse sub-types of SST interneurons 12, LTS-SST cells are also well-positioned to both initiate and maintain prolonged synchronous firing of sub-cortically projecting deep-layer pyramidal cells through slow rhythmic burst activity and rebound excitation 13. Thus, LTS-SST cells may play a pivotal role in social behavior by rhythmically activating mPFC->pPVT neurons and facilitating mPFC–pPVT synchrony. Aberrant mPFC EEG power in jSI mice during social exploration reported in a previous study19 may in turn reflect disrupted communication between the mPFC and PVT.
Our study adds another circuit element to the complexity of social-processing networks in the mPFC, but is consistent with recent studies demonstrating diverse activation patterns of mPFC neurons during social behavior in mice20–23. In contrast to other mPFC projections that have been reported to reduce sociability upon activation, such as the projections to the lateral habenula (located in close proximity to the PVT) 24–27, activation of mPFC->PVT projection promotes sociability in a fashion that is similar to cerebellum–ventral tegmental area projections28. Future studies are warranted to reveal how different populations of mPFC projection neurons influence subcortical networks that control social behavior and are impacted by prior social experience.
Previous genetic and transcriptomic studies show that many risk genes for autism and schizophrenia are highly expressed in fetal and infant L5/6 PFC projection neurons 29,30. Mechanistic studies in rodents further showed that functioning of sub-cortically projecting L5/6 mPFC neurons is disrupted in mouse models with risk gene disruptions26. Future pre-clinical studies will reveal the extent to which disease risk genes impact maturation of the identified circuits. As mPFC->pPVT neurons and associated LTS-SST interneurons are sensitive to experience-dependent modulation, they are promising targets for treatments of social behavior deficits associated with psychiatric disorders that use non-invasive brain modulation techniques such as transcranial magnetic stimulation and/or transcranial direct current stimulation.
Methods
Animals
Male C57Bl/6 wildtype mice, Chrna2-Cre mice (Tg(Chrna2-cre)1Kldr), PV-Cre mice (stock number 017320, Jackson Laboratory), and SST-Cre mice (stock number 013044, Jackson Laboratory) crossed with Cre-dependent eGFP-L10a mice (Ribo-GFP #024750, Jackson Laboratory) were used. Animals were group housed in standard laboratory cages in a temperature (72 degrees Fahrenheit)- and humidity (30–70%)-controlled vivarium with a 12:12 light/dark cycle. Food and water were provided ad libitum throughout the experiment. Viral injections were performed when mice were 6–7 weeks old for behavioral experiments, and were performed when mice were 9–10 weeks old for electrophysiological experiments. Behavior experiments took place when mice were 10–15 weeks old. For juvenile social isolation (jSI), wild type C57Bl6 mice (Charles River Laboratories, shipped at p14 for experiments comparing jSI vs GH) and Chrna2-Cre mice (behavioral and electrophysiological experiments) were isolated from weaning (p21) for two weeks. Mice were re-grouped with age- sex- and strain- matched males at p35 (3–5 mice per cage), co-housed for more than 1 month and then behaviorally tested in adulthood when mice were 10–15 weeks old. . Procedures were performed in accordance with the National Institutes of Health Guide for Care and approved by the Use of Laboratory Animals and the Icahn School of Medicine at Mount Sinai Institutional Animal Care and Use Committee.
Stereotaxic surgery
Mice were anesthetized with isoflurane and head-fixed in a mouse stereotaxic apparatus (Narishige). For chemogenetic and optogenetic studies, bilateral viral injections were made at 6–7 weeks old in the following stereotaxic coordinates (Paxinos and Franklin’s the Mouse Brain) of the mPFC: (1) AP +2.3 mm, ML ± 0.4 mm, and DV – 1.3 mm and – 1.0 mm; (2) AP +1.7 mm, ML ± 0.4 mm, and DV – 1.7mm and – 1.3 mm; (3) AP +1.3, ML ± 0.4 mm, and DV – 1.3 mm and – 1.0 mm. Midline injections were made at a single location for pPVT: AP – 1.8 mm, ML 0 mm, DV – 2.8 mm. Bilateral injections were made at 1 location per hemisphere for Nac: AP + 1.45mm, ML ± 0.8 mm, DV – 4.5mm. Unilateral injections were made at 6 locations per hemisphere for cPFC: (1) AP +2.3 mm, ML ± 0.4 mm, and DV – 1.3 mm and – 1.0 mm; (2) AP +1.7 mm, ML ± 0.4 mm, and DV – 1.7mm and – 1.3 mm; (3) AP +1.3 mm, ML ± 0.4 mm, and DV – 1.3 mm and − 1.0 mm. Each injection contained 400 nl of AAV1-EF1-dflox-hChR2-mCherry-WPRE-hGH (DIO-hChR2-mCherry) (Addgene), AAV1-CamKIIa-hChR2-mCherry (CamKII-hChR2-mCherry) (Addgene), AAV1-CaMKIIa-eNpHR 3.0-EYFP (halorhodopsin 3.0) (Addgene), AAV8-hSyn-DIO-hM4Di-mCherry (iDREADD) (Addgene), AAV8-hSyn-DIO-hM3Dq-mCherry (eDREADD) (Addgne), AAV8-hSyn-DIO-mCherry (mCherry-Cre) (Addgene), AAV8-CamKII-GFP-Cre (CamKII-Cre) (Addgene), CAV-Cre (CAV-Cre) (Montpellier) and/or rAAV2-CAG-Cre-WPRE (Boston Children’s Hospital). All viruses were infused at a rate of 60 nl/min using a microinjector and glass pipette. For fiber photometry surgeries, a unilateral injection was made at AP +1.7, ML −0.4 mm, and DV − 1.7 mm with 500 nl of AAV1-Syn-FLEX-GCaMP6f-WPRE-SV40 (Flex-GCaMP6f) (Addgene). A 1.6 mm in length fiber optic cannula with a 0.48 numerical aperture and a 400 μm core diameter (Doric Lenses) was implanted over the injection site (AP +1.7, ML − 0.4 mm, and DV − 1.3 mm) using metabond and dental cement. For wireless optogenetic surgeries, a 1 mm diameter hole was drilled at a single location for implantation over the pPVT, and a 2.6 mm length and 500 um diameter LED optic fiber (Amuza) was then implanted above the pPVT at AP – 1.8 mm, ML ± 0 mm, DV − 2.8mm using metabond and dental cement. For retrobeads injection surgery, injections were performed by using the same surgical injection system as with the viral transduction surgery mentioned above. A 400 nl volume of red or green retrobeads (Lumafluor, Nashville, TN, USA) was injected with an injection rate of 60 nl/min using a microinjector and glass pipette.
Immunohistochemistry
Mice were anesthetized with isofluorane and transcardially perfused with cold 0.1M phosphate buffer, followed by 4% paraformaldehyde (PFA) dissolved in 0.1M PB. Brains were post-fixed for 3 hours in 4% PFA at 4˚C and cryoprotected in 30% sucrose. Frozen brains were sliced into 30 μM sections using a cryostat (CM3050, Leica). Free-floating sections from the whole brain were washed 3x in tris-buffered saline (TBS) and then blocked in 1% bovine serum albumin (BSA) in tritonated TBS (0.25% Triton X-100 in TBS) for 1h. The sections were incubated overnight at room temperature in primary antibody (rabbit anti-cFos antibody (Synaptic Systems, #226003, 1:5000), or rabbit anti-SST antibody (Peninsula Laboratories; #T-4103.0050, 1:1000). Slices were then washed in 1% BSA in tritonated BST, followed by incubation with appropriate secondary antibodies (Alex 568 goat anti-rabbit IgG (H+L) (Life Technologies: #A-11036; 1:500), or Alexa 647 goat anti-rabbit IgG (H+L) (Life Technologies: #A-21245, 1:500). Sections were then mounted with DAPI Fluoromount-G (Southern Biotech).
Imaging and Quantification
Imaging was performed using LSM780 confocal microscopes (Zeiss) and processed and analyzed using ImageJ32 software v. 1.51j8 (NIH). For viral expression analysis and cFos quantifications, images were background subtracted and then thresholded using the Max Entropy function. Averages were collected from 3– 5 brain slices per mouse. Co-localization analysis to determine number of retrobead-positive and DAPI positive cells co-expressing c-Fos was performed using the “analyze particles” function in each channel, followed by counting the intersection of the particles for each region of interest. For wireless optogenetics validation, accuracy of cannula placement was confirmed in all mice. For photometry validation, we confirmed prior to behavior testing that GCaMP6 signal levels in all animals are higher than the signal change in the autofluorescence channel). After behavior testing we confirmed that optic fiber placement was accurate. For the viral spread validation of mice used for chemogenetic and optogenetic behavioral experiments, mice that had completed behavior testing underwent transcardial perfusion, and slices were collected at specific Bregma areas (from +0.98mm to +2.46mm for mPFC, from −1.34mm to 2.06mm for PVT) to analyze the anterior-posterior spread of virally infected cells. Images were acquired using the EVOS FL Imaging System (Thermo Fisher Scientific). Slices were imaged using a 4x lens and, to ensure consistency across imaging sessions, power was set at 100%. To generate viral spread diagrams, all groups were assigned two levels representing increasing levels of signal intensity. The first level represented the minimum number of mice showing signal in a given area, namely n=1. The second level represented more than 50th percentile of mice with overlapping signal in a given area. Using the GNU Image Manipulation Program (GIMP), areas with fluorescent signal were delineated on templates taken from the Paxinos and Franklin mouse atlas. If their viral expression could not be validated or when there was equipment failure during behavior, mice were excluded from the analysis.
Fiber photometry
Imaging:
Experiments were done at least three weeks after viral injection to allow for sufficient viral expression. During recording sessions, two excitation LEDs (Thor Labs) reflected off dichroic mirrors to record GCaMP6f specific signal (465nm) and non-specific autofluorescence-related signals as a control (405 nm). A fiber optic patch cord (Doric Lenses, MFP_400/430/0.48_1.3) was attached to the implanted fiber optic cannula with cubic zirconia sheathes. The fiber optic cable was coupled to two LEDs, which pass light through a GFP (465nm) or violet (405 nm) excitation filter (Thor labs) and dichroic mirrors. Emitted light passed through the fiber optic cable is passed through the dichroic mirror and emission filters, and through a 0.50 N.A. microscope lens (62–561, Edmund Optics) and then focused and projected onto a photodetector (Model 2151 Femtowatt Photoreceiver). A real-time signal processor (RX8 and RZ5P, Tucker-Davis Technologies) and software (OpenEx version 2.20 for RX8 and Synapse version 90 for RZ5P, Tucker-Davis Technologies) was used to sinusoidally modulate each LED’s output at different frequencies to un-mix signals from each LED. Signals were collected at a sampling frequency of 381 Hz (RX8) or 1018Hz (RZ5P).
Behavior:
Prior to behavior testing, mice were habituated to the fiber optic cable for 30 minutes each day for three days. For analysis of activity during social exploration and object exploration, a five-minute baseline was recorded for each mouse in a novel open field arena (43 cm x 43 cm x 33 cm) before each exploration testing. Following baseline, we placed a novel object or a novel age- sex- and strain- matched mouse in the arena (counterbalanced between object and social) for 5 minutes.
Analysis:
Analysis was performed using previously custom scripts previously used11 with python v.2.7 (Python Software Foundation). Each channel was first normalized by subtracting the median voltage for the entire recording period for both the signal (465 nm) and the noise (405 nm) channels. The 405 channel was then normalized using a Savitzky-Golay filter to remove high frequency changes in the 405 channel, and then subtracted from the 465 channel. This served to mitigate movement-related signals and fluorescence bleaching. The signal channel was then Z-scored using the five-minute baseline period directly before introducing the mouse or an object. To compare social vs. object mPFC->pPVT projection neuronal activity, we compared mean Z-score during baseline periods (30 sec before introducing a stimulus) compared with the 30 sec after introducing either the mouse or object.
Behavior Testing
For behavior testing with iDREADD and eDREADD manipulations, Clozapine-N-oxide dihydrochloride (CNO; Tocris Bioscience) was fully dissolved in saline and injected intraperitoneally (i.p.) at a 10 mg/kg (iDREADD experiments) or 1mg/kg (eDREADD experiments) dose 30 min before behavior testing. Mice received CNO and saline (SAL) in a counterbalanced fashion with 1 week of wash out time between treatments. Mice were excluded from behavior tests if they demonstrated significant alterations in motor responses due to i.p. procedures.
For behavior testing with wireless optogenetic modulation, prior to behavior testing, mice were habituated to either the 3-chamber or the open field for one 20 minutes habituation phase while wearing a dummy version of the receiver (Amuza, Teleopto wireless optogenetics system). For the continuous stimulation/inhibition experiments during 3 camber tests, elevated plus maze, and open field tests, 20 Hz, 5% duty cycle of 470nm blue light or continuous 590nm yellow light stimulation was triggered using a signal generator (Rigol Technologies) during the entire “ON” testing session. All experiments were counterbalanced with respect to whether mice received optogenetic stimulation/inhibition on the first day of testing or second day of testing and there was a 24-hour interval between ON and OFF sessions. In some optogenetic activation experiments (Fig. 4E–K and Fig. 8E), light delivery was triggered only when mice enter one of zones during 3-chamber tests.
3-chamber test:
Testing was conducted in the sociability cage (Noldus): a 3-chambered rectangle with clear acrylic walls and a white matte bottom. Mice were habituated to the center chamber for 10 mins, followed by a 10 min habituation to the full chamber one day prior to testing. On the day of testing, mice were placed in the center chamber for 5 min, followed by 5 min exploration of the full chamber with empty wire corrals. To test sociability, an age-, sex-, and strain- matched mouse was placed under a wire corral in the ‘social chamber’ and a novel object was placed under the corral in the ‘object chamber’. The subject mouse was allowed to freely investigate for a 10 min test phase. Behavior was recorded and scored by Ethovision v. 9, 14 (Noldus). ‘Social interaction time’ or ‘Object interaction time’ was defined as the cumulative amount of time that the mouse’s nose-point (detected by Ethovision) was detected in the interaction zone, which is a circular zone surrounding the corral containing the mouse or object. For the experiment where mPFC->pPVT neurons were repeatedly stimulated to induce a long-lasting rescue of JSI social deficits, mice explored the 3-chamber arena with either mouse or novel object corral for 20 mins on baseline day (Day1) followed by Day2 and Day 3 when mice explored either the same mouse or object in chambers for 30 mins while receiving light stimulation when their nose entered the social interaction zone surrounding a corral with a mouse. On Day 4 (probe test day), mice explored the arenas with the same mouse or object in the absence of optogenetic stimulation for 20 mins. For the real-time preference 3-chamber test using optogenetics, Mice explored the 3-chamber apparatus with two identical empty corrals without light stimulation (10 min), continued to explore while receiving light stimulation when their nose entered the interaction zone surrounding one of the two corrals (10 min), and then continued to explore further without light stimulation (10 mins). During the stimulation session, optogenetic stimulation was delivered whenever the mouse visited the stimulation zone surrounding a wire corral and was terminated immediately if the mouse exited the stimulation zone. Stimulation zone was counterbalanced.
Milkshake 3-chamber test:
Testing was conducted in a custom-designed 3-chambered apparatus (61 cm x 40.5 cm x 23.5 cm) with white matte walls and floor. A small cylindrical aluminum basin (approximately 5 cm in diameter and 1.5 cm in height) filled with milkshake was placed in one of the side chambers and an identical empty basin was placed in the opposite chamber. To test for milkshake preference, mice were allowed to freely investigate the apparatus with the option to consume milkshake for 10 minutes. Milkshake consisted of 15% chocolate syrup (The Hershey Company), 15% sweetened condensed milk (Eagle Family Foods Group), and 70% water (by volume). Behavior was recorded and scored via Ethovision v. 14 (Noldus) or ANY-Maze v. 6.06 (Stoelting Co.), with ‘milkshake interaction time’ or ‘empty basin interaction time’ defined as the cumulative amount of time where the mouse’s nose-point was present within an interaction zone circumscribed about each stimulus (approximately 10 cm in diameter). Prior to testing, mice were habituated in the center chamber for 5 minutes and then were allowed to explore the entire apparatus (without stimuli present) for 5 minutes. Additionally, mice were habituated to the milkshake reward and the testing apparatus by completing a ‘dry run’ of the testing procedure (including both habituation and milkshake preference test phases) on the day prior to the first day of testing. On this day, mice were also given access to a milkshake-filled basin and an empty basin in their homecage for roughly 4 hours.
Elevated plus maze:
The elevated plus maze is a behavioral assay that is frequently used to measure anxiety-related and exploratory behavior by comparing time spent in enclosed arms compared with open arms in a plus-shaped maze with four equal size arms that are elevated above the ground. Mice were placed in the center chamber and allowed to freely explore for 8 minutes. Behavior was recorded and scored by Ethovision v.9, 14.
Open Field:
To assess anxiety-related and locomotor behaviors, we used a square acrylic arena (43 cm x 43 cm x 33 cm) equipped with a panel of 16 horizontal infrared beams per axis. Data was collected and analyzed with Fusion v. 4 software (Omnitech Electronics). Exploratory behavior and locomotor activity were measured for 30 min. We collected data for time spent in center vs. periphery, distance travelled, rears, and stereotypic behaviors.
Social vs. Object Exploration for c-Fos immunohistochemistry:
Male C57Bl/6 wildtype mice (4–8 months) were isolated for 24 hours prior to testing. Behavior was conducted in the 3-chamber apparatus, as described above, with slight modifications: the object exploration group was exposed to a novel object only, and the social exploration group was exposed to a novel mouse only. Mice were perfused 90 min after completing the social/object exploration phase.
Patch-clamp recording
Animals were decapitated under isofluorane anesthesia. Brains were quickly removed and transferred into ice-cold (0 – 4˚C) artificial cerebrospinal fluid (ACSF) of the following composition (in mM): 210.3 sucrose, 11 glucose, 2.5 KCl, 1 NaH2PO4, 26.2 NaHCO3, 0.5 CaCl2, and 4 MgCl2. Acute coronal slices (300 μm) containing the mPFC or pPVT were sectioned using a VT1200S vibratome (Leica Microsystems, Buffalo Grove, IL, USA). Slices were allowed to recover for 40 min at room temperature in the same solution, but with reduced sucrose (105.2 mM) and addition of NaCl (109.5 mM). Following recovery, slices were maintained at room temperature in standard ACSF composed of the following (in mM): 119 NaCl, 2.5 KCl, 1 NaH2PO4, 26.2 NaHCO3, 11 glucose, 2 CaCl2, and 2 MgCl2. Patch clamp recordings were performed from fluorescently labeled neurons in deep layer mPFC (including anterior cingulate cortex and prelimbic cortex between AP 2.3mm to 1.3mm) using borosilicate glass electrodes (3 – 5 MΩ). Whole-cell voltage-clamp recordings were obtained with the internal solution containing (in mM): 120 Cs-methanesulfonate, 10 HEPES, 0.5 EGTA, 8 NaCl, 4 Mg-ATP, 1 QX-314, 10 Na-phosphocreatine, and 0.4 Na-GTP. Current clamp recordings were obtained with the internal solution containing (in mM): 127.5 K-methanesulfonate, 10 HEPES, 5 KCl, 5 Na-phosphocreatine, 2 MgCl2, 2 Mg-ATP, 0.6 EGTA, and 0.3 Na-GTP. Spontaneous excitatory and inhibitory postsynaptic currents were recorded in standard ACSF (as above). Miniature excitatory and inhibitory postsynaptic currents (mEPSC and mIPSC) were recorded in the presence of TTX (1 μM; Abcam) in the bath solution. Spontaneous and Miniature EPSCs and IPSCs were separated by holding the neuron at the reversal potential for excitatory or inhibitory postsynaptic currents, allowing for isolation of EPSCs and IPSCs at −60 mV and 0 mV, respectively. Data were low-pass filtered at 3 kHz and acquired at 10 kHz using Multiclamp 700B (Axon Instruments) and pClamp 10 v. 10.6.2.2 (Molecular Devices). All stimulation was conducted at 0.1 Hz to avoid inducing synaptic plasticity. Series and membrane resistance was continuously monitored, and recordings were discarded when these measurements changed by > 20%. Recordings in which series resistance exceeded 25MΩ were rejected. Detection and analysis of EPSCs and IPSCs were performed using MiniAnalysis v. 6.0.7 (Synaptosoft). For current-clamp recordings, we applied DNQX (20 μM; TOCRIS), D-AP5 (50 μM; TOCRIS) and picrotoxin (30 μM; TOCRIS). Series resistance was monitored and canceled using a bridge circuit, and pipette capacitance was compensated. Voltage signals were low-pass filtered at 10 kHz. The baseline membrane potential was maintained near –70 mV with a current injection. We recorded membrane potential responses to hyperpolarizing and depolarizing current pulses (500 ms in duration) and then, we examined action potential by using Signal 4 v.4 (Cambridge Electronic Design).
For optogenetic experiments, mPFC->pPVT projection neurons in mPFC, or their terminals in pPVT, or mPFC Chrna2+ neurons were stimulated using TTL-pulsed microscope objective-coupled LEDs (450 nm, Prizmatix). At the beginning of each experiment an input-output curve expressed as stimulus intensity–response amplitude curve was established for each neuron independently by incrementally increasing a light intensity in a step-wise fashion (0.1mW/mm2/step) from the minimal stimulation level 1 to determine the intensity of the stimulation that evoked PSC reliably at the plateau of the curve to ensure activation of all ChR2-expressing terminals within the field of view. The power of light stimuli was quantified using an optical power meter (Thorlabs). For PPR experiments, we set the intensity of the stimulus at the plateau level where additional increase in the light intensity didn’t affect the amplitude of the light-evoked responses. Short-term dynamics were tested with twin pulses separated by 500 ms. Stimuli were given every 20 sec and at least 15 responses were averaged at each interpulse interval. Paired-pulse recordings were conducted in standard ACSF. To limit the impact of disynaptic excitation, paired pulse ratio was determined as a ratio of the amplitude of EPSC2 to the amplitude of EPSC1. To isolate monosynaptic connections, eEPSCs were recorded in the presence of TTX (1 μM), 4-AP (100 μM) and picrotoxin (100 μM).
To validate modulation of mPFC->pPVT projection neurons with eNpHR3.0, iDREADD, or eDREADD, whole-cell recordings in gap-free mode were obtained with borosilicate glass electrodes (5–8 mΩ resistance) filled with a current clamp internal solution (in mM: 127.5 K-methanesulfonate, 10 HEPES, 5 KCl, 5 Na-phosphocreatine, 2 MgCl2, 2 Mg-ATP, 0.6 EGTA, and 0.3 Na-GTP). Fluorescently-labeled cells were visualized on an upright microscope equipped for both DIC and fluorescence visualization. Cells were held at −55mV to avoid the potassium reversal. For chemogenetics, 10 μM CNO was bath applied to cells that exhibited at least 5 minutes of stable baseline recording. Membrane potential was compared between baseline and 5 minutes after CNO application. For optogenetics, frequency of spikes induced by current injection in neurons expressing eNpHR3.0. neurons were compared before, during, and after yellow light stimulation using TTL-pulsed microscope objective-coupled LED (546 nm, Prizmatix).
In vivo electrophysiology
Sixteen-channel silicone optoelectrodes with 177 μm2 recording sites (NeuroNexus Technologies) spaced 50 μm apart were used to record neuronal activity in the pPVT. All in vivo recordings were acquired using the Omniplex A system (Plexon). Spike signals were filtered at a bandpass of 300 Hz to 8 kHz. Sorting of single units was carried out using principal component analysis in an offline sorter v. 3.2.2 (Plexon). Three weeks after virus injection, electrophysiological experiments with optogenetic stimulation were performed under 0.5–1% isoflurane anesthesia. Blue light illumination (wavelength 473 nm, 2.5 ms duration, 20 Hz) or yellow light illumination (wavelength 565 nm, continuous stimulation) was delivered using an optic fiber (diameter 105 μm) coupled to the extracellular recording electrode which was inserted into the pPVT based on stereotaxic coordinates. The power at the fiber-optic tip was approximately 10 mW (blue light) and 4.5 mW (yellow light).
Statistics
Statistical analyses were performed using Prism v. 8 (Graphpad). No statistical methods were used to pre-determine sample sizes but our sample sizes are similar to those reported in previous publications11,28. Data collection and analysis were not performed blind to the conditions of the experiments. Subjects (mice) were randomly assigned into study groups. For all studies, independent animals were used as replicates. Replication studies confirmed our results in all experiments. Data distribution was assumed to be normal but this was not formally tested. Statistical analyses for fiber photometry were conducted using parametric tests on z-scored data. Analyses comparing multiple time points were conducted with paired t-tests. Behavioral tests in DREADD and optogenetic experiments were analyzed using 2-way ANOVAs, or paired t-tests, as indicated. For patch-clamp physiology, statistical analyses were conducted using t-test or 2-way ANOVAs. All statistical tests were two-tailed. Bar graphs and photometry averaged traces are presented as the mean and error bars represent the standard error of the mean (s. e. m.).
Reporting Summary
Further information on research design is available in the Nature Research Reporting Summary linked to this article.
Data availability:
The source data underlying Figs. 1–8 and Extended Data Figs. 1–9 are provided as source data files. The rest of relevant data are available from the corresponding author on reasonable request.
Code availability:
Codes for fiber photometry analysis are available from the authors upon reasonable request.
Extended Data
Extended Data Fig. 1. c-Fos mapping of cortical and sub-cortical regions upon social exposure.
(A) (left) Mice were exposed in a 3-chamber apparatus for 10 min to either a novel mouse (social:S) under a wire corral, a novel object (object:O) under a wire corral, or kept in their home cage (HC), and then perfused 90 min after the end of the exposure. Brains were then stained for c-Fos, a marker of neuronal activity. (middle) Among many brain areas, including several areas that are known to be involved in social behavior, the posterior PVT (pPVT) showed significant c-Fos induction in social groups compared with both object and homecage groups. (one-way ANOVA, F2,9=34.02, P=0.636×10⁻⁴ followed by a Tukey’s post hoc test: pPVT:, social vs object: **P=0.003, social vs home cage: ****P=0.468×10⁻⁴, n=4 biologically independent mice each) *P<0.05, **P<0.01, ***P<0.001. (right) Representative c-Fos staining images from pPVT. Scale bar: 200um. Experimental images were obtained from each 12 mice, a few images per mouse, with similar results obtained. (B) (upper left) mPFC->pPVT projection neurons were labeled by retrobeads injected into the pPVT. Representative images showing (right) beads in layer 5/6 mPFC->pPVT neurons (scale bar: 100um), and (bottom left) beads at injection site in pPVT (scale bar: 200um). Experimental images were obtained from 16 mice, a few images per mice, with similar results obtained. (C) (left) Representative images showing preferential c-Fos induction in mPFC->pPVT neurons by social exposure (Scale bar: 50um, experimental images were obtained from 16 mice, a few images per mice, with similar results obtained), and (right) quantification (one-way ANOVA, F2,13=19.750, P=0.115×10⁻³, followed by a Tukey’s post hoc test, Social vs object P=0.056, Object vs home cage **P=0.009, Social vs home cage ****P=0.789×10⁻⁴: n=6 biologically independent social exposed mice, n=5 biologically independent object exposed mice, n=5 biologically independent home caged mice). PL: prelimbic cortex, IL: infralimbic cortex, cg1/2: cingulate cortex1/2, Pir: Piriform cortex, aPVT: anterior paraventricular thalamus, pPVT: posterior paraventricular thalamus, MD: medial dorsal thalamus, Nac: nucleus accumbens, BLA: basolateral amygdala, LA: lateral amygdala, CeA: central amygdala, dPAG: dorsal periaqueductal gray, PVN: paraventricular nucleus of hypothalamus. Data in A, C are presented as mean +/− s.e.m.
Extended Data Fig. 2. Juvenile social isolation leads to long lasting reduction of sociability in adult mice.
(A) Timeline showing weaning at p21 and subsequent 2 weeks of juvenile social isolation (jSI), followed by re-housing or control group housing (GH). (B) jSI mice showed reduced sociability scores vs GH mice in a 3 chamber task, in which a mouse chooses between a social target and an object, and time spent investigating both is measured and compared (two tailed t-test, t36=2.154, *P=0.038, n=20 biologically independent GH mice, n=18 biologically independent jSI mice) and reduced social interaction (two-way RM ANOVA, housing (GH/jSI) × stimulus (social/object) interaction F1,36 = 7.042, *P=0.012, effect of housing F1,36 = 1.117, P=0.298, effect of stimulus F1,36 = 14.860, P=0.460×10⁻³, n=20 biologically independent GH mice, n=18 biologically independent jSI mice) (C) jSI mice showed no difference in distance traveled during the open field test (two tailed t-test, t36=0.939, P=0.354, n=20 biologically independent GH mice, n=18 biologically independent jSI mice), suggesting normal motor activity. While jSI mice showed reduce time in center during open field test (two tailed t-test, t36=2.054, *P=0.047, n=20 biologically independent GH mice, n=18 biologically independent jSI mice), they showed no difference in an independent anxiety task (elevated plus maze (EPM: two tailed t-test, t38=0.926, P=0.360, n=20 biologically independent GH mice, n=18 biologically independent jSI mice). Data in B, C are presented as mean +/− s.e.m.
Extended Data Fig. 3. Chemogenetic suppression of pPVT neuron activity reduces sociability in adult group-housed mice.
(A) (left) AAV8-DIO-iDREADD (or mCherry) was injected together with AAV1-CaMKII-Cre in the pPVT. (right) A representative image shows selective transduction at injection areas of pPVT. Scale bar: 300um. Experimental images were obtained from 12 mice, three images per mouse, with similar results obtained. (B) Validation of iDREADD action in pPVT neurons by slice whole-cell patch clamp recording. (left) A representative trace shows that bath application of CNO significantly decreases membrane potential of pPVT neurons. Traces were recorded from 7 cells from 3 biologically independent mice, with similar results obtained. (Right) Quantification shows a reduction in membrane potential after CNO application (two tailed paired t-test, t6=4.177, **P=0.006, n=7cells from 3 biologically independent mice). (C) Mice were treated with saline (SAL) or CNO (10mg/kg) and then underwent the 3 chamber test of sociability. For CNO and SAL injections, order is counter-balanced. (D) Viral spread validation at injection areas of pPVT from post-behavioral testing mice. Gray areas represent the minimum (lighter colour) and the maximum (darker colour) spread of iDREADD into the pPVT. (E) (left) CNO-treated iDREADD+ mice showed reduced sociability, revealed by reduced sociability scores vs. SAL (two tailed paired t-test, t11=2.257, *P=0.045, n=12 biologically independent mice), and disrupted behavior in 3 chamber sociability task (two-way RM ANOVA, housing (GH/jSI) × stimulus (social/object) interaction F1,22 = 4.894, *P=0.038, effect of drug F1,22 = 0.032, P=0.859, effect of stimulus F1,22 = 0.109, P=0.745, n=12 biologically independent mice). (right) iDREADD+ mice showed no differences in motor activity or anxiety-related behaviors (Left; two tailed paired t-test, t11=0.688, P=0.506, n=12 biologically independent mice Middle; two tailed paired t-test, t11=1.604, P=0.137, n=12 biologically independent mice, Right; two tailed paired t-test, , t10=1.096, P=0.299, n=11 biologically independent mice) as a result of CNO vs. SAL treatment. (F) (left) Control mCherry+ mice showed no difference in sociability score (two tailed paired t-test, t7=1.459, P=0.188, n=8 biologically independent mice) or investigation time (two-way RM ANOVA, housing (GH/jSI) × stimulus (social/object) interaction F1,14 = 0.352, P=0.563, effect of drug F1,14 = 0.024, P=0.880, effect of stimulus F1,14 = 8.630, *P=0.011, n=8 biologically independent mice) as a result of CNO vs. SAL treatment. (right) Control mCherry+ mice showed no difference in motor activity or anxiety-related behaviors (Left; two tailed paired t-test, t7=0.981, P=0.359, n=8 biologically independent mice, Middle; two tailed paired t-test, t7=0.317, P=0.761, n=8 biologically independent mice Right: two tailed paired t-test, t7=0.662, P=0.529, n=8 biologically independent mice). Data in B, E, F are presented as mean +/− s.e.m.
Extended Data Fig. 4. Optogenetic suppression of mPFC->pPVT projection terminals does not change motor activity or anxiety-related behaviors in group-housed mice.
(A) (left) Halorhodopsin NpHR3.0 AAV under CamKII promotor was injected into mPFC and mPFC->pPVT projection terminals were illuminated at the pPVT using a wireless yellow LED system for behavioral testing. (middle/right) Validation of optogenetic suppression by patch-clamp recording from halorhodopsin NpHR3-expressing mPFC->pPVT projection neurons. (middle) Representative trace showing decreased action potential of mPFC->pPVT projection neurons upon optogenetic stimulation (traces were recorded from 7 cells from 3 biologically independent mice, with similar results obtained), and (right) quantification (one-way RM ANOVA, F1.521,9.124 = 91.94, P=0.167×10⁻⁵, Tukey’s multiple comparisons test: 1st OFF vs ON, ****P=0.114×10⁻⁴, ON vs 2nd OFF, ****P=0.328×10⁻³, n=7 cells from 3 biologically independent mice,). (B-C) In vivo validation of optogenetic suppression of mPFC->pPVT projection terminals. (B) Representative in vivo recordings of pPVT neurons showing a significant decrease (top), increase (middle), or no change (bottom) in spike activity upon yellow light delivery over mPFC->pPVT projection terminals expressing halorhodopsin NpHR3 in pPVT. Experimental traces were obtained from 4 mice,13–16 cells per mouse, with similar results obtained. (C) Distribution of pPVT neurons showing light-induced decreased firing (11 out of 57 cells from 4 biologically independent mice, 19%), increased firing (9 out of 57 cells from 4 biologically independent mice, 16%), or no change (37 out of 57 cells from 4 biologically independent mice, 65%). Effect of light stimulation for each unit was quantified by comparing the firing rates between light off period and light on period (5 s each) of 6 sessions per cell through paired t-test. (D) Viral spread validation of NpHR3-expression from post-behavior testing mice at injection areas. Gray areas represent the minimum (lighter colour) and the maximum (darker colour) spread of NpHR3- expression in the mPFC. Experimental images were obtained from 14 mice, three images per mouse, with similar results obtained. (E) Optic fiber location (yellow line circles) was validated in all mice. Experimental images were obtained from 14 mice, three images per mouse, with similar results obtained. (F) Mice underwent open field testing, and elevated plus maze (EPM) with (ON) or without (OFF) light stimulation. ON and OFF session order was counter-balanced for each behavior test with a 24-hour interval between tests. Mice with optogenetic suppression showed no differences in motor activity or anxiety-related behaviors between ON and OFF sessions (Left; two tailed paired t-test, t13=0.747, P=0.469, n=14 biologically independent mice, Middle; two tailed paired t-test, t13=0.455, P=0.657, n=14 biologically independent mice, Right; two tailed paired t-test, t13=1.028, P=0.323, n=14 biologically independent mice). (G) Control mCherry+ mice showed no difference in motor activity or anxiety-related behaviors between light ON and OFF sessions (Left; two tailed paired t-test, n=9 biologically independent mice, t8=0.528, P=0.612, Middle; two tailed paired t-test, t8=0.361, P=0.727, n=9 biologically independent mice, Right; two tailed paired t-test, t8=0.017, P=0.987, n=9 biologically independent mice,). Data in A, F, G are presented as mean +/− s.e.m.
Extended Data Fig. 5. Juvenile social isolation does not change excitability, nor E/I input ratio of PFC->NAc neurons, mPFC->cPFC neurons, or pPVT neurons in adulthood.
(A-F) Whole-cell patch clamp recording from mPFC->NAc neurons in adult jSI or GH mice. (B, C) Assessment of intrinsic excitability of PFC->NAc neurons in the presence of DNQX, D-AP5, and picrotoxin. (B) (Left) Input-output curves showed no differences in spike frequency between jSI and GH mice (two-way RM ANOVA, housing (GH/jSI) x current step interaction F19,551 = 0.388, P=0.992, effect of housing F1,29 = 1.103, P=0.302, effect of current step F2.472, 71.70 = 161.200, P=0.001×10⁻¹², n=15 cells from 8 biologically independent GH mice, n=23 cells from 8 biologically independent jSI mice). (right) No significant differences in spike frequency at 200pA between jSI and GH (two tailed t-test, t36=0.399, P=0.692, n=15 cells from 8 biologically independent GH mice, n=23 cells from 8 biologically independent jSI mice) (C) No significant differences in spike threshold between jSI and GH (two tailed t-test, t36=−0.708, P=0.484, n=15 cells from 8 biologically independent GH mice, n=23 cells from 8 biologically independent jSI mice). No significant differences in (D) sEPSC frequency (two tailed t-test, t48=0.308, P=0.760, n=23 cells from 8 biologically independent jSI mice), sEPSC amplitude (two tailed t-test, t48=0.305, P=0.762, n=27 cells from 8 biologically independent GH mice, n=23 cells from 8 biologically independent jSI mice), (E) sIPSC frequency (two tailed t-test, t48=0.879, P=0.384, n=27 cells from 8 biologically independent GH mice, n=23 cells from 8 biologically independent jSI mice), sIPSC amplitude (two tailed t-test, t48=0.852, P=0.398, n=27 cells from 8 biologically independent GH mice, n=23 cells, from 8 biologically independent jSI mice), or (F) sEPSC/sIPSC frequency ratio (two tailed t-test, t48=1.767, P=0.084, n=27 cells from 8 biologically independent GH mice, n=23 cells from 8 biologically independent jSI mice) between jSI and GH. (G-L) Whole-cell patch clamp recording from mPFC->contralateral PFC projection neurons (cPFC) in adult jSI or GH mice. (H, I) Assessment of intrinsic excitability of PFC->cPFC neurons in the presence of DNQX, D-AP5, and picrotoxin. (H) (Left) Input-output curve showing no differences in spike frequency (two-way RM ANOVA, housing (GH/jSI) x current step interaction F19,798 = 1.861, *P=0.014, effect of housing F1,42 = 0.648, P=0.425, effect of current step F4.628, 194.4 = 395.9, P=0.001×10⁻¹², n=26 cells from 8 biologically independent GH mice, n=20 cells from 8 biologically independent jSI mice). (right) No significant differences in spike frequency at 200pA between jSI and GH (two tailed t-test, t44=1.650, P=0.106, n=26 cells from 8 biologically independent GH mice, n=20 cells from 8 biologically independent jSI mice). (I) No significant differences in spike threshold (two tailed t-test, t44=0.635, P=0.529, n=26 cells from 8 biologically independent GH mice, n=20 cells from 8 biologically independent jSI mice), (J) sEPSC frequency (two tailed t-test, t36=0.847, P=0.403, n=20 cells from 8 biologically independent GH mice, n=18 cells from 8 biologically independent jSI mice), sEPSC amplitude (two tailed t-test, t36=1.370, P=0.179, n=20 cells from 8 biologically independent GH mice, n=18 cells from 8 biologically independent jSI mice), (K) sIPSC frequency (two tailed t-test, t36=0.758, P=0.454, n=20 cells from 8 biologically independent GH mice, n=18 cells from 8 biologically independent jSI mice,), sIPSC amplitude (two tailed t-test, t36=0.493, P=0.625, n=20 cells from 8 biologically independent GH mice, n=18 cells from 8 biologically independent jSI mice), or (L) sEPSC/IPSC frequency (two tailed t-test, t36=0.147, P=0.884, n=20 cells from 8 biologically independent GH mice, n=18 cells from 8 biologically independent jSI mice) between jSI and GH. (M-R) Whole-cell patch clamp recording from pPVT neurons in adult jSI or GH mice. (N, O) Assessment of intrinsic excitability of pPVT neurons in the presence of DNQX (20μM), D-AP5 (50μM), and picrotoxin (30μM). (N) (Right) Input-output curve showing no differences in spike frequency (two-way RM ANOVA, housing (GH/jSI) x current step interaction F14,826 = 0.686, P=0.790, effect of housing F1,59 = 0.017, P=0.898, effect of current step F1.843, 108.7 = 93.580, P=0.001×10⁻¹², n=26 cells from 8 biologically independent GH mice, n=35 cells from 9 biologically independent jSI mice). (left) No significant differences in spike frequency at 200pA (two tailed t-test, t59=0.434, P=0.666, n=26 cells from 8 biologically independent GH mice, n=35 cells from 9 biologically independent jSI mice), (O) spike threshold (two tailed t-test, t59=0.376, P=0.708, n=26 cells from 8 biologically independent GH mice, n=35 cells from 9 biologically independent jSI mice), (P) sEPSC frequency (two tailed t-test, t39=0.356, P=0.724, n=20 cells from 8 biologically independent GH mice, n=21 cells from 9 biologically independent jSI mice), or sEPSC amplitude (two tailed t-test, t39=0.636, P=0.529, n=20 cells from 8 biologically independent GH mice, n=21 cells from 9 biologically independent jSI mice) between jSI and GH. (Q) sIPSC frequency was significantly higher in jSI mice compared to GH mice (two tailed t-test, t39=2.316, *P=0.026, n=20 cells from 8 biologically independent GH mice, n=21 cells from 9 biologically independent jSI mice), but no differences in sIPSC amplitude (two tailed t-test, t39=1.804, P=0.079, n=20 cells from 8 biologically independent GH mice, n=21 cells from 9 biologically independent jSI mice) were observed. (R) No significant differences in sEPSC/IPSC frequency from pPVT neurons (two tailed t-test, t39=0.682, P=0.499, n=20 cells from 8 biologically independent GH mice, n=21 cells from 9 biologically independent jSI mice) between jSI and GH. Data in B-F, H-L, N-R are presented as mean +/− s.e.m.
Extended Data Fig. 6. mEPSC and mIPSC of mPFC->pPVT neurons, mPFC->NAc neurons, and mPFC->cPFC neurons.
(A-C) Whole-cell slice patch clamp recording from mPFC->pPVT neurons in adult jSI mice (20 cells from 6 biologically independent mice) or GH mice (19 cells from 5 biologically independent mice). (B) mEPSC frequency was significantly lower in jSI mice compared to GH mice (two tailed t-test, t37=2.730, **P=0.964×10⁻²) but there were no significant differences in mEPSC amplitude (two tailed t-test, t37=1.150, P=0.258). (C) There were no significant differences in mIPSC frequency (two tailed t-test, t37=0.101, P=0.920) or mIPSC amplitude (two tailed t-test, t37=0.303, P=0.764) between jSI and GH. (D-F) Whole-cell patch clamp recording from mPFC->NAc neurons in adult jSI mice (n=20 cells from 6 biologically independent mice) or GH mice (n=20 cells from 6 biologically independent mice). (E) There were no significant differences in mEPSC frequency (two tailed t-test, t38=0.002, P=0.998) or mEPSC amplitude (two tailed t-test, t38=0.495, P=0.624) between jSI and GH. (F) There were no significant differences in mIPSC frequency (two tailed t-test, t38=0.066, P=0.948) or mIPSC amplitude (two tailed t-test, t38=0.455, P=0.652) between jSI and GH. (G-I) Whole-cell patch clamp recording from mPFC->cPFC neurons in adult jSI mice (n=19 cells from 5 biologically independent mice) or GH mice (n=18 cells from 5 biologically independent mice). (H) There were no significant differences in mEPSC frequency (two tailed t-test, t35=1.559, P=0.128), or mEPSC amplitude (two tailed t-test, t35=1.275, P=0.211) between jSI and GH. (I) There were no significant differences in mIPSC frequency (two tailed t-test, t35=0.247, P=0.807) or mIPSC amplitude (two tailed t-test, t35=1.579, P=0.123) between jSI and GH. Data in B, C, E, F, H, I are presented as mean +/− s.e.m.
Extended Data Fig. 7. Optogenetic interrogation of mPFC->pPVT projection inputs onto pPVT neurons.
(A) ChR2-encoding AAV1 was injected into the mPFC to express ChR2 in mPFC neurons. Whole cell patch-clamp recordings were performed while optogenetically activating mPFC->pPVT projection terminals in pPVT slices. (B) Excitatory connectivity was assessed by normalized postsynaptic currents (PSCs) recorded at −70 mV from pPVT neurons before and after application of tetrodotoxin (TTX; 1 μM) with 4-aminopyridine (4-AP; 100 μM). A majority of pPVT neurons received a monosynaptic input from mPFC. There was no difference in mono/polysynaptic ratio (two tailed t-test, t13=0.349, P=0.733, n=8 cells from 5 biologically independent GH mice, n=7 cells from 5 biologically independent jSI mice). (C) (upper) Representative traces showing that optogenetic activation of mPFC->pPVT axons blocked by DNQX (20 μM). pPVT neurons were clamped at –70 mV while optogenetically stimulating mPFC-pPVT axons before and after bath application of DNQX. Traces are recorded from 3 cells from 2 biologically independent mice, with similar results obtained. (bottom) Averaged amplitude decreases after application of DNQX (two tailed t-test, t2=17.790, **P=0.003, n=3 cells from 2 biologically independent mice). (D) (left) Representative eEPSC of pPVT neurons upon optogenetic activation of mPFC->pPVT axons in GH and jSI mice through gradually changing the intensity. Traces were recorded from 17 cells from 7 biologically independent mice per group, with similar results obtained. (right) Intensity–amplitude curves showing the relationship between stimulus intensity and normalized eEPSC amplitude. Normalized eEPSC amplitude was lower in jSI mice than GH mice (two-way RM ANOVA, housing (GH/jSI) x current step interaction F5,185 = 3.740, **P=0.003, effect of housing F1,37 = 4.173, P=0.048, effect of current step F1.224, 45.29 =25.830, P=0.174×10⁻⁵, n=17 cells from 7 biologically independent GH mice, n=17 cells from 7 biologically independent jSI mice). (E) There were no significant differences in PPR at a 500-ms interval (two tailed t-test, t25=1.551, P=0.134, n=17 cells from 7 biologically independent GH mice, n=21 cells from 8 biologically independent jSI mice). Data in C, D, E are presented as mean +/− s.e.m.
Extended Data Fig. 8. Juvenile social isolation increases excitability of mPFC low-threshold spiking (LTS)-SST interneurons in adulthood.
(A)Whole-cell patch clamp recording from mPFC SST interneurons in adult jSI or GH SST-GFP mice (SST-Cre mice crossed with Cre-dependent eGFP-L10a mice). (B) Classification of SST cells based on firing patterns. SST cells are consist of 3 sub-types (low-threshold spike: LTS, quasi-fast spiking: QFS, adapting: AD) in L5/6 and mainly AD type in L2/3. (C) % of sub-type of SST interneurons in L5/6 and L2/3 in GH and jSI mice. (D) Assessment of intrinsic excitability of SST-LTS interneurons in L5/6 in the presence of DNQX, D-AP5, and picrotoxin. Traces were recorded from 14–15 cells from 4 biologically independent mice per group, with similar results obtained. (left) Representative traces at 100 pA injection recorded from SST-LTS cells. jSI group shows reduced spike frequency at 200pA and −100pA (two tailed t-test, t27=3.097, **P=0.005, n=14 cells from 4 biologically independent GH mice, n=15 cells from 4 biologically independent jSI mice). (E) SST-QFS type show comparable excitability between 2 groups at 100pA (two tailed t-test, t47=1.614, P=0.113, n=23 cells from 6 biologically independent GH mice, n=26 cells from 6 biologically independent jSI mice). (F-G) The jSI group shows decreased excitability in (F) L5/6 SST-AD type at 100pA (two tailed t-test, t35=2.905, **P=0.006, n=17 cells from 6 biologically independent GH mice, n=20 cells from 6 biologically independent jSI mice), and (G) L2/3 SST-AD type at 100pA (two tailed t-test, t30=2.186, *P=0.037, n=24 cells from 6 biologically independent GH mice, n=18 cells from 6 biologically independent jSI mice). Data in D-G are presented as mean +/− s.e.m.
Extended Data Fig. 9. Optogenetic stimulation of mPFC->pPVT projection terminals does not change motor activity or anxiety-related behaviors in adult jSI mice.
(A) CaMKII-ChR2 AAV1 was injected into the mPFC and a wireless blue LED was inserted above the pPVT in jSI mice. (B) jSI mice underwent testing in the open field and elevated plus maze (EPM) with (ON) or without (OFF) light stimulation (20Hz) (C) (left) Viral spread validation from behavior-tested mice. Gray areas represent the minimum (lighter colour) and the maximum (darker colour) spread of ChR2 expression into the mPFC. (right) Optic fiber tip location (blue line circles) was validated in all mice. Experimental images were obtained from 13 mice, three images per mouse for both mPFC and pPVT, with similar results obtained. (D) ChR2+jSI mice showed no differences in motor activity or anxiety-related behaviors between ON and OFF sessions (Left; two tailed paired t-test, t12=0.346, P=0.735, n=13 biologically independent jSI mice, Middle; two tailed paired t-test, t12=0.431, P=0.674, n=13 biologically independent mice, Right; two tailed paired t-test, t12=1.364, P=0.198, n=13 biologically independent jSI mice). (E) Control mCherry+ jSI mice showed no difference in motor activity or anxiety-related behaviors between ON and OFF sessions (Left; two tailed paired t-test, Left; t7=0.970, P=0.365, n=8 biologically independent jSI mice, Middle; t7=0.183, P=0.860, n=8 biologically independent jSI mice Right; t7=0.083, P=0.936, n=8 biologically independent jSI mice). (F-G) Investigation time of each stimulus during first 20 mins of 3 chamber testing from Day 1 to Day 4 of ON group (F) and OFF group (G) during the repeated optogenetic stimulation study in Fig. 8EF. Data in D-G are presented as mean +/− s.e.m.
Acknowledgments:
We thank Ms. Meaghan Janis for assisting with histological analysis and Drs. Roger Clem, Peter Rudebeck, Mark Baxter, and members of the Morishita lab for helpful feedback. This work was supported by Naito Foundation, Uehara Memorial Foundation, Mochida Memorial Foundation, JSPS to K.Y., NIH T32MH966785 to L.K.B., and NIH R01MH118297, R01MH119523, and the Simons Foundation/SFARI (610850) to H.M.
Footnotes
Competing interests: Authors have no competing interests as defined by Nature Research, or other interests that might be perceived to influence the results and/or discussion reported in this paper.
References:
- 1.Cacioppo JT & Cacioppo S. The growing problem of loneliness. Lancet 391, 426, doi: 10.1016/S0140-6736(18)30142-9 (2018). [DOI] [PMC free article] [PubMed] [Google Scholar]
- 2.Miller G Social neuroscience. Why loneliness is hazardous to your health. Science 331, 138–140, doi: 10.1126/science.331.6014.138 (2011). [DOI] [PubMed] [Google Scholar]
- 3.Pitman A, Mann F & Johnson S Advancing our understanding of loneliness and mental health problems in young people. Lancet Psychiatry 5, 955–956, doi: 10.1016/S2215-0366(18)30436-X (2018). [DOI] [PubMed] [Google Scholar]
- 4.Freedman DG, King JA & Elliot O Critical period in the social development of dogs. Science 133, 1016–1017, doi: 10.1126/science.133.3457.1016 (1961). [DOI] [PubMed] [Google Scholar]
- 5.Makinodan M, Rosen KM, Ito S & Corfas G A critical period for social experience-dependent oligodendrocyte maturation and myelination. Science 337, 1357–1360, doi: 10.1126/science.1220845 (2012). [DOI] [PMC free article] [PubMed] [Google Scholar]
- 6.Nelson CA 3rd et al. Cognitive recovery in socially deprived young children: the Bucharest Early Intervention Project. Science 318, 1937–1940, doi: 10.1126/science.1143921 (2007). [DOI] [PubMed] [Google Scholar]
- 7.Almas AN, Degnan KA, Nelson CA, Zeanah CH & Fox NA IQ at age 12 following a history of institutional care: Findings from the Bucharest Early Intervention Project. Dev Psychol 52, 1858–1866, doi: 10.1037/dev0000167 (2016). [DOI] [PMC free article] [PubMed] [Google Scholar]
- 8.Bicks LK, Koike H, Akbarian S & Morishita H Prefrontal Cortex and Social Cognition in Mouse and Man. Front Psychol 6, 1805, doi: 10.3389/fpsyg.2015.01805 (2015). [DOI] [PMC free article] [PubMed] [Google Scholar]
- 9.Yamamuro K et al. Social Isolation During the Critical Period Reduces Synaptic and Intrinsic Excitability of a Subtype of Pyramidal Cell in Mouse Prefrontal Cortex. Cerebral cortex (New York, N.Y. : 1991) 28, 998–1010, doi: 10.1093/cercor/bhx010 (2018). [DOI] [PubMed] [Google Scholar]
- 10.Kirouac GJ Placing the paraventricular nucleus of the thalamus within the brain circuits that control behavior. Neurosci Biobehav Rev 56, 315–329, doi: 10.1016/j.neubiorev.2015.08.005 (2015). [DOI] [PubMed] [Google Scholar]
- 11.Bicks LK et al. Prefrontal parvalbumin interneurons require juvenile social experience to establish adult social behavior. Nat Commun 11, 1003, doi: 10.1038/s41467-020-14740-z (2020). [DOI] [PMC free article] [PubMed] [Google Scholar]
- 12.Nigro MJ, Hashikawa Y & Rudy B. Diversity and connectivity of layer 5 somatostatin-expressing interneurons in the mouse barrel cortex. J Neurosci, doi: 10.1523/JNEUROSCI.2415-17.2017 (2018). [DOI] [PMC free article] [PubMed] [Google Scholar]
- 13.Hilscher MM, Leao RN, Edwards SJ, Leao KE & Kullander K Chrna2-Martinotti Cells Synchronize Layer 5 Type A Pyramidal Cells via Rebound Excitation. PLoS Biol 15, e2001392, doi: 10.1371/journal.pbio.2001392 (2017). [DOI] [PMC free article] [PubMed] [Google Scholar]
- 14.Dong X, Li S & Kirouac GJ Collateralization of projections from the paraventricular nucleus of the thalamus to the nucleus accumbens, bed nucleus of the stria terminalis, and central nucleus of the amygdala. Brain Struct Funct 222, 3927–3943, doi: 10.1007/s00429-017-1445-8 (2017). [DOI] [PubMed] [Google Scholar]
- 15.Otis JM et al. Prefrontal cortex output circuits guide reward seeking through divergent cue encoding. Nature 543, 103–107, doi: 10.1038/nature21376 (2017). [DOI] [PMC free article] [PubMed] [Google Scholar]
- 16.Campus P et al. The paraventricular thalamus is a critical mediator of top-down control of cue-motivated behavior in rats. Elife 8, doi: 10.7554/eLife.49041 (2019). [DOI] [PMC free article] [PubMed] [Google Scholar]
- 17.Do-Monte FH, Quinones-Laracuente K & Quirk GJ A temporal shift in the circuits mediating retrieval of fear memory. Nature 519, 460–463, doi: 10.1038/nature14030 (2015). [DOI] [PMC free article] [PubMed] [Google Scholar]
- 18.Penzo MA et al. The paraventricular thalamus controls a central amygdala fear circuit. Nature 519, 455–459, doi: 10.1038/nature13978 (2015). [DOI] [PMC free article] [PubMed] [Google Scholar]
- 19.Makinodan M et al. Effects of the mode of re-socialization after juvenile social isolation on medial prefrontal cortex myelination and function. Sci Rep 7, 5481, doi: 10.1038/s41598-017-05632-2 (2017). [DOI] [PMC free article] [PubMed] [Google Scholar]
- 20.Kingsbury L et al. Correlated Neural Activity and Encoding of Behavior across Brains of Socially Interacting Animals. Cell 178, 429–446 e416, doi: 10.1016/j.cell.2019.05.022 (2019). [DOI] [PMC free article] [PubMed] [Google Scholar]
- 21.Liang B et al. Distinct and Dynamic ON and OFF Neural Ensembles in the Prefrontal Cortex Code Social Exploration. Neuron 100, 700–714 e709, doi: 10.1016/j.neuron.2018.08.043 (2018). [DOI] [PMC free article] [PubMed] [Google Scholar]
- 22.Lee E et al. Enhanced Neuronal Activity in the Medial Prefrontal Cortex during Social Approach Behavior. J Neurosci 36, 6926–6936, doi: 10.1523/JNEUROSCI.0307-16.2016 (2016). [DOI] [PMC free article] [PubMed] [Google Scholar]
- 23.Levy DR et al. Dynamics of social representation in the mouse prefrontal cortex. Nat Neurosci 22, 2013–2022, doi: 10.1038/s41593-019-0531-z (2019). [DOI] [PubMed] [Google Scholar]
- 24.Benekareddy M et al. Identification of a Corticohabenular Circuit Regulating Socially Directed Behavior. Biol Psychiatry 83, 607–617, doi: 10.1016/j.biopsych.2017.10.032 (2018). [DOI] [PubMed] [Google Scholar]
- 25.Murugan M et al. Combined Social and Spatial Coding in a Descending Projection from the Prefrontal Cortex. Cell 171, 1663–1677 e1616, doi: 10.1016/j.cell.2017.11.002 (2017). [DOI] [PMC free article] [PubMed] [Google Scholar]
- 26.Brumback AC et al. Identifying specific prefrontal neurons that contribute to autism-associated abnormalities in physiology and social behavior. Mol Psychiatry, doi: 10.1038/mp.2017.213 (2017). [DOI] [PMC free article] [PubMed] [Google Scholar]
- 27.Yizhar O et al. Neocortical excitation/inhibition balance in information processing and social dysfunction. Nature 477, 171–178, doi: 10.1038/nature10360 (2011). [DOI] [PMC free article] [PubMed] [Google Scholar]
- 28.Carta I, Chen CH, Schott AL, Dorizan S & Khodakhah K Cerebellar modulation of the reward circuitry and social behavior. Science 363, doi: 10.1126/science.aav0581 (2019). [DOI] [PMC free article] [PubMed] [Google Scholar]
- 29.Willsey AJ et al. Coexpression networks implicate human midfetal deep cortical projection neurons in the pathogenesis of autism. Cell 155, 997–1007, doi: 10.1016/j.cell.2013.10.020 (2013). [DOI] [PMC free article] [PubMed] [Google Scholar]
- 30.Bakken TE et al. A comprehensive transcriptional map of primate brain development. Nature 535, 367–375, doi: 10.1038/nature18637 (2016). [DOI] [PMC free article] [PubMed] [Google Scholar]
Associated Data
This section collects any data citations, data availability statements, or supplementary materials included in this article.
Data Availability Statement
The source data underlying Figs. 1–8 and Extended Data Figs. 1–9 are provided as source data files. The rest of relevant data are available from the corresponding author on reasonable request.


