Figure 2.

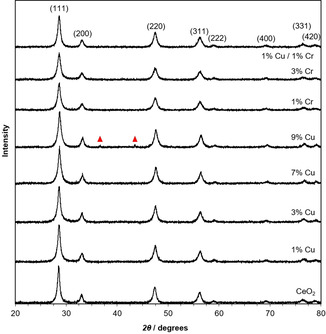
Powder XRD patterns of undoped, Cu‐doped, and Cr‐doped ceria nanorods. Ceria diffraction peaks are labelled with their Miller indices; ▴ represents copper oxide diffraction peaks.

Powder XRD patterns of undoped, Cu‐doped, and Cr‐doped ceria nanorods. Ceria diffraction peaks are labelled with their Miller indices; ▴ represents copper oxide diffraction peaks.