

Abstract
Intratumor heterogeneity of colorectal cancers (CRCs) is manifested both at the genomic and epigenomic levels. Early genetic aberrations in carcinogenesis are clonal and present throughout the tumors, but less is known about the heterogeneity of the epigenetic CpG island methylator phenotype (CIMP). CIMP characterizes a subgroup of CRCs thought to originate from specific precursor lesions, and it is defined by widespread DNA methylation within promoter regions. In this work, we investigated CIMP in two to four multiregional samples from 30 primary tumors (n = 86 samples) using the consensus Weisenberger gene panel (CACNA1G, IGF2, NEUROG1, RUNX3 and SOCS1). Twenty‐nine of 30 tumors (97%) showed concordant CIMP status in all samples, and percent methylated reference (PMR) values of all five markers had higher intertumor than intratumor variation (P value = 1.5e−09). However, a third of the CIMP+ tumors exhibited discrepancies in methylation status in at least one of the five gene markers. To conclude, CIMP status was consistent within primary CRCs, and it is likely a clonal phenotype. However, spatial discordances of the individual genes suggest that large‐scale analysis of multiregional samples could be of interest for identifying CIMP markers that are robust to intratumor heterogeneity.
Keywords: colorectal cancer, CpG island methylator phenotype (CIMP), multiregional sampling, spatial intratumor heterogeneity, Weisenberger panel
Short abstract
What's new?
Colorectal cancers (CRCs) exhibit significant intratumoral genetic and epigenetic heterogeneity. A subgroup of CRCs is characterized in particular by the epigenetic CpG island methylator phenotype (CIMP), though the extent to which CIMP contributes to intratumoral heterogeneity in these tumors is unknown. Here, investigation of CIMP in multiregional samples from primary CRCs shows that CIMP status is highly homogenous within tumors. In one‐third of CIMP‐positive primary CRCs, methylation status differed in at least one of five gene markers investigated. The findings suggest that inclusion of multiregional CRC samples could aid the development of more robust marker panels for CIMP assessment.
Abbreviations
- CIMP
CpG island methylator phenotype
- CRC
colorectal cancer
- FDR
false discovery rate
- IVD
in vitro methylated DNA
- MSI
microsatellite instability
- MSP
methylation‐specific PCR
- PMR
percent of methylated reference
- qMSP
quantitative methylation‐specific PCR
1. INTRODUCTION
Spatial intratumor genetic heterogeneity is a feature associated with poor prognosis in multiple cancer types. 1 It challenges the interpretation of biomarkers and the use of single biopsies for molecular profiling of tumors. 2 Colorectal cancers (CRCs) are heterogeneous at both the genomic and transcriptomic levels. 3 , 4 However, the common “drivers” of CRC development, including mutations in APC, KRAS, BRAF (codon 600) and TP53, are clonal and uniformly present in different subclones of the cancers. 5 This likely reflects their early occurrence and positive selection pressure during carcinogenesis. 6
The CpG island methylator phenotype (CIMP) is a molecular characteristic of 15% to 20% of CRCs, defined by widespread DNA methylation at CpG sites in promoter regions. 7 Epigenetic silencing of the DNA mismatch repair gene MLH1 via promoter methylation is the primary cause of sporadic onset of the microsatellite instability (MSI) hypermutation phenotype. 8 , 9 The majority of sporadic MSI+ CRCs display CIMP, although CIMP also occurs in a subgroup of nonhypermutated cancers. 9 CIMP likely precedes MSI and is thought to be an early event in tumor development. 7 Therefore, it could be speculated that, like the genetic “drivers” of CRC, CIMP is clonal and not prone to exhibit intratumor heterogeneity. To our knowledge, this question has only been addressed in two studies with a limited number of patients. 10 , 11 However, as the number of studies supporting a clinical relevance of CIMP is growing, with respect to both patient prognosis and therapy response, it is increasingly important to determine the level of intratumor heterogeneity of this biomarker. 12 , 13 Although several gene panels for CIMP status determination have been proposed, the five markers described by Weisenberger et al have been validated and are widely used—especially in studies investigating the clinical relevance of CIMP. 9 , 12 , 14 , 15 In this short report, we investigated spatial intratumor heterogeneity of CIMP in 86 multiregional samples from 30 primary CRCs using the Weisenberger gene panel for CIMP assessment.
2. MATERIALS AND METHODS
2.1. Patient material
A total of n = 86 multiregional fresh frozen primary tumor samples from N = 30 patients with Stage I to IV CRC were analyzed, with two to four (median 3) spatially separated samples per tumor (Supplementary Table 1). Tumors were selected from an initial series of 67 patients undergoing surgical resection at Oslo University Hospital (OUH, Ullevål), in the period March 2015 to November 2015. Patients with ≥3 available samples were selected resulting in 72 samples from 23 tumors. Finally, the series was completed by randomly selecting seven patients with two samples available from each tumor, resulting in a total of 30 patients. The median age at diagnosis of the included patients was 72 years, and the age range was 45 to 89 years (Supplementary Table 2); see Supplementary Figure 1 for detailed overview of sample selection.
2.2. DNA extraction and bisulfite conversion
Tumor DNA was isolated from fresh frozen tissue samples using the AllPrep DNA/RNA/miRNA Universal kit according to the manufacturer's instructions (Qiagen GmBH, Hilden, Germany). Bisulfite conversion of 900 ng of isolated DNA was performed according to the standard protocol of the EpiTect Bisulfite kit (Qiagen). The subsequent purification steps were carried out on the automated QIAcube System (Qiagen) with a final elution volume of 40 μL (2 × 20 μL).
2.3. DNA methylation analyses and determination of CIMP status
Genes of the Weisenberger CIMP marker panel (CACNA1G, RUNX3, IGF2, SOCS1 and NEUROG1), MLH1 and the repetitive ALU‐C4 element were analyzed for DNA methylation by quantitative methylation‐specific PCR (qMSP) with previously described primers and probes. 9 , 16 , 17 The primers were purchased from BioNordika (Oslo, Norway), and probes were obtained from Life Technologies (now Thermo Fisher Scientific, Carlsbad, CA) (see Supplementary Table 3 for sequence information). qMSP was performed as previously described. 18 Briefly, samples were analyzed in triplicates in 384‐well plates run on a 7900HT Fast Real‐Time PCR System (Thermo Fisher Scientific) (95°C for 10 minutes, followed by 45 cycles of 95°C for 15 seconds and 60°C for 60 seconds). Methylation positive (in vitro methylated DNA; IVD, Zymo Research), methylation negative (Whole Genome Amplified [WGA] non‐methylated DNA, Zymo Research) and nontemplate (H2O) controls were included, in addition to a standard curve consisting of a 5‐fold serial dilution of IVD (32.5‐0.052 ng). Total reaction volume per well was 20 μL (0.9 μM forward and reverse primers, 0.2 μM probe, 1xTaqMan Universal Master Mix II—no UNG [Thermo Fisher Scientific] and ~32.5 ng bisulfite treated DNA).
The percent of methylated reference (PMR) values were calculated as the median GENE:ALU ratio of each sample relative to the median GENE:ALU ratio of the calibrator (IVD). Genes with a PMR value ≥10 were considered methylated. Samples with ≥3 methylated genes were scored as CIMP+ in accordance with Weisenberger et al. 9 PMR value of ≥10 was also used to score samples as positive for MLH1 methylation. 16
2.4. Microsatellite instability and tumor purity analysis
MSI status was determined by PCR‐based analyses of the BAT25, BAT26, NR21, NR24, MONO27 markers, in at least one randomly selected sample per tumor, using the MSI Analysis System, Version 1.2 (Promega). Gene expression profiles were obtained from GeneChip Human Transcriptome Array 2.0 (unpublished) and were used to calculate tumor purity using the R package ESTIMATE (version 1.0.13). 19
2.5. Analysis of CIMP intratumor heterogeneity
For each tumor, the concordance in the overall CIMP status among multiregional samples was assessed. In addition, pairwise heterogeneity scores between any two samples were computed as the Euclidean distance between vectors of PMR values of the five markers. Intratumor heterogeneity scores (between samples from the same tumor) were compared to intertumor heterogeneity scores (between samples from different tumors) and to technical variability (distance between technical triplicates). A left‐sided Wilcoxon's test was performed to investigate the null hypothesis that the distribution of intratumor heterogeneity scores was not significantly different from the distribution of intertumor heterogeneity scores. In the same way, a right‐sided Wilcoxon's test was performed to test whether technical variability was significantly lower than intratumor heterogeneity. A P value of <.05 was considered significant. When relevant and as indicated, P values were corrected for multiple testing using the False Discovery Rate (FDR) criterion and Benjamini‐Hochberg (BH) procedure. FDR < 0.05 was considered significant. Analyses were carried out with R version 3.6.1 and R Studio Version 1.2.1335.
2.6. Analysis of individual marker performances
The ability of the individual markers of the Weisenberger panel to robustly assess CIMP status was evaluated. We compared the distribution of PMR values in CIMP+ samples in the present series to single samples from each of 56 CIMP+ tumors from our previously published data (Oslo 2 series). 12 The variability and methylation status concordance of each gene were also assessed among the series of multiregional samples.
3. RESULTS
3.1. High level of homogeneity of CIMP in multiregional samples from primary CRCs
We investigated the extent of spatial intratumor heterogeneity of CIMP in 86 multiregional samples from 30 primary CRCs, using the consensus 5‐marker panel for CIMP assessment described by Weisenberger et al. 9 The estimated PMR values from the median triplicate measurement are shown in Supplementary Table 4. No significant association between intratumor heterogeneity and tumor size was observed (Supplementary Figure 2).
CIMP status was concordant across all multiregional samples in 29 out of 30 patients (97%, Figure 1A). The single tumor with discordant status had one CIMP+ and two CIMP− samples. Eleven tumors (37%) were scored as CIMP+ in all samples. Of these 82% (9 of 11) were from female patients and all had a right‐sided tumor location (Supplementary Table 2). Thirty percent of all tumors (9 of 30) were MSI+ in which 78% displayed methylation in MLH1 (Figure 1A). Of note, MLH1 methylation was found exclusively in MSI+ tumors where it was completely concordant between all multiregional samples (Supplementary Figure 3). The tumor with discordant CIMP status was neither MSI+ nor MLH1 methylated in any of the samples.
FIGURE 1.
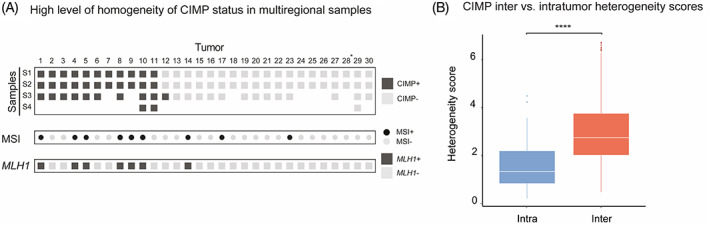
CIMP assessment in multiregional samples of primary CRC tumors. A, CIMP status concordance among multiregional Samples S1 to S4 (in rows) from 30 CRC tumors (in columns). Dark gray boxes denote CIMP+ samples (ie, samples with ≥3 methylated genes), while light gray is indicative of CIMP−. MSI status (MSI+: black circles; MSI−: gray circles) and MLH1 methylation (MLH1+: dark gray boxes; MLH1−: light gray boxes) are also provided. B, Boxplots showing the overall distribution of interpatient (red) and intrapatient (blue) heterogeneity scores among CIMP+ tumors (1‐11). Intertumor heterogeneity scores were calculated as the Euclidean distances between any two samples from different tumors. Intratumor heterogeneity scores were defined as the pairwise distances between any two samples of the same tumor. Asterisks denote the significance level of the left‐sided Wilcoxon test (P = 1.5e−09)
Pairwise heterogeneity scores were calculated between all samples from the 11 CIMP+ tumors, based on PMR values of the five CIMP markers (Figure 1B). Overall, the heterogeneity scores were significantly lower in intratumor comparisons than in intertumor comparisons (P value = 1.5e−09). Tumor‐wise comparisons supported that the methylation levels were generally more similar within than among CIMP+ tumors (Supplementary Figure 4).
3.2. Intratumor variability of the individual CIMP markers
All five CIMP markers had median PMR values <35 in samples from CIMP+ tumors, ranging from 13.2 for CACNA1G to 34.2 for IGF2 (Figure 2A), indicating low methylation levels. Similarly low methylation levels were also seen in a larger series of fresh‐frozen samples from 56 CIMP+ tumors previously published by our group (median < 50, Supplementary Figure 5). 12 We observed spatial variability of PMR values among the multiregional samples from each individual tumor (Figure 2B). Of note, the tumors had comparable purity estimates across their multiregional samples (Supplementary Figure 6). Marker‐wise there was a good overall concordance, but each marker had discrepant methylation status among samples from at least one tumor (Figure 2C). The number of tumors with inconsistent methylation status ranged from one (3%) for RUNX3 and SOCS1 to two (7%) for CACNA1G and IGF2, and four (13%) for NEUROG1 (Figure 2C). Tumor‐wise there was also a good overall concordance in methylation status, although four out of the 11 CIMP+ tumors (36%) had at least one discordant marker. In all except one of the cases, this did not affect the overall CIMP status of the tumor. For example, the three samples from Tumor 5 had discordant methylation status in three of the markers, but all samples were scored as positive for at least three markers each resulting in an overall CIMP+ status. In contrast, Sample S3 from Tumor 12 was scored as methylated for the genes IGF2, NEUROG1 and RUNX3 and therefore CIMP+, while Samples S1 and S2 were only methylated for IGF2 and NEUROG1 and therefore CIMP−. Notably, the discordant marker in this tumor, RUNX3, had PMR values close to the scoring threshold (PMRRUNX3 = 11.8 [positive] in S3; 2.8 and 3.0 [negative] in S1 and S2, respectively). To investigate the contribution of technical variability to marker discrepancies, Euclidean distances between set of triplicates for each sample and for each gene were computed. Technical variance was significantly lower than intra‐tumor heterogeneity (P value = 7.9e−07, Supplementary Figure 7). Overall, the triplicates had 98% to 100% concordance in methylation across all markers (Supplementary Figures 8‐12).
FIGURE 2.
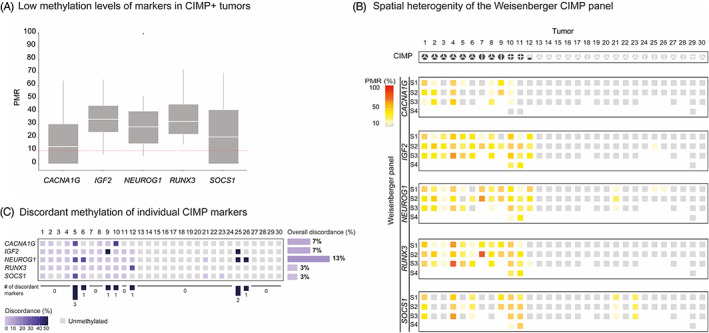
Methylation levels and variability of individual CIMP markers. A, Distribution of PMR values of the five genes constituting the Weisenberger panel for CIMP assessment (CACNA1G, IGF2, NEUROG1, RUNX3 and SOCS1). The scoring threshold for methylation positive samples (PMR ≥10) is shown as a red‐dotted line. PMR values above 100 were resized to 100. B, Methylation levels of genes of the Weisenberger CIMP panel (in rows) for the 30 CRC tumors (in columns). PMR values ≥10 are displayed using a color scale from yellow (PMR = 10) to red (PMR = 100). Unmethylated genes, with PMR < 10, are shown in light gray. C, For each gene of the Weisenberger panel, the percentage of discordant methylation status among multiregional samples from the same tumor is shown using blue shades. A discordant sample was defined as a sample whose methylation status was deviating from the majority of samples. Light blue denoted 0% discordance, that is, same methylation status across all multiregional samples for a given marker. Dark blue denoted 50% discordance between samples of the same tumor; it was observed for some of the tumors with two samples (see tumors 9, 25 and 26), for which one of the sample was methylated for the marker while the other sample was unmethylated. Gray boxes are indicative of genes unmethylated in all samples. For each marker, the overall discordance was defined as the percentage of tumors with discordance >0. Finally, for each tumor, we provided the number of genes with discordant methylation status
4. DISCUSSION
Intratumor heterogeneity challenges the use of single bulk tumor tissue samples for molecular stratification and treatment guidance of cancer patients. A growing body of studies has explored the intratumoral diversity of genetic alterations in different cancer types, but the epigenetic contribution to intratumor heterogeneity remains undetermined. To our knowledge, the current study focusing on spatial heterogeneity of CIMP in multiregional samples of primary CRC is the largest of its kind, with 86 multiregional samples from 30 tumors. In total, 37% of the tumors were scored as CIMP+, which was higher than what is expected in the general CRC population where CIMP is usually found in 15% to 20%. 12 , 20 However, the high incidence of CIMP in our cohort was probably attributed to the high number of females with right‐sided and MSI+ tumors. 9
CIMP is likely an early event in CRC carcinogenesis, and therefore a uniform characteristic of the cancers. 7 High concordance has also been documented between primary CRCs and matched metastases. 21 We confirmed concordant CIMP status also in intratumor comparisons of primary CRCs in all except one tumor. This is in contrast to a previous study reporting discordant CIMP status among multiregional samples in 50% of the tumors. 12 However, the low number of tumors (n = 12), the qualitative method (methylation‐specific PCR) and the two‐marker CIMP panel used in their study limit the strength of the conclusions. 9 , 22 To overcome these limitations, we based our study on a quantitative methylation assessment approach (qMSP) and the consensus five‐marker Weisenberger panel. 9 By quantitative assessment of methylation levels, we further demonstrated that intratumor heterogeneity was significantly lower than intertumor heterogeneity among the CIMP+ tumors. All CIMP+ tumors were right‐sided. Although it cannot be excluded that left‐sided CIMP+ tumors have a different biology, in a recent study Fennell et al showed that CIMP+ and CIMP− tumors generally cluster away from each other irrespective of sidedness. 23
Although our data suggest a high clonality of CIMP, we revealed intratumor variability in the methylation levels of the consensus five‐marker panel among samples from the same tumor. In a similar setting, Hühns et al studied intratumor heterogeneity of the gene panel described by Ogino and colleagues in 10 CRCs, including three CIMP+ tumors. 10 , 22 The Ogino panel includes the five genes of the Weisenberger panel, in addition to CDKN2A, CRABP1 and MLH1. 22 Hühns et al did not conclude on the overall intratumor CIMP heterogeneity, but described a “mosaic” pattern of PMR values, in line with our findings. Methylation patterns have been shown to be highly cell type‐specific, and differences in cell‐type composition among samples may contribute to intratumor heterogeneity on a per‐marker basis. 24 In addition, variation caused by technical factors is also expected as previously demonstrated by our group. 25 Although we showed moderate variation between triplicate measurements in the present study, technical variability combined with cell‐type specific variation increase the likelihood of observing inconsistent methylation status among multiregional samples. This is especially true when PMR values of marker genes are close to the scoring threshold. The growing interest in CIMP as a biomarker with potential prognostic and predictive value in CRC underscores the need for a scoring assay that is robust to tumor sampling and technical noise. 12 , 13 In this regard, high‐throughput omics technologies combined with multiregional sampling represent a promising alternative for the development and validation of marker panels. Our findings also suggest that multiregional samples should be taken into consideration during the development and validation of marker panels.
5. CONCLUSION
To our knowledge, this is the first study to report that CIMP status is highly homogeneous within primary CRC tumors in a series of multiregional samples, supporting a clonal development of this epigenetic phenotype. However, all five markers exhibited some inconsistencies in methylation status. Although the Weisenberger panel appears to be robust to these inconsistencies in most cases, large‐scale methylome analysis of multiregional samples may be considered for further evaluation of the panel.
CONFLICT OF INTEREST
The authors have no conflicts of interest to declare.
ETHICS STATEMENT
The study has been approved by the Regional Committee for Medical and Health Research Ethics (Number 1.2005.1629), which requires informed consent from patients enrolled in the study. All procedures were performed in accordance with the Declaration of Helsinki and the research biobank has been registered according to national legislation.
Supporting information
Appendix S1. Supporting Information.
ACKNOWLEDGEMENTS
BTBF and JL are supported as PhD candidates by a joint grant from the Research Council of Norway and the University of Oslo (project no. 250993/F20 to RAL). This work was also supported by the South‐Eastern Norway Regional Health Authority (project number 2019030, M. Jeanmougin) and the Research Council of Norway (project number 287899 to AS).
Flatin BT, Vedeld HM, Pinto R, et al. Multiregional assessment of CIMP in primary colorectal cancers: Phenotype concordance but marker variability. Int. J. Cancer. 2021;148:1652–1657. 10.1002/ijc.33425
Funding information Norges Forskningsråd, Grant/Award Number: 287899; Research Council of Norway/University of Oslo, Grant/Award Number: 250993/F20; South‐Eastern Norway Regional Health Authority, Grant/Award Number: 2019030
REFERENCES
- 1. Andor N, Graham TA, Jansen M, et al. Pan‐cancer analysis of the extent and consequences of intratumor heterogeneity. Nat Med. 2016;22:105‐113. [DOI] [PMC free article] [PubMed] [Google Scholar]
- 2. McGranahan N, Swanton C. Biological and therapeutic impact of intratumor heterogeneity in cancer evolution. Cancer Cell. 2015;27:15‐26. [DOI] [PubMed] [Google Scholar]
- 3. Dunne PD, McArt DG, Bradley CA, et al. Challenging the cancer molecular stratification dogma: intratumoral heterogeneity undermines consensus molecular subtypes and potential diagnostic value in colorectal cancer. Clin Cancer Res. 2016;22:4095‐4104. [DOI] [PubMed] [Google Scholar]
- 4. Sottoriva A, Kang H, Ma Z, et al. A big bang model of human colorectal tumor growth. Nat Genet. 2015;47:209‐216. [DOI] [PMC free article] [PubMed] [Google Scholar]
- 5. Brunsell TH, Sveen A, Bjørnbeth BA, et al. High concordance and negative prognostic impact of RAS/BRAF/PIK3CA mutations in multiple resected colorectal liver metastases. Clin Colorectal Cancer. 2020;19:e26‐e47. [DOI] [PubMed] [Google Scholar]
- 6. Suzuki Y, Ng SB, Chua C, et al. Multiregion ultra‐deep sequencing reveals early intermixing and variable levels of intratumoral heterogeneity in colorectal cancer. Mol Oncol. 2017;11:124‐139. [DOI] [PMC free article] [PubMed] [Google Scholar]
- 7. Toyota M, Ahuja N, Ohe‐Toyota M, Herman JG, Baylin SB, Issa JP. CpG island methylator phenotype in colorectal cancer. Proc Natl Acad Sci U S A. 1999;96:8681‐8686. [DOI] [PMC free article] [PubMed] [Google Scholar]
- 8. Ogino S, Goel A. Molecular classification and correlates in colorectal cancer. J Mol Diagn. 2008;10:13‐27. [DOI] [PMC free article] [PubMed] [Google Scholar]
- 9. Weisenberger DJ, Siegmund KD, Campan M, et al. CpG island methylator phenotype underlies sporadic microsatellite instability and is tightly associated with BRAF mutation in colorectal cancer. Nat Genet. 2006;38:787‐793. [DOI] [PubMed] [Google Scholar]
- 10. Hühns M, Krohn S, Murua Escobar H, Prall F. Genomic heterogeneity in primary colorectal carcinomas and their metastases: born bad or brought up a villain? Hum Pathol. 2018;74:54‐63. [DOI] [PubMed] [Google Scholar]
- 11. Jones HG, Jenkins G, Williams N, et al. Genetic and epigenetic intra‐tumour heterogeneity in colorectal cancer. World J Surg. 2017;41:1375‐1383. [DOI] [PMC free article] [PubMed] [Google Scholar]
- 12. Vedeld HM, Merok M, Jeanmougin M, et al. CpG island methylator phenotype identifies high risk patients among microsatellite stable BRAF mutated colorectal cancers. Int J Cancer. 2017;141:967‐976. [DOI] [PMC free article] [PubMed] [Google Scholar]
- 13. Weisenberger DJ, Liang G, Lenz HJ. DNA methylation aberrancies delineate clinically distinct subsets of colorectal cancer and provide novel targets for epigenetic therapies. Oncogene. 2018;37:566‐577. [DOI] [PMC free article] [PubMed] [Google Scholar]
- 14. Jia M, Gao X, Zhang Y, Hoffmeister M, Brenner H. Different definitions of CpG island methylator phenotype and outcomes of colorectal cancer: a systematic review. Clin Epigenetics. 2016;8:25. [DOI] [PMC free article] [PubMed] [Google Scholar]
- 15. Juo YY, Johnston FM, Zhang DY, et al. Prognostic value of CpG island methylator phenotype among colorectal cancer patients: a systematic review and meta‐analysis. Ann Oncol. 2014;25:2314‐2327. [DOI] [PMC free article] [PubMed] [Google Scholar]
- 16. Levine AJ, Phipps AI, Baron JA, et al. Clinicopathologic risk factor distributions for MLH1 promoter region methylation in CIMP‐positive tumors. Cancer Epidemiol Biomarkers Prev. 2016;25:68‐75. [DOI] [PMC free article] [PubMed] [Google Scholar]
- 17. Weisenberger DJ, Campan M, Long TI, et al. Analysis of repetitive element DNA methylation by MethyLight. Nucleic Acids Res. 2005;33:6823‐6836. [DOI] [PMC free article] [PubMed] [Google Scholar]
- 18. Lind GE, Danielsen SA, Ahlquist T, et al. Identification of an epigenetic biomarker panel with high sensitivity and specificity for colorectal cancer and adenomas. Mol Cancer. 2011;10:85. [DOI] [PMC free article] [PubMed] [Google Scholar]
- 19. Yoshihara K, Shahmoradgoli M, Martínez E, et al. Inferring tumour purity and stromal and immune cell admixture from expression data. Nat Commun. 2013;4:2612. [DOI] [PMC free article] [PubMed] [Google Scholar]
- 20. Samowitz WS, Albertsen H, Herrick J, et al. Evaluation of a large, population‐based sample supports a CpG island methylator phenotype in colon cancer. Gastroenterology. 2005;129:837‐845. [DOI] [PubMed] [Google Scholar]
- 21. Cohen SA, Yu M, Baker K, et al. The CpG island methylator phenotype is concordant between primary colorectal carcinoma and matched distant metastases. Clin Epigenetics. 2017;9:46. [DOI] [PMC free article] [PubMed] [Google Scholar]
- 22. Ogino S, Kawasaki T, Kirkner GJ, Kraft P, Loda M, Fuchs CS. Evaluation of markers for CpG island methylator phenotype (CIMP) in colorectal cancer by a large population‐based sample. J Mol Diagn. 2007;9:305‐314. [DOI] [PMC free article] [PubMed] [Google Scholar]
- 23. Fennell L, Dumenil T, Wockner L, et al. Integrative genome‐scale DNA methylation analysis of a large and unselected cohort reveals 5 distinct subtypes of colorectal adenocarcinomas. Cell Mol Gastroenterol Hepatol. 2019;8:269‐290. [DOI] [PMC free article] [PubMed] [Google Scholar]
- 24. Lokk K, Modhukur V, Rajashekar B, et al. DNA methylome profiling of human tissues identifies global and tissue‐specific methylation patterns. Genome Biol. 2014;15:3248. [DOI] [PMC free article] [PubMed] [Google Scholar]
- 25. Pharo HD, Honne H, Vedeld HM, et al. Experimental factors affecting the robustness of DNA methylation analysis. Sci Rep. 2016;6:33936. [DOI] [PMC free article] [PubMed] [Google Scholar]
Associated Data
This section collects any data citations, data availability statements, or supplementary materials included in this article.
Supplementary Materials
Appendix S1. Supporting Information.