

Abstract
Patients with polycystic kidney disease (PKD) are characterized with uncontrolled hypertension. Hypertension in PKD is a ciliopathy, an abnormal function and/or structure of primary cilia. Primary cilia are cellular organelles with chemo and mechanosensory roles. In the present studies, we designed a cilia-targeted (CT) delivery system to deliver fenoldopam specifically to the primary cilia. We devised the iron oxide nanoparticle (NP)-based technology for ciliotherapy. Live imaging confirmed that the CT-Fe2O3-NPs specifically targeted primary cilia in cultured cells in vitro and vascular endothelia in vivo. Importantly, the CT-Fe2O3-NPs enabled the remote control of the movement and function of a cilium with an external magnetic field, making the nonmotile cilium exhibit passive movement. The ciliopathic hearts displayed hypertrophy with compromised functions in left ventricle pressure, stroke volume, ejection fraction, and overall cardiac output because of prolonged hypertension. The CT-Fe2O3-NPs significantly improved cardiac function in the ciliopathic hypertensive models, in which the hearts also exhibited arrhythmia, which was corrected with the CT-Fe2O3-NPs. Intraciliary and cytosolic Ca2+ were increased when cilia were induced with fluid flow or magnetic field, and this served as a cilia-dependent mechanism of the CT-Fe2O3-NPs. Fenoldopam-alone caused an immediate decrease in blood pressure, followed by reflex tachycardia. Pharmacological delivery profiles confirmed that the CT-Fe2O3-NPs were a superior delivery system for targeting cilia more specifically, efficiently, and effectively than fenoldopam-alone. The CT-Fe2O3-NPs altered the mechanical properties of nonmotile cilia, and these nano-biomaterials had enormous clinical potential for ciliotherapy. Our studies further indicated that ciliotherapy provides a possibility toward personalized medicine in ciliopathy patients.
Keywords: calcium, ciliopathy, cilium, chemosensor, nanotherapy, mechanosensor
Graphical Abstract
Ciliopathies include the expanding spectrum of kidney, liver, and cardiovascular disorders. Ciliopathic patients are characterized with polycystic kidney disease (PKD) and associated with hypertension.1–3 Ciliopathies are diseases caused by abnormal function or structure of primary cilia. Endothelial cilia are mechanical switches to initiate biosynthesis and release of nitric oxide (NO).4 Endothelial cilia therefore act as local regulators of blood pressure. Focal increases in blood pressure activates cilia and induces NO release, which in turn induces vasodilation.5 Abnormal endothelial cilia are therefore associated with vascular hypertension.6 Unfortunately, there is currently no cilia-targeted therapy available to treat hypertension in PKD patients. This is mainly a result of the lack of a specific drug that can target cilia.
The main differences between hypertension in general population and ciliopathic patients are as follows: First, the median age of hypertension is 32 years old in a ciliopathic patient compared to 50 years old in general population.7,8 Second, some ciliopathic patients show resistance to antihypertensive therapy.9,10 Third, serum nitrate/nitrite as an indicator for endothelial function is significantly lower in ciliopathic patients than that in the general hypertensive population.11,12 Fourth, focal vascular injuries, including death associated with aneurysm rupture, become very common in ciliopathic patients,13–15 probably because of the lack of the “local” blood-pressure regulation. In addition, secondary abnormalities in the heart and kidney are more apparent in ciliopathic hypertensive patients than in the general hypertensive population.16,17 Perhaps the most important clinical data that are commonly overlooked are that children with ciliopathy kidney disorder have hypertension as young as 18 months old.18
Dopamine and its derivative fenoldopam have been used as experimental drugs in hypertensive patients with a ciliopathy.11,12 However, the use of dopamine and fenoldopam is limited due to their broad spectrum of physiological functions in the body.11 A very slow perfusion rate is required during the administration of fenoldopam to achieve a peripheral effect on primary cilia in mice, making it less ideal for use in humans.11 In our studies, fenoldopam was selected as the drug of choice due to its milder ciliary response compared with that of dopamine.11 Furthermore, as shown in the previous study, activation of dopamine receptors had very little or no effect on cells with very short cilia (Tg737), confirming the specificity of fenoldopam toward cilia function.19,20 Of note is that fenoldopam is a nonselective agent that we intended to delivery specifically to the cilia.
In addition to its nonspecific effects to the adrenergic receptors, fenoldopam is a partial agonist that activates different subtypes of dopamine receptors. In general, the dopamine receptors (DR) are classified into D1 (increasing intracellular cAMP) and D2 (decreasing intracellular cAMP). The D1 family includes DR1 and DR5, whereas the D2 family consists of DR2, DR3, and DR4. Only DR5 is shown to be localized to cilia and involved in cilia length increase.19–21 Besides dopamine and fenoldopam, there are many other agents that can also increase cilia length. Unfortunately, the mechanisms by which these agents increase cilia length are neither known nor tested in ciliopathy models.
Primary cilia are involved in chemo and mechanosensing that transmit the extracellular signals into intracellular biochemical signaling. The chemosensory and mechanosensory functions of cilia are interconnected; chemicals that lengthen primary cilia enhances the mechanosensitivity of single cells.20,22,23 A cilium is a cell organelle that exposes itself to the extracellular lumen. This characteristic provides important access to target a cilium in cultured cells in vitro or in organ systems in vivo.
In the present study, we devised cilia-targeted (CT) nanoparticles (NPs) to serve as a mechanism for a precise therapeutic drug delivery of a pharmacological agent to treat ciliopathic vascular hypertension. Thus, our studies were to examine the specificity of fenoldopam delivery to primary cilia, not on generating experimental agents, which may take another 3–4 decades until fruition. Of note is that there is currently no pharmacological study that has targeted primary cilia exclusively. Because primary cilia have a diameter of about 250 nm, NPs become a very promising vehicle for delivering drugs to the cilia. Our goals were to use magnetic nanoparticles (CT-Fe2O3-NPs) to specifically target primary cilia in order to control movement, length, and function of cilia. Our studies suggested that existing drugs could be specifically targeted to cilia for achieving maximum therapeutic outcome and reducing overall side effect via NPs deliveries.
RESULTS AND DISCUSSION
Characterization of Fe2O3-Nanoparticles.
We selected hematite metal oxide (α-Fe2O3) as our nanomaterial because of its excellent biocompatibility, magnetic properties, and applicability for use in vivo to target primary cilia. We prepared stable Fe2O3-nanoparticles (NPs) using several synthesis steps (see the Experimental Section and Figure 1A). We analyzed and characterized the products from each synthesis and surface functionalization step: bare NPs to functional cilia-targeted (CT)-Fe2O3-NPs (Figure S1A). The typical UV–visible absorbance spectra were recorded at different steps in Fe2O3-NP synthesis in dispersed form (Figure S1B). Dynamic light scattering (DLS) measurements showed that upon surface functionalization, the size distributions were increased from 102 ± 3.8 to 126 ± 4.6 nm (Figure S1C). When the surface charge of the particles was analyzed, the charge repulsion increased after every functionalization step from +12.9 ± 2.8 to −27.9 ± 3.4 (Figure S1D). The ζ-potential of the CT-Fe2O3-NPs decreased to −25 mV, indicating the excellent surface stability of the CT-Fe2O3-NPs in suspension and their suitability for intravenous applications. The successful formation of bare NPs and their surface functionalization were also examined by collecting X-ray diffraction (XRD) and X-ray photoelectron spectroscopy (XPS) spectra (Figure S1E,F). Fourier transform infrared spectroscopy (FTIR) was also used to obtain spectral signatures of each synthesis and surface functionalization step (Figure S1G).
Figure 1.
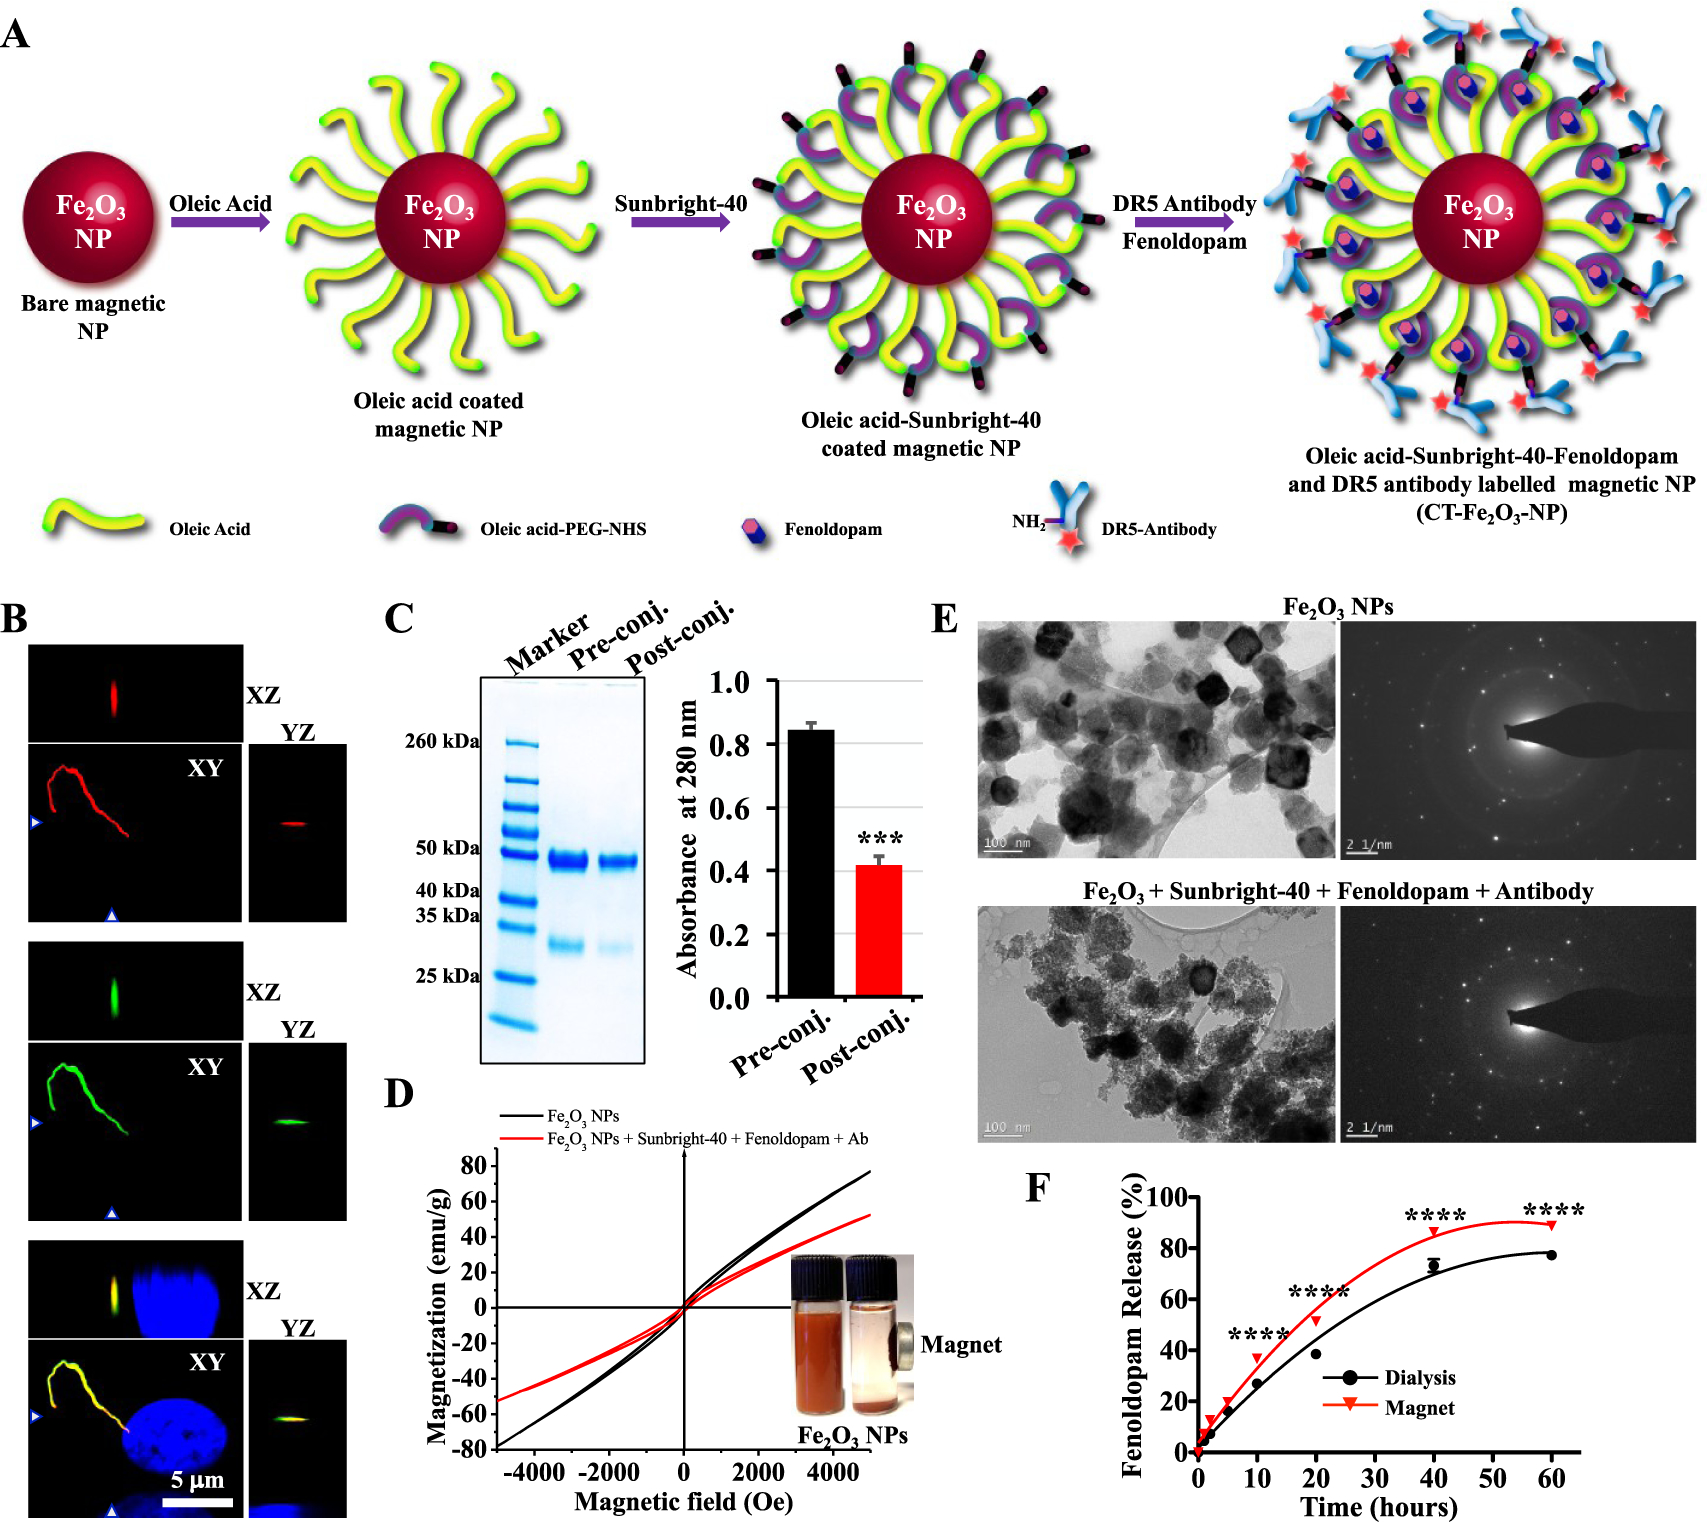
Preparation and characterization of the CT-Fe2O3-NPs. (A) Synthesis and surface functionalization of the CT-Fe2O3-NPs. (B) Reconstructed fluorescence images of cells showing DR5 localization to the primary cilium. (C) SDS-PAGE image showing a reduction in the amount of antibody in the supernatant before and after the conjugation reaction. The bar graph shows the antibody concentrations in the pre and postconjugation solutions quantified by measuring the A280. (D) Hysteresis loops of bare Fe2O3-NPs and the CT-M-Fe2O3-NPs showing the superparamagnetic characteristics of the CT-M-Fe2O3-NPs in the dispersed form. The inset photograph shows the particles dispersed in water with and without magnetic separation. (E) TEM and selected area electron diffraction (SAED) micrographs showing bare Fe2O3-NPs and the CT-M-Fe2O3-NPs. (F) The release profile of fenoldopam from the CT-M-Fe2O3-NPs in PBS was compared using a dialysis method and magnetic rotations. N = 3 for all experiments; ****, p < 0.0001 between groups.
The CT-Fe2O3-NPs were tagged with DR5-specific antibodies, because DR5 has primarily been shown to be concentrated in the primary cilia of fibroblasts,21 endothelial cells,19 and epithelial cells.20 The agonist binding pocket of the dopamine receptor is located between transmembrane helices 3, 4, 5, and 6.24 Our DR5 antibody selectively recognizes the extracellular N-terminus between amino acids 2 and 10. In addition to the localization of DR5 antibodies on the cilia surface for epitope accessibility, we validated that DR5 antibody was approximately 95 ± 12 times more selective for cilia than the cell body by recording relative intensity measurements in permeabilized, fixed cells (Figure 1B). Once tagged with the CT-Fe2O3-NPs, the ratio of the cilia-to-cell body specificity of the DR5 antibody was 158 ± 19 in nonpermeabilized live cells. The specificity of the DR5 antibody in cilia relative to the cell body was increased in nonpermeabilized compared to permeabilized cells, indicating that the antibody could penetrate more readily into the cell body through the permeabilized cell membrane. Further, the proportion of specific binding of the CT-Fe2O3-NPs to cilium/cell/background was about 17 000:500:1 (Figure 2A).
Figure 2.
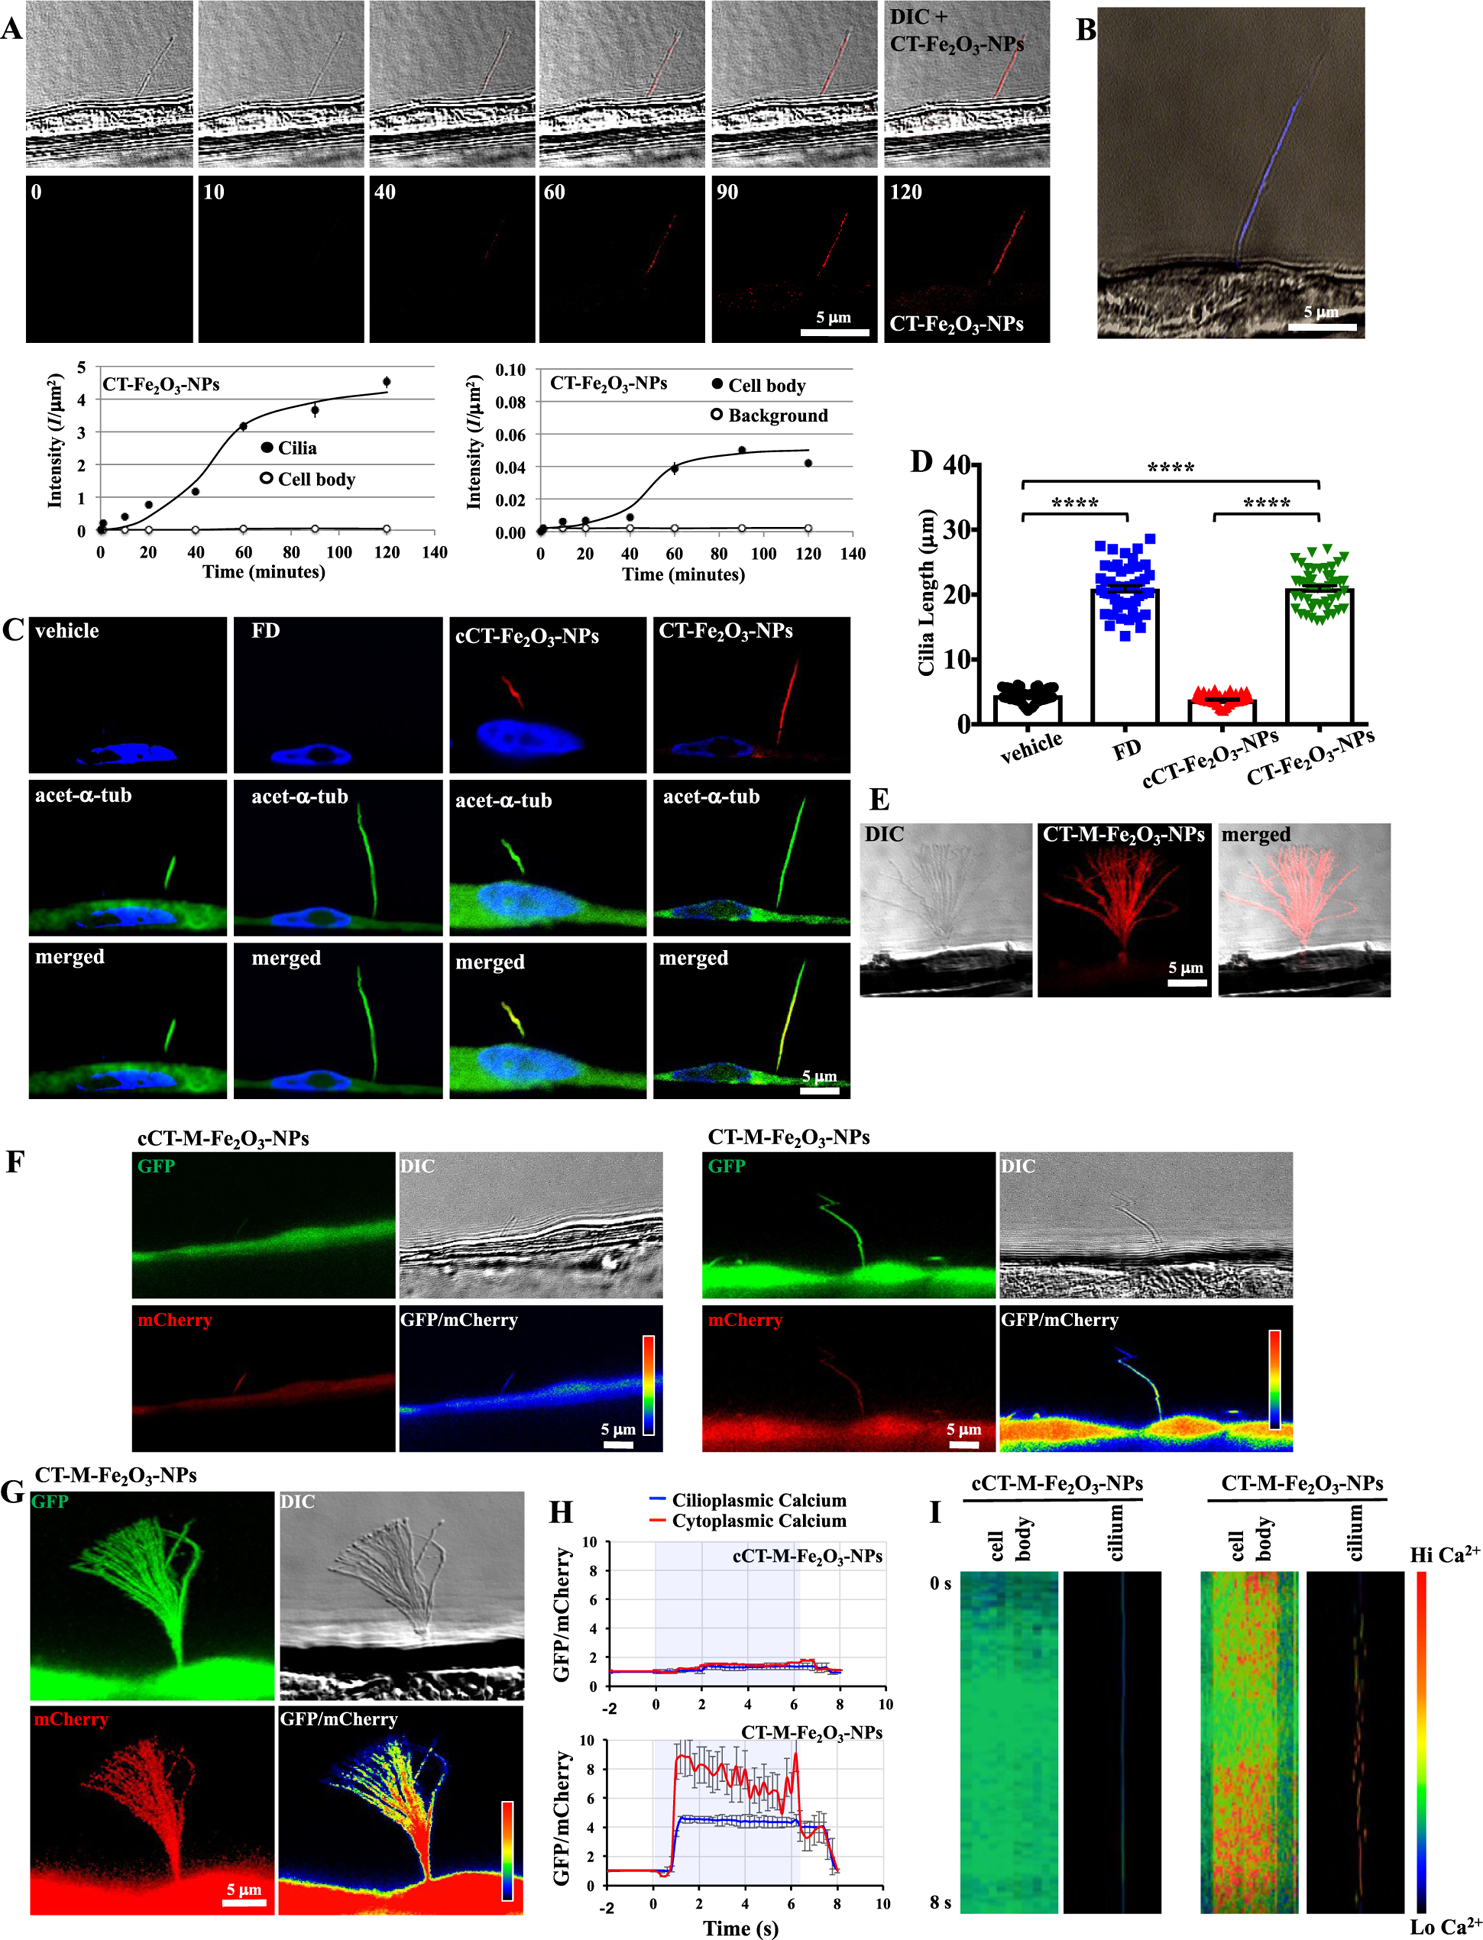
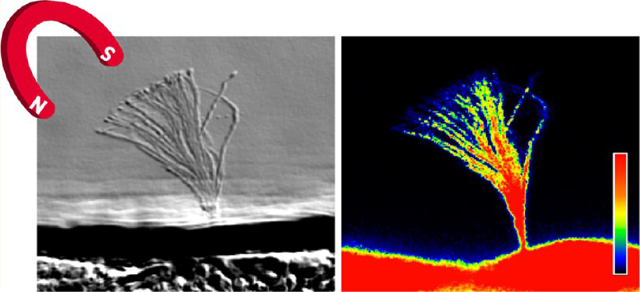
The CT-Fe2O3-NPs specifically target primary cilia under flow conditions and improve cilia structure and function. (A) A single-cell–single-cilium analysis was performed in a live cell to quantify the targeting specificity of the CT-Fe2O3-NPs at different time points (0 to 120 min). The top panel shows DIC images to confirm the presence of a cilium and fluorescence images to verify the CT-Fe2O3-NP specificity. The bottom panel shows the fluorescence images of the CT-Fe2O3-NPs alone. The CT-Fe2O3-NP fluorescence intensity per area (I/μm2) was quantified in cilia vs the cell body and the cell body vs background fluorescence. A direct recording of the CT-Fe2O3-NPs binding primary cilia is also shown in Movie 1. (B) Prussian blue staining confirmed the direct and specific binding of the CT-Fe2O3-NPs to the primary cilia. (C) Fluorescence images show that fenoldopam and the CT-Fe2O3-NPs (red) increased the cilia length (16 h of treatment) compared with controls (PBS treatment or cCT-Fe2O3-NPs). The ciliary marker acetylated-α-tubulin (green) and a nuclear marker, DAPI, (blue) were used. A 3D view of the fixed cilia and NP localizations is also shown in Movie 2. (D) Representative dot-plotted bar graph showing the ciliary lengths measured in cells receiving different treatments (acquired from 5 preparations in each group; a minimum of 10 cilia were randomly selected from each preparation). (E) An external magnetic field acting on the CT-Fe2O3-NPs (CT-M-Fe2O3-NPs) induced passive cilia movements. The image was generated and compiled from 5 s of cilia movement (Movie 3). (F) 5HT6-mCherry-GGECO1.0 was expressed in LLC-PK1 cells to measure cytosolic and intraciliary Ca2+ signaling. GFP was used to measure changes in Ca2+ signals, mCherry was used to normalize motion artifacts, and DIC was used to track cilia movement. The GFP/mCherry ratio (pseudocolored) indicates normalized Ca2+ levels. Images of cells before and after challenge with either fluid flow (CT-Fe2O3-NPs) or the magnetic field (CT-M-Fe2O3-NPs) are shown (N = 6, 30 fps). The colored bar shows the Ca2+ levels. Changes in fluorescence intensity are also shown in Movies 4, 5, 6, 7, 8, and 9. (G) An image of the cumulative intensity profile (achieved by ND acquisition, Nikon system) shows high cellular and ciliary Ca2+ levels when cells were exposed to an external magnetic force. (H) Average cytosolic (red) and cilioplasmic (blue) Ca2+ levels (in arbitrary units) are shown in line graphs. (I) Kymograph analysis of Ca2+ signaling in the cell body and cilia was performed in cells treated with the control (cCT-M-Fe2O3-NPs) and the CT-M-Fe2O3-NPs. The colored bar shows the Ca2+ levels. In all cases, vehicle (PBS) and superparamagnetic Fe2O3-NPs without loaded drug in the absence (cCT-Fe2O3-NPs) or presence (cCT-M-Fe2O3-NPs) of the magnetic field were used as controls. N = 4 samples per group in each study. ****, p < 0.0001 between groups.
The NPs were coated with Sunbright-40 (oleyl-O-(CH2CH2)nCO-CH2CH2-COO-N-hydroxysuccinimide; PEGMW = 4000) to enable covalent conjugation of the Alexa Fluor 594-labeled DR5 antibody via amide bonds (NHS ester reaction chemistry). The efficiency of DR5 antibody conjugation to the NPs was confirmed by a decrease in the antibody concentration in solution after conjugation as examined by SDS-PAGE and quantified by spectrophotometry (Figure 1C). The CT-Fe2O3-NPs showed low magnetic coercivity, indicating that the NPs responded to the magnetic field in a superparamagnetic manner (Figure 1D). When examined under transmission electron microscopy (TEM), the resulting CT-Fe2O3-NPs showed a typical core–shell structure depicting the surface functionalization around the cubic-shaped core (Figure 1E).
Fenoldopam was loaded in oleyl chains surrounding the NP surface. The loading efficiency of fenoldopam and its release rate from the CT-Fe2O3-NPs were quantified independently using a standardized high-performance liquid chromatography (HPLC) approach to obtain an accurate fenoldopam profile (Figure S1H). The loading efficiency of fenoldopam was approximately 50%. Importantly, the slow, sustained release of fenoldopam reached 60–85% of the maximum release over 60 h (Figure 1F). Compared with standard dialysis (or the passive diffusion of the CT-Fe2O3-NPs), the magnetic field (CT-M-Fe2O3-NPs) significantly increased the release of fenoldopam. The Alexa Fluor 594 fluorescent dye that was preconjugated to the DR5 antibody was confirmed to retain its excitation and emission spectra, indicating the incorporation of the antibody and potential utility of the CT-Fe2O3-NPs in imaging studies (Figure S1I). We thus examined the CT-Fe2O3-NP stability in control saline, culture media, and blood plasma, monitored with DLS for 48 h prior to our in vitro and in vivo studies (Figure S1J). Under all conditions, the CT-M-Fe2O3-NPs maintained stable sizes, indicating a high colloidal stability attributable to surface functionalization (Figure S1J). Further, the biocompatibility of the CT-Fe2O3-NPs was confirmed in vitro, and no cellular apoptosis was observed (Figure S1K,L).
There are many surface molecules that have been identified in a cilium.25–27 Thus, our current work only provided a glimpse of many more future possibilities to target primary cilia, perhaps targeting cilia in a specific organ system. In our current studies, DR5 was selected as a molecular target for cilia, because we were able to authenticate the specificity of the DR5 antibody to primary cilia of vascular endothelial cells in vivo. Importantly, the DR5 antibody is also commercially available, making it accessible for other laboratories to verify our results independently.
Selectivity and Specificity of the CT-Fe2O3-NPs.
The selectivity and specificity of the CT-Fe2O3-NPs for primary cilia were evaluated in live cells under flow conditions (Figure 2A). Prior to introducing the CT-Fe2O 3-NPs to live cells, high-resolution differential interference contrast (DIC) images were used to randomly locate a cilium. The fluorescence of the CT-Fe2O3-NPs was measured in the cilium and cell body for 2 h. After approximately 1 h, the cilia surface was saturated with the fluorescent CT-Fe2O3-NPs, while the cell body showed very minimal fluorescence. The selectivity of the CT-Fe2O3-NPs for the cilia was further confirmed by iron-specific Prussian blue staining (Figure 2B) and was observed in a time-dependent manner (Movie 1).
NPs were applied to cells for 16 h to further confirm the cellular effects of the CT-Fe2O3-NPs. When NPs including all control NPs were treated to the cells, the NPs were slowly perfused with the media (Movie 1). The fluid shear from the media helped eliminate nonspecific binding of the NPs. In addition to a phosphate-buffered saline (PBS)-treated control group (vehicle), we used the CT-Fe2O3-NPs without fenoldopam (cCT-Fe2O3-NPs) and fenoldopam-alone as two independent sets of controls. Both cCT-Fe2O3-NPs and CT-Fe2O3-NPs showed specific CT delivery, but only the presence of fenoldopam significantly increased the cilia length (Figure 2C,D). Thus, fenoldopam was successfully released from the CT-Fe2O3-NPs and activated DR5 receptors. These results supported the hypothesis that the activation of dopaminergic receptors increases cilia length in embryonic fibroblasts, vascular endothelial cells, and renal epithelial cells.19,20,28 In addition to the fluorescence from the CT-Fe2O3-NPs, analyses of the ciliary marker acetylated-α-tubulin and three-dimensional images were used to obtain more precise cilia length measurements (Movie 2).
In live cells, the specificity of the CT-Fe2O3-NPs for cilia allowed application of an external magnetic field to control nonmotile cilia movement (CT-M-Fe2O3-NPs, Figure 2E and Movie 3). The significance of this approach was that nonmotile primary cilia with a “9 + 0” structure are able to be converted to motile-like cilia using nanotechnology to mimic nodal cells, the only known cells displaying a “9 + 0” ciliary structure and motility.29 According to the mathematical model, approximately 780 CT-Fe2O3-NPs attached to a single cilium, where the total energy of the cilium consists of the elastic and magnetic energy of cilium-α-Fe2O3-NPs;30 therefore, the magnetic field imposed on the cilium was sufficiently sensitive to generate magnetic forces due to the rotation of the magnetic moment of α-Fe2O3-NPs (field alignment effect) and the attraction of the magnetic moment toward the increasing magnetic field (field gradient effect) to overcome cilia bending rigidity and bend the cilia at 45° (Supplementary Data). Because the angular displacement of the magnetic field changes as a result of the motion of the external magnet, the magnetic forces along the cilia length were altered, resulting in a wave-like movement throughout the ciliary shaft. The wave-like motion generated by the oscillating magnetic field of 1.35 T on the cilium was comparable to the force of 0.1 pN needed to bend a cilium, providing a theoretical basis for a strong interaction between the CT-Fe2O3-NPs and cilia. We thus postulated that a magnetic force of 0.1 pN could facilitate fenoldopam release upon magnetic stimulation through the field alignment and gradient effects.
Effects of the CT-Fe2O3-NPs in Magnetic- and Flow-Induced Cilia Bending on Intracellular Ca2+ Signaling.
Primary cilia function has been primarily examined by monitoring fluxes in cytosolic Ca2+ concentrations. Therefore, the cytosolic Ca2+ indicator Fura-2AM was used to differentiate cilia function by fluid-flow perfusion and magnetic-field induction. Cilia acting as sensory antennae in the cells is dependent upon the length of the cilia. As the length of a cilium (antenna) increases, the cell becomes more sensitive for cellular sensing.19,20 Shear-stress was thus reduced from 1.0 to 0.5 dyn/cm2 to magnify changes in sensitivity in terms of Ca2+ signaling in control cells compared with that in the CT-Fe2O3-NP-treated cells. As expected, fluid-flow shear-stress induced an increase in the cytosolic Ca2+ concentration (Figure S2A,B). The application of a magnetic field also increased the cytosolic Ca2+ concentration. Whereas the fluid flow (CT-Fe2O3-NPs) and magnetic field (CT-M-Fe2O3-NPs) resulted in increased cytosolic Ca2+ concentrations, their cytosolic Ca2+ profiles were not the same. Sustained increases in cytosolic Ca2+ concentrations were observed in magnet-treated cells, whereas a brief increase in the cytosolic Ca2+ concentration was observed in flow-treated cells. The function of primary cilia is also associated with nitric oxide (NO) production.4 The deflection of primary cilia with the magnetic field was sufficient to evoke a sustained release of NO (Figure S2C,D). On the other hand, shear-stress induced only a burst of NO release, suggesting that the CT-M-Fe2O3-NPs induced more pronounced NO production than the CT-Fe2O3-NPs. The significance of these differences will be evaluated in the subsequent in vivo studies.
In addition to cytosolic Ca2+ and NO, the presence of intraciliary Ca2+ signaling has been used to assess the mechanosensing function of primary cilia.31–34 We used the ciliary Ca2+ reporter 5HT6-mCherry-G-GECO1.0 in a single-cell–single-cilium setup to examine the potential effects of the CT-Fe2O3-NPs on ciliary Ca2+ signaling. The CT-Fe2O3-NPs were not tagged with fluorescence markers in these studies to avoid fluorescence interference. The Ca2+ reporter was distributed homogeneously throughout the cell, including the cilium. The application of a magnetic field produced significant cilium bending and a sustained increase in Ca2+ signaling in both the cilioplasm and cytoplasm in the CT-M-Fe2O3-NP-treated cells compared to those in the control cCT-M-Fe2O3-NP-treated cells (Figure 2F–H). On the other hand, the CT Fe2O3-NPs and their corresponding controls, including fenoldopam-alone, induced less of an increase in the intraciliary Ca2+ signaling (Figures S3–S6A and Movies 4, 5, 6, 7, 8, and 9). Whereas the mCherry signal is commonly used to indicate a signal artifact of the 5HT6-mCherry-G-GECO1.0 reporter, kymograph analyses were also performed to confirm that the calculated GFP/mCherry signal did not contain a green fluorescent protein (GFP) artifact or noise independent from mCherry (Figures 2I and S6B). A single trace from a cilium indicated that the speed and acceleration of the Ca2+ signal or GFP/mCherry signals peaked when the cilium was fully bent. Changes in the speed and acceleration of the Ca2+ signal were required for changes in the intensity of the GFP/mCherry signals (Figure S6C). This finding indicated that the observed Ca2+ signals were not a movement artifact, because a movement artifact would not require the speed and acceleration of the signal to dictate changes in the signal intensity. Importantly, the CT-M-Fe2O3-NP-treated groups showed an increased intracellular Ca2+ flux compared with the other groups.
Many signaling molecules have been localized in the intraciliary compartment or cilioplasm. The Ca2+ signaling can also occur within cilioplasm, but this idea has remained controversial. While studies from independent laboratories have indicated that Ca2+ signaling occurs in the cilia,31–34 another study has shown that cilia bending by fluid shear does not involve intraciliary Ca2+ changes.35 In our present studies, we thus explored if cilia bending with fluid shear-stress and magnetic field could induce intraciliary Ca2+ increase. Because many cilia are short with lengths about 4.5 ± 0.2 μm, we pharmacologically increased the size of cilia to 20.9 ± 0.5 μm. Because empty magnification in image quantification is known to produce signal artifact,36 the 4-fold increase in cilia length allowed us to study intraciliary Ca2+ to avoid unnecessary empty magnification during data extraction and analysis. Whereas the idea of primary cilia as Ca2+ signaling compartments is debatable, it has been known for decades that fluid shear-stress can induce cytosolic Ca2+ increase.37,38 We thus studied both cilioplasmic and cytosolic Ca2+ concurrently within a single cell, using cytosolic Ca2+ as the internal control. We observed that cilia bending with either fluid-flow or magnetic field always increased both cilioplasmic and cytosolic Ca2+. Increase in Ca2+ was never observed to occur only in cytosol or only in cilium. Our validations with the mCherry signal and more advanced kymograph analysis indicated that no signal artifact was detected during the measurement. Though our data suggested that a cilium could function as a Ca2+ signaling compartment, we also believe that a cilium can serve as a much more complex signaling compartment discrete from the cell body.39
Mechanociliary Signaling of the CT-Fe2O3-NPs.
The importance of mechanociliary function was examined by monitoring intracellular cyclic guanosine monophosphate (cGMP) levels to better understand the downstream signaling mechanism of NO. It was evidenced that the CT-Fe2O3-NPs played a significant role in the Ca2+/NO signaling pathway (Figure 3A). Because NO synthase (NOS) was expressed at similar levels in different treatments (Figure 3B), the effects of the NPs subjected to fluid flow (CT-Fe2O3-NPs) and the magnetic field (CT-M-Fe2O3-NPs) on cGMP-dependent kinase (PKG) and mitogen-activated protein kinase (MAPK) activity were examined (Figure 3C,D). Mechanical cilia activation through flow or chemical cilia activation by the CT-Fe2O3-NPs or fenoldopam-only increased ERK phosphorylation. Inhibition of PKG with Rp-8pCPT-cGMP reduced the flow-induced effect of NPs on ERK phosphorylation. Inhibition of PKG had little effect on ERK phosphorylation under static conditions, indicating that a cGMP-independent pathway might be involved in the chemosensory function of cilia and the increased cilia length. For example, increases in cilia length may depend on both cyclic nucleotide and ERK phosphorylation.40,41 Nonetheless, the most pronounced effects of NPs were observed when cells were challenged with fluid flow or a magnetic field (Figure 3C,D). Whereas these studies were performed in a cell line, a validation study using isolated primary endothelia also produced a similar result (Figure S7). Therefore, the CT-Fe2O3-NPs (containing fenoldopam) were involved in intracellular Ca2+ signaling and NO synthesis, which further regulated MAPK activity through cGMP and PKG (Figure 3E).
Figure 3.
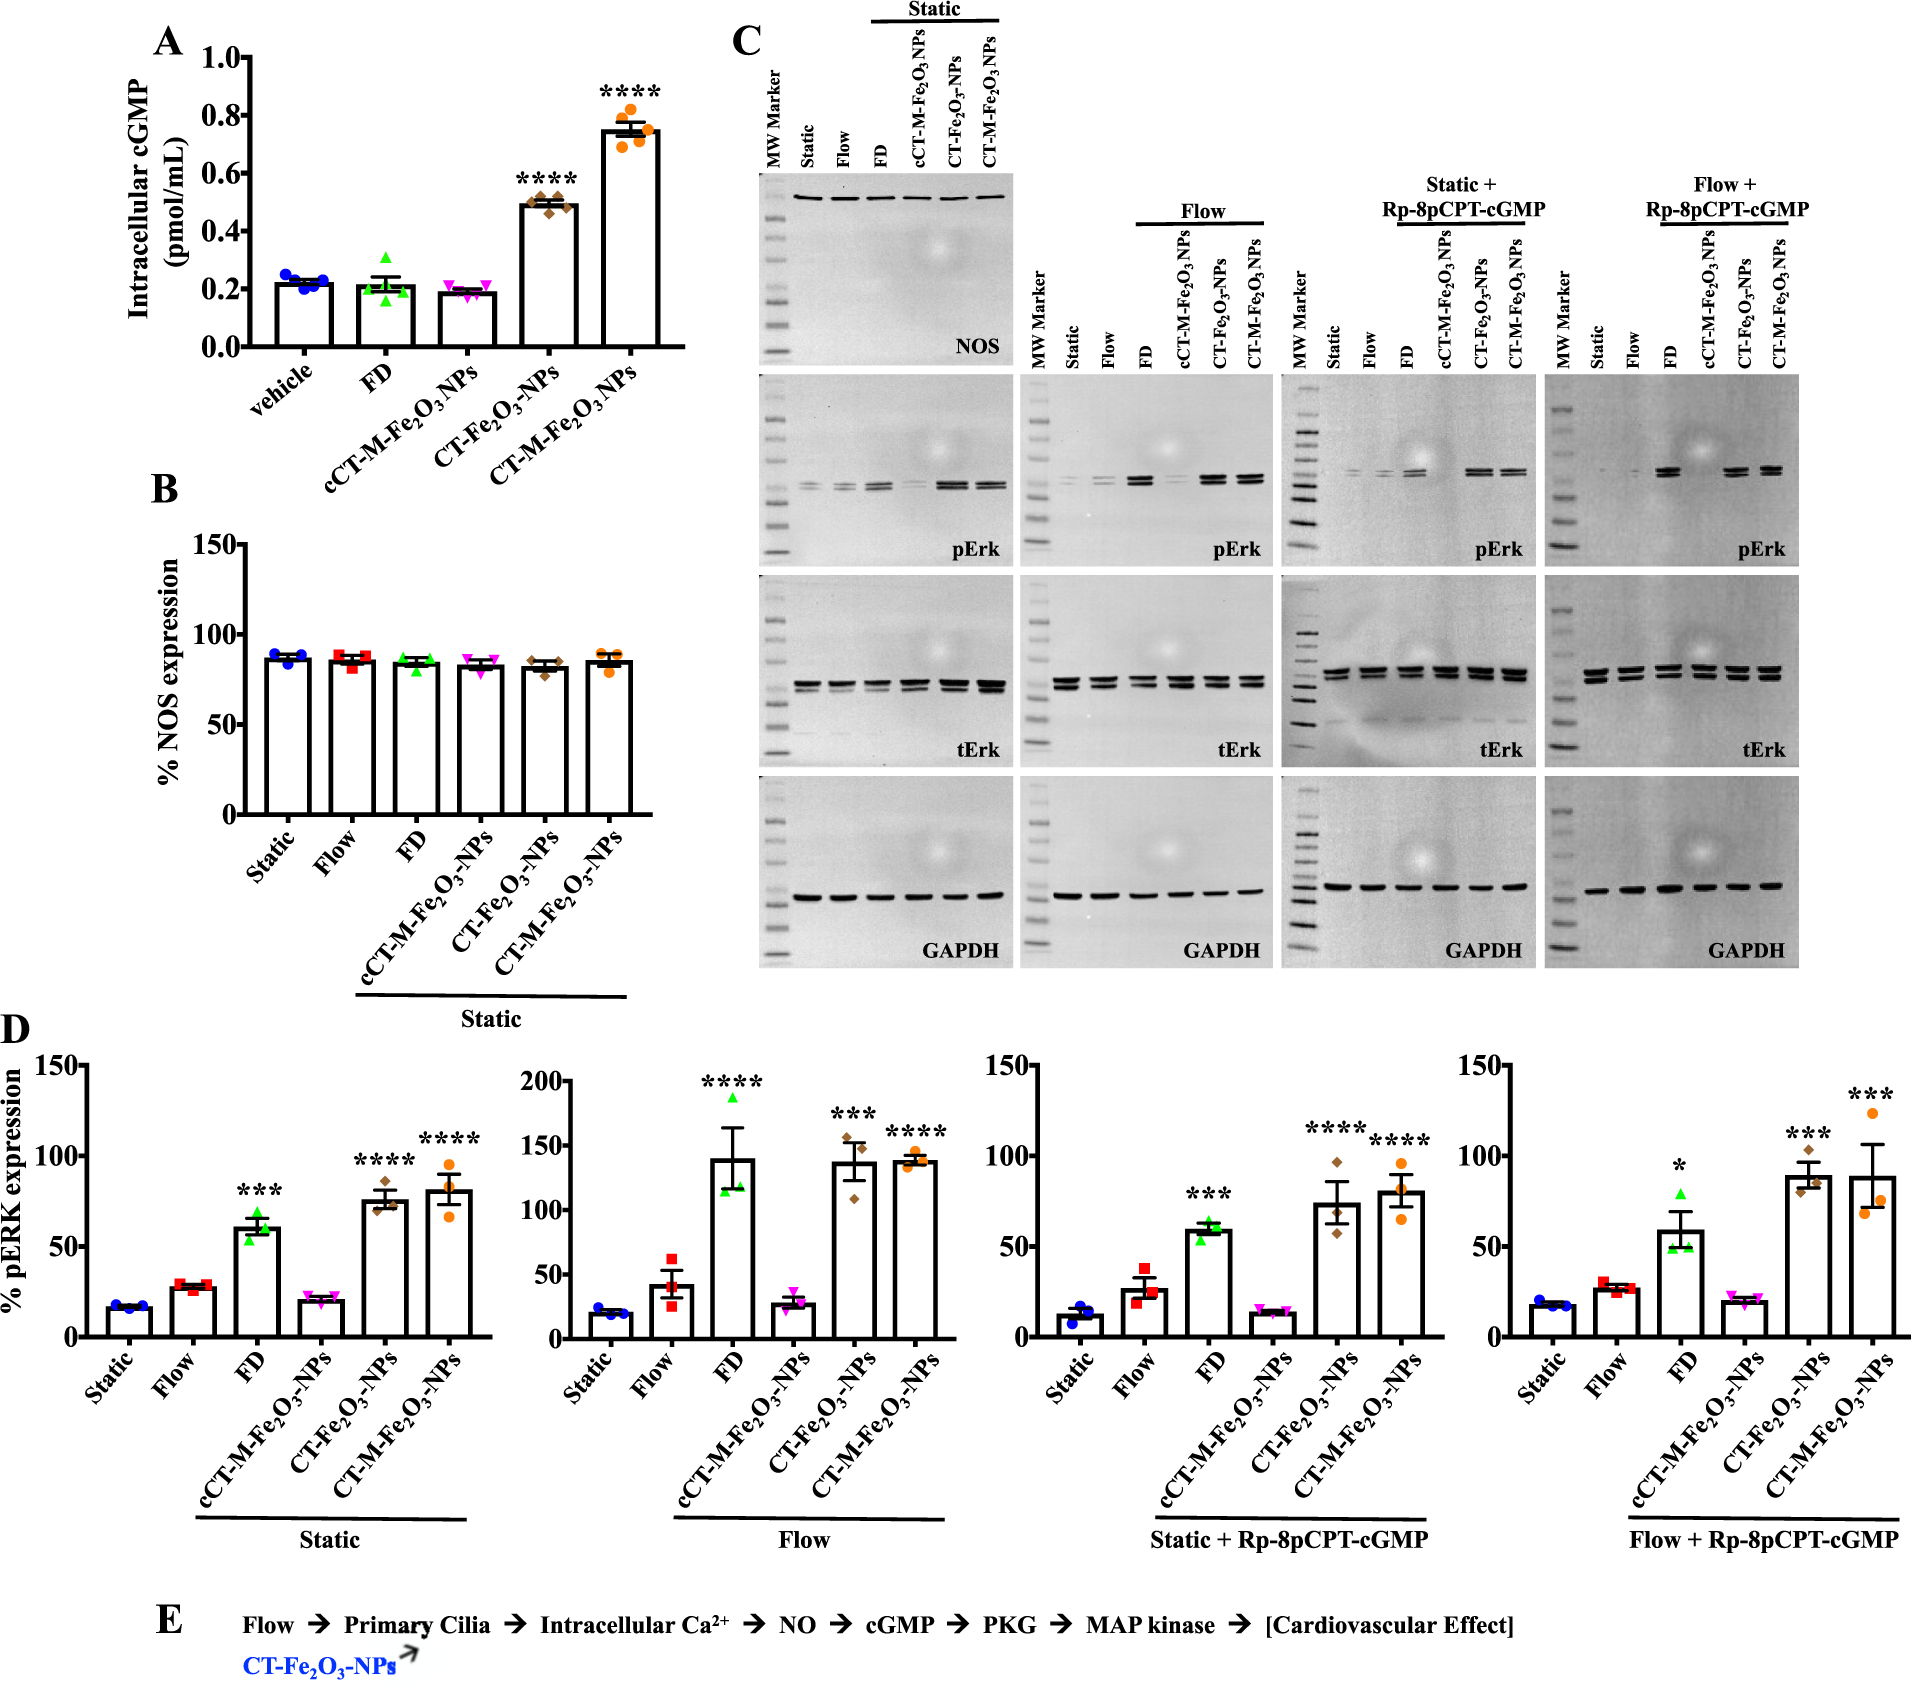
Measurements of cGMP and phosphorylated ERK levels. (A) Intracellular cGMP levels were quantified in cells treated with PBS (vehicle), fenoldopam, and different types of CT-NPs. (B) Percent expression of NOS under static and flow conditions. (C) Representative immunoblots of cell lysates collected before (static) and after fluid shear-stress (flow) in the absence or presence of the PKG inhibitor Rp-8pCPT-cGMP. (D) Immunoblot data for p-ERK are shown in dot-plotted bar graphs. (E) Schematic showing the proposed signaling pathway. N = 4 samples per group in each study; *, p < 0.05; **, p < 0.01; ***, p < 0.001; and ****, p < 0.0001 compared with the control (static) group.
Although the transition zone (Y-shaped linkers) at the base of cilium prevents protein entering and exiting the cilium freely,42,43 the discrete signal transduction in the cell body and cilium may regulate signaling of one another.44–48 This is especially easy to understand if the second messenger involved nitric oxide (NO), a gas that can easily permeate into other cellular compartments and surrounding cells. Our data show that the fenoldopam-alone or CT-Fe2O3-NPs could enhance the NO-cAMP-PKG-ERK pathway in the presence of fluid flow in the cell line and primary cultured cells. Importantly, shear-stress-induced NO biosynthesis is an important mechanism to reduce blood pressure via the vasodilation effect.49,50
Efficacy of the CT-Fe2O3-NPs in a Pkd2 Ciliopathy Zebrafish Model.
Because the PKG and MAPK signaling pathways have been independently implicated in cardiovascular function,51,52 the CT-Fe2O3-NPs were tested for their effectiveness in vivo. Pkd2 zebrafish were used as a ciliopathy model, because their phenotypes, including the curly tail and cystic kidney phenotypes, have been well characterized.53,54 The CT-Fe2O3-NPs significantly rescued the curly tail (Figure 4A,B) and kidney phenotypes (Figure S8A). Application of the CT-M-Fe2O3-NPs provided no further apparent improvement compared with that of the CT-Fe2O3-NPs. The curly tail phenotype might be an indication of abnormal osteogenesis,55 probably because of limited blood flow to the tail. We measured the blood vessel diameters to investigate this possibility. The significantly smaller diameter observed in Pkd2 fish might be attributed to vasoconstriction, which was improved by the CT-Fe2O3-NPs (Figure 4C and Movie 10).The CT-M-Fe2O3-NPs did not provide a further improvement in vessel diameter. Blood flow was also examined in the blood vessels located in the dorsal region of the main artery within the medial-posterior lateral trunk. The speed and changes in speed (acceleration) of individual blood cells were significantly decreased in Pkd2 fish compared with those in control fish (Figure 4D,E and Movie 10). The CT-Fe2O3-NPs improved blood flow, and the CT-M-Fe2O3-NP-treated fish showed a further enhancement in blood flow that was similar to that of the normal control fish.
Figure 4.
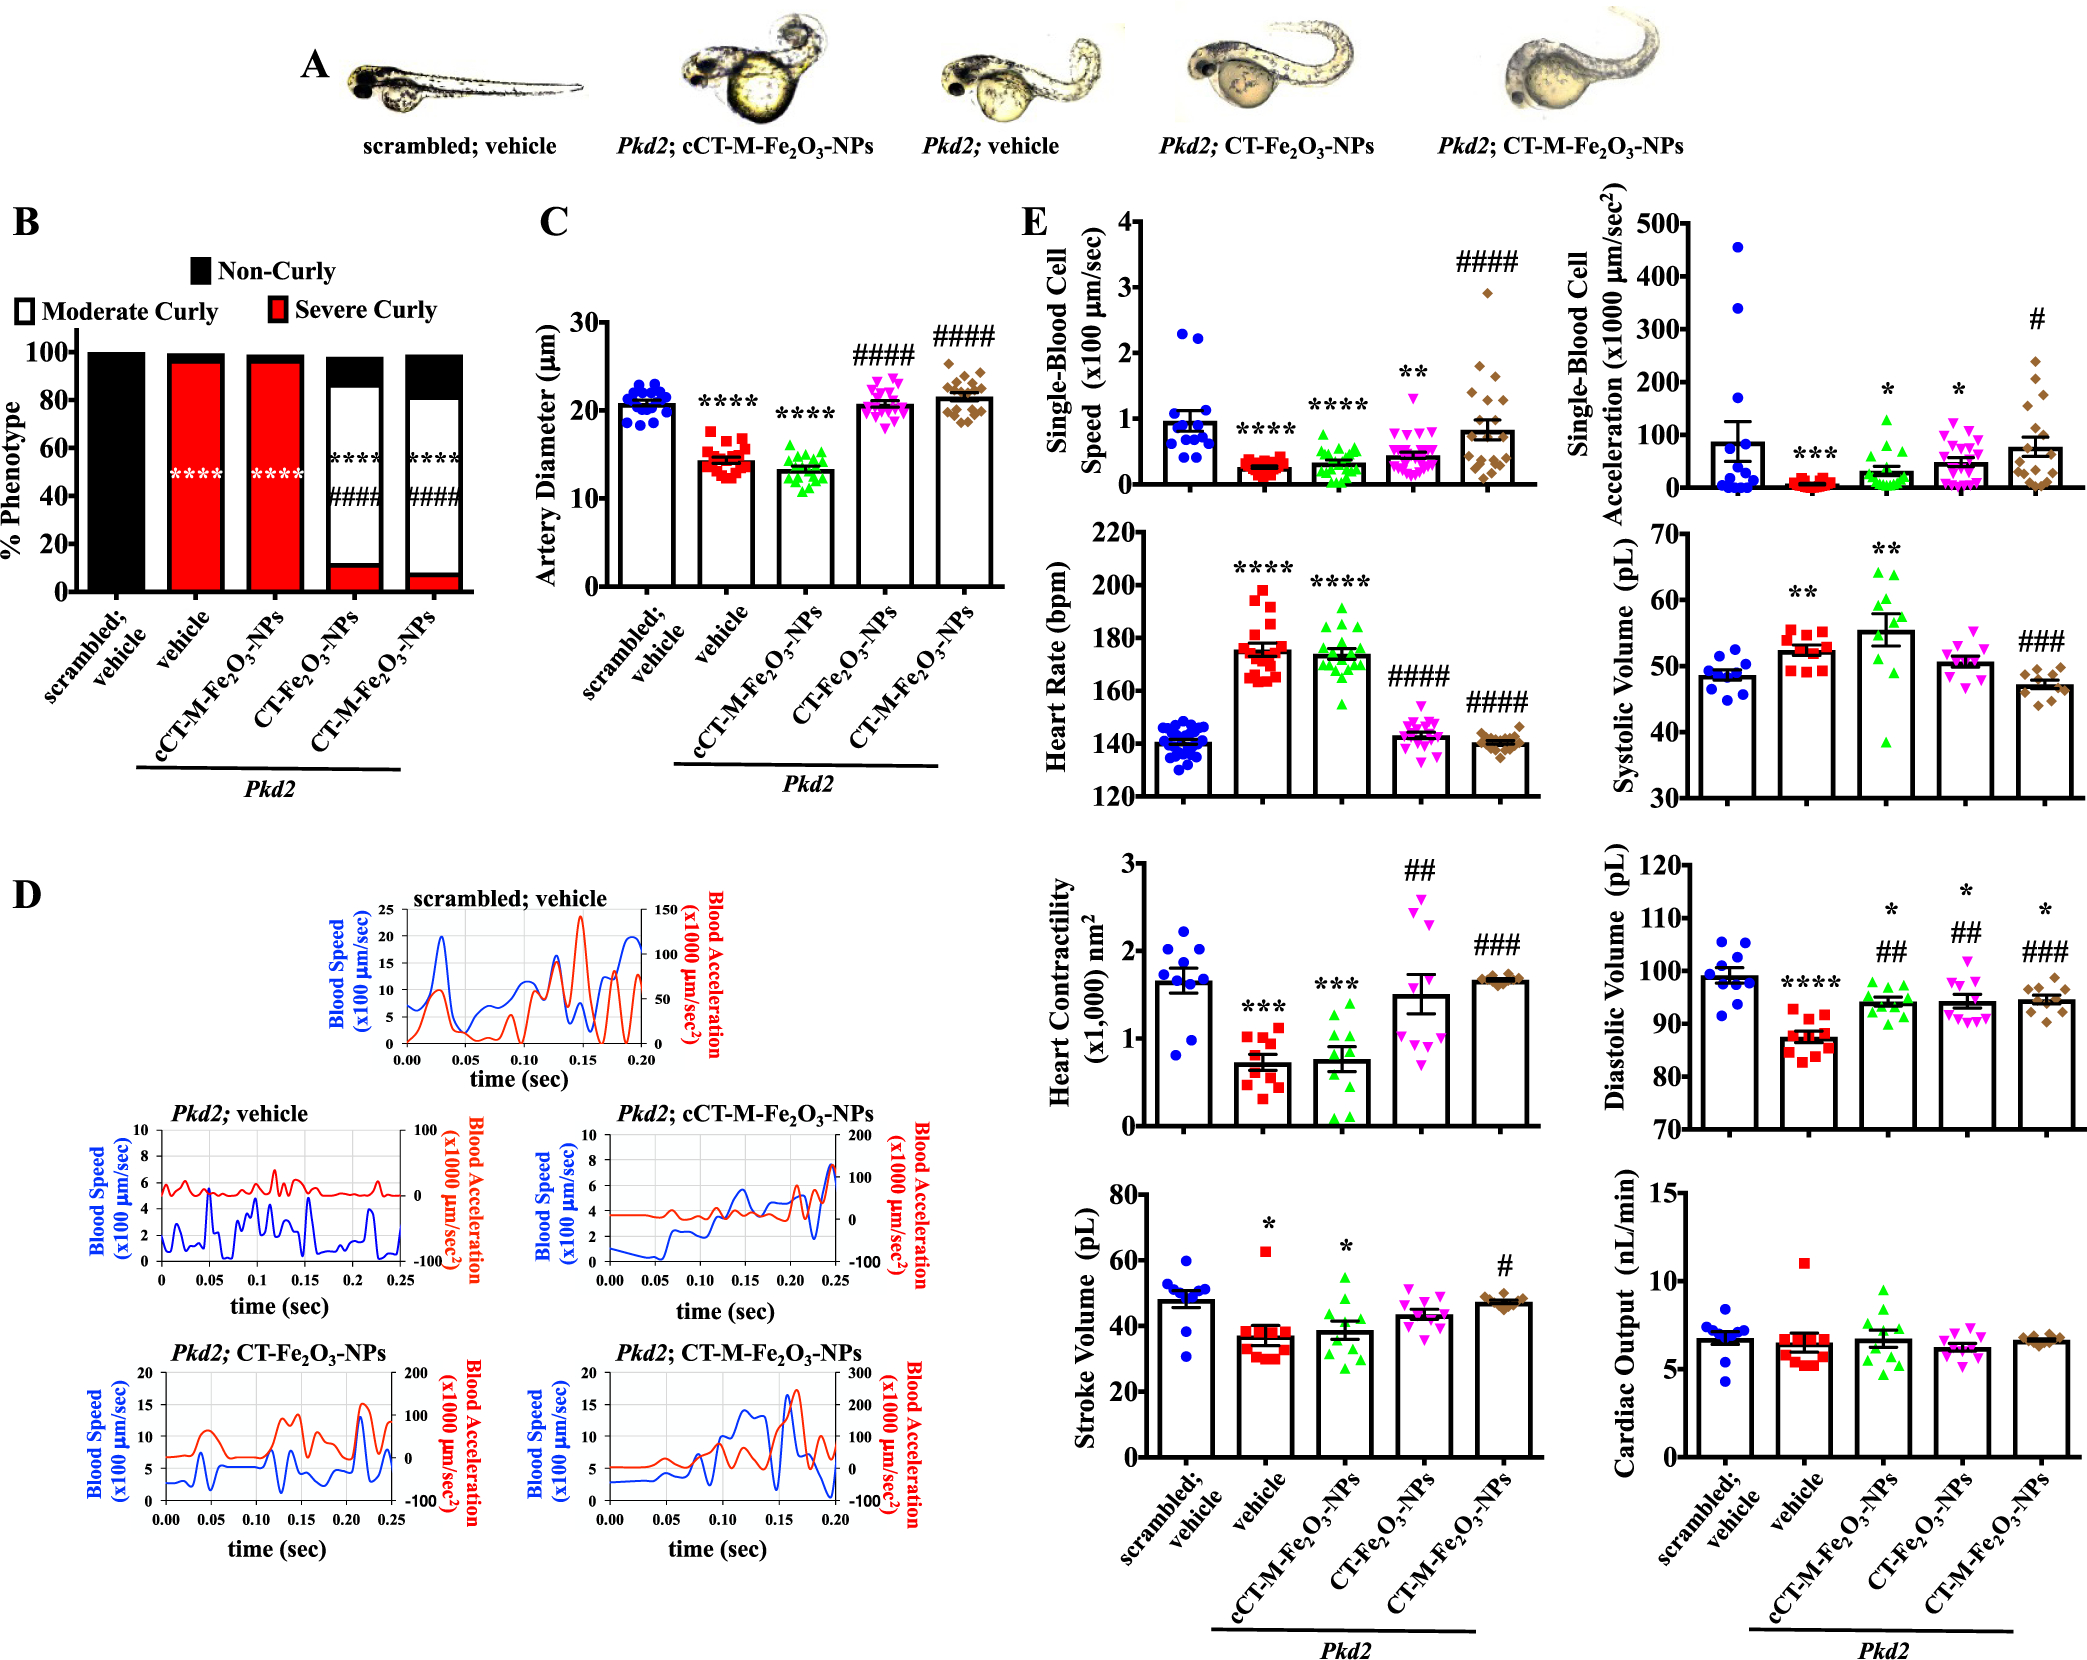
CT-M-Fe2O3-NPs as therapeutic delivery agents in Pkd2 zebrafish. (A) Photographs of zebrafish at 48 h postfertilization (hpf) are shown for control (scrambled morpholino) and Pkd2 morphants exposed to PBS (vehicle), cCT-M-Fe2O3-NPs, CT-Fe2O3-NPs, or CT-M-Fe2O3-NPs. (B) The bar graph shows the percentage of zebrafish with the curly tail phenotype. (C) The quantitation of the artery diameters shown in the dot-plotted bar graph was used as an arterial reactivity index. (D) Representative line graphs show single-blood-cell speed and acceleration parameters from the dorsal region of the main artery within the medial-posterior lateral trunk. Representative recordings of single-blood-cell tracking and speed are also shown in Movie 10. (E) Quantitation of blood flow characteristics and cardiac parameters are shown in the dot-plotted bar graphs to examine cardiovascular functions. Representative images of the heart rate and contractility are also shown in Movie 11. N = 10–50 fish per group in each study; *, p < 0.05; **, p < 0.01; ***, p < 0.001; and ****, p < 0.0001 compared with the scrambled zebrafish. #, p < 0.05; ##, p < 0.01; ###, p < 0.001; and ####, p < 0.0001 compared with the Pkd2 morphants.
Improvements in blood flow are usually determined by not only the blood vessel functions but also cardiac functions. We thus examined cardiac functions (Movie 11). A significant decrease in cardiac contractility and stroke volume was observed in Pkd2 fish, although the overall cardiac output was not changed (Figure 4E). This result was very likely because of an increase in heart rate, resulting in an increase in systolic volume per beat. The CT-Fe2O3-NPs corrected all the cardiac function parameters, which might have contributed to the less severe curly tail phenotype in the Pkd2 zebrafish. Similar to cell culture in vitro, the CT-Fe2O3-NPs specifically targeted primary cilia and effectively lengthened primary cilia in vivo. Cilia length was measured in vascular and cardiac cells (Figures S8B,C). Shorter cilia were consistently observed in cells of the Pkd2 artery, vein, and cardiac tissue. The CT-Fe2O3-NPs significantly lengthened the cilia in the blood vessels and heart. The application of a magnetic field to CT-Fe2O3-NP-treated fish did not result in any further effect on cilia length.
Effects of the CT-Fe2O3-NPs in Targeting Primary Cilia in a Pkd2 Mouse Model.
To validate the zebrafish results, we further investigated the effect of the CT-Fe2O3-NPs in targeting primary cilia by injecting them intravenously in the tail of an endothelial-specific Pkd2 mouse model for 8 weeks (Figure 5A; Tie2Cre•Pkd2flox/flox). Because the CT-Fe2O3-NPs increased NO production in cultured cells in vitro, we also evaluated plasma nitrate/nitrite in a mouse ciliopathy model in vivo. Similar to patients with polycystic kidney disease (PKD),11,12 the plasma nitrate/nitrite level was decreased in the Pkd2 mice. The nitrate/nitrite level returned to normal in mice treated with the CT-Fe2O3-NPs (Figure 5B). The blood urea nitrogen level was also corrected by the CT-Fe2O3-NPs (Figure 5B). Similar to the endothelial-specific Pkd1 mice,6 elevated systolic and mean arterial pressures were observed in Pkd2 mice. The CT-Fe2O3-NPs significantly decreased the blood pressure of Pkd2 mice (Figure 5C). The CT-M-Fe2O3-NPs decreased blood pressure further, and it became comparable to that of the normal wild-type mice. The administration of fenoldopam-alone once every 3 days (a similar dosing regimen was used for the CT-Fe2O3-NPs) did not result in an overall decrease in systemic blood pressure.
Figure 5.
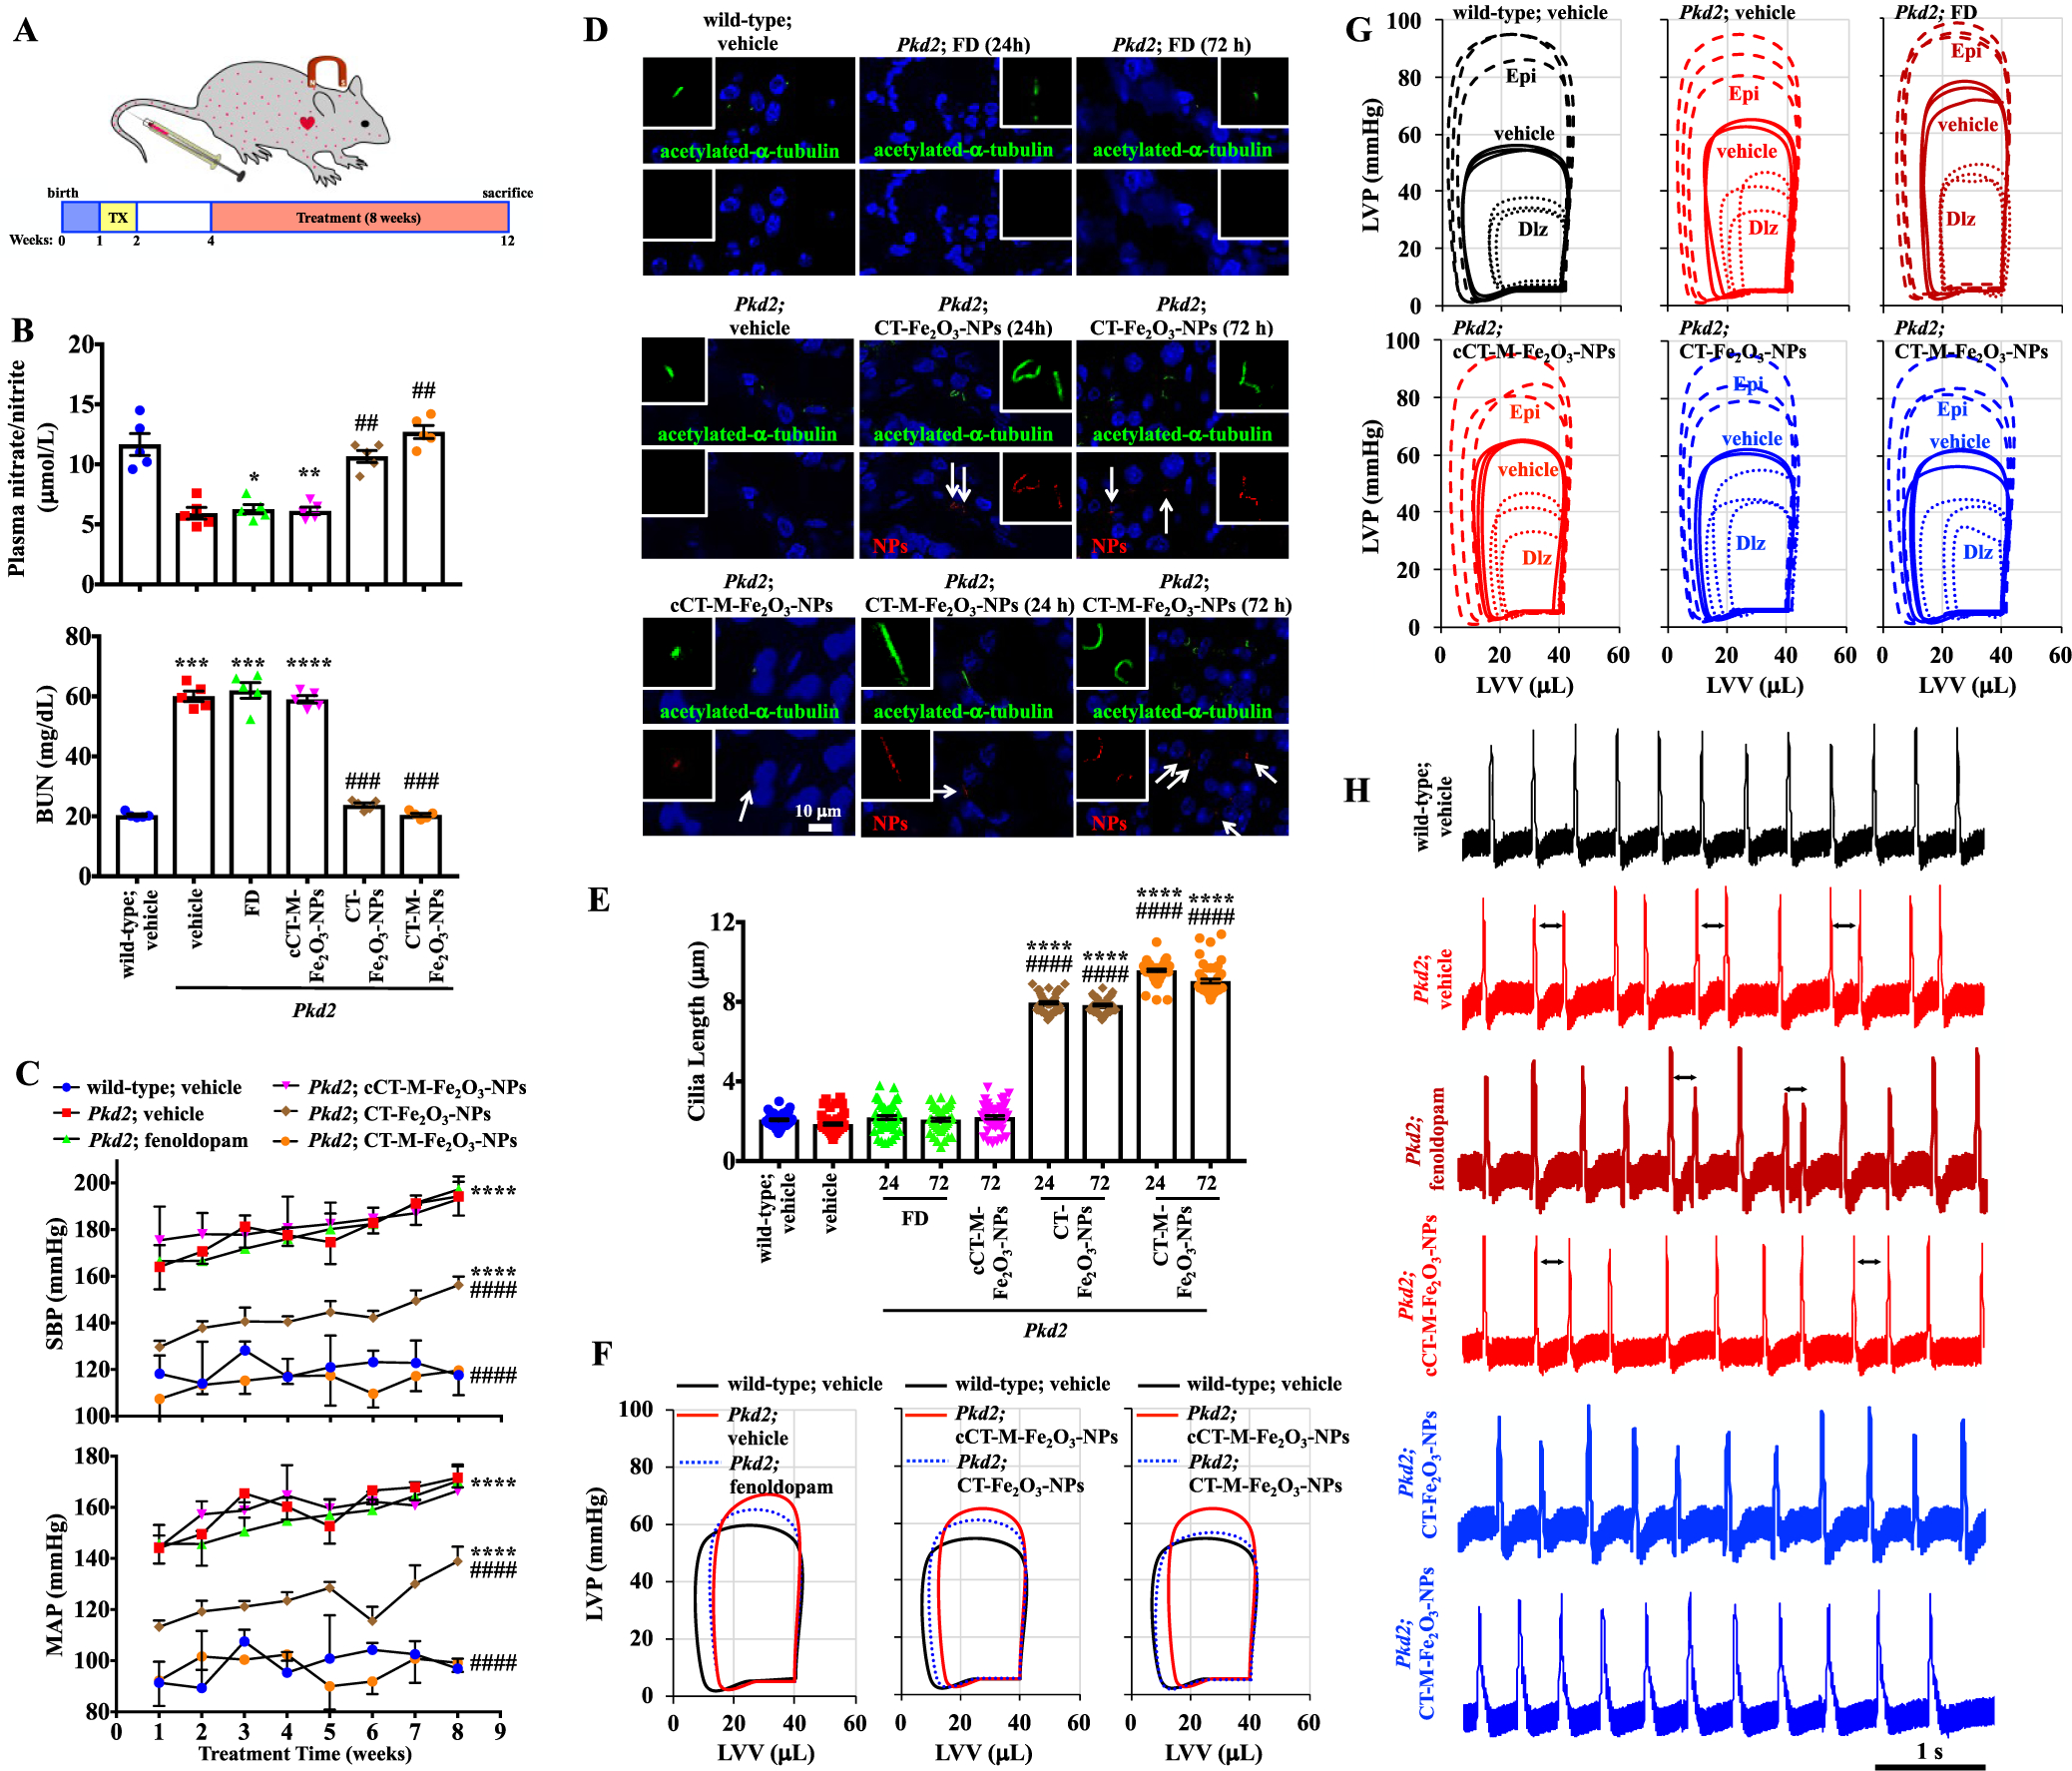
CT-M-Fe2O3-NPs as a therapeutic delivery system in Tie2Cre•Pkd2flox/flox mice. (A) Schematic showing the timeline of the study using the endothelial-specific Pkd2 mutant. Cre recombination was activated at 1 week of age via daily intraperitoneal tamoxifen (TX) injections for five consecutive days. At 4 weeks of age, wild-type (Pkd2flox without Cre activation) and Pkd2 mice (Pkd2flox with Cre activation) were treated with the cCT-M-Fe2O3-NPs, CT-Fe2O3-NPs, or CT-M-Fe2O3-NPs. Therapeutic delivery systems were administered intravenously, and mice were sacrificed 8 weeks later (at 12 weeks of age), unless indicated otherwise. (B) At the end point of the study, blood was collected; plasma nitrate/nitrite and blood urea nitrogen (BUN) levels are presented in the dot-plotted bar graphs. (C) Blood pressure was measured at the end of each week for 8 consecutive weeks. Systolic blood pressure (SBP) and mean arterial pressure (MAP) are shown in the line graphs. (D) Representative immunofluorescence images of primary cilia from vascular endothelial cells showing red fluorescent NPs (arrows) and cilia lengths at 24 or 72 h after the initial treatment. The insets show magnified views of cilia. (E) Cilia lengths are shown in the dot-plotted bar graphs (N = 50; a minimum of 10 measurements were recorded for each mouse). (F) Representative loop diagrams showing the left ventricular volume (LVV) and pressure (LVP) relationship. (G) LVV and LVP relationships are shown in the absence (PBS or vehicle) and presence of stressors. Stress was achieved with either epinephrine (Epi; 4 μg/L for each mg of heart) or diltiazem (Dlz; 0.08 μg/L for each mg of heart). (H) Representative electrocardiogram (ECG) traces of the hearts over a 5 s duration. Arrows indicate uneven heart rhythms. N = 5 mice per group in each study, except for working heart studies (N = 3 mice per group). For all immunofluorescence studies, green represents acetylated-α-tubulin (cilia marker), red represents NPs, and blue represents DAPI (nucleus); *, p < 0.05; **, p < 0.01; ***, p < 0.001; and ****, p < 0.0001 compared with the wild-type mice. #, p < 0.05; ##, p < 0.01; ###, p < 0.001; and ####, p < 0.0001 compared with the Pkd2 mice.
The in vivo cilia specificity of the CT-Fe2O3-NPs was examined in isolated femoral arteries (Figure 5D). The localization of the CT-Fe2O3-NPs in the vascular endothelium was confirmed at 24 and 72 h after the injections. Cilia length was significantly increased in mice treated with the CT-Fe2O3-NPs or CT-M-Fe2O3-NPs but not in mice that received a 30 min infusion of fenoldopam (Figure 5E). However, a continuous infusion of fenoldopam for 5 days increased the cilia length.11 At the end of the 8 week blood pressure studies, heart function was examined using an ex vivo isolated heart perfusion system to generate volume–pressure loops (Figure 5F and Movie 12). This approach was required to separate the effect of neuronal regulation observed in zebrafish studies. The Pkd2 hearts displayed hypertrophy with compromised functions in left ventricle pressure, stroke volume, ejection fraction, and overall cardiac output, probably because of prolonged hypertension (Table S1). Although the CT-Fe2O3-NPs significantly improved cardiac function in the Pkd2 mice, the CT-M-Fe2O3-NPs further improved heart function to a level comparable to that in the control wild-type mice (Figure 5F). The hearts were also challenged with the pharmacological agents epinephrine and diltiazem to produce high and low contractile stresses, respectively, to evaluate the potential presence of more substantial abnormalities (Figure 5G). However, all hearts responded well to these stressors (Tables S1–S3). Importantly, when brought back to a normal heart rate, the Pkd2 mice exhibited a tendency toward arrhythmia, which was corrected by the CT-Fe2O3-NPs or CT-M-Fe2O3-NPs (Figure 5H).
Consistent with the results of the functional studies, the Pkd2 mice were characterized by left ventricular hypertrophy, as indicated by an examination of consecutive heart sections stained with hematoxylin and eosin (H&E) and Masson’s trichrome (Figure 6A). Masson’s trichrome staining also revealed cardiac fibrosis and myocyte enlargement. These characteristics, particularly cardiac fibrosis, were most apparent at the midsection of the cross-sectional cardiac anatomy (Figure 6B,C). The CT-Fe2O3-NPs and CT-M-Fe2O3-NPs reduced cardiac hypertrophy and fibrosis in the Pkd2 mice (Figure 6D). On the basis of different anatomical measurements, the CT-Fe2O3-NPs consistently improved the heart size and thickness of the heart wall. The use of the CT-M-Fe2O3-NPs in Pkd2 mice further improved the heart phenotype, and it became comparable to that in the control wild-type mice. Primary cilia are present in the heart and play an important role in heart diseases.56 Myocyte cilia were thus measured to further investigate the roles of the CT-Fe2O3-NPs (Figure 6E). The CT-Fe2O3-NPs increased the cilia length in the Pkd2 mice, and the CT-M-Fe2O3-NPs did not further lengthen the primary cilia in the heart (Figure 6F).
Figure 6.
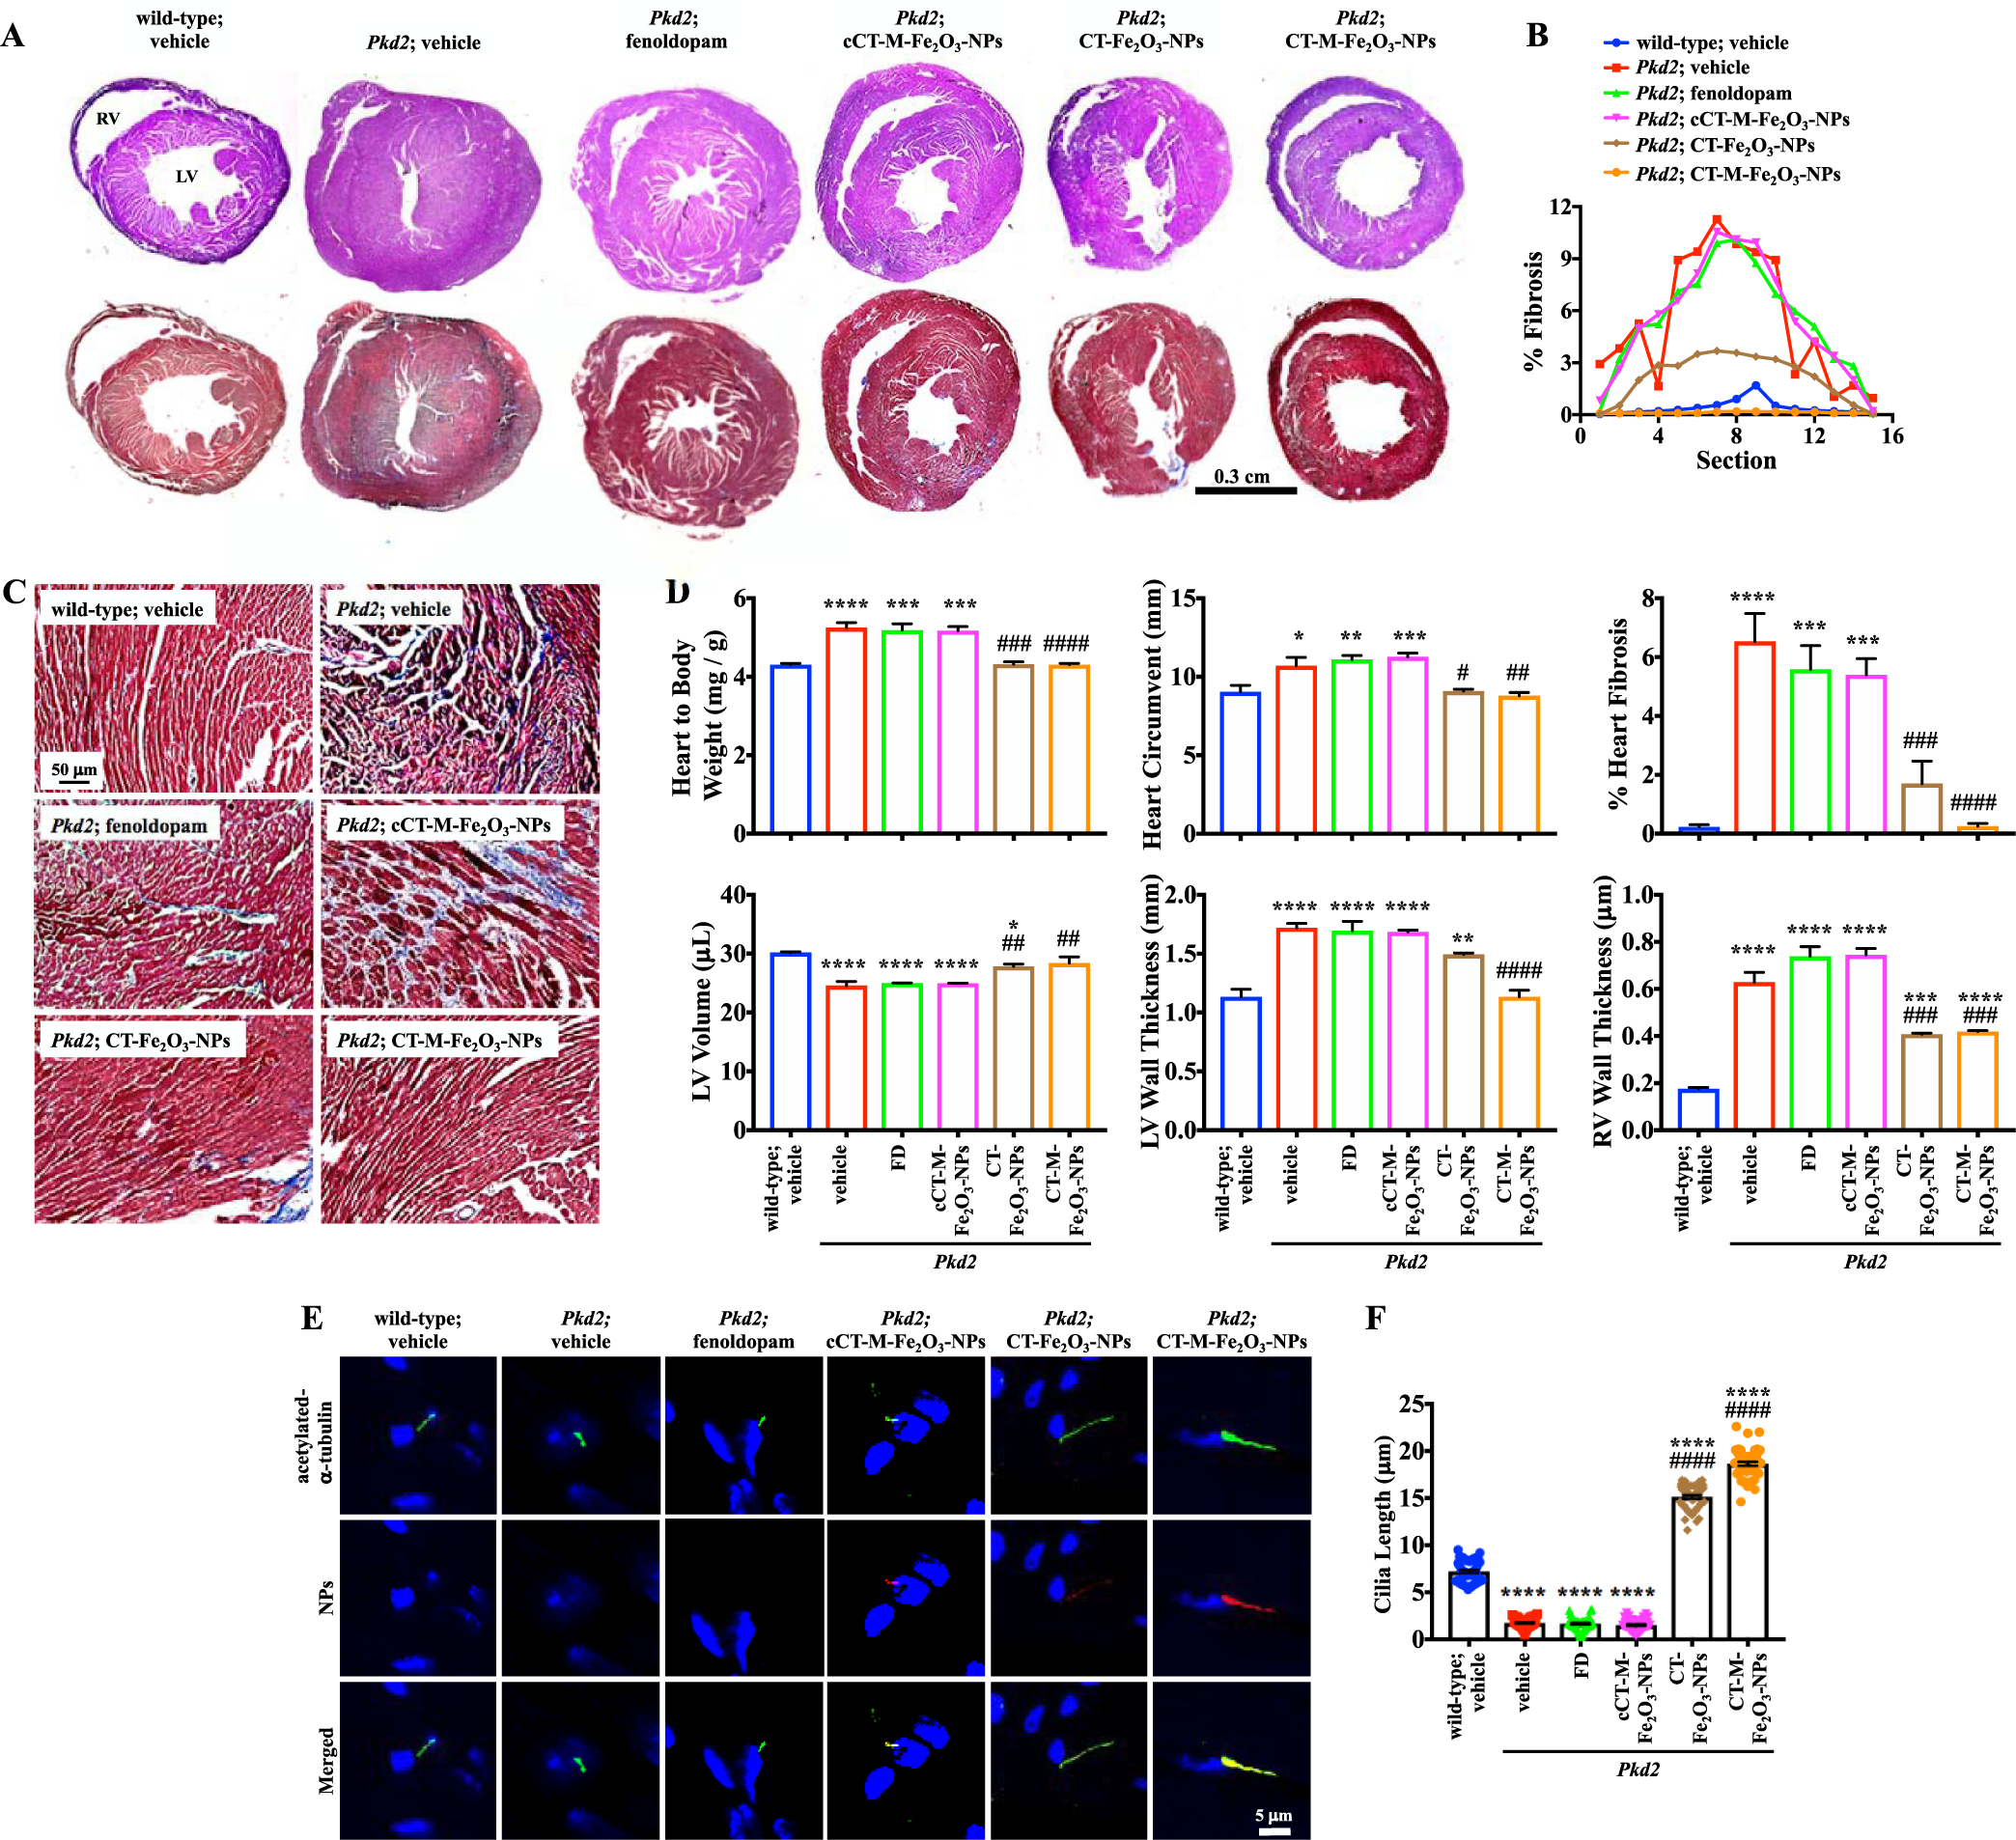
CT-Fe2O3-NPs increase the cilia length in Tie2Cre•Pkd2flox/flox mice and improve hypertrophy. (A) Sequential cross-sections of the same heart were used for H&E (top panel) and Masson’s trichrome (bottom panel) staining. With the exception of the muscle size, explicit differences in the morphology of the tissue were not observed using H&E staining. Fibrosis was evident in Masson’s trichrome-stained sections. RV = right ventricle; LV = left ventricle. (B) In the analyses of the sequential sections, the percent fibrosis was calculated from the fibrotic area per total cross-sectional area. (C) Masson’s trichrome staining of the left ventricle shows myocytes in red and collagenous fibrotic tissue in blue. (D) Heart parameters were calculated to determine changes in the physical characteristics of the hearts. (E) Localization of the NPs and length of cilia in myocytes were examined. (F) Cilia length is presented in the dot-plotted bar graphs. For all immunofluorescence studies, green represents acetylated-α-tubulin (cilia marker), red represents NPs, and blue represents DAPI (nucleus); N = 5 mice per group in each study, except for working heart studies (N = 3 mice per group); *, p < 0.05; **, p < 0.01; ***, p < 0.001; and ****, p < 0.0001 compared with the wild-type mice. #, p < 0.05; ##, p < 0.01; ###, p < 0.001; and ####, p < 0.0001 compared with the Pkd2 mice.
Fluorescence readings were quantified in the heart, kidneys, liver, spleen, and lungs at 24 and 72 h postinjection to examine the in vivo distribution of the CT-Fe2O3-NPs (Figure S9A). The CT-Fe2O3-NPs were distributed throughout these organs. The liver, a metabolic and disposition organ, had relatively higher concentrations of the CT-Fe2O3-NPs, particularly within the first 24 h. All organs were further screened by histopathology and showed no apparent toxicity resulting from the CT-Fe2O3-NPs (Figure S9B). Separate hemanalyses and biochemistry studies on cellular biomarkers also did not indicate toxicity of the CT-M-Fe2O3-NPs in the liver, kidney, spleen, and other tissues (Table S7). Although apparent morphological abnormalities were not observed in the liver, spleen, or lung tissues, cysts formed in the kidneys, and hypertrophy in the heart was observed. Whereas isolated cysts were much smaller in mice subjected to the CT-Fe2O3-NPs, evidence of tubular sclerosis was detected in the Pkd2 kidneys (Figure S9B). The cardiac and renal abnormalities might have resulted from prolonged hypertension.16
Fenoldopam was used as an experimental agent in the present study because of its therapeutic potential; unfortunately, clinical use of fenoldopam is limited by its short-acting, nonselective activity and reflex tachycardia. With this cilia-targeted system, we were able to encapsulate and deliver fenoldopam to cilia more precisely and effectively. On the basis of the findings from these studies, a ciliopathy treatment should not depend on generating drugs if existing drugs are able to be specifically targeted to cilia for achieving the maximum therapeutic outcome with no side effects. The cilia-targeted delivery system is an attractive means of achieving more targeted delivery of many other therapeutic pharmacological agents to treat various ciliopathies.
Validation of Fenoldopam-Only and CT-Fe2O3-NPs on Cilia Specificity.
The infusion of fenoldopam-alone once every 3 days did not result in apparent changes in weekly analyzed blood pressure. To confirm that the fenoldopam was properly administered, we measured blood pressure for an hour after fenoldopam infusion (Figure 7A). Whereas fenoldopam-alone decreased blood pressure, its affect only lasted for approximately 1 h. Unlike the CT-Fe2O3-NPs or CT-M-Fe2O3-NPs, fenoldopam-alone caused an immediate decrease in blood pressure, followed by reflex tachycardia. This observation was consistent with the short-acting property of fenoldopam.57,58 We also observed an increased in heart rate following fenoldopam-only injection. We speculated that the rebound in blood pressure and reflex tachycardia contributed to fenoldopam-induced mortality in hypertensive Pkd2 mice (Figure 7B). On the basis of the pharmacological profiles obtained from fenoldopam- and CT-M-Fe2O3-NPs-treated mice, both fenoldopam and the NPs remained in the circulatory system during the infusion (Figures 7C,D). Together with the reflex tachycardia, our results reinforced the broad spectrum of fenoldopam effects in the cardiovascular system. Our studies also indicated that unlike the slow-release CT-Fe2O3-NPs, repeated short-infusion of fenoldopam-alone every 3 days for 8 weeks was not beneficial for the in vivo experiments.
Figure 7.
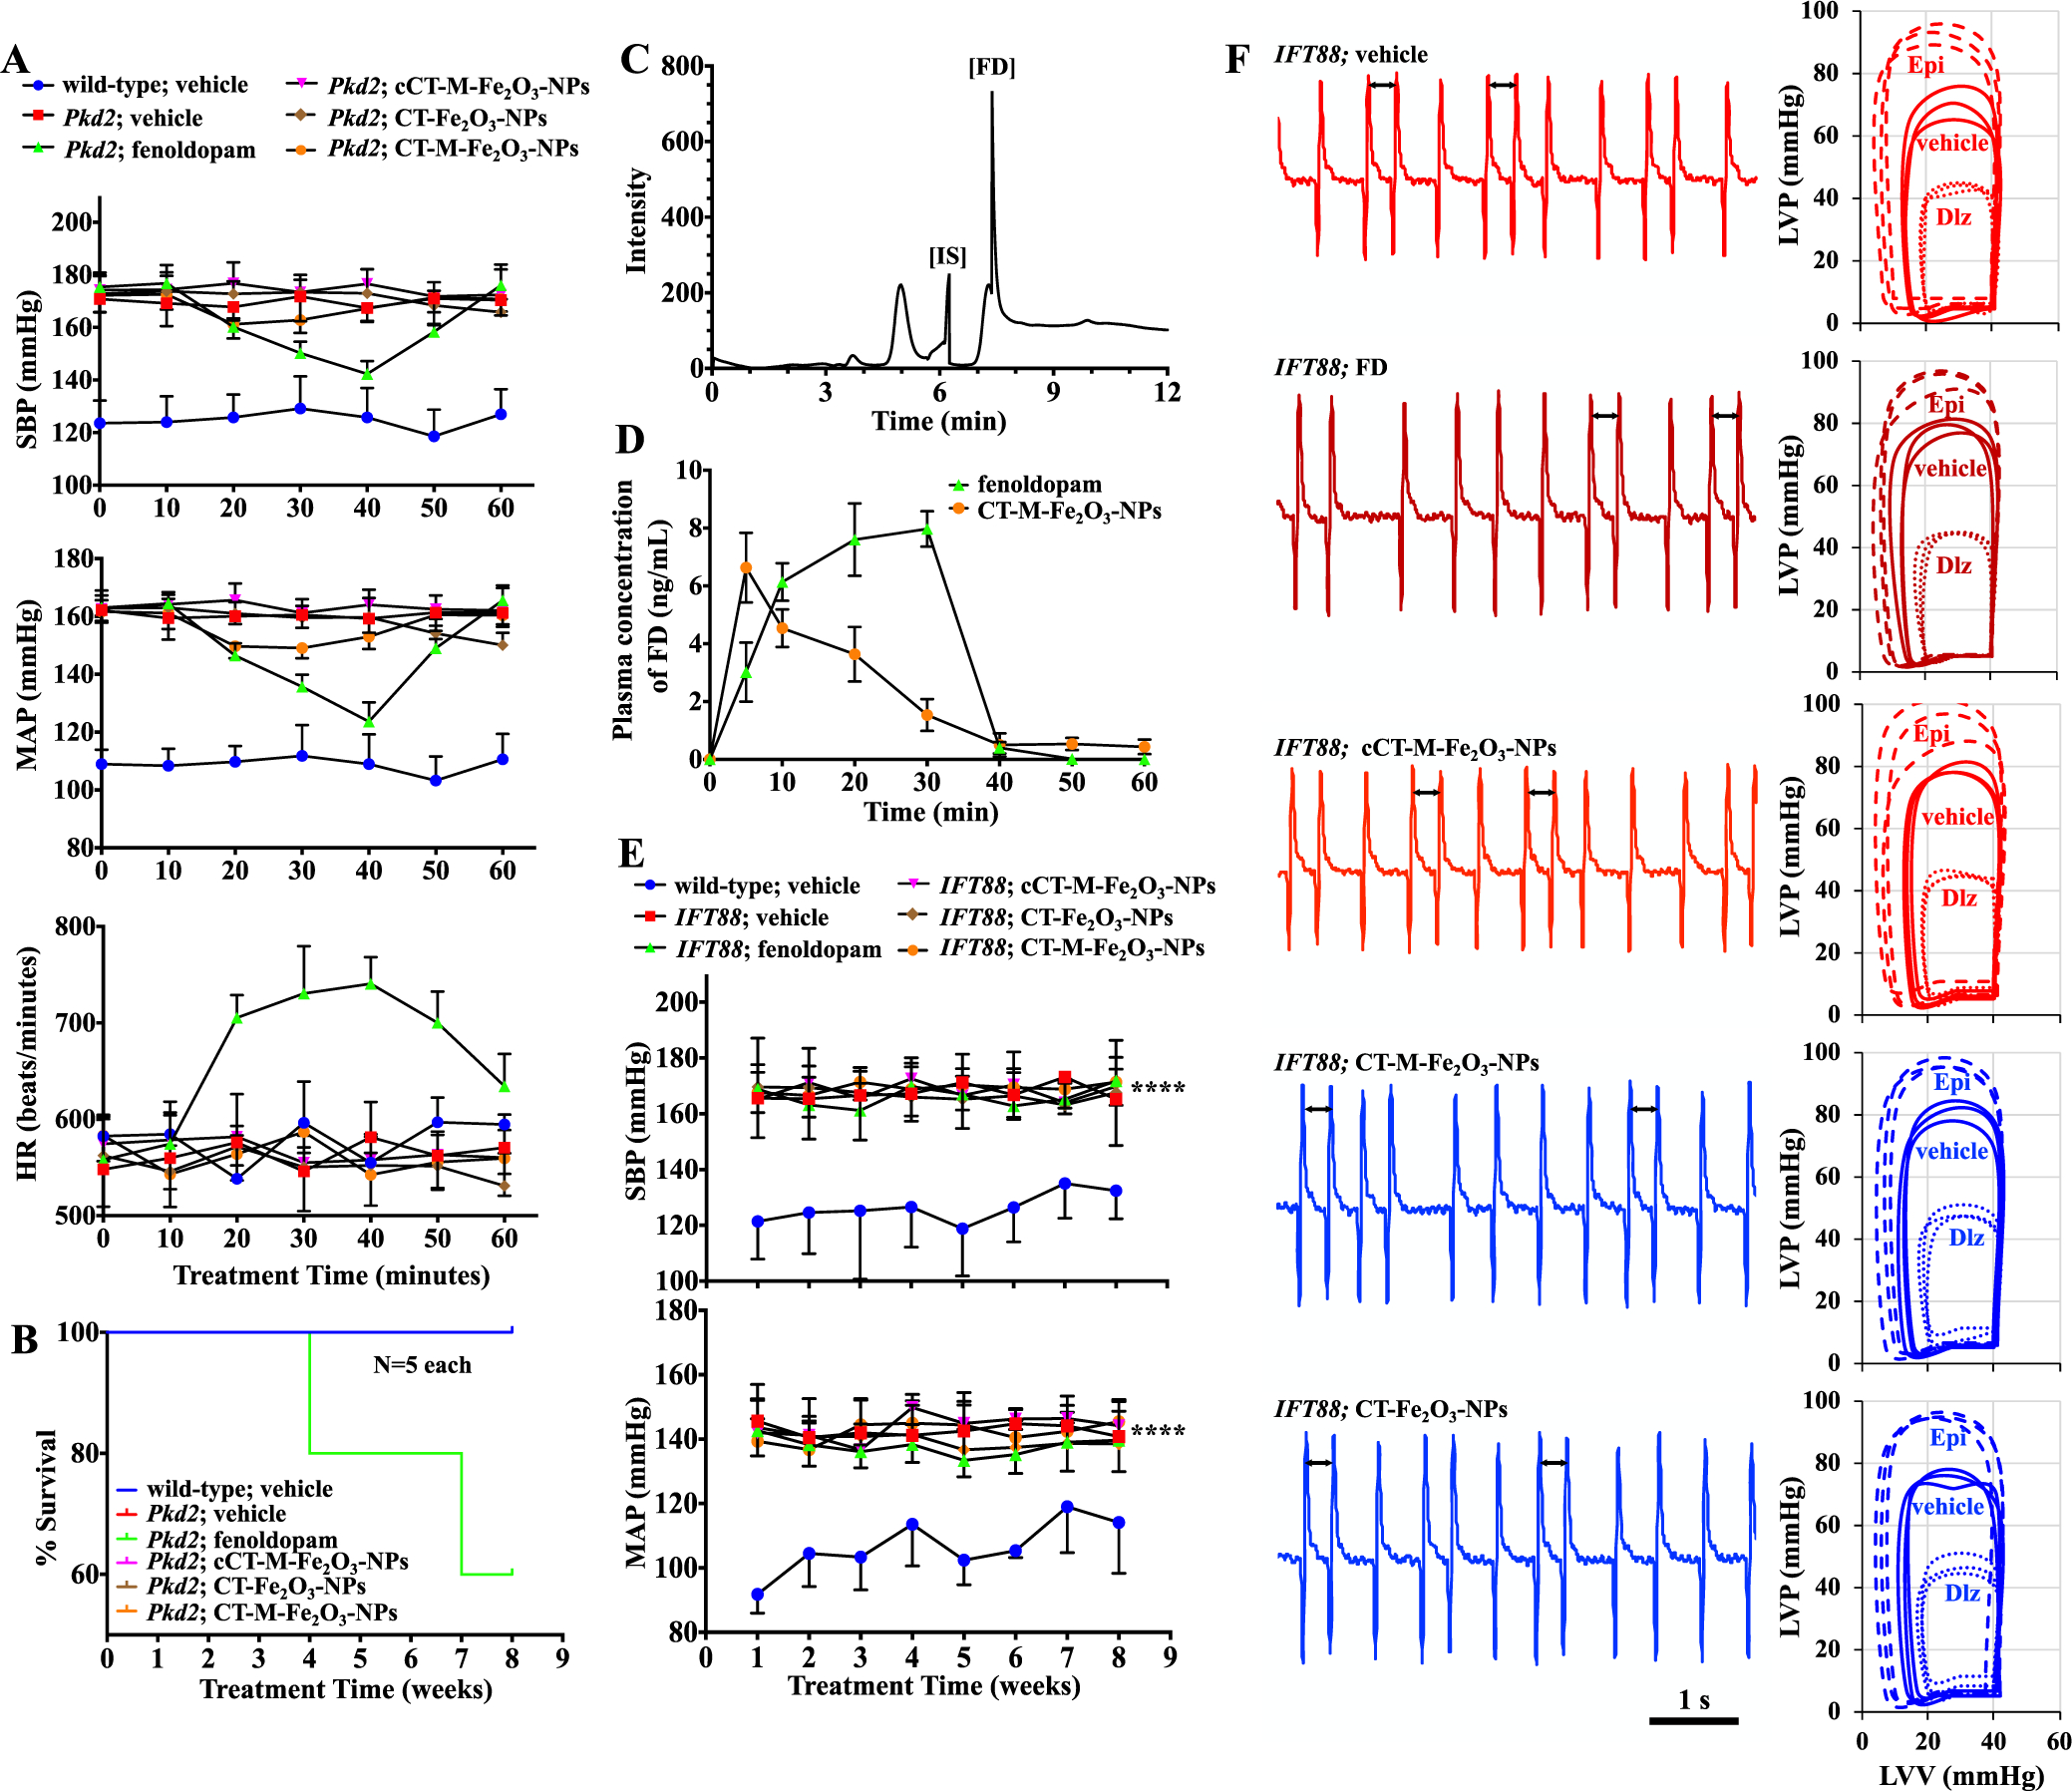
Validating effects of fenoldopam and CT-Fe2O3-NPs on cardiovascular functions. (A) Blood pressure was measured for 60 min. SBP, MAP, and heart rate (HR) are shown in the line graphs. (B) Survival curves for Pkd2 mice receiving different treatments for 8 weeks; mice that received repeated fenoldopam infusions only showed 40% mortality. (C) HPLC chromatogram of plasma spiked with an internal standard (SKF-38393; IS) and fenoldopam (FD). (D) Plasma concentration–time curves present the mean plasma fenoldopam concentrations measured in mice (N = 3–5 animals) treated with the CT-M-Fe2O3-NPs or fenoldopam-alone. Fenoldopam was administered as a 1.0 μg/kg/min intravenous infusion for 30 min. (E) Blood pressure was measured in mice that received different treatments at the end of each week for 8 consecutive weeks. SBP and MAP are shown in the line graphs. (F) Representative ECG traces of the hearts over a 5 s duration. Arrows indicate uneven heart rhythms. The corresponding loop diagrams show the LVV and LVP relationship without (PBS or vehicle) and with stressors. Stress was achieved with either epinephrine (Epi; 4 μg/L for each mg of heart tissue) or diltiazem (Dlz; 0.08 μg/L for each mg of heart tissue). Unless indicated otherwise, N = 4 mice per group in Pkd2 study, N = 5 in IFT88 study; ****, p < 0.0001 compared with the wild-type mice (without Cre activation).
In separate studies, we utilized mice without vascular endothelial cilia (Tie2Cre•IFT88flox/flox) to confirm that the CT-Fe2O3-NPs were specifically targeted to cilia. These mice exhibited vascular hypertension,6 and neither the CT-Fe2O3-NPs nor the CT-M-Fe2O3-NPs reduced blood pressure, indicating vascular endothelial specificity of the NPs (Figure 7E). Parameters of heart function were also analyzed (Tables S4–S6). Whereas IFT88 hearts responded well to the stresses, the hearts were susceptible to arrhythmia. Unlike the arrhythmic Pkd2 heart, however, IFT88 hearts were characterized with an inverted PR interval arrhythmia (Figure 7F). Unlike Pkd2 hearts, normal rhythmic and function of IFT88 hearts could not be corrected by the CT-Fe2O3-NPs, confirming that the presence of cilia was required for the CT-Fe2O3-NP effect.
Our in vivo studies also provided two surprise findings that had never been reported. First, a ciliopathy hypertensive model was associated with renal cyst formation. Because Tie2Cre model was used in our hypertension model, one could argue that Tie2Cre may not be specific to vascular endothelia.59 To the best our knowledge, however, we did not find any report that has shown an effect of Tie2Cre in renal epithelia. This observation implored the possibility that hypertension could induce renal cyst formation, given that renal cysts are frequent clinical diagnoses in older patients associated with hypertension.60,61 Second, ciliopathy hypertensive models were associated with cardiac arrhythmia. While the types of arrhythmia between Pkd2 and IFT88 were not identical, both were very susceptible to arrhythmia when heart pacing was withdrawn from the Working Heart system. On the other hand, hearts from wild-type mice would slowly reduce their contractility and/or heart rate. Although the underlying mechanism is unclear, hypertension is commonly associated with atrial and ventricular arrhythmias.62,63 Importantly, the CT-Fe2O3-NPs were able to reduce not only the blood pressure but also those complications associated with hypertension, such as renal cyst and cardiac arrhythmia. In our studies, we did not observe any significant effect between the CT-Fe2O3-NPs alone and the CT-Fe2O3-NPs with magnetic field (CT-M-Fe2O3-NPs). However, compared to the CT-Fe2O3-NPs, the CT-M-Fe2O3-NPs returned physiological functions or anatomical structures to the levels that were comparable to the normal healthy wild-type in either zebrafish or mice.
CONCLUSIONS
In summary, we have introduced an approach to remotely control primary cilia. The cilia-targeted magnetic nanoparticles can be used to control nonmotile primary cilia movement, length, and function. Compared to a short-acting drug-alone, the use of nanoparticle drug delivery is more superior in providing a more specific cellular target and provides a slow-release mechanism to avoid nonspecific reflexes or other systemic adverse effects. This nanoformulation can thus be a useful approach for nanotherapy in ciliopathy treatment.
EXPERIMENTAL SECTION
Fe2O3-NP Synthesis and Surface Functionalization.
For the synthesis of Fe2O3-NPs, ferric Tris (dodecyl sulfate) [Fe(DS) 3] was first prepared by completely dissolving 8.64 g (0.12 M) of SDS in 200 mL of distilled water (Solution A). In another preparation, 4.04 g (0.04 M) of Fe(NO3)3·9H2O was dissolved in 50 mL of distilled water (Solution B). Solutions A and B were then mixed at room temperature (r.t.), stirred, and allowed to reach equilibrium for 1 h. The resulting yellow precipitate of Fe(DS)3 was filtered, washed with distilled water several times, and dried under vacuum at r.t. for 24 h. For the synthesis of bare Fe2O3-NPs, 100 mg of Fe(DS)3 was dissolved in 20 mL of distilled water in a 500 mL conical flask, and a 25% ammonia solution was immediately added to achieve a pH of 11.0. Next, the flask was placed in an autoclave and processed at 150 °C and 15 psi for 3 h. After cooling to r.t., the material was washed, followed by brief centrifugation (5000 rpm, 5 min) and calcination at 300 °C; a dark-red fine powder of bare Fe2O3-NPs was collected. The oleic acid (OA) surface functionalization of the synthesized Fe2O3-NPs was performed using a previously described method.64,65 After autoclaving (150 °C and 15 psi for 3 h), the reaction mixture was cooled to r.t. and stirred under a nitrogen-gas atmosphere for 1 h. Then, 100 mg of OA was added to the above mixture, heated to 80 °C, and stirred for 30 min. The resulting reaction mixture was cooled to r.t. and stirred for another 24 h. Sunbright-40 (OA-PEG-NHS)-functionalized OA-Fe2O3-NPs were prepared by adding an aqueous solution of Sunbright-40 (100 mg/5 mL of distilled H2O) to the mixture and stirring it for another 24 h at r.t. All bare Fe2O3-NPs and Sunbright-40-OA-Fe2O3-NPs were separated by placing a magnet (100 T; VWR International, PA) below the beaker, and the solution was allowed to clear. The particles were washed with 50 mL of nitrogen-purged sterile water three times using magnetic separation and centrifuged at low speed (1000 rpm) to remove large aggregated particles.
Antibody Conjugation and Drug Loading of Fe2O3-NPs.
The DR5 antibody (EMD Millipore, MA; cat# 324408) was generated from a synthetic peptide corresponding to amino acids 2–10 of the DR5 N-terminus, and it did not cross-react with other dopamine receptors. Initially, we conjugated DR5 to Alexa Fluor 594 maleimide using an Alexa Fluor 594 antibody labeling kit to target thiol groups, according to the manufacturer’s instructions (Thermo Fisher Scientific, MA). The preconjugated DR5-Alexa Fluor 594 antibody and fenoldopam were bound to the synthesized Sunbright-40-OA-Fe2O3-NPs using a previously reported method, with some modifications.64 Briefly, Sunbright-40-OA-Fe2O3-NPs (100 mg) were cooled to 4 °C, mixed with 500 μg of DR5-Alexa Fluor 594 antibodies to a final volume of 25 mL in PBS, and shaken overnight at 4 °C. A DMSO solution of fenoldopam (400 μL, 15 mg/mL in each reaction) was added to the NP solution, and the reaction was allowed to proceed under stirring (400 rpm) for another 16 h at 4 °C. The antibody- and fenoldopam-loaded Sunbright-40-OA-Fe2O3-NPs (now designated the CT-Fe2O3-NPs throughout the manuscript) were separated from the free antibody and free fenoldopam. The CT-Fe2O3-NPs were then washed with PBS several times, lyophilized, and stored in the dark.
A set of control groups was also prepared in the same way but without fenoldopam (designated as the cCT-Fe2O3-NPs throughout the manuscript). Fluorescent unconjugated DR5 antibody loading was also conducted in a separate reaction. The binding of the DR5 antibody to synthesized CT-NPs was analyzed by fluorescence spectrofluorometry at λex = 590 nm and λem = 617 nm with a FLUOstar omega filter-based multimode microplate reader (BMG LABTECH). The conjugation efficiency of the antibody to the NPs was further assessed with SDS-PAGE, and protein concentrations were measured by recording the optical density at 280 nm with a NanoDrop 2000 spectrophotometer (Thermo Scientific, MA). The fenoldopam loading efficiency was quantified by HPLC (SHIMADZU Prominence-I, LC-20302 3D). Fenoldopam release was measured by dialyzing 1 mL of each NP solution at a concentration of 5 mg/mL in PBS using 3.5k MWCO dialysis tubing (Spectrum Laboratories, CA), and the dialysate was subjected to HPLC. A standard plot was prepared under standard conditions with fenoldopam concentrations ranging from 5 to 200 μg/mL.
Chemical and Physical Characterization of Fe2O3-NPs.
The initial synthesis of Fe2O3-NPs was confirmed by UV–visible spectroscopy using a SpectraMax M5 system (Molecular Devices, CA). Stability studies of the synthesized NPs were conducted by dissolving them in PBS (0.25, 0.5, and 1 mg/mL). NP stability was determined by preserving them in a 10% sucrose solution. For measurements of size and shape, the synthesized nanomaterials were examined by TEM using an FEI/Philips 200 kV CM-20 electron microscope. The particle size in the TEM images was measured using SIS imaging software (Munster, Germany). TEM was also used to study the SAED patterns. The size and surface ζ-potential of synthesized NPs were obtained by DLS measurements using a Malvern ZETASIZER (Nano-ZS; ZEN3600, UK). Samples of lyophilized NPs were subjected to XRD using a Rigaku SmartLab X-ray diffractometer and Cu Kα (Cu target) radiation at a scanning rate of 1° per min in the region of 2θ = 10–90°. X-ray photoelectron spectra of the samples were recorded on a Kratos Analytical AXIS Supra system with a monochromatic Al/Ag X-ray source (Al target). Survey spectra were recorded in a range from 1200 to −5 eV binding energy (dwell time = 200 ms, step size = 1 eV, and two sweeps), and scans of all regions were conducted with suitable ranges (dwell time = 500 ms, step size = 0.05 eV and five sweeps). The FTIR spectra were recorded using a Bruker ALPHA (Platinum-ATR) spectrometer in the diffuse reflectance mode at a resolution of 4 cm−1. The magnetization capacity of the bare magnetic Fe2O3-NPs and CT-Fe2O3-NPs was measured at r.t. using a vibrating sample magnetometer (VSM, LKSM-7410).
The colloidal stability of the CT-Fe2O3-NPs was investigated in PBS, Dulbecco’s Modified Eagle’s Medium (DMEM) containing 10% fetal bovine serum (FBS), and extracted blood plasma at 37 °C using DLS. Samples were prepared by the addition of 50 μL of the CT-Fe2O3-NPs to 1 mL of each sample (with a final concentration of 0.5 mg/mL) and were incubated at 37 °C to imitate biological conditions. The sizes of the CT-Fe2O3-NPs were measured at different time points (0–48 h).
Cell Culture.
LLC-PK1 cells were purchased from the ATCC (CL-101) and cultured in DMEM (Corning Cellgro, NY) supplemented with 10% FBS (HyClone, MA) and 1% penicillin/streptomycin (Corning Cellgro, NY) at 37 °C in a humidified, 5% CO2 atmosphere. The cell line was confirmed to be mycoplasma-free with repeated testing, using a mycoplasma detection kit (MycoAlert, Lonza, Switzerland). Prior to the experiments, antibiotics were withdrawn, and cells were serum-starved for 24 h to induce differentiation. In some experiments, primary culture endothelial cells were generated from Tie2Cre•Pkd2WT/WT mouse aortas, as previously described.4 Prior to the experiments, these cells were cultured in DMEM (Corning Cellgro, NY) containing 10% FBS (HyClone, MA) at 39 °C in a humidified, 5% CO2 atmosphere.
Toxicity Studies.
The cytotoxicity of the CT-Fe2O3-NPs was assessed in LLC-PK1 cells in vitro using an FITC-Annexin-V/Propidium Iodide Apoptosis kit (Molecular Probes & Life Technologies, MA). Furthermore, a FACS analysis was used to assess the percentages of apoptotic and necrotic cells with a BD Facsverse flow cytometer and BD FACsuite software. Representative images of cells were captured using standard fluorescence and DIC microscopes (Nikon Eclipse Ti microscope). For the in vivo toxicity studies, 100 μL of blood samples was collected from different treatments (PBS and CT-M-Fe2O3-NPs). Hemanalysis and biochemistry were performed using a blood-cell analyzer (VetScan HM5 v2.2, Abaxis, CA, USA) and a biochemical analyzer (VetScan VS2, Abaxis, CA, USA), respectively.
Live Imaging of a Single Cilium from a Single Cell under Flow Conditions.
The CT-Fe2O3-NPs were evaluated by capturing images of the lateral view of both the cell body and cilium to determine the specificity of cilia targeting by NPs and to avoid biases in the data analysis. LLC-PK1 cells were grown on Formvar (Electron Microscopy Science) as previously described.66 The Formvar polymer was dissolved in ethylene dichloride to produce a 2% Formvar solution. Cells were then grown on this collagen-coated Formvar polymer thin film (FPTF). The FPTF was placed on a custom-made glass-bottomed plate. A thin pipet tip (Fisher Scientific, Inc.) was connected to the inlet and outlet clear plastic PVC tubes with a 0.031 in. inner diameter (Nalgene, Inc.). The tubes were inserted into the in-flow and out-flow pumps (InsTech P720), and the pipet tips were inserted between the bottom glass plate and held with a cover glass slide on top. Different concentrations (0.1–1 μg/mL) of the cCT-Fe2O3-NPs and CT-Fe2O3-NPs were perfused (1.0 dyn/cm2) through the cells, and images were captured for 2 h. Different NP targeting capacities to the same cilia were observed with a Nikon Eclipse Ti microscope (100×, 1.40 numerical aperture oil-immersion objective lens). The microscope is also equipped with an incubator (Okolab-Japan) to control CO2, humidity, temperature, and light to provide a suitable environment for the cells during the experiment. All the environmental controls were monitored by an Oko touch screen.
Prussian Blue Staining.
The CT-Fe2O3-NPs were evaluated using Prussian blue staining to determine the presence of NPs on cilia and the specificity of cilia targeting by NPs. First, LLC-PK1 cells were grown on Formvar for 16 h and treated with 0.1 to 1 μg/mL of the CT-Fe2O 3-NPs with a very slow perfusion. After 48 h, cells were washed with PBS and fixed with 4% glutaraldehyde in PBS for 10 min. Subsequently, the cells were washed with distilled H2O and stained using an Iron Staining Kit (BioPAL, MA). Cells were then washed again with distilled H2O, and photographs were taken using a light microscope (Nikon Eclipse Ti, 100×, 1.40 numerical aperture oil-immersion objective lens).
Immunocytochemistry and Confocal Microscopy.
For the in vitro cilia length measurements, cells were grown on the Formvar polymer, as mentioned above. Primary cilia consisting of acetylated microtubule structures were measured by direct immunofluorescence staining with an acetylated-α-tubulin antibody following a 16 h incubation with different concentrations (0.1–5 μg/mL) of the CT-Fe2O3-NPs. Likewise, the CT-Fe2O3-NPs without loaded fenoldopam were used as the corresponding control (cCT-Fe2O3-NPs). Fenoldopam-alone was also used as another control. Cells were rinsed with sodium cacodylate buffer, fixed with 2.5% glutaraldehyde in 0.2 M sodium cacodylate buffer for 10 min, and permeabilized with 1% Triton X-100 in sodium cacodylate buffer for 5 min. An antibody against acetylated-α-tubulin (1:10 000 dilution, Sigma-Aldrich, MO) and the secondary antibodies were also diluted in 10% FBS to decrease the background florescence; an FITC-conjugated secondary antibody (1:1000; Pierce, Inc.) was used. Cells were then washed three times for 5 min each with cacodylate buffer and sealed with mounting media containing DAPI (Vector laboratories, CA). Confocal images were obtained using an inverted Nikon Eclipse Ti confocal microscope (60×, 1.40 numerical aperture oil-immersion objective lens). Images were processed using NIS-Elements High Content AR 4.30.02 (Nikon). Automated image acquisition (ND acquisition) was conducted under the same 60× magnification (selected area capturing option) field and Z-stack (0.1 μm slices) settings to create a 3D video. All imaging and video acquisition times and the microscope stage were automatically controlled (XY, XZ, and YZ) by an automated perfect focusing system (PFS). The in vivo cilia length measurements and NP localizations in the zebrafish and mouse tissues were performed using the same method.
Intracellular Ca2+ and NO Imaging.
Cells were grown as a monolayer on glass-bottomed plates to enable live microscopy imaging. After a 16 h incubation without or with different concentrations (0.1–5 μg/mL) of fenoldopam, cCT-Fe2O3-NPs, or CT-Fe2O3-NPs, cells were loaded with 5 μM Fura-2 (AM) (TEFLabs, TX) at 37 °C for 30 min. After washing to remove excess Fura-2 (AM), cytosolic Ca2+ images were captured every second by recording the fluorescence of Ca2+-bound Fura-2 (AM) at an excitation wavelength of 340/380 nm and an emission wavelength of 510 nm. For intracellular NO measurements, cells were loaded with 20 μM DAF-FM (Cayman Chemical) for 30 min at 37 °C. NO was then measured every second at excitation and emission wavelengths of 495 and 515 nm, respectively. A more detailed protocol for intracellular Ca2+ and NO measurements was reported previously.67 Cells were placed in Dulbecco’s PBS during the experiments and observed under a Nikon Eclipse Ti microscope using a 40×, 1.40 numerical aperture oil-immersion objective lens. Baseline Ca2+ and NO levels were measured for 2 min prior to data acquisition. Fluid shear-stress was then applied to cells through InsTech P720 peristaltic pumps with an inlet and outlet setup. The fluid was perfused through cell monolayers at a subminimal shear-stress of 0.5 dyn/cm2. An oscillating magnetic field (1.35 T) was applied to cells treated with the CT-Fe2O3-NPs (CT-M-Fe2O3-NPs) or fenoldopam-free CT-Fe2O3-NPs (cCT-MFe2O3-NPs). An Alnico cylindrical magnet (VWR International, PA) was used to oscillate a primary cilium. This 100 g AlNiCo magnet produced a permanent magnetic field of 1.35 T. Once a cilium was placed on the specimen holder and in the plane of view, the magnet was mounted on the top of an inverted Nikon Ti-E microscope. The magnet was then mechanically moved with an oscillation frequency of 1.6 Hz. The movement of cilia by the magnetic field was continuously recorded for the duration of the experiment. To examine how much force the magnetic field generated onto a cilium, we calculated the movement of cilia in response to the oscillating magnetic field (Supporting Information). On the basis of the flexural stiffness of cilia of 3 × 10⁻²³ Nm2,68 a constant magnetic field of our Alnico magnet produced a force of 0.1 pN on a cilium. Of note is that a magnitude of 10 pN of magnetic force was needed to move a fixed cell expressing ferritin.69
Ca2+ Imaging in Primary Cilia.
In single-cell–single-cilium studies, LLC-PK1 cells were first grown on 2% Formvar and later transfected with the Ca2+ fluorescence reporter 5HT6-mCherry-GGECO1.0 (Addgene, MA) using JetPrime transfection reagent (Polyplus transfection) as previously described.34 The single-cell–single-cilium studies were performed as mentioned above. The shear-stress ranged from 0.01 to 1.0 dyn/cm2 and was accurately measured and controlled at all times. An oscillating magnetic field (1.35 T) was applied to cells treated with the CT-Fe2O3-NPs (CT-M-Fe2O3-NPs). After successful transfection, cells were treated with different concentrations of fenoldopam, cCT-Fe2O3-NPs, or CT-Fe2O3-NPs, and 5HT6-mCherry-G-GECO1.0-expressing cilia were observed under an inverted Nikon Eclipse Ti confocal microscope by focusing fluorescence lasers only on a single cell or single cilium. For these experiments, none of the CT-NPs contained Alexa Fluor 594 to avoid interference with the mCherry signal. Confocal laser scanning microscopy in fast-scan mode was used to avoid potential excessive photobleaching. Approximately 15–20 cilia were analyzed for each treatment using different fluorescence filters. With this specific experimental setup, we observed the cell body and cilia in an unbiased way. Moreover, we were able to capture DIC images of the cilia. All videos were processed using NIS-Elements High Content AR 4.30.02 (Nikon) for the live tracking and kymograph analysis of both the cell and cilia. The Ca2+ tracking was very efficiently achieved using binary spotting tracks. The GFP/mCherry ratios were also calculated using Nikon tracking software.
Immunoblotting.
Untreated cells (control) or cells treated with the CT-Fe2O3-NPs were rinsed with PBS and scraped from the culture plates in the presence of RIPA buffer supplemented with Complete Protease Inhibitor (MedChemExpress, NJ). Cells were lysed using probe sonication (Fisher Scientific, CL-18) for 10 min at 20 kHz using a pulse of 1 s−1 and 40% acoustic power. Samples were kept on ice during sonication to prevent overheating. Samples were then centrifuged at 15 000 rpm for 20 min, and the supernatants were collected and subjected to protein quantification. The PAGE (polyacrylamide gel electrophoresis) on 6–10% SDS gels was performed followed by semi-dry transfer to PVDF membranes using a Bio-Rad Trans-Blot Turbo Transfer System and detection using antibodies against t-ERK (1:1000), p-ERK (1:1000), NOS (1:200), and GAPDH (1:2,000) (Cell Signaling Technology, MA). Blots were scanned with both calorimetry to image molecular markers and chemiluminescence to capture the protein signal intensity using a Bio-Rad imager.
Intracellular Cyclic Nucleotide Measurements.
LLC-PK1 cells were pretreated with either PBS or different concentrations (0.1–5 μg/mL) of fenoldopam and CT-Fe2O3-NPs to quantify the cGMP content. The cGMP levels were measured using a cGMP ELISA Kit (Cayman Chemical, MI). The results were converted to pmol/mL using standard curves.
Zebrafish Experiments.
Zebrafish experiments were performed by two operators who were blinded to the experimental conditions. Adult wild-type AB zebrafish were obtained from the Zebrafish International Resource Center (Eugene, OR) and used for breeding. Embryos were injected with 1 mM antisense translation blocking morpholino oligonucleotides (GeneTools) at the one- to two-cell stage. Zebrafish embryos were then cultured at 28.0 °C in sterile egg water. The following morpholino sequences were used: control scrambled MO: 5′-CCT CTT ACC TCA GTT ACA ATT TAT A-3′ and Pkd2: 5′-AGG ACG AAC GCG ACT GGG CTC ATC-3′. The zebrafish were then injected with PBS (control), CT-Fe2O3-NPs, or control NPs via the caudal vein at 24 hpf. Measurements of blood flow characteristics and heart parameters were performed using a Nikon Eclipse Ti microscope at 48 hpf. NIS-Elements High Content AR 4.30.02 software (Nikon) was used for the live tracking of the speed and acceleration of a single blood cell. Videos were recorded at a high speed of 100–120 fps to study the vascular and cardiac functions of the fish. The contractility rate of the heart was measured using the image segmentation method in NIS-Elements High Content AR 4.30.02 software. The ventricular stroke volume was measured from the perpendicular long axis (rl) and short axis (rs) of ventricular diameters. Ventricular volumes were calculated by measuring the end of the systole () (when the ventricle is most contracted) and the diastole () (when the ventricle is most relaxed). A minimum of 15 and were averaged for each animal. The ventricular volume was calculated based on the formula: volume = 0.5 × rl × rs2. The stroke volume was calculated by subtracting from (), and cardiac output was calculated by multiplying the stroke volume by the heart rate (cardiac output = stroke volume × heart rate).70
Mouse Models.
All mouse experiments were performed by two operators who were blinded to the experimental conditions. All animal procedures were performed according to the University of California Irvine and Chapman University Animal Care and Use Committee Guidelines. Tie2Cre•Pkd2WT/WT (with Cre activation; control group), Tie2Cre•Pkd2flox/flox (without Cre activation; control group), or Tie2Cre•Pkd2flox/flox (with Cre activation; experimental group) (all 1 week old) mice were intraperitoneally injected with 250 μg of tamoxifen in a 50 μL volume daily for five consecutive days. A limited number of IFT88 mice were also used as a cilialess model in our study. The mice were then injected with PBS (control), CT-Fe2O3-NPs, or control NPs (0.5 to 2.0 mg/kg body weight in 150 μL of PBS) via the tail vein. Mice were treated with the CT-Fe2O3-NPs every 72 h for 8 weeks. On the other hand, fenoldopam-alone (1 μg/kg/min) was perfused for 30 min every 72 h for 8 weeks. In separate experiments, magnetic stimulation was applied every 72 h to mice treated with the CT-Fe2O3-NPs (designated as the CT-M-Fe2O3-NPs). Five minutes after the CT-Fe2O3-NP injection, a 1.35 T Alnico cylindrical magnet (VWR International, PA) was placed at the posterior and anterior regions of the mouse for 10 min daily.
Mouse Blood Pressure Measurements.
Tie2Cre•Pkd2WT/WT, Tie2Cre•Pkd2flox/flox, and Tie2Cre•IFT88flox/flox mice (injected with either 0.5–2.0 mg/kg NPs or 1 μg/kg/min infusion of fenoldopam for 30 min) (all four weeks old) were subjected to blood pressure monitoring by the noninvasive tail-cuff method using a CODA high-throughput system (Kent Scientific, CT). Blood pressure was measured twice daily for the duration of the study after the initial 3 days of acclimating each mouse to the cuff. All measurements were performed by operators in a double-blind. At the end of the 12 week treatment, the hematology results including the BUN and plasma nitrate/nitrite measurements were examined. BUN assays were conducted using an Arbor Assays Calorimetric Detection Kit. Plasma nitrate/nitrite concentrations were quantified using a Cayman nitrate/nitrite assay kit. All steps were performed according to the manufacturers’ instructions.
Working Heart Perfusion System.
The ex vivo measurements of heart parameters were recorded using a mouse working heart system from Emka Technologies (Paris, France) to study heart function independently of neuronal innervation or humoral effects. This system collected data regarding the cardiac contractile strength, electrical heart propagation, or ECG and other cardiac functions, including the HR, LVP, LVV, left atrial pressure (LAP), aortic out flow (AOF), stroke volume (SV), cardiac output (CO), end diastolic/systolic volume (Edv–Esv), rate of left atrial pressure raise (+dp/dt) and fall (−dt/dt), and the preload, afterload, and main aortic pressure (Movie 12). Heparin (100 units, IP), xylazine (10–15 mg/kg, IP), and ketamine (200–350 mg/kg, IP) were used to prevent blood coagulation in the coronary arteries and to anaesthetize the mice. After cannulation, the heart was perfused with Krebs-Ringer superfusion solution (in mM: 125 NaCl, 2.5 KCl, 1.25 NaH2PO4, 2 CaCl2, 1 MgCl2, 25 NaHCO3, and 25 glucose). Throughout the experiment, the solution was continuously bubbled with carbogen (95% O2 and 5% CO2) to reach pH 7.4 at 38.0 °C. Stress tests were performed on the heart by perfusing epinephrine (4 μg/L) or diltiazem (0.08 μg/L). Cardiac function was plotted in a loop diagram showing the LVV–LVP relationship (volume–pressure loop).
Pharmacokinetics in Mice.
Tie2Cre•Pkd2WT/WT mice (five mice for each compound, 25 ± 5 g body weight) were treated with PBS (control), NPs (0.5 to 2.0 mg/kg body weight in 150 μL of PBS), or fenoldopam-alone (1 μg/kg/min; 30 min) via tail vein.11 Blood samples of 50 μL were collected prior to drug injections and at 5, 10, 20, 30, 40, 50, and 60 min time points during the duration of injections (for NPs) or perfusions (for fenoldopam). Blood samples were collected into heparin-coated tubes and centrifuged for 8000 g for 10 min to obtain plasma. All the standard stock solutions (fenoldopam and SKF-38393 hydrochloride (IS; Enzo Life Sciences, NY)) were prepared at 50 ng/mL concentrations. All drugs were extracted from plasma samples using previously described methods.71 Plasma calibration standards were prepared by adding a suitable amount of working solutions to blank plasma. The HPLC analysis was performed using a Shimadzu Prominence-i separation system. Separation was achieved on a LaChrom C18 (5 μm) column (4.6 mm I.D.× 150 mm L). The column temperature was set to 28 °C. The mobile phase was composed of 0.5% formic acid in distilled H2O with 10% acetonitrile, which was increased linearly to 90% from 1 to 8 min of the run. The flow rate was maintained at 0.3 mL/min, and the total run time was 12 min.
H&E and Masson’s Trichrome Staining.
Sections of the zebrafish (whole body) and major mouse organs, including the hearts, kidneys, livers, spleens, and lungs, were collected and subjected to H&E staining for zebrafish cysts and histopathology by fixation in 10% formalin. Then, the tissues were dehydrated in buffered formalin, ethanol, and xylene. Finally, the tissues were embedded in liquid paraffin, sectioned (4 μm), and stained with H&E for histological examinations. The pathology slices were observed and imaged using a KEYENCE BZ-X710 microscope. Mouse heart sections were stained with Masson’s trichrome to detect fibrosis using a Masson’s Trichrome Stain Kit (Polysciences, Inc.).
Quantification and Statistical Analysis.
Representative images are shown whenever possible to verify the extraction of information from the digital images. When representative images cannot be shown, videos are provided to depict the dynamic image analysis, such as changes in particle size, shape, speed, and acceleration. Nikon NIS-Element for Advanced Research software was used for image capture and analysis, including 3D object reconstruction, image scanning and segmentation, optical flow, single-particle tracking, and automatic object recognition. We did not enlarge the image during information extraction to avoid unnecessary magnification. Thus, all videos and images were captured at the highest resolving power allowed by the imaging system. A Photometric Coolsnap EZ CCD Monochrome Digital Camera connected to a Nikon Ti-E microscope with a 1392 × 1040 imaging array was used to resolve fine details of the images. In other cases, both resonant and galvano scanners were used with a Nikon A1R confocal microscope for the high-speed scanning of 30 fps (frame per second) and 420 fps at a resolution of 4096 × 4096 and 512 × 512 pixels2, respectively. All videos and images were finalized on a six-core Mac Pro, 3.9 GHz, to facilitate complete data extraction. Scale bars are provided in all figures and videos to indicate the actual image size.
All quantifiable data are reported as the mean ± SEM. Distribution analyses were performed on all data sets before any statistical comparisons to confirm a normal data distribution. Homogeneity of variance (homoscedasticity) was also verified within each data set. When a data set did not display a normally distribution or heterogeneous variance was detected, the distributions were normalized by log transformation. This approach produced normally distributed data sets. After the distribution and variance analyses, data from more than two groups were compared using an ANOVA followed by the Tukey post hoc test. The Bonferroni post hoc test was used to compare data between specific groups in ANOVA analysis. Comparisons between two groups were performed using Student’s t test. Whenever possible, a paired-experimental design was used in our studies to enable a more powerful statistical analysis and to reduce the number of mice used in each study group. For all comparisons, power analyses were performed routinely to enable reliable conclusions, and comparisons with negative results had a statistical power of ≥0.8. Unless indicated otherwise, the difference between groups was considered significant at p < 0.05. Statistical significance is indicated with the asterisk (*) or hashtag (#) sign at various probability levels (p). The p-values of the significant differences are indicated in each figure and legend. The comparison with the wild-type control, nontreated, or noninduced group is indicated with *, whereas comparisons with the mutant or nontreated group are shown using #. Comparisons with additional control groups without drug loading (cCT-Fe2O3-NPs and cCT-M-Fe2O3-NPs) are also shown using #. The p-value of the significant differences at various probability levels, the number of experimental replicates, and sample sizes are indicated in the figure legends. Most of our statistical analyses were performed using GraphPad Prism software, version 7.0. In some cases, Microsoft Excel v.15.4 software was used for regression analyses. Linear regression analyses were performed to obtain a standard calibration curve and linear equation. In this case, the analysis was conducted with the ordinary least-squares (OLS) regression of y on x. A nonlinear logarithmic regression analysis was used to fit the sigmoidal trend curve to show the dose–response relationship. While data analyses were conducted using statistical software, they were verified by a mathematician/statistician.
Supplementary Material
ACKNOWLEDGMENTS
We thank Armando Diaz for his expertise in generating the videos and Maki Takahashi for reagent preparations and technical assistance. This work was supported by the Congressionally Directed Medical Research Program PR130153, NIH HL131577, Chapman University (2017-2018 Faculty Scholarly/Creative Activity Award) and Chapman University School of Pharmacy. The TEM, XRD, and XPS analyses were performed at the UC Irvine Materials Research Institute, supported in part by the National Science Foundation Major Research Instrumentation Program under grant no. CHE-1338173. The generation and maintenance of transgenic Pkd2 mice at Harvard Medical School were supported by NIH DK053357, DK040703, DK051050, DK099532, and P50DK074030.
Footnotes
Supporting Information
The Supporting Information is available free of charge on the ACS Publications website at DOI: 10.1021/acsnano.9b00033.
Mathematical modeling, nanomaterials characterization, in vitro toxicology and FACS, calcium and nitric oxide imaging, live single-cell–single-cilia calcium imaging, calcium kymographs, calcium speed and acceleration measurements, primary cultured endothelial cell ERK-phosphorylation measurements by immunoblotting H&E staining, zebrafish aorta and heart immunohistochemistry, H&E histopathology study, working heart measurement data, blood cell and biochemistry analysis (PDF)
Movie 1. Live imaging reveals the specific targeting of the CT-Fe2O3-NPs to primary cilia (MPG)
Movie 2. 3D rendering of a primary cilium (MPG)
Movie 3. Effect of a magnetic field on a cilium targeted by the superparamagnetic Fe2O3-NPs (MPG)
Movie 4. Intraciliary and cytosolic Ca2+ signaling in a PBS-treated control cell challenged with fluid shear-stress (MPG)
Movie 5. Intraciliary and cytosolic Ca2+ signaling in a fenoldopam-treated control cell challenged with fluid shear-stress (MPG)
Movie 6. Intraciliary and cytosolic Ca2+ signaling in a cCT-Fe2O3-NP-treated cell challenged with fluid shear-stress (MPG)
Movie 7. Intraciliary and cytosolic Ca2+ signaling in a CT-Fe2O3-NP-treated cell challenged with fluid shear-stress (MPG)
Movie 8. Intraciliary and cytosolic Ca2+ signaling in a cCT-M-Fe2O3-NP-treated cell exposed to a magnetic field (MPG)
Movie 9. Intraciliary and cytosolic Ca2+ signaling in a CT-M-Fe2O3-NP-treated cell exposed to a magnetic field (MPG)
Movie 10. Speed of a single blood cell in 48 hpf zebrafish (MPG)
Movie 11. Heart rate in 48 hpf zebrafish (MPG)
Movie 12. Working heart system (MPG)
The authors declare no competing financial interest.
REFERENCES
- (1).Chebib FT; Sussman CR; Wang X; Harris PC; Torres VE Vasopressin and Disruption of Calcium Signalling in Polycystic Kidney Disease. Nat. Rev. Nephrol 2015, 11, 451–464. [DOI] [PMC free article] [PubMed] [Google Scholar]
- (2).Chapman AB; Stepniakowski K; Rahbari-Oskoui F Hypertension in Autosomal Dominant Polycystic Kidney Disease. Adv. Chronic. Kidney. Dis 2010, 17, 153–163. [DOI] [PMC free article] [PubMed] [Google Scholar]
- (3).Quinlan RJ; Tobin JL; Beales PL Modeling Ciliopathies: Primary Cilia in Development and Disease. Curr. Top. Dev. Biol 2008, 84, 249–310. [DOI] [PubMed] [Google Scholar]
- (4).Nauli SM; Kawanabe Y; Kaminski JJ; Pearce WJ; Ingber DE; Zhou J Endothelial Cilia are Fluid Shear Sensors that Regulate Calcium Signaling and Nitric Oxide Production Through Polycystin-1. Circulation 2008, 117, 1161–71. [DOI] [PMC free article] [PubMed] [Google Scholar]
- (5).AbouAlaiwi WA; Takahashi M; Mell BR; Jones TJ; Ratnam S; Kolb RJ; Nauli SM Ciliary Polycystin-2 is A Mechanosensitive Calcium Channel Involved in Nitric Oxide Signaling Cascades. Circ. Res 2009, 104, 860–869. [DOI] [PMC free article] [PubMed] [Google Scholar]
- (6).Aboualaiwi WA; Muntean BS; Ratnam S; Joe B; Liu L; Booth RL; Rodriguez I; Herbert BS; Bacallao RL; Fruttiger M; Mak TW; Zhou J; Nauli SM Survivin-Induced Abnormal Ploidy Contributes to Cystic Kidney and Aneurysm Formation. Circulation 2014, 129, 660–672. [DOI] [PMC free article] [PubMed] [Google Scholar]
- (7).Masoumi A; Reed-Gitomer B; Kelleher C; Bekheirnia MR; Schrier RW Developments in the Management of Autosomal Dominant Polycystic Kidney Disease. Ther. Clin. Risk Manage 2008, 4, 393–407. [DOI] [PMC free article] [PubMed] [Google Scholar]
- (8).Kelleher CL; McFann KK; Johnson AM; Schrier RW Characteristics of Hypertension in Young Adults with Autosomal Dominant Polycystic Kidney Disease Compared with the General U.S. Population. Am. J. Hypertens 2004, 17, 1029–1034. [DOI] [PubMed] [Google Scholar]
- (9).Nakamura T; Sugaya T; Kawagoe Y; Ueda Y; Osada S; Koide H Candesartan Reduces Urinary Fatty Acid-Binding Protein Excretion in Patients with Autosomal Dominant Polycystic Kidney Disease. Am. J. Med. Sci 2005, 330, 161–165. [DOI] [PubMed] [Google Scholar]
- (10).Wang D; Strandgaard S The Pathogenesis of Hypertension in Autosomal Dominant Polycystic Kidney Disease. J. Hypertens 1997, 15, 925–933. [DOI] [PubMed] [Google Scholar]
- (11).Kathem SH; Mohieldin AM; Abdul-Majeed S; Ismail SH; Altaei QH; Alshimmari IK; Alsaidi MM; Khammas H; Nauli AM; Joe B; Nauli SM Ciliotherapy: A Novel Intervention in Polycystic Kidney Disease. J. Geriatr. Cardiol 2014, 11, 63–73. [DOI] [PMC free article] [PubMed] [Google Scholar]
- (12).Lorthioir A; Joannides R; Remy-Jouet I; Freguin-Bouilland C; Iacob M; Roche C; Monteil C; Lucas D; Renet S; Audrezet MP; Godin M; Richard V; Thuillez C; Guerrot D; Bellien J Polycystin Deficiency Induces Dopamine-Reversible Alterations in Flow-Mediated Dilatation and Vascular Nitric Oxide Release in Humans. Kidney Int. 2015, 87, 465–472. [DOI] [PubMed] [Google Scholar]
- (13).Niemczyk M; Pilecki T; Gradzik M; Bujko M; Niemczyk S; Paczek L Blood Pressure and Intracranial Aneurysms in Autosomal Dominant Polycystic Kidney Disease. Kidney Blood Pressure Res. 2014, 39, 630–635. [DOI] [PubMed] [Google Scholar]
- (14).Xu HW; Yu SQ; Mei CL; Li MH Screening for Intracranial Aneurysm in 355 Patients with Autosomal-Dominant Polycystic Kidney Disease. Stroke 2011, 42, 204–206. [DOI] [PubMed] [Google Scholar]
- (15).Schievink WI; Torres VE; Piepgras DG; Wiebers DO Saccular Intracranial Aneurysms in Autosomal Dominant Polycystic Kidney Disease. J. Am. Soc. Nephrol 1992, 3, 88–95. [DOI] [PubMed] [Google Scholar]
- (16).Schrier RW; Abebe KZ; Perrone RD; Torres VE; Braun WE; Steinman TI; Winklhofer FT; Brosnahan G; Czarnecki PG; Hogan MC; Miskulin DC; Rahbari-Oskoui FF; Grantham JJ; Harris PC; Flessner MF; Bae KT; Moore CG; Chapman AB; et al. Blood Pressure in Early Autosomal Dominant Polycystic Kidney Disease. N. Engl. J. Med 2014, 371, 2255–2266. [DOI] [PMC free article] [PubMed] [Google Scholar]
- (17).Hossack KF; Leddy CL; Johnson AM; Schrier RW; Gabow PA Echocardiographic Findings in Autosomal Dominant Polycystic Kidney Disease. N. Engl. J. Med 1988, 319, 907–912. [DOI] [PubMed] [Google Scholar]
- (18).Shamshirsaz AA; Bekheirnia RM; Kamgar M; Johnson AM; McFann K; Cadnapaphornchai M; Haghighi NN; Schrier RW Autosomal-Dominant Polycystic Kidney Disease in Infancy and Childhood: Progression and Outcome. Kidney Int. 2005, 68, 2218–2224. [DOI] [PubMed] [Google Scholar]
- (19).Abdul-Majeed S; Nauli SM Dopamine Receptor Type 5 in the Primary Cilia has Dual Chemo- and Mechano-Sensory Roles. Hypertension 2011, 58, 325–331. [DOI] [PMC free article] [PubMed] [Google Scholar]
- (20).Upadhyay VS; Muntean BS; Kathem SH; Hwang JJ; Aboualaiwi WA; Nauli SM Roles of Dopamine Receptor on Chemosensory and Mechanosensory Primary Cilia in Renal Epithelial Cells. Front. Physiol 2014, 5, 72. [DOI] [PMC free article] [PubMed] [Google Scholar]
- (21).Marley A; von Zastrow M DISC1 Regulates Primary Cilia that Display Specific Dopamine Receptors. PLoS One 2010, 5, No. e10902. [DOI] [PMC free article] [PubMed] [Google Scholar]
- (22).Spasic M; Jacobs CR Lengthening Primary Cilia Enhances Cellular Mechanosensitivity. Eur. Cell Mater 2017, 33, 158–168. [DOI] [PMC free article] [PubMed] [Google Scholar]
- (23).Pala R; Mohieldin A; Shamloo K; Sherpa R; Kathem S; Zhou J; Luan Z; Zheng JG; Ahsan A; Nauli S Personalized Nanotherapy by Specifically Targeting Cell Organelles to Improve Vascular Hypertension. Nano Lett. 2019, 19, 904–914. [DOI] [PMC free article] [PubMed] [Google Scholar]
- (24).Kalani MY; Vaidehi N; Hall SE; Trabanino RJ; Freddolino PL; Kalani MA; Floriano WB; Kam VW; Goddard WA 3rd. The Predicted 3D Structure of the Human D2 Dopamine Receptor and the Binding Site and Binding Affinities for Agonists and Antagonists. Proc. Natl. Acad. Sci. U. S. A 2004, 101, 3815–3820. [DOI] [PMC free article] [PubMed] [Google Scholar]
- (25).Mick DU; Rodrigues RB; Leib RD; Adams CM; Chien AS; Gygi SP; Nachury MV Proteomics of Primary Cilia by Proximity Labeling. Dev. Cell 2015, 35, 497–512. [DOI] [PMC free article] [PubMed] [Google Scholar]
- (26).Ishikawa H; Thompson J; Yates JR 3rd; Marshall WF Proteomic Analysis of Mammalian Primary Cilia. Curr. Biol 2012, 22, 414–419. [DOI] [PMC free article] [PubMed] [Google Scholar]
- (27).Pazour GJ; Agrin N; Leszyk J; Witman GB Proteomic Analysis of a Eukaryotic Cilium. J. Cell Biol 2005, 170, 103–113. [DOI] [PMC free article] [PubMed] [Google Scholar]
- (28).Avasthi P; Marley A; Lin H; Gregori-Puigjane E; Shoichet BK; von Zastrow M; Marshall WF A Chemical Screen Identifies Class A G-Protein Coupled Receptors as Regulators of Cilia. ACS Chem. Biol 2012, 7, 911–919. [DOI] [PMC free article] [PubMed] [Google Scholar]
- (29).Nonaka S; Shiratori H; Saijoh Y; Hamada H Determination of Left-Right Patterning of the Mouse Embryo by Artificial Nodal Flow. Nature 2002, 418, 96–99. [DOI] [PubMed] [Google Scholar]
- (30).Evans BA; Shields AR; Carroll RL; Washburn S; Falvo MR; Superfine R Magnetically Actuated Nanorod Arrays as Biomimetic Cilia. Nano Lett. 2007, 7, 1428–1434. [DOI] [PubMed] [Google Scholar]
- (31).Lee KL; Guevarra MD; Nguyen AM; Chua MC; Wang Y; Jacobs CR The Primary Cilium Functions as a Mechanical and Calcium Signaling Nexus. Cilia 2015, 4, 7. [DOI] [PMC free article] [PubMed] [Google Scholar]
- (32).Yuan S; Zhao L; Brueckner M; Sun Z Intraciliary Calcium Oscillations Initiate Vertebrate Left-Right Asymmetry. Curr. Biol 2015, 25, 556–567. [DOI] [PMC free article] [PubMed] [Google Scholar]
- (33).Jin X; Mohieldin AM; Muntean BS; Green JA; Shah JV; Mykytyn K; Nauli SM Cilioplasm is a Cellular Compartment for Calcium Signaling in Response to Mechanical and Chemical Stimuli. Cell. Mol. Life Sci 2014, 71, 2165–2178. [DOI] [PMC free article] [PubMed] [Google Scholar]
- (34).Su S; Phua SC; DeRose R; Chiba S; Narita K; Kalugin PN; Katada T; Kontani K; Takeda S; Inoue T Genetically Encoded Calcium Indicator Illuminates Calcium Dynamics in Primary Cilia. Nat. Methods 2013, 10, 1105–1107. [DOI] [PMC free article] [PubMed] [Google Scholar]
- (35).Delling M; Indzhykulian AA; Liu X; Li Y; Xie T; Corey DP; Clapham DE Primary Cilia are not Calcium-Responsive Mechanosensors. Nature 2016, 531, 656–660. [DOI] [PMC free article] [PubMed] [Google Scholar]
- (36).Erdelyi M; Sinko J; Kakonyi R; Kelemen A; Rees E; Varga D; Szabo G Origin and Compensation of Imaging Artefacts in Localization-Based Super-Resolution Microscopy. Methods 2015, 88, 122–132. [DOI] [PubMed] [Google Scholar]
- (37).Gerhold KA; Schwartz MA Ion Channels in Endothelial Responses to Fluid Shear Stress. Physiology 2016, 31, 359–369. [DOI] [PMC free article] [PubMed] [Google Scholar]
- (38).Ando J; Yamamoto K Flow Detection and Calcium Signalling in Vascular Endothelial Cells. Cardiovasc. Res 2013, 99, 260–268. [DOI] [PubMed] [Google Scholar]
- (39).Wheway G; Nazlamova L; Hancock JT Signaling Through the Primary Cilium. Front. Cell Dev. Biol 2018, 6, 8. [DOI] [PMC free article] [PubMed] [Google Scholar]
- (40).Abdul-Majeed S; Moloney BC; Nauli SM Mechanisms Regulating Cilia Growth and Cilia Function in Endothelial Cells. Cell. Mol. Life Sci 2012, 69, 165–173. [DOI] [PMC free article] [PubMed] [Google Scholar]
- (41).Besschetnova TY; Kolpakova-Hart E; Guan Y; Zhou J; Olsen BR; Shah JV Identification of Signaling Pathways Regulating Primary Cilium Length and Flow-Mediated Adaptation. Curr. Biol 2010, 20, 182–187. [DOI] [PMC free article] [PubMed] [Google Scholar]
- (42).Reiter JF; Blacque OE; Leroux MR The Base of The Cilium: Roles for Transition Fibres and the Transition Zone in Ciliary Formation, Maintenance and Compartmentalization. EMBO Rep. 2012, 13, 608–618. [DOI] [PMC free article] [PubMed] [Google Scholar]
- (43).Hu Q; Nelson WJ Ciliary Diffusion Barrier: The Gatekeeper for the Primary Cilium Compartment. Cytoskeleton 2011, 68, 313–324. [DOI] [PMC free article] [PubMed] [Google Scholar]
- (44).Doerr N; Wang Y; Kipp KR; Liu G; Benza JJ; Pletnev V; Pavlov TS; Staruschenko A; Mohieldin AM; Takahashi M; Nauli SM; Weimbs T Regulation of Polycystin-1 Function by Calmodulin Binding. PLoS One 2016, 11, No. e0161525. [DOI] [PMC free article] [PubMed] [Google Scholar]
- (45).Franco I; Margaria JP; De Santis MC; Ranghino A; Monteyne D; Chiaravalli M; Pema M; Campa CC; Ratto E; Gulluni F; Perez-Morga D; Somlo S; Merlo GR; Boletta A; Hirsch E Phosphoinositide 3-Kinase-C2alpha Regulates Polycystin-2 Ciliary Entry and Protects Against Kidney Cyst Formation. J. Am. Soc. Nephrol 2016, 27, 1135–1144. [DOI] [PMC free article] [PubMed] [Google Scholar]
- (46).Maskey D; Marlin MC; Kim S; Kim S; Ong EC; Li G; Tsiokas L Cell Cycle-Dependent Ubiquitylation and Destruction of NDE1 by CDK5-FBW7 Regulates Ciliary Length. EMBO J. 2015, 34, 2424–2440. [DOI] [PMC free article] [PubMed] [Google Scholar]
- (47).Belzile O; Hernandez-Lara CI; Wang Q; Snell WJ Regulated Membrane Protein Entry Into Flagella is Facilitated by Cytoplasmic Microtubules and Does not Require IFT. Curr. Biol 2013, 23, 1460–1465. [DOI] [PMC free article] [PubMed] [Google Scholar]
- (48).Low SH; Vasanth S; Larson CH; Mukherjee S; Sharma N; Kinter MT; Kane ME; Obara T; Weimbs T Polycystin-1, STAT6, and P100 Function in a Pathway that Transduces Ciliary Mechanosensation and is Activated in Polycystic Kidney Disease. Dev. Cell 2006, 10, 57–69. [DOI] [PubMed] [Google Scholar]
- (49).Green DJ; Dawson EA; Groenewoud HM; Jones H; Thijssen DH Is Flow-Mediated Dilation Nitric Oxide Mediated?: A Meta-Analysis. Hypertension 2014, 63, 376–382. [DOI] [PubMed] [Google Scholar]
- (50).Huang PL; Huang Z; Mashimo H; Bloch KD; Moskowitz MA; Bevan JA; Fishman MC Hypertension in Mice Lacking the Gene for Endothelial Nitric Oxide Synthase. Nature 1995, 377, 239–242. [DOI] [PubMed] [Google Scholar]
- (51).Kim S; Lee KS; Choi S; Kim J; Lee DK; Park M; Park W; Kim TH; Hwang JY; Won MH; Lee H; Ryoo S; Ha KS; Kwon YG; Kim YM NF-kappaB-Responsive miRNA-31–5p Elicits Endothelial Dysfunction Associated With Preeclampsia via Downregulation of Endothelial Nitric Oxide Synthase. J. Biol. Chem 2018, 293, 18989. [DOI] [PMC free article] [PubMed] [Google Scholar]
- (52).Spiranec K; Chen W; Werner F; Nikolaev VO; Naruke T; Koch F; Werner A; Eder-Negrin P; Dieguez-Hurtado R; Adams RH; Baba HA; Schmidt H; Schuh K; Skryabin BV; Movahedi K; Schweda F; Kuhn M Endothelial C-Type Natriuretic Peptide Acts on Pericytes to Regulate Microcirculatory Flow and Blood Pressure. Circulation 2018, 138, 494–508. [DOI] [PubMed] [Google Scholar]
- (53).Arif Pavel M; Lv C; Ng C; Yang L; Kashyap P; Lam C; Valentino V; Fung HY; Campbell T; Møller SG; Zenisek D; Holtzman NG; Yu Y Function and Regulation of TRPP2 Ion Channel Revealed by a Gain-of-Function Mutant. Proc. Natl. Acad. Sci. U. S. A 2016, 113, E2363–E2372. [DOI] [PMC free article] [PubMed] [Google Scholar]
- (54).Le Corre S; Eyre D; Drummond IA Modulation of the Secretory Pathway Rescues Zebrafish Polycystic Kidney Disease Pathology. J. Am. Soc. Nephrol 2014, 25, 1749–1759. [DOI] [PMC free article] [PubMed] [Google Scholar]
- (55).Fisher S; Halpern ME Patterning the Zebrafish Axial Skeleton Requires Early Chordin Function. Nat. Genet 1999, 23, 442–446. [DOI] [PubMed] [Google Scholar]
- (56).Li Y; Klena NT; Gabriel GC; Liu X; Kim AJ; Lemke K; Chen Y; Chatterjee B; Devine W; Damerla RR; Chang C; Yagi H; San Agustin JT; Thahir M; Anderton S; Lawhead C; Vescovi A; Pratt H; Morgan J; Haynes L; et al. Global Genetic Analysis in Mice Unveils Central Role for Cilia in Congenital Heart Disease. Nature 2015, 521, 520–524. [DOI] [PMC free article] [PubMed] [Google Scholar]
- (57).Stone GW; McCullough PA; Tumlin JA; Lepor NE; Madyoon H; Murray P; Wang A; Chu AA; Schaer GL; Stevens M; Wilensky RL; O’Neill WW Fenoldopam Mesylate for the Prevention of Contrast-Induced Nephropathy: A Randomized Controlled Trial. JAMA 2003, 290, 2284–2291. [DOI] [PubMed] [Google Scholar]
- (58).Murphy MB; Murray C; Shorten GD Fenoldopam: A Selective Peripheral Dopamine-Receptor Agonist for the Treatment of Severe Hypertension. N. Engl. J. Med 2001, 345, 1548–1557. [DOI] [PubMed] [Google Scholar]
- (59).Kisanuki YY; Hammer RE; Miyazaki J; Williams SC; Richardson JA; Yanagisawa M Tie2-Cre Transgenic Mice: A New Model for Endothelial Cell-Lineage Analysis In Vivo. Dev. Biol 2001, 230, 230–242. [DOI] [PubMed] [Google Scholar]
- (60).Cadnapaphornchai MA; McFann K; Strain JD; Masoumi A; Schrier RW Prospective Change in Renal Volume and Function in Children with ADPKD. Clin. J. Am. Soc. Nephrol 2009, 4, 820–829. [DOI] [PMC free article] [PubMed] [Google Scholar]
- (61).Luscher TF; Wanner C; Siegenthaler W; Vetter W Simple Renal Cyst and Hypertension: Cause or Coincidence? Clin. Nephrol 1986, 26, 91–95. [PubMed] [Google Scholar]
- (62).Proietti M; Romiti GF; Olshansky B; Lip GYH Systolic Blood Pressure Visit-to-Visit Variability and Major Adverse Outcomes in Atrial Fibrillation: The AFFIRM Study (Atrial Fibrillation Follow-Up Investigation of Rhythm Management). Hypertension 2017, 70, 949–958. [DOI] [PubMed] [Google Scholar]
- (63).Yiu KH; Tse HF Hypertension and Cardiac Arrhythmias: A Review of the Epidemiology, Pathophysiology and Clinical Implications. J. Hum. Hypertens 2008, 22, 380–388. [DOI] [PubMed] [Google Scholar]
- (64).Yallapu MM; Foy SP; Jain TK; Labhasetwar V PEGFunctionalized Magnetic Nanoparticles for Drug Delivery and MagneticResonance Imaging Applications. Pharm. Res 2010, 27, 2283–2295. [DOI] [PMC free article] [PubMed] [Google Scholar]
- (65).Jain TK; Richey J; Strand M; Leslie-Pelecky DL; Flask CA; Labhasetwar V Magnetic Nanoparticles with Dual Functional Properties: Drug Delivery and Magnetic Resonance Imaging. Biomaterials 2008, 29, 4012–4021. [DOI] [PMC free article] [PubMed] [Google Scholar]
- (66).Mohieldin AM; Haymour HS; Lo ST; AbouAlaiwi WA; Atkinson KF; Ward CJ; Gao M; Wessely O; Nauli SM Protein Composition and Movements of Membrane Swellings Associated with Primary Cilia. Cell. Mol. Life Sci 2015, 72, 2415–2429. [DOI] [PMC free article] [PubMed] [Google Scholar]
- (67).Nauli SM; Jin X; AbouAlaiwi WA; El-Jouni W; Su X; Zhou J Non-Motile Primary Cilia as Fluid Shear Stress Mechanosensors. Methods Enzymol. 2013, 525, 1–20. [DOI] [PMC free article] [PubMed] [Google Scholar]
- (68).Schwartz EA; Leonard ML; Bizios R; Bowser SS Analysis and Modeling of the Primary Cilium Bending Response to Fluid Shear. Am. J. Physiol 1997, 272, F132–8. [DOI] [PubMed] [Google Scholar]
- (69).Stanley SA; Sauer J; Kane RS; Dordick JS; Friedman JM Remote Regulation of Glucose Homeostasis in Mice Using Genetically Encoded Nanoparticles. Nat. Med 2015, 21, 92–98. [DOI] [PMC free article] [PubMed] [Google Scholar]
- (70).Folkesson M; Sadowska N; Vikingsson S; Karlsson M; Carlhall CJ; Lanne T; Wagsater D; Jensen L Differences in Cardiovascular Toxicities Associated with Cigarette Smoking and Snuff Use Revealed Using Novel Zebrafish Models. Biol. Open 2016, 5, 970–978. [DOI] [PMC free article] [PubMed] [Google Scholar]
- (71).Bloom CA; Labato MA; Hazarika S; Court MH Preliminary Pharmacokinetics and Cardiovascular Effects of Fenoldopam Continuous Rate Infusion in Six Healthy Dogs. J. Vet. Pharmacol. Ther 2012, 35, 224–230. [DOI] [PMC free article] [PubMed] [Google Scholar]
Associated Data
This section collects any data citations, data availability statements, or supplementary materials included in this article.