

Abstract
Primary cilia are sensory organelles that regulate cell cycle and signaling pathways. In addition to its association with cancer, dysfunction of primary cilia is responsible for the pathogenesis of polycystic kidney disease (PKD) and other ciliopathies. Because the association between cilia formation or length and cell cycle or division is poorly understood, we here evaluated their correlation in this study. Using Spectral Karyotyping (SKY) technique, we showed that PKD and the cancer/tumorigenic epithelial cells PC3, DU145, and NL20-TA were associated with abnormal ploidy. We also showed that PKD and the cancer epithelia were highly proliferative. Importantly, the cancer epithelial cells had a reduction in the presence and/or length of primary cilia relative to the normal kidney (NK) cells. We then used rapamycin to restore the expression and length of primary cilia in these cells. Our subsequent analyses indicated that both the presence and length of primary cilia were inversely correlated with cell proliferation. Collectively, our data suggest that restoring the presence and/or length of primary cilia may serve as a novel approach to inhibit cancer cell proliferation.
Keywords: Cancer, Polycystic kidney disease, Proliferation, Karyotyping, Wnt signalling
Graphical Abstract

1. Introduction
Most of the non-hematological cells in humans display sensory primary cilia, which are expressed on the cell surface [1]. Primary cilia act as antennae that transmit extracellular signals into intracellular biochemical responses. Primary cilia regulate cell signaling and key cellular processes, such as proliferation, differentiation, and migration [2–5]. Genetic mutations that disrupt the function of primary cilia can therefore result in a diverse set of diseases called ciliopathies. These disorders involve not only rare congenital syndromes like Joubert syndrome, Bardet-Biedl syndrome, and Meckel syndrome, but also more common diseases such as polycystic kidney disease (PKD) [6–10]. Furthermore, cancer has been proposed as a ciliopathy [11]. The most essential role of cilia in cancer pathogenesis is presumably its regulation on cell cycle and malignancy-related signaling pathways [12–14].
The structure of the cilium can be divided into 3 parts: the basal body, the axoneme, and the transition zone. The timing of cilium formation or ciliogenesis is controlled by the phases of cell cycle [15,16]. Formation of primary cilia typically begins at the G1/G0 phase of the cell cycle when the mother centriole in the centrosome acts as a basal body to start cilia formation [17,18]. As cells re-enter the cell cycle, the cilium and the basal body disassembled releasing the centrioles to work as the organizing center for the mitotic spindles during cell division [19,20]. As the cells enter the quiescence or resting phase, the mother centriole forms the basal body and the primary cilium reassembled. According to this finding [18,21], primary cilia develop only in quiescent or differentiated cells; therefore, as the proliferation index increases, the number of ciliated cells decrease [22]. Thus, cilium has been hypothesized to regulate the cell cycle and is thought to halt abnormal cell growth by restricting cell cycle [16].
Previous studies report reduction or loss of primary cilia in a variety of cancer types, such as pancreatic cancer, renal cell carcinoma, breast cancer, and cholangiocarcinoma [7,9,23,24]. Loss of the primary cilia in cancer cells may induce cell proliferation and may also participate in abnormal cellular signaling associated with cancer or its formation. Jenks et. al. recently report that enhanced ciliogenesis can facilitate resistance to a number of kinase inhibitors [25]. They show that both acquired and de novo resistant cancer cells show an increase in cilia number, and length. Based on the collective evidence and observations, we thus hypothesize that cilia length is associated with cancer progression, and specific pathways in cilia associated with cancer cell cycle can be modulated.
The major ciliary signaling pathways include the Hedgehog [14], Wnt [26] and Platelet-Derived Growth Factor [27]. In particular, Wnt signaling pathway modulates the balance between cellular differentiation, polarity controls and proliferation to regulate tissue homeostasis [1,28]. The presence of primary cilium controls the expression levels of Wnt target genes by regulating the degradation of Disheveled (Dvl), a protein that is recruited to the membrane and binds axin to prevent β-catenin degradation. Specifically, inversin and nephrolithiasis-3 localized in the primary cilium are involved in the regulation of Dvl level [26,29]. In addition, sequestering ciliary protein AHI1 to the cilium has been shown to prevent β-catenin to translocate into the nucleus [30].
In this study, we characterized the presence and the length of primary cilia in human cancer cells. We also examined the correlation between primary cilia expression and Wnt signaling pathway. We showed that primary cilia presence and length are reduced in cancer. Moreover, we demonstrated that this loss of primary cilia is associated with an increase in the baseline β-catenin level as a measure of Wnt signaling. Because recent studies have shown that cilia length in vascular endothelia and renal epithelia of normal and cancer tissues can be regulated pharmacologically [31,32], we further aimed to restore primary cilia expression in cancer cells using sirolimus (or rapamycin). Our goal was to understand the relationship among Wnt signaling pathway, cell proliferation and primary cilia.
2. Materials and methods
2.1. Cell lines and culture conditions
Only human epithelial cells were used in our studies. Both normal kidney (NK) and PKD2 cells with abnormal cilia function (PKD) have been previously characterized [33,34]. NK has fully functional primary cilia, while PKD is a well-known model for dysfunctional cilia; thus, we used them as controls in our study. Human prostate cancer cells PC3 (ATCC CRL-1435) [35], DU145 (ATCC HTB-81) [36] and bronchial tumorigenic epithelial cells NL20-TA or NL (ATCC CRL-2504) [37] were obtained from the American Type Culture Collection (ATCC, Manassas, VA). We used these epithelial cells to obtain independent correlation between hyperproliferation and cilia length or cilia formation in the presence or absence of rapamycin (AK Scientific, Union City, CA) treatment. Thus, the presence studies were to examine if there was a correlation in the changes between hyperproliferation and cilia length or cilia formation using these human epithelial cell lines. Cells were supplied with epithelia growth medium (PromoCell, Heidelberg, Germany) supplemented with 15% fetal bovine serum (FBS; Seradignm, Radnor, PA), and were maintained in 5% CO2 at 37 °C under humidified culture conditions. In the experiments that cell confluence was required to induce cilia formation, the cultured cells were incubated with media containing 2% FBS and 0, 1 or 10 μM of rapamycin for 1, 3, and 8 days [31,32,38]. For the 8-days treatment, the media and rapamycin were replaced with the fresh preparation on the fourth day. Both concentrations and durations of rapamycin treatment had also been used in previous studies [31,32].
2.2. Spectral Karyotyping (HiSKY)
We have previously described this methodology in detail [39]. Briefly, after the cells were grown to 60–70% confluent, 0.05 μg/ml of colcemid solution (Adipogen, San Diego, CA) was added to the cells and incubated for 48 h. After harvesting the cells, they were incubated with a hypotonic solution (0.56% KCl) followed by a fixing solution (methanol/acetic acid). KCl, methanol and acetic were purchased from Fisher Scientific (Fair Lawn, NJ). The chromosomes were next spread on a slide and hybridized with a cocktail of human fluorescence-labeled probes specific for individual chromosomes (Applied Spectral Imaging, Carlsbad, CA). Data were analyzed with the HiSKY Spectral Imaging system from Applied Spectral Imaging.
2.3. Immunofluorescent staining
While cilia may lose some of their structural integrity upon fixation, certain fixation techniques can preserve the substructure of primary cilia and ciliary proteins [40,41]. Selecting a proper fixation method depends on which ciliary proteins are of interest to the investigators. Generally, proteins that are localized along the axoneme are best preserved with paraformaldehyde fixation. Since axoneme is a micro-tubule-rich structure that forms the core of primary cilia, antibodies against acetylated-α-tubulin can be used to detect axoneme. Paraformaldehyde fixation (10-min incubation at room temperature) provides a replicable result, maintains an intact microtubule cytoskeleton, and preserves the cytoskeletal labeling. The same technique was therefore used in our study to maintain consistency with what was already established in the cilia field [40,41].
Briefly, cells were seeded onto coverslips placed in six-well plates. After the cells have reached the required confluency (60–70%), they were cultured for the various time points in maintenance medium with or without rapamycin. The cells on the coverslips were then subjected to a 10 min-fixation using 4% paraformaldehyde (EMS, Hartfield, PA) and 2% sucrose (Fischer Scientific, Fair Lawn, NJ) in phosphate-buffered saline (PBS; Corning, Manassas, VA). After a PBS wash, the cells were permeabilized using 1% TritonX (Fischer Scientific, Fair Lawn, NJ) in PBS. Acetylated-α-tubulin antibody (1:10,000 dilution, Sigma Aldrich, St. Louis, MO; catalog# T6793) was added to the primary cilia and incubated overnight at 4 °C followed by a 1-hour incubation at room temperature with fluorescein isothiocyanate (FITC)-conjugated anti-mouse IgG secondary antibody (1:1000 dilution, Vector Labs Burlingame, CA; catalog# Fl-2000; lot# ZE0803). Actin filaments were stained by incubating the cells for 1 h at room temperature with Texas Red-conjugated phalloidin (1:400 dilution, Invitrogen, Carlsbad, CA; catalog# T7471, lot# 23749 W). Nuclei were stained with mounting media containing Dapi blue fluorescence (Vector Labs Burlingame, CA). The images of the primary cilia were captured by a fluorescence microscope, and their presence and length were analyzed by NIS-Elements software.
2.4. Cell growth
To quantify the growth rate of cells, cells were counted every day for 5 days. On day 0, 3×10⁵ cells were seeded and plated on 10 cm culture dishes supplied with growth medium. The evenly distributed cells in each dish were then counted every 24 h until they were 100% confluent.
2.5. Cell cycle and proliferation analyses
After harvesting the cells using trypsin (Corning, Manassas, VA), the cells were fixed using 95% ethanol and incubated at −20 °C overnight. In some experiment, cells were first labeled with 10 μM bromodeox-yuridine/fluorodeoxyuridine (BrdU; Acros Organics, Pittsburg, PA; catalog# AC228595000) for 1 h at 37 °C and 5% CO2. For DNA denaturing, the cells were incubated with 2 N HCl for 30 min at room temperature followed by neutralization with 0.1 M sodium borate for 30 min at room temperature. Afterwards, the cells were incubated with Alexa 488 conjugated BrdU antibody (Invitrogen, Carlsbad, CA; catalog# A21305, lot# 571730) for 1 h at room temperature in the dark for BrdU experiments. In other experiments, the cells were stained with propidium iodide (PI) for 1 h at room temperature in the dark. Cells were then analyzed with flow cytometry BDFacsverse.
2.6. Western blot analysis
Cells were lysed using lysis buffer (Thermoscientific, Rockford, IL) supplemented with protease inhibitor cocktail (Complete, Mannheim, Germany). The concentrations of protein were determined by using micro bicinchoninic acid assay (BCA) (Thermoscientific, Rockford, IL). A 30 μg of protein was prepared using 2x Laemmli sample buffer (BioRad, Hercules, CA) and loaded on a 10% SDS-polyacrylamide gel. The gel was run for 1–2 h at 120 V. After transferring the protein from the gel to the membrane (BioRad, Hercules, CA), the membrane was blocked with 5% non-fat dry milk (Lab Scientific, Livingston, NJ) for 2 h at room temperature. The membrane was then incubated overnight at 4 °C with primary antibodies specific for Gli1 Anti-Gli1 antibody (Abcam, Burlingame, CA; catalog# ab49314) [42], smo (LSBio, Seattle, WA; catalog# LS-A2666–50) [43], β-catenin (Abcam, Burlingame, CA; catalog# ab6302, lot# GR3314727–5) [44], phospho-mTOR (Ser2448) (Cell Signaling Technologies, Danver, MA; catalog #2976, clone# 49F9) [45], phospho-mTOR (Ser2481) (Cell Signaling Technologies, Danver, MA; catalog #2974) [45], phospho-p70 S6 Kinase (Thr389) (Cell Signaling Technologies, Danver, MA; catalog# 9234) [46] and β-actin (Cell Biolabs, San Diego, CA; catalog# AKR-002). Afterwards, the membrane was incubated with secondary anti-rabbit (catalog# 7074) or anti-mouse (catalog# 7076) HRP-linked antibody (Cell Signaling Technologies, Danver, MA) for 1 h at room temperature. The signals were analyzed by an imager (BioRad, Hercules, CA) after the membrane was subjected to SuperSignal West Pico PLUS Chemiluminescence Substrate (Thermoscientific, Rockford, IL; catalog# 34580, lot# UH290793).
2.7. β-catenin immunofluorescence
To differentiate nucleus and cytoplasmic β-catenin, cells were plated onto coverslips placed in six-well plates and allowed to grow to 50–70% confluency before treatments. After cells were treated for the different time points (0, 1, 3 and 8 days) in maintenance medium with or without rapamycin, cells were fixed using 4% paraformaldehyde and 2% sucrose in PBS for 10 min. For the 8-days treatment, the media and rapamycin were replaced with the fresh preparation on the fourth day. Cells then were washed with PBS and permeabilized using 1% TritonX in PBS. Next, cells were incubated with anti-β-catenin primary antibody (1:2000) at 4 °C overnight followed by a 1-hour incubation at room temperature with FITC-conjugated anti-rabbit IgG secondary antibody (1:1000 dilution, Vector Labs Burlingame, CA; catalog# Fl-1000, lot# ZC0202). Nuclei were stained with mounting media containing Dapi blue fluorescence. Images were acquired using NIS-Elements software. For analysis, all images were viewed and randomly captured at 100 × magnification. For quantification, cells were counted from three different microscopic fields. A region of interest (ROI) was randomly selected in the nucleus and cytoplasm. The ratio of FITC fluorescence in nucleus versus cytoplasm was determined by measuring the FITC fluorescence of the ROI in the nucleus and cytoplasm.
2.8. Data and statistical analysis
We used NIS-Elements software (version 4.3), Microsoft Excel (version 16.32), and GraphPad Prism (version 8.3) to analyze the presence and length of primary cilia. Whenever feasible, the data was confirmed to be normally distributed prior to the subsequent analyses. Otherwise, the data were transformed logarithmically. The slope of the growth curve was measured by fitting the curve into the sigmoidal-fitted graph. For Western blot analysis, band intensity was captured with Bio-Rad imager (Model no. Universal Hood III. Serial no. 731BR02716. version 5.1), quantified with the NIH Fiji ImageJ (version2.0), and analyzed with GraphPad. For all studies, a minimum of three independent experiments were performed. The exact number of independent experiments for each study is indicated in the scattered bar graphs or in the figure legends.
The correlation analyses were performed by using Pearson correlation coefficient test. Multiple variable analyses were further performed by using multiple-linear regression test. The Pearson correlation was studied before and after rapamycin treatment with 1-dimensional (before vs. after of one variable) or 2-dimensional (before vs. after of two variables) analysis. To clarify the correlation analyses, scattered plots (before vs. after) were provided to show the strength and weakness of Pearson correlation coefficient. For the 2-dimensional analysis, the correlation for the variables (slope) was first identified before (or after) treatment followed by the correlation before vs. after analysis in the corresponding scattered plot.
All data were reported as mean ± standard error of mean (SEM). A p value of < 0.05 was considered statistically significant. Statistical analysis comparing multiple groups was performed by using ANOVA test followed by Tukey’s post-test or Dunnet post-test. Significant differences relative to the control baseline within each group are indicated in asterisk (*). Differences with normal kidney (NK) epithelia are indicated in a hash sign (#). The level of significant difference (p value) is indicated in each graph and figure legends.
3. Results
3.1. PKD and cancer cells were characterized by abnormal ploidy
Because genomic instability has been associated with dysfunction of primary cilia [33,47–49], we studied chromosome numbers in PKD and cancer cells using SKY technique to authenticate our cells. Karyotyping analyses revealed that NK had a normal chromosomal composition (Fig. 1A). In contrast, PKD had abnormal ploidy (77,XX) (Fig. 1B). PC3 karyotyping analysis also showed abnormal ploidy (104,XY) (Fig. 1C). The abnormal polyploidy was also apparent in DU145 (72,XY) (Fig. 1D). Karyotyping analysis of NL showed an abnormal increase in the number of chromosomes (109,XX) (Fig. 1E). Overall, karyotype analysis of individual cells confirmed that the abnormal ploidy was associated with PKD and cancer cells (Fig. 1F). The chromosomal spread for each representative image is shown (Fig. 2). A more specific ploidity of each chromosome of each cell type is also presented (Table 1).
Fig. 1.
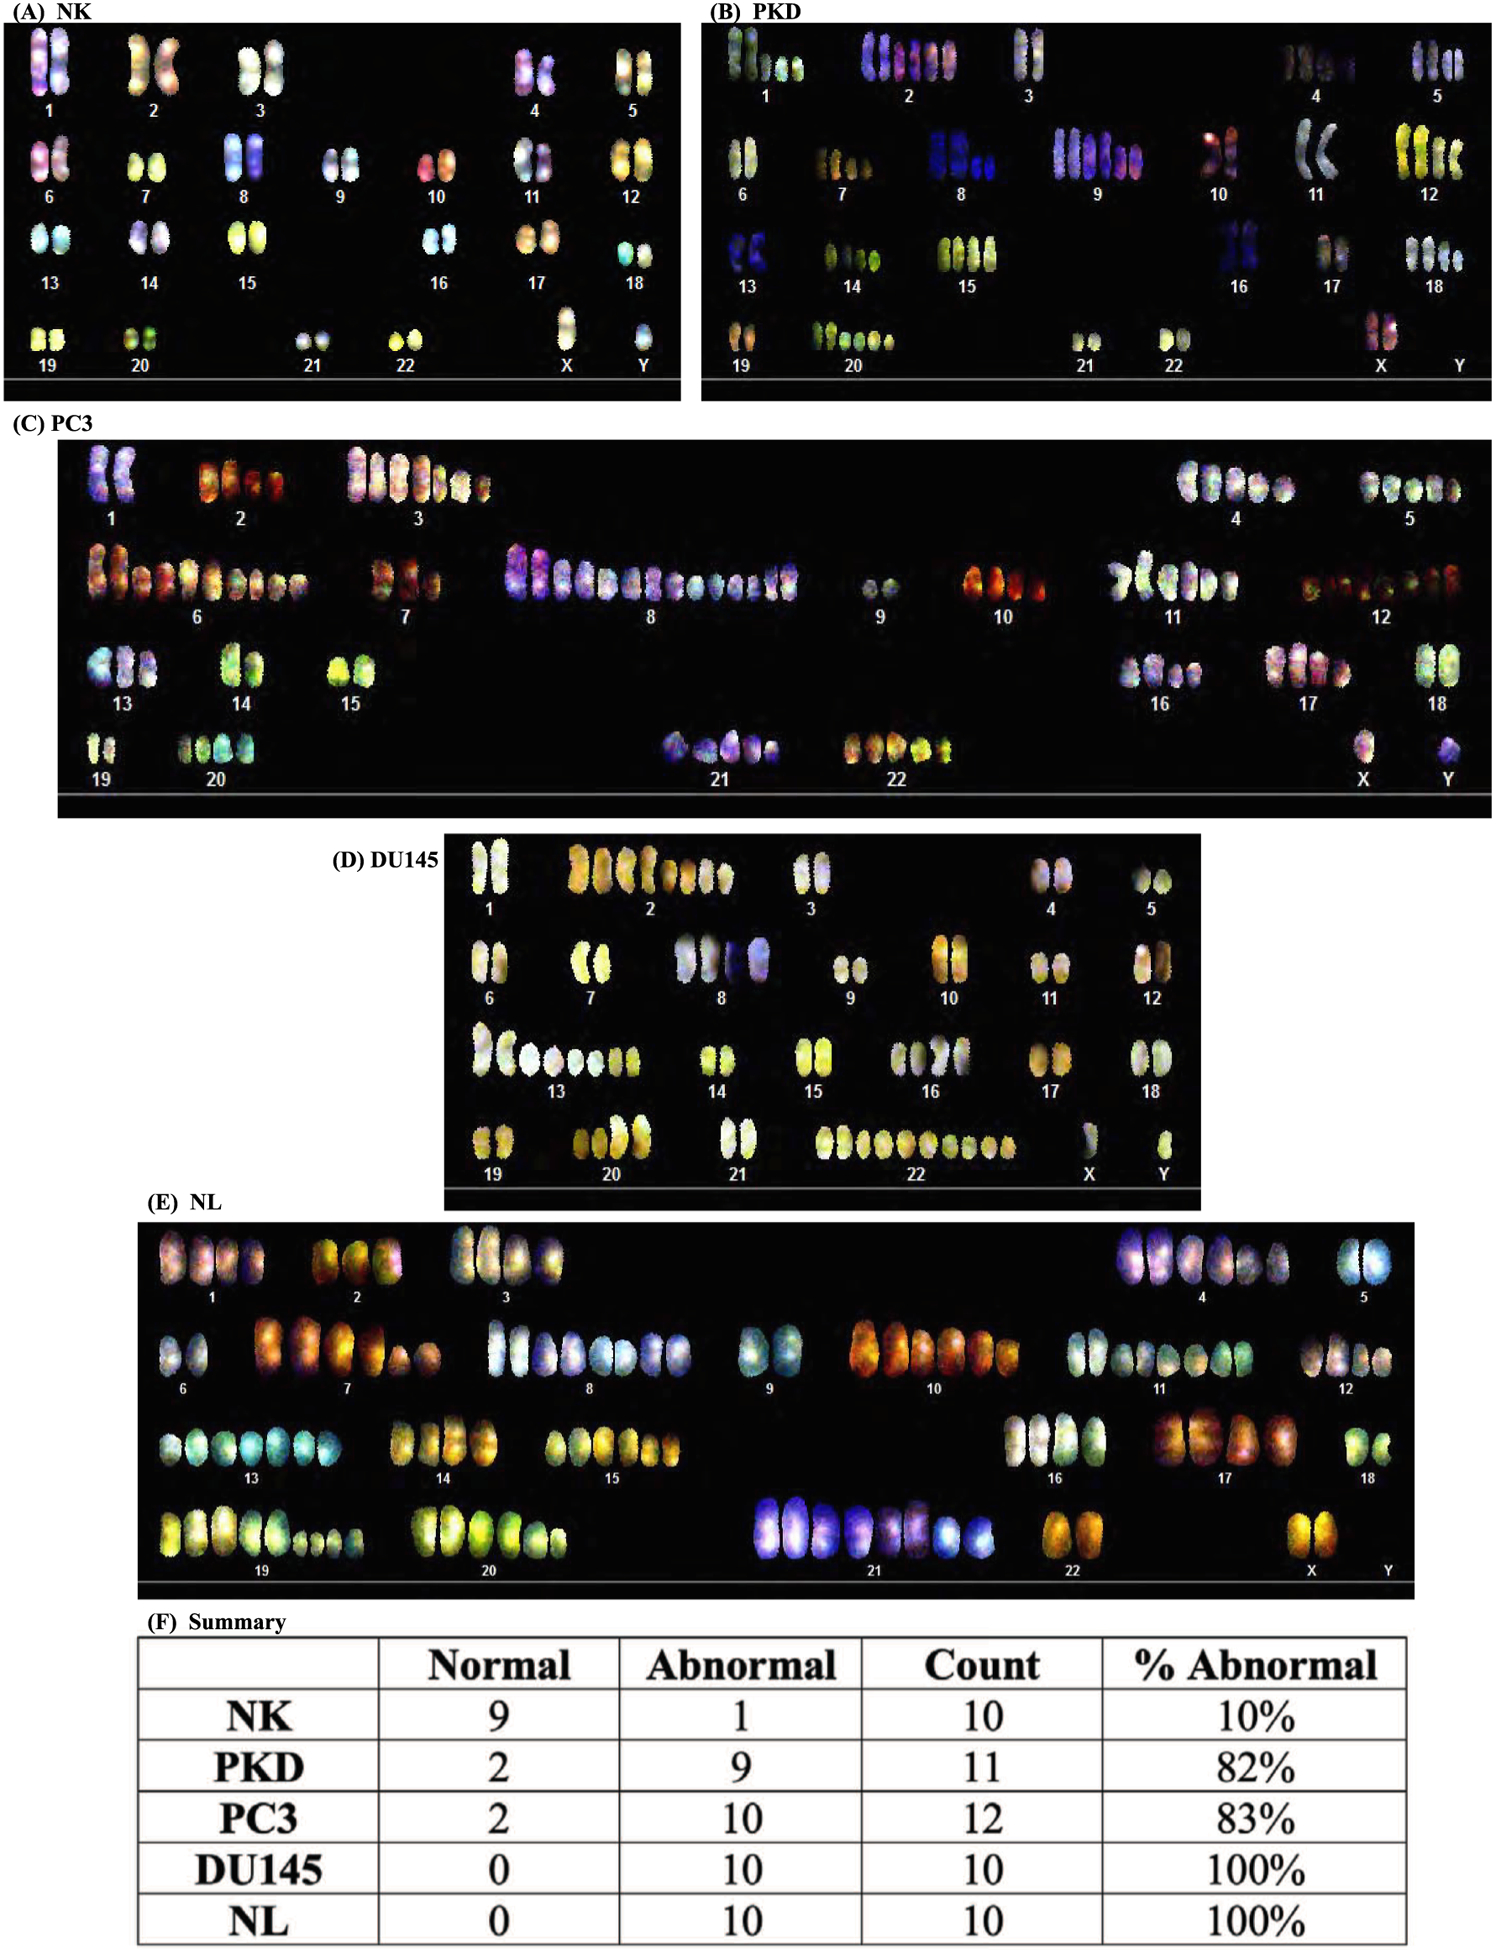
Karyotyping analyses of human epithelial cells. Spectral karyotyping shows somatic chromosomes (1 to 22) with a pair of sex chromosomes (XY). Representative images show epithelium from (A) normal kidney (NK) with normal chromosome number (46, XY), (B) PKD (77,XX), (C) PC3 prostate cancer (104,XY),(D) DU145 (72,XY), and (E) NL (109,XX). (F) Summary of overall karyotype analysis of individual cells confirmed the abnormal ploidy associated with PKD and cancer cells. N = 10–12 for each cell type.
Fig. 2.

Representative images of metaphase spread. Shown here are images in brightfield (on the left) and pseudocolored (on the right) of NK, PKD, PC3, DU145, and NL.
Table 1.
Chromosomal abnormality (frequency) in epithelia.
| Chromosome number | NK | PKD | PC3 | DU145 | NL |
|---|---|---|---|---|---|
| 1 | Normal | Polyploidy/Aneuploidy (9/11) | Normal | Normal | Polyploidy (10/10) |
| 2 | Normal | Polyploidy/Aneuploidy (9/11) | Polyploidy/Aneuploidy (10/12) | Polyploidy (10/10) | Polyploidy/Aneuploidy (10/10) |
| 3 | Normal | Normal | Polyploidy/Aneuploidy (10/12) | Normal | Polyploidy (10/10) |
| 4 | Normal | Polyploidy/Aneuploidy (9/11) | Polyploidy/Aneuploidy (10/12) | Normal | Polyploidy (10/10) |
| 5 | Normal | Polyploidy (9/11) | Polyploidy/Aneuploidy (10/12) | Normal | Normal |
| 6 | Normal | Normal | Polyploidy/Aneuploidy (10/12) | Normal | Normal |
| 7 | Aneuploidy (1/10) | Polyploidy/Aneuploidy (9/11) | Polyploidy/Aneuploidy (10/12) | Normal | Polyploidy (10/10) |
| 8 | Normal | Polyploidy (9/11) | Polyploidy/Aneuploidy (10/12) | Polyploidy (10/10) | Polyploidy (10/10) |
| 9 | Aneuploidy (1/10) | Polyploidy/Aneuploidy (9/11) | Normal | Normal | Normal |
| 10 | Polyploidy (1/10) | Normal | Polyploidy/Aneuploidy (10/12) | Normal | Polyploidy (10/10) |
| 11 | Normal | Normal | Polyploidy/Aneuploidy (10/12) | Normal | Polyploidy (10/10) |
| 12 | Normal | Polyploidy/Aneuploidy (9/11) | Polyploidy/Aneuploidy (10/12) | Normal | Polyploidy (10/10) |
| 13 | Normal | Normal | Polyploidy/Aneuploidy (10/12) | Polyploidy (10/10) | Polyploidy/Aneuploidy (10/10) |
| 14 | Normal | Polyploidy/Aneuploidy (9/11) | Normal | Normal | Polyploidy (10/10) |
| 15 | Normal | Polyploidy/Aneuploidy (9/11) | Normal | Normal | Polyploidy (10/10) |
| 16 | Normal | Normal | Polyploidy (10/12) | Polyploidy (10/10) | Polyploidy (10/10) |
| 17 | Polyploidy (1/10) | Normal | Polyploidy/Aneuploidy (10/12) | Normal | Polyploidy (10/10) |
| 18 | Normal | Polyploidy/Aneuploidy (9/11) | Normal | Normal | Normal |
| 19 | Normal | Normal | Normal | Normal | Polyploidy/Aneuploidy (10/10) |
| 20 | Normal | Polyploidy/Aneuploidy (9/11) | Polyploidy/Aneuploidy (10/12) | Polyploidy (10/10) | Polyploidy/Aneuploidy (10/10) |
| 21 | Aneuploidy (1/10) | Normal | Polyploidy/Aneuploidy (10/12) | Normal | Polyploidy (10/10) |
| 22 | Normal | Normal | Polyploidy/Aneuploidy (10/12) | Polyploidy (10/10) | Polyploidy/Aneuploidy (10/10) |
| X | Normal | Normal | Normal | Normal | Normal |
| Y | Normal | Normal | Normal |
Note: NK, normal kidney epithelia; PKD, polycystic kidney epithelia; PC3, prostate cancer epithelia; DU145, prostate cancer epithelia; NL, cancer lung epithelia.
3.2. Primary cilia expression was decreased in cancer cells
To characterize the expression of primary cilia in different cell types, the presence of cilia was determined by immunofluorescence using antibody against acetylated- α -tubulin (Fig. 3A). Actin filaments was stained with phalloidin and nuclei were stained with DAPI to simply identify individual cells. The representative images show that primary cilia were expressed in NK, PKD, and PC3, but they were absent in both DU145 and NL (Fig. 3B). Even though cilia were present in PC3, the percentages of the primary cilia were significantly lower than those observed in NK. However, there was no significant difference in cilia length among NK, PKD, and PC3. The distribution of cilia lengths in each cell type was tabulated (Fig. 3C).
Fig. 3.
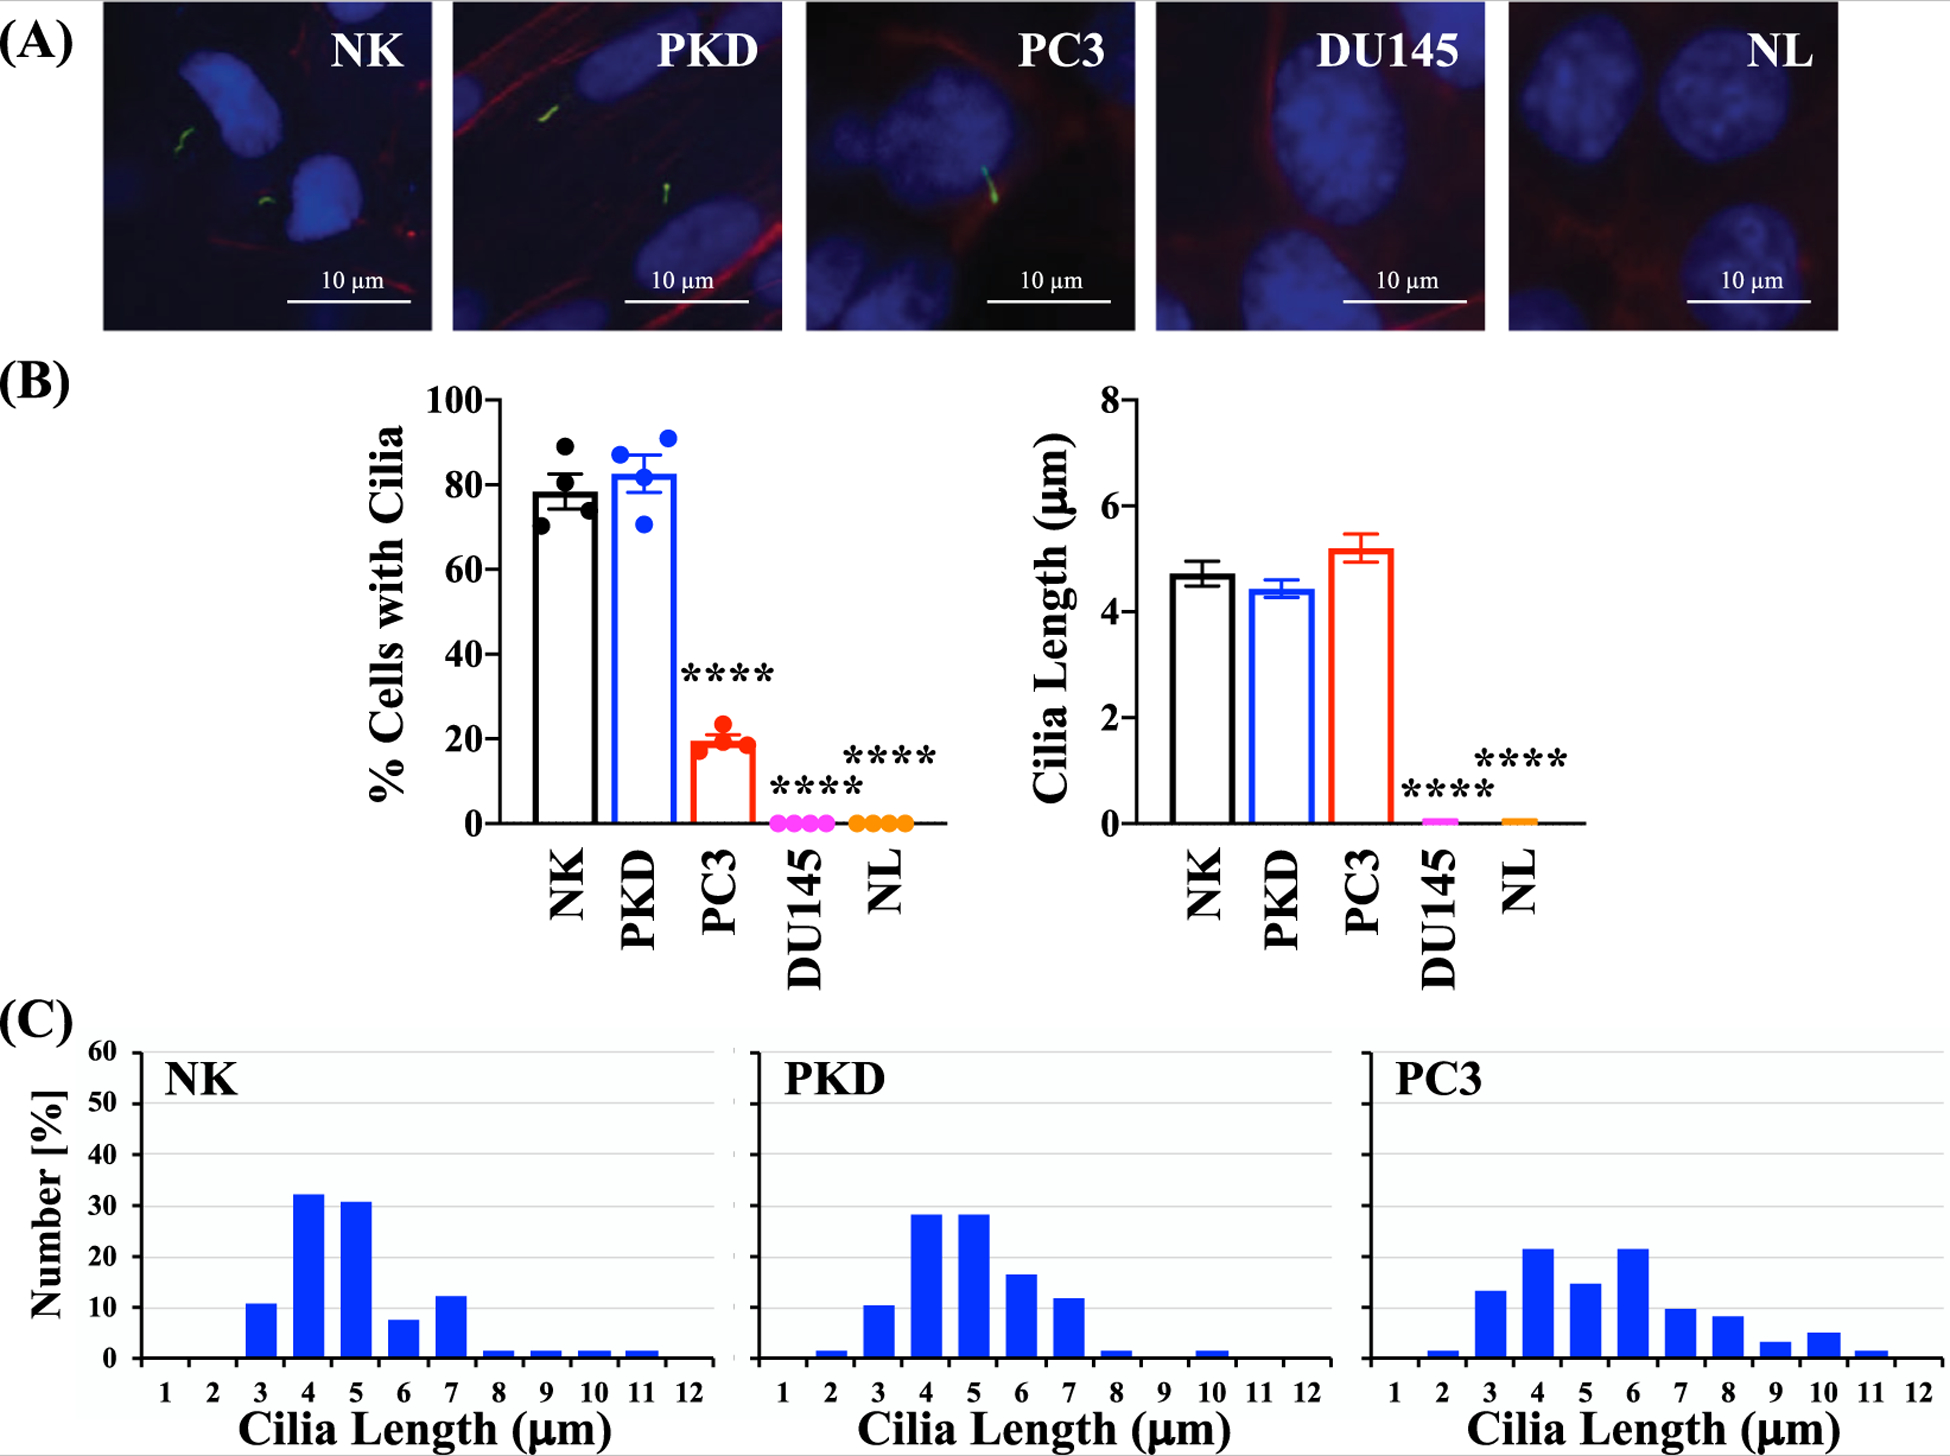
Evaluation of primary cilia expression and length in epithelial cells. (A) Representative images of primary cilia in human epithelial cells. Primary cilia were identified by immunofluorescence using antibody against acetylated α -tubulin (green); actin filaments using texas red-conjugated phalloidin (red); and nuclei using DAPI (blue). (B) The percent of cells with cilia and the average cilia length of each cell type. (C) Histograms depict the distribution of cilia lengths in each cell type. Values are represented as mean ± SEM. ****, p < 0.0001 compared with the control (NK) cells. N = 4 independent experiments.
3.3. PKD and cancer epithelia were highly proliferative
Since primary cilia play an important role in cell cycle regulation[16], we assessed the proliferation profile of each cell type. The growth rates of the five cell types over a period of five days were examined by counting the cell number every day (Fig. 4A). The growth rates were significantly higher in PKD and cancer cells than NK cells. We also assessed the proliferative index by examining the DNA contents because some of the cancer cells continued to divide even after they have become confluent. The relative percentage of cells in each phase (G1 and G2/M) was quantified and analyzed with flow cytometry. The post-analysis graphs (Fig. 4B) and pre-analysis histogram (Fig. 5) from flow cytometry studies are presented. In confluent condition, the percentage of the cells in the G2/M phase was significantly higher in PC3 and DU145 than NK. This effect was associated with lower percentage of PC3 and DU145 cells in the G1 phase. In non-confluent condition, there was a significant increase in the accumulation of the cells in the G2/M phase and a significant decrease in the accumulation of the cells in the G1 phase in PKD, PC3, DU145, and NL cells compared to NK. Our data indicated that compared to control normal NK cells, both PKD and cancer epithelia had higher proliferative rate.
Fig. 4.
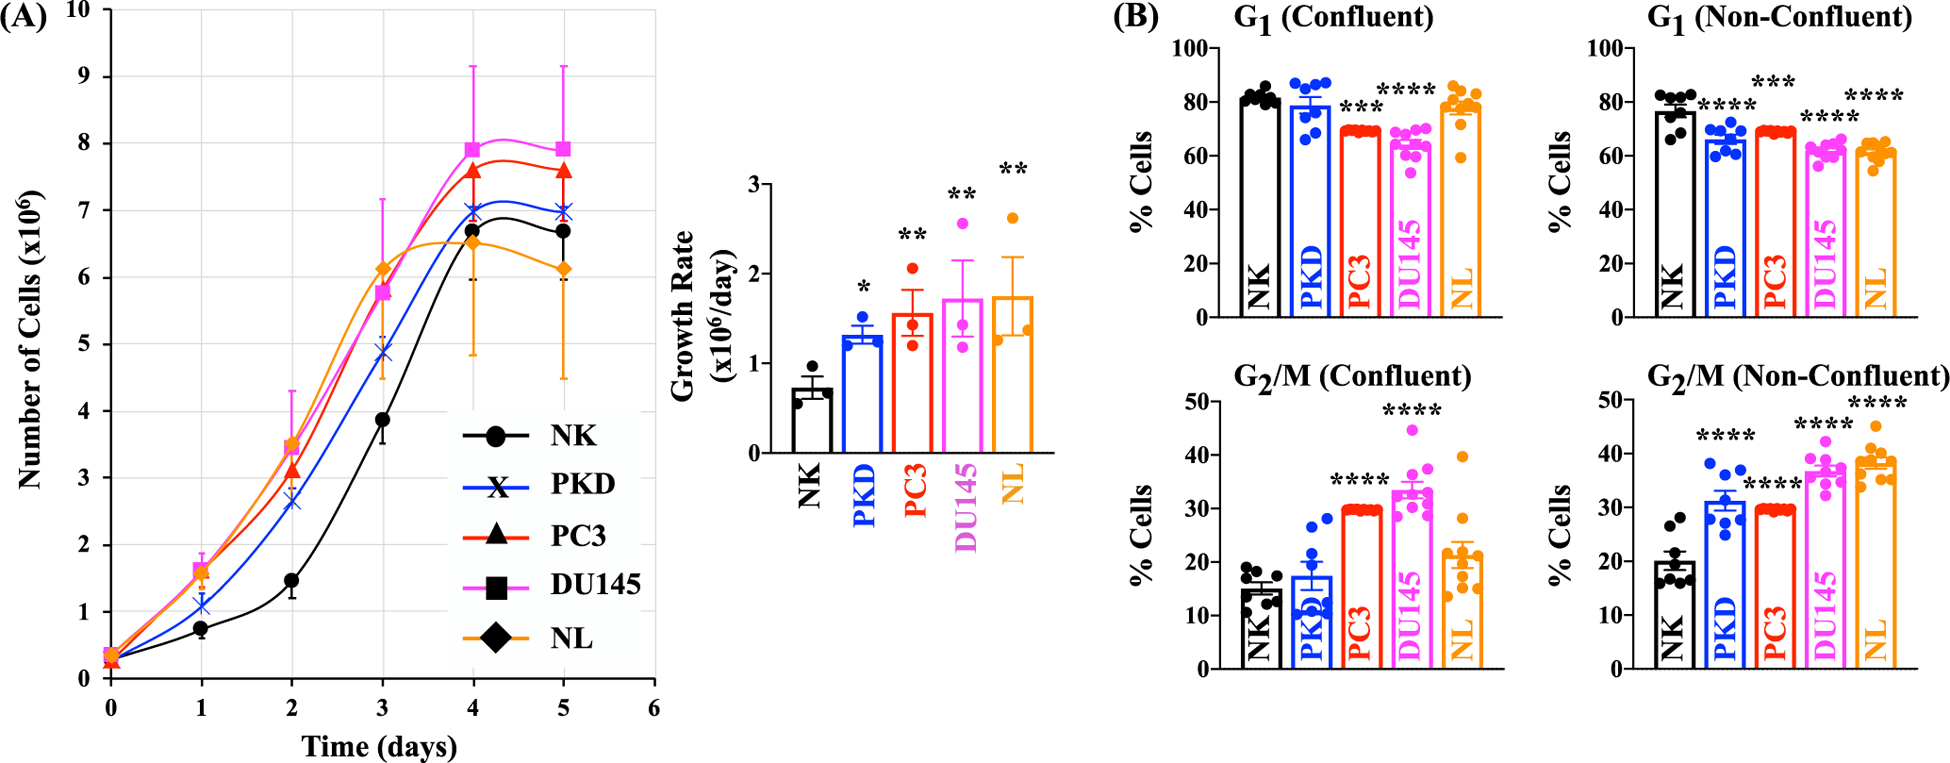
PKD and Cancer Epithelia were Highly Proliferative. (A) The growth rates of the five cell types over a period of five days were examined by counting the cell number in each of the five days. (B) Quantitation of cell cycle phases in selected cells using propidium iodide. The relative percentages of cells in G1 and G2/M under confluent condition or non-confluent condition are shown on this graph. Values are represented as mean ± SEM. *, p < 0.05; **, p < 0.01; ***, p < 0.001; and ****, p < 0.0001 compared with the control NK. N = 3 for cell growth; N = 8 for cell cycle analysis.
Fig. 5.
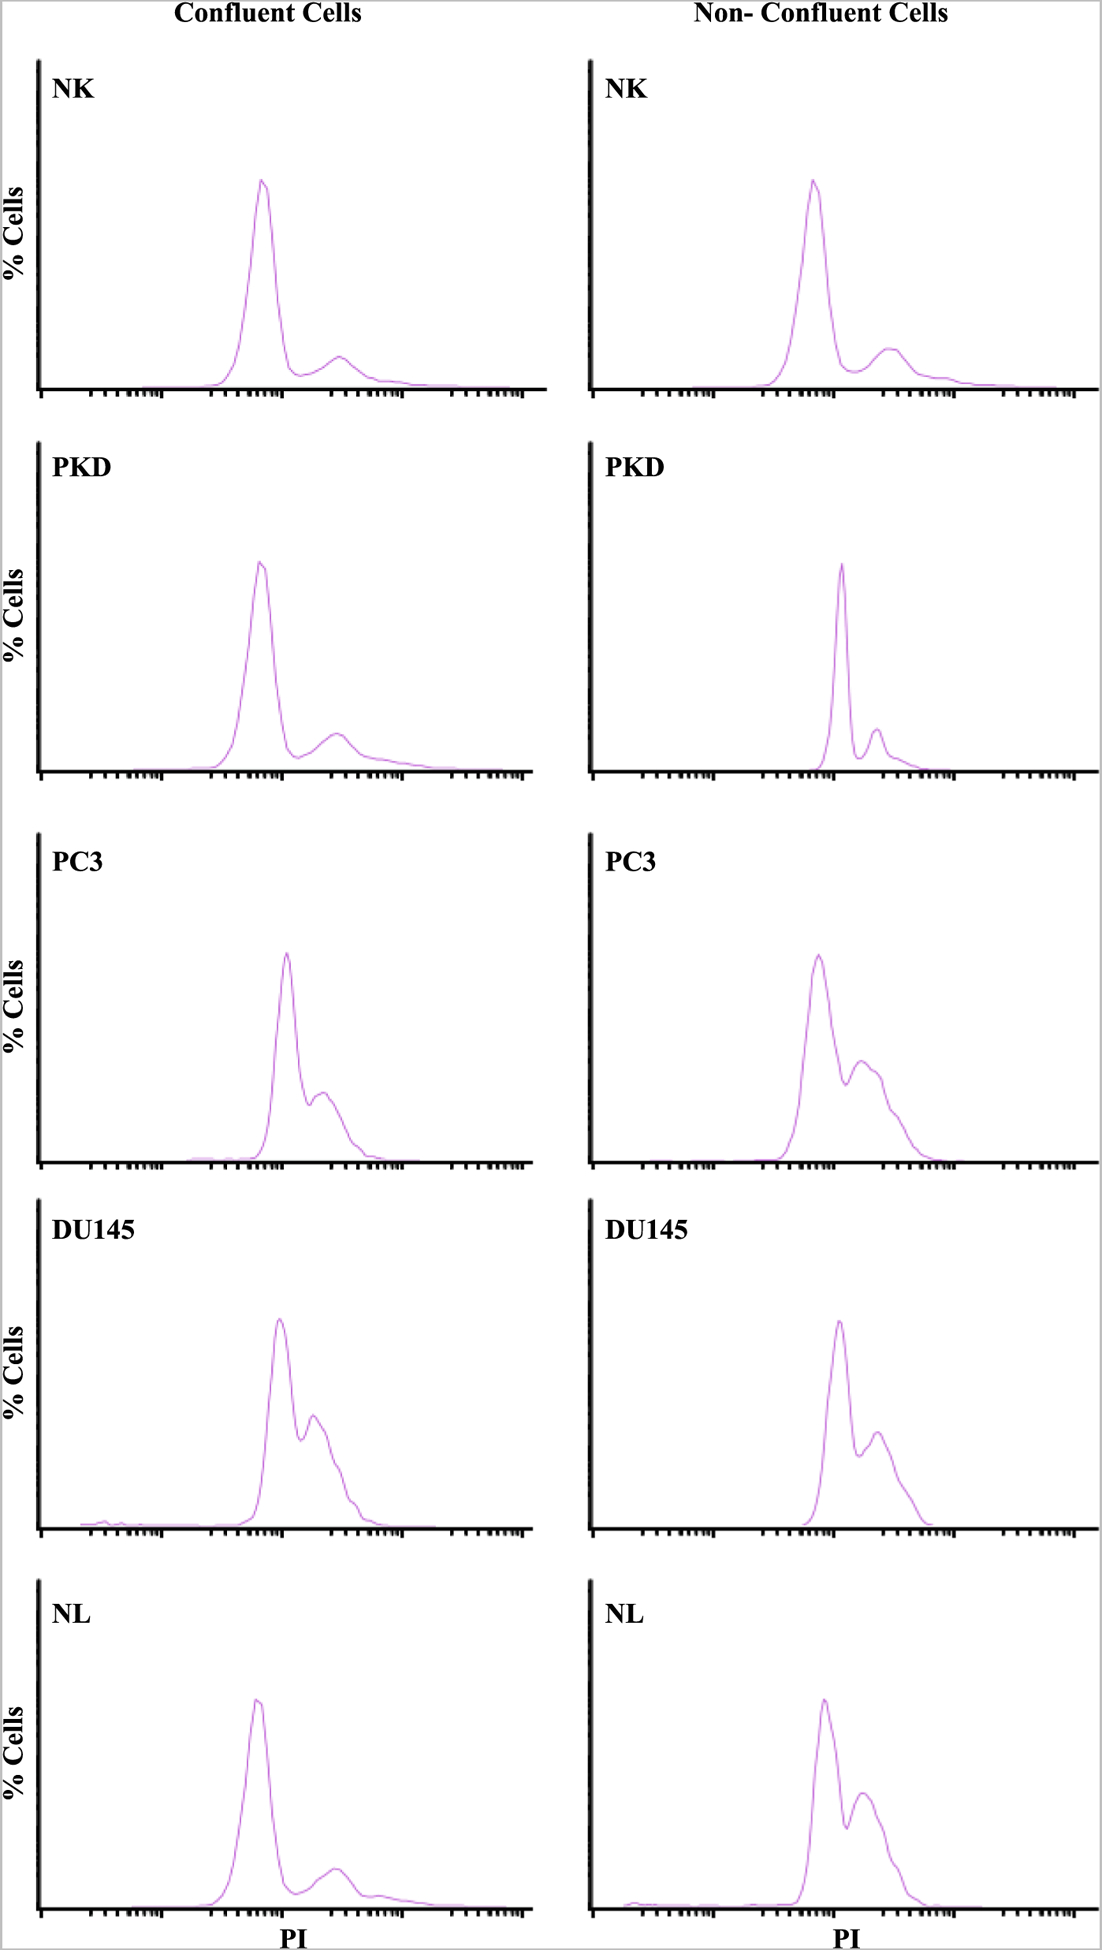
Quantitation of G1 and G2/M phases. Representative graphs show the percentages of cells with varying intensity of PI (propidium iodide) staining of NK, PKD, PC3, DU145, and NL under confluent and non-confluent conditions.
3.4. Rapamycin partially restored primary cilium expression in cancer cells
Because primary cilium regulates cell cycle progression and can stop abnormal cell growth by restricting cell cycle [16,22], restoration of the primary cilium in cancer cells may reduce cell proliferation. Rapamycin has been previously shown to increase cilia formation and length [31,32]. Therefore, we treated the cells with different concentrations of rapamycin at different time points (1, 3, and 8 days). Rapamycin did not induce ciliogenesis on day-1 and day-3 (data not shown), while 1 μM and 10 μM of rapamycin treatment on day-8 appeared to restore cilia formation in PC3, DU145, and NL (Fig. 6A). Treatment of the cells with 1 μM and 10 μM of rapamycin significantly increased the expression of primary cilia in PC3, DU145, and NL compared to the control cells (Fig. 6B). The cilia length was significantly increased with 1 or 10 μM of rapamycin treatment compared to the control cells in NK, PKD, DU145, and NL but not in PC3. Cilia lengths of each cell type were tabulated (Fig. 6C).
Fig. 6.
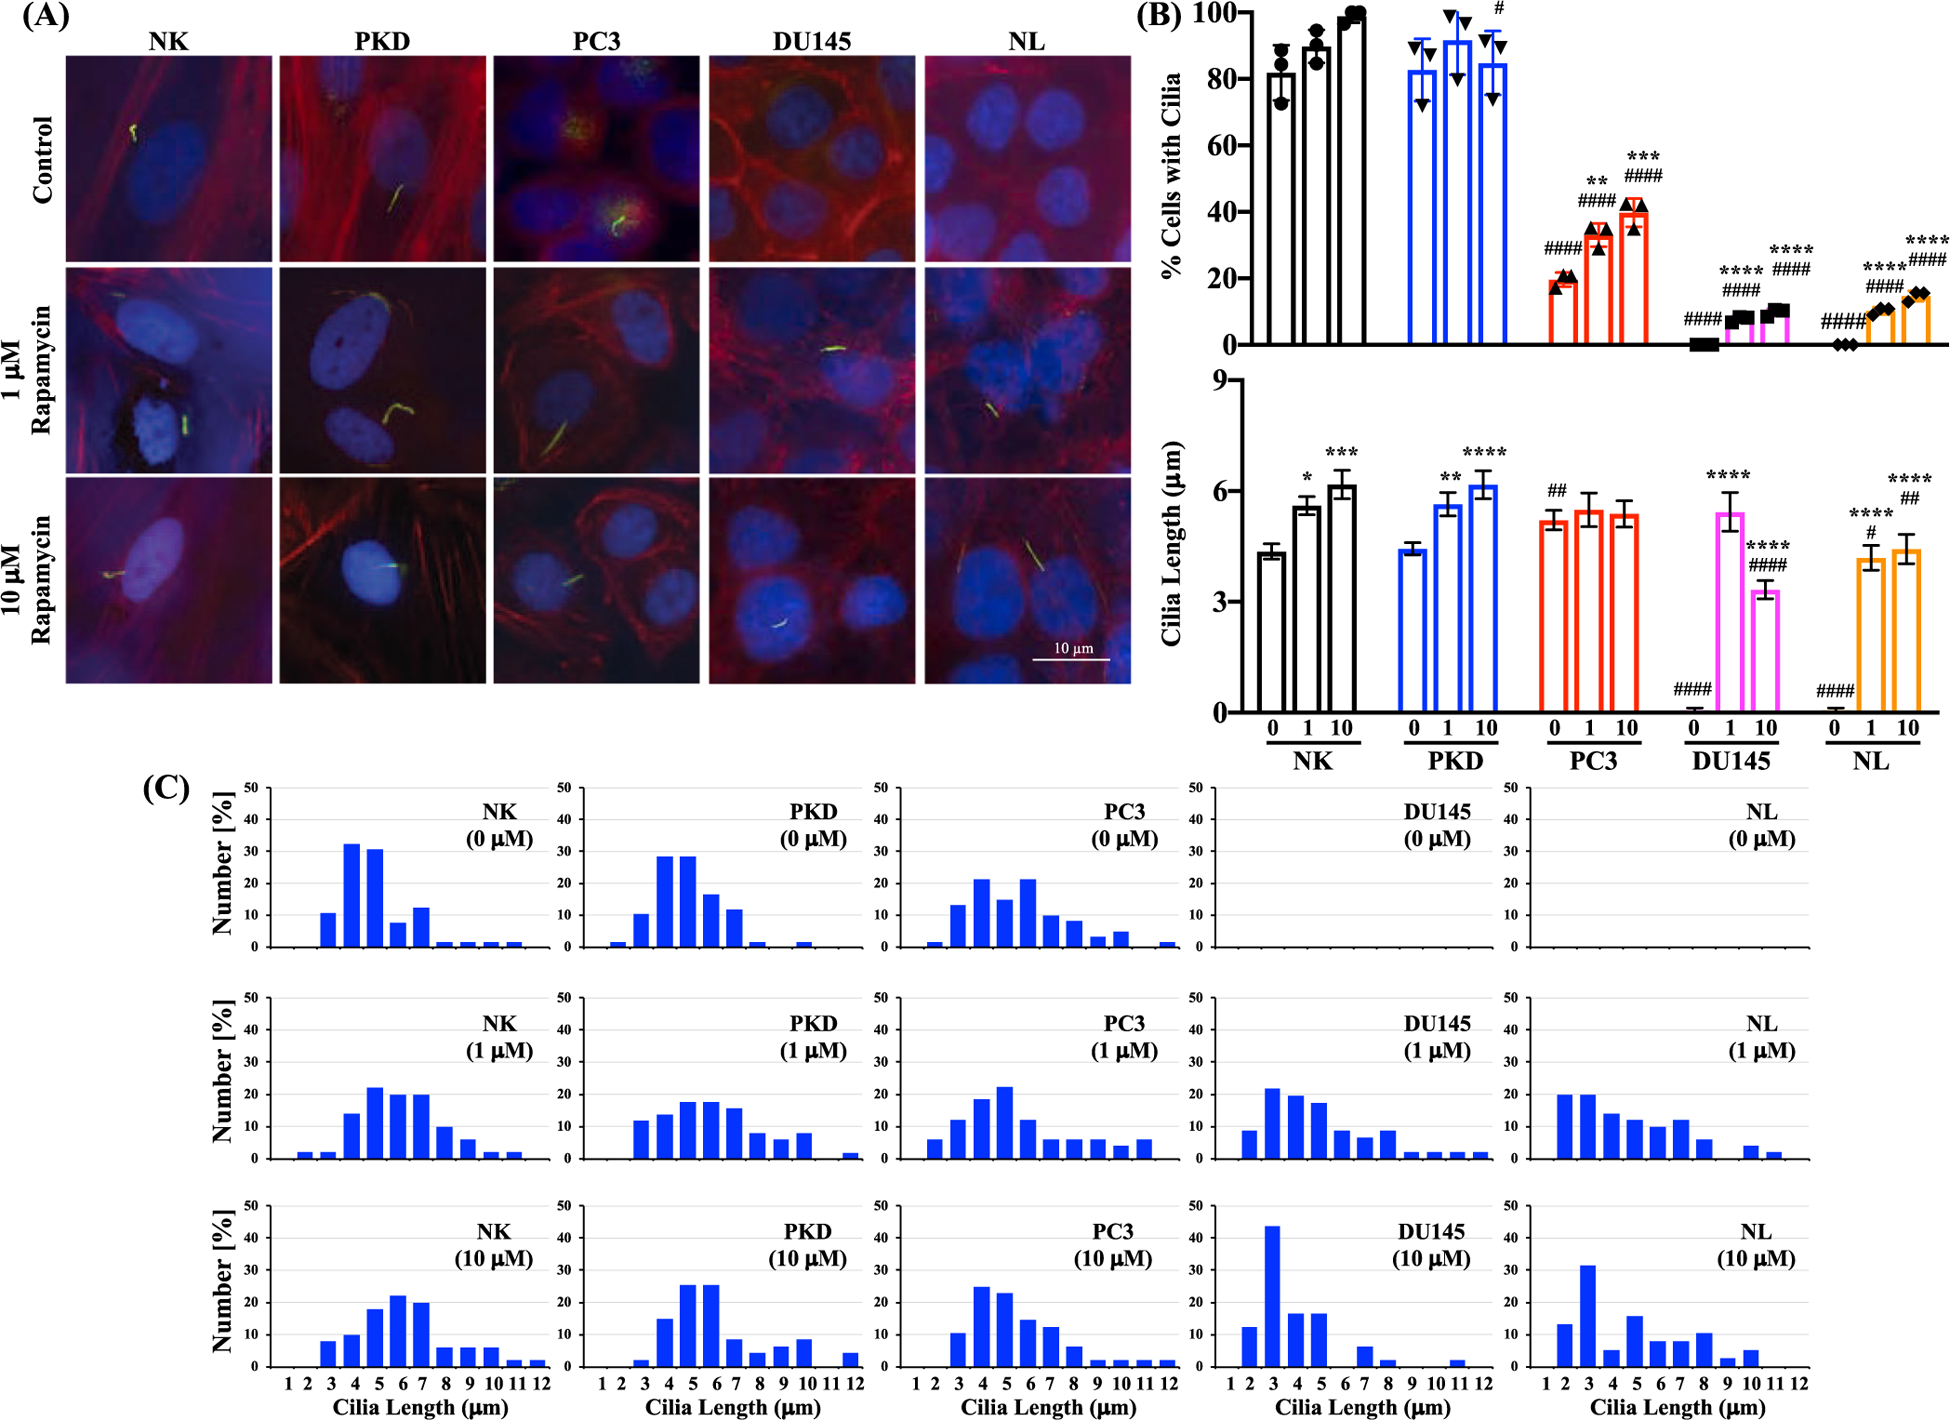
The effect of rapamycin treatment on ciliogenesis. (A) The representative images that show primary cilia expression after treatment with 0, 1 or 10 μM of rapamycin for 8 days in NK, PKD, PC3, DU145, and NL. Primary cilia were identified by immunofluorescence using antibody against acetylated α -tubulin (green); actin filaments using texas red-conjugated phalloidin (red); and nuclei using DAPI (blue). (B) The percentages of cells with cilia and the average cilia length after treatment with 0, 1, or 10 μM of rapamycin for 8 days in NK, PKD, PC3, DU145, and NL. (C) Histograms show the distribution of cilia length after rapamycin treatment (0, 1, or 10 μM). Values are represented as mean ± SEM. *, p < 0.05; **, p < 0.01; ***, p < 0.001; and ****, p < 0.0001compared to control baseline of corresponding group. #, p < 0.05; ##, p < 0.01; ###, p < 0.001; and ####, p < 0.0001compared to normal kidney (NK) epithelia. N = 3 independent experiments with a total of at least 150 cilia measurements. (NOTE: technically the ANOVA test results should be reported first, i.e., their p values. Only if their p values are significant, then the post-test analysis need to be performed. As of now, the ANOVA p values are not reported.)
3.5. Rapamycin treatment inhibited cell proliferation
Treatment with 10 μM of rapamycin caused a significant increase in primary cilia expression in the cancer epithelial cells. A concentration of 10 μM was therefore selected for the rest of our experiments. Before and after the cells were treated with 10 μM of rapamycin for 1, 3, and 8 days, cell proliferation (defined as the percentage of cells with an increase DNA synthesis) was assessed and analyzed by flow cytometry (Fig. 7). In all cell lines, rapamycin treatment at different time points significantly increased the percentages of the cells in G1 phase (Fig. 7A). Conversely, the percentages of the cells in G2/M phase were significantly decreased by rapamycin treatment (Fig. 7B). We also validated the cell proliferation data using an independent BrdU staining method by determining the incorporation of the thymine analogs into newly synthesized DNA (Fig. 8). We found that rapamycin treatment for 8 days significantly reduced the percentage of BrdU-positive cells compared to untreated control cells (Fig. 9).
Fig. 7.
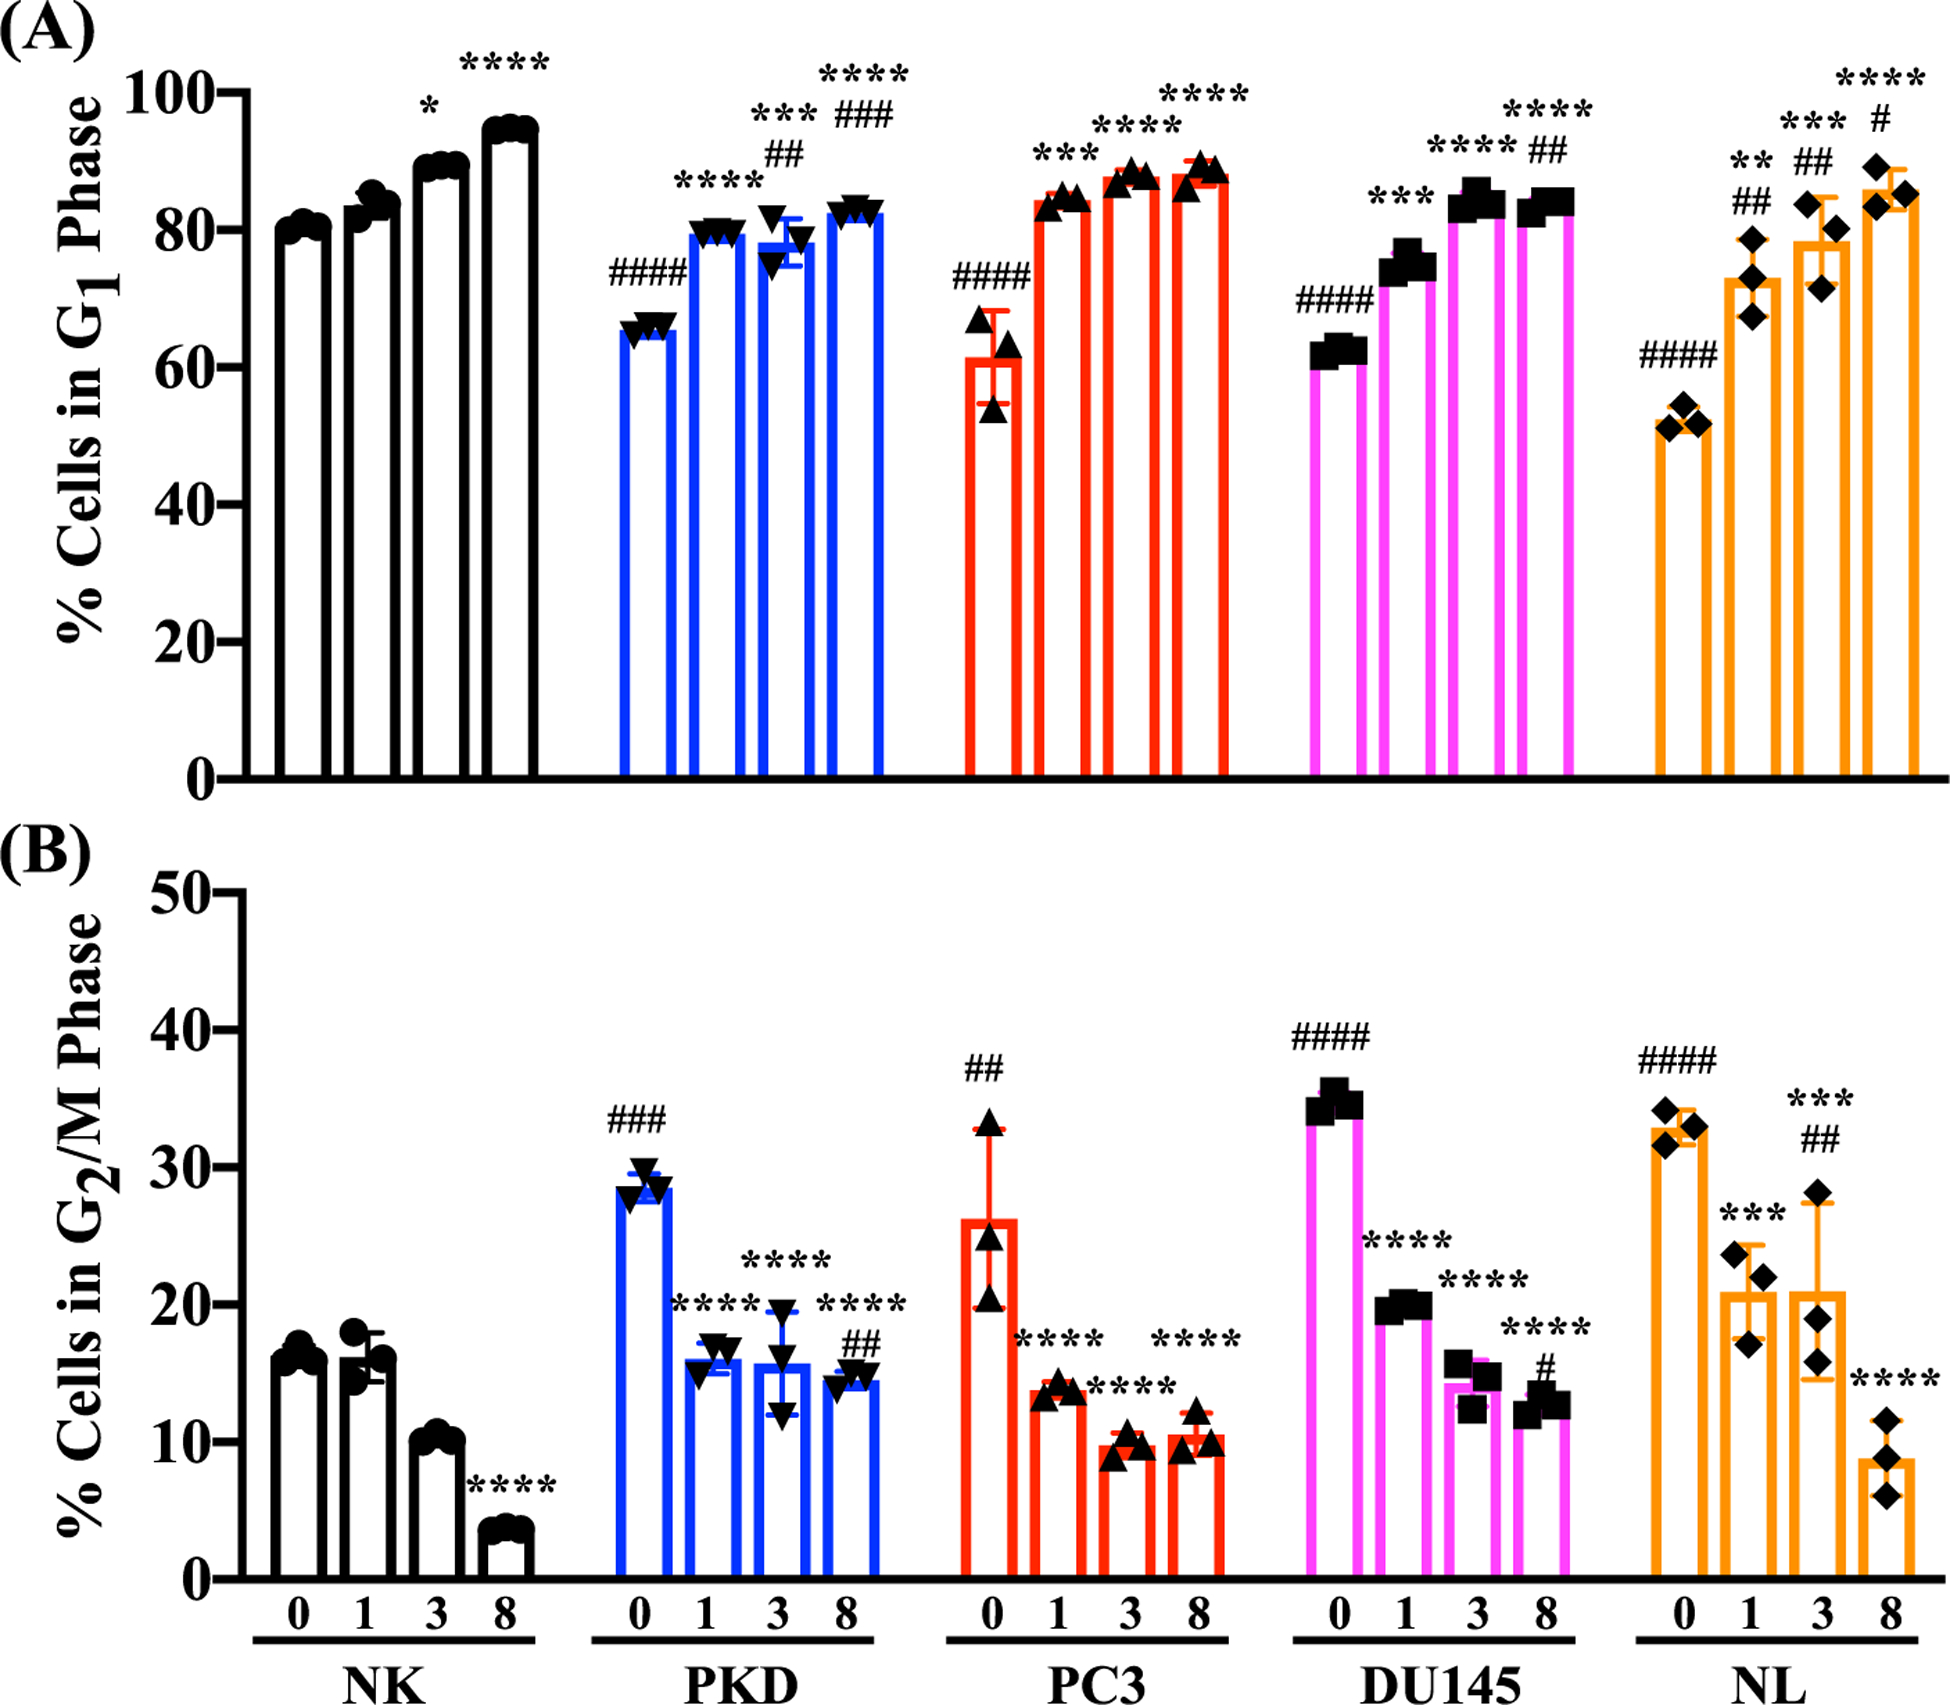
Inhibition of cell proliferation by rapamycin using propodium iodide. Quantitation of cell cycle phases using propidium iodide. The relative percentages of cells in (A) G1 and (B) G2/M before and after treatment with 10 μM of rapamycin for 1, 3, and 8 days in NK, PKD, PC3, DU145, and NL. Values are represented as mean ± SEM. *, p < 0.05; **, p < 0.01; ***, p < 0.001; and ****, p < 0.0001compared to control baseline of corresponding group. #, p < 0.05; ##, p < 0.01; ###, p < 0.001; and ####, p < 0.0001compared to control NK. N = 3 independent experiments.
Fig. 8.
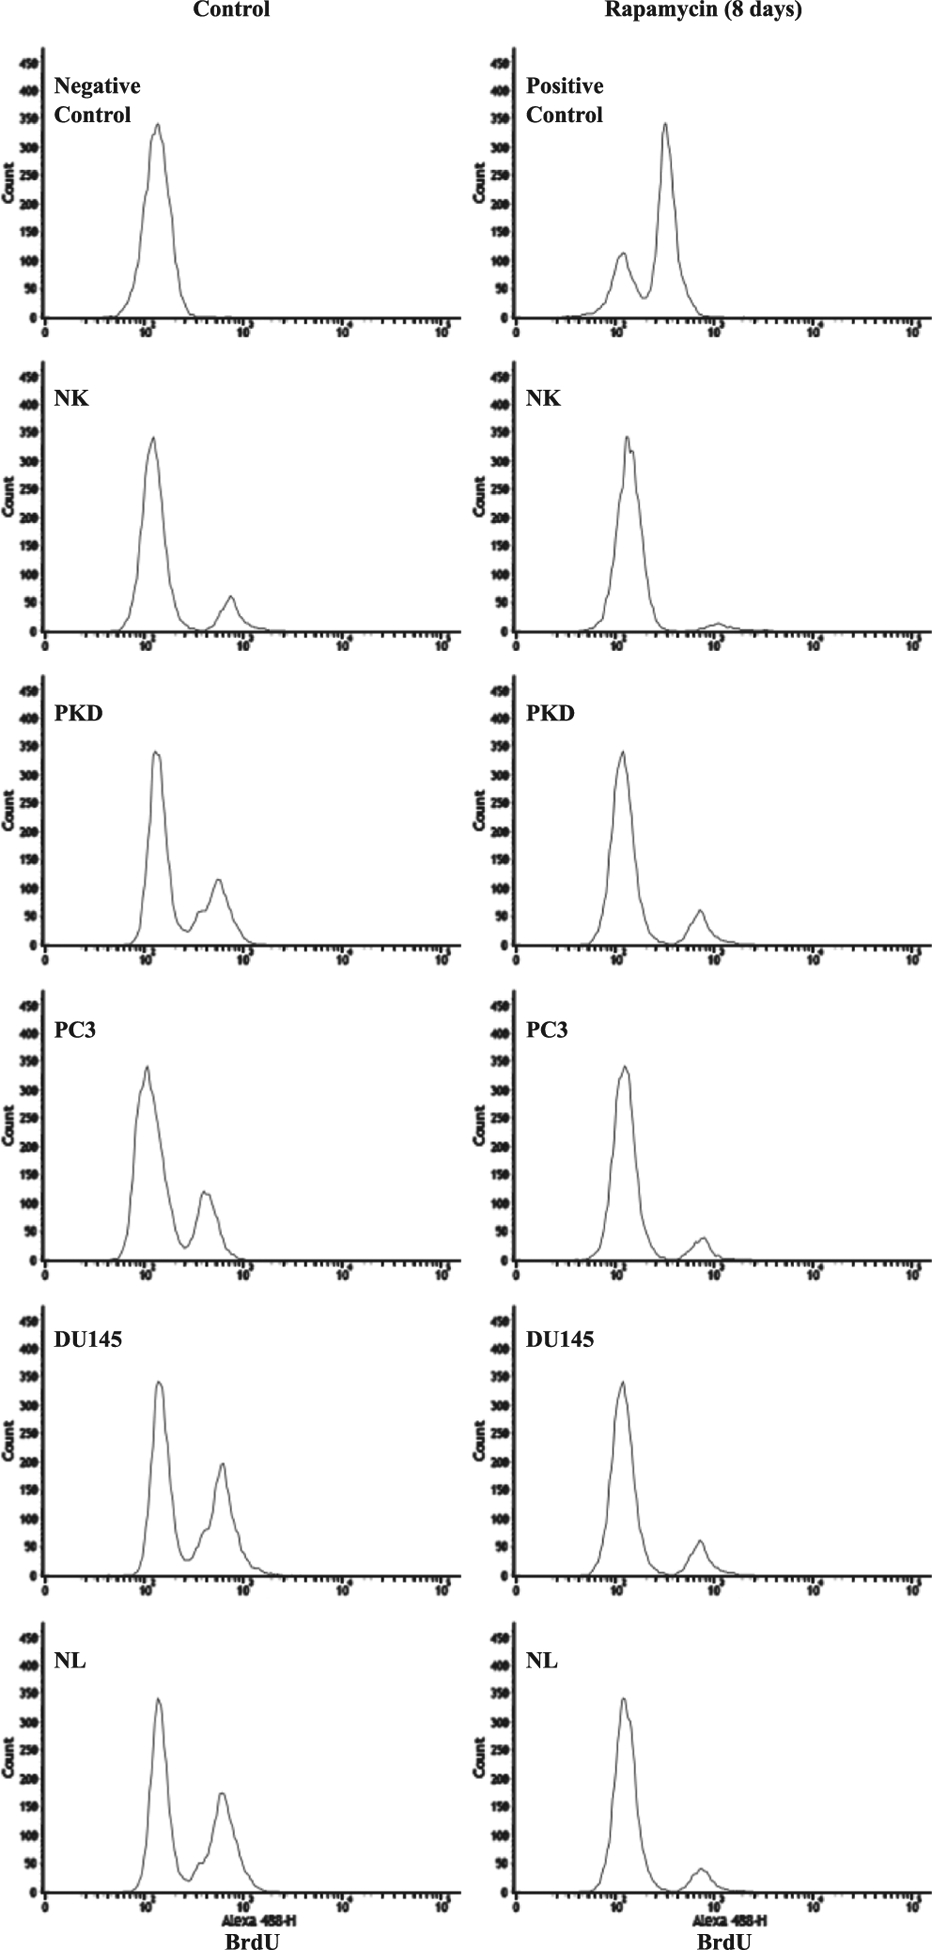
Analysis of BrdU incorporation. Representative graphs show the numbers of cells (count) with varying incorporation (intensity) of BrdU staining in NK, PKD, PC3, DU145, and NL before and after treatment with 10 μM rapamycin for 8 days.
Fig. 9.
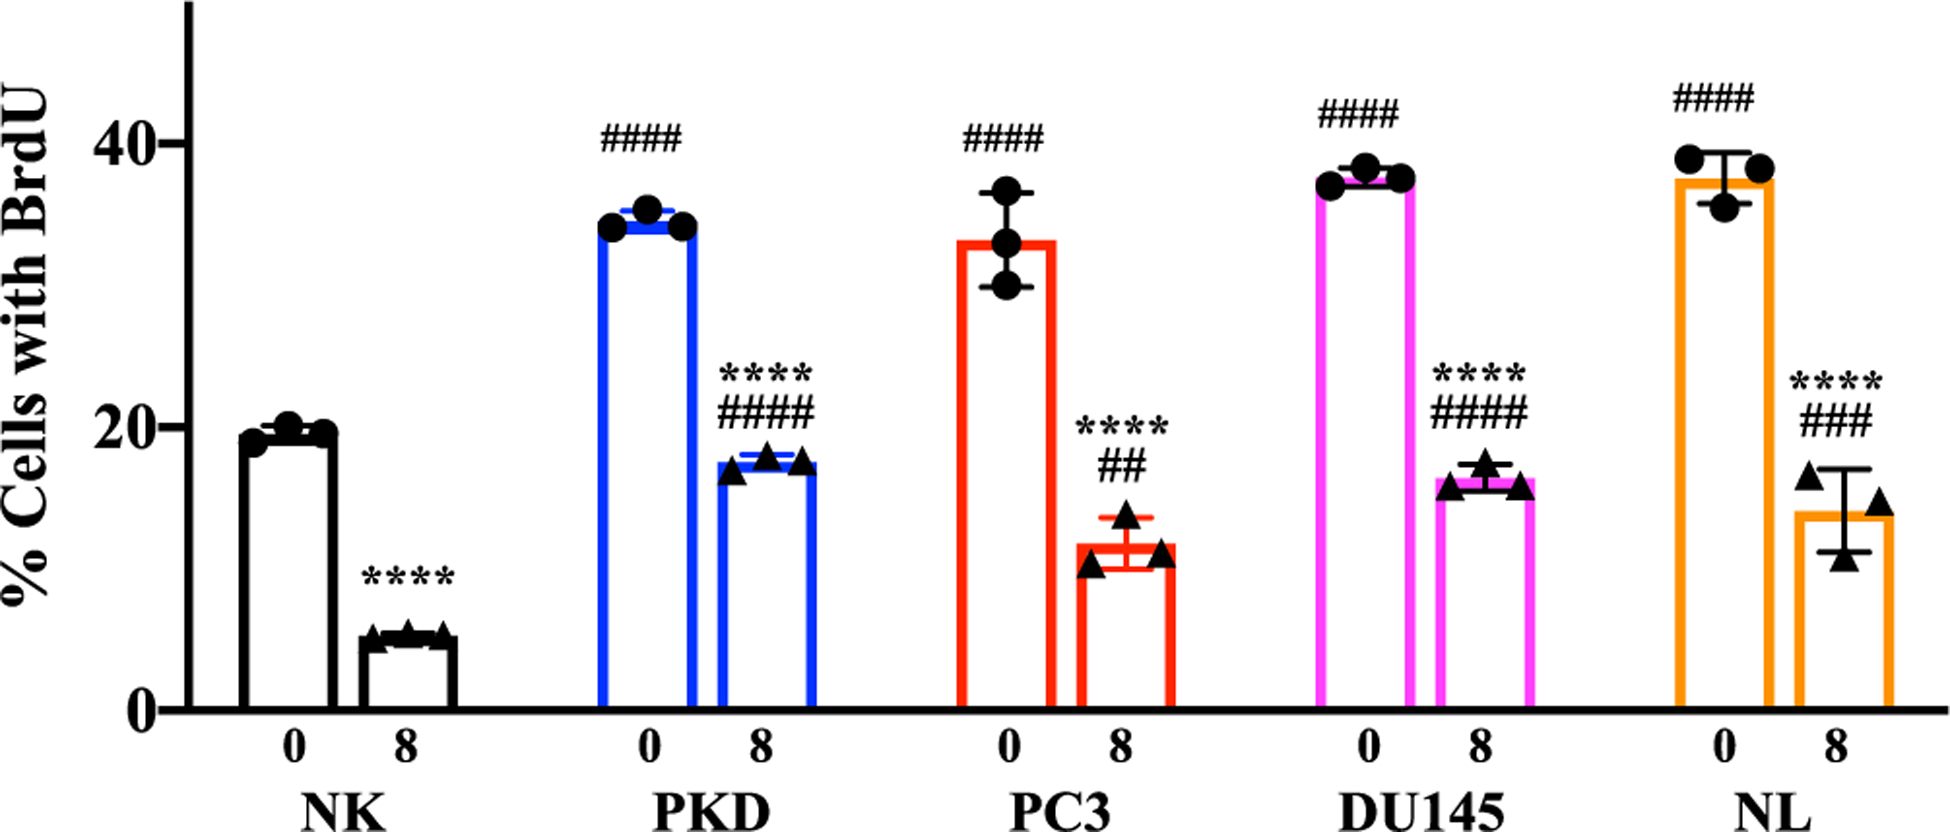
Inhibition of cell proliferation by rapamycin using BrdU. The relative percentages of cells with BrdU before and after treatment with 10 μM rapamycin for 8 days in NK, PKD, PC3, DU145, and NL. Values are represented as mean ± SEM. *, p < 0.05; **, p < 0.01; ***, p < 0.001; and ****, p < 0.0001compared to control baseline of corresponding group. #, p < 0.05; ##, p < 0.01; ###, p < 0.001; and ####, p < 0.0001compared to control NK. N = 3 independent experiments.
3.6. Effects of rapamycin treatment on cell proliferation, cilia expression, and cilia length
Pearson’s correlation coefficient was used to measure the strength of the association between control and rapamycin treatment on the changes in cell proliferation, cilia expression or cilia length (Fig. 10). The summary graphs before and after rapamycin treatment (Fig. 10A) were analyzed and derived using Pearson’s correlation, in which linear regression graphs were used to show the strength of the correlation (Fig. 10B). The rapamycin treatment was inversely correlated with the percent of cells in G2/M phase (r = 0.730, p = 0.162) but was positively correlated with the percent of cells with cilia (r = 0.986, p = 0.002) and cilia length (r = 0.869, p = 0.056).
Fig. 10.
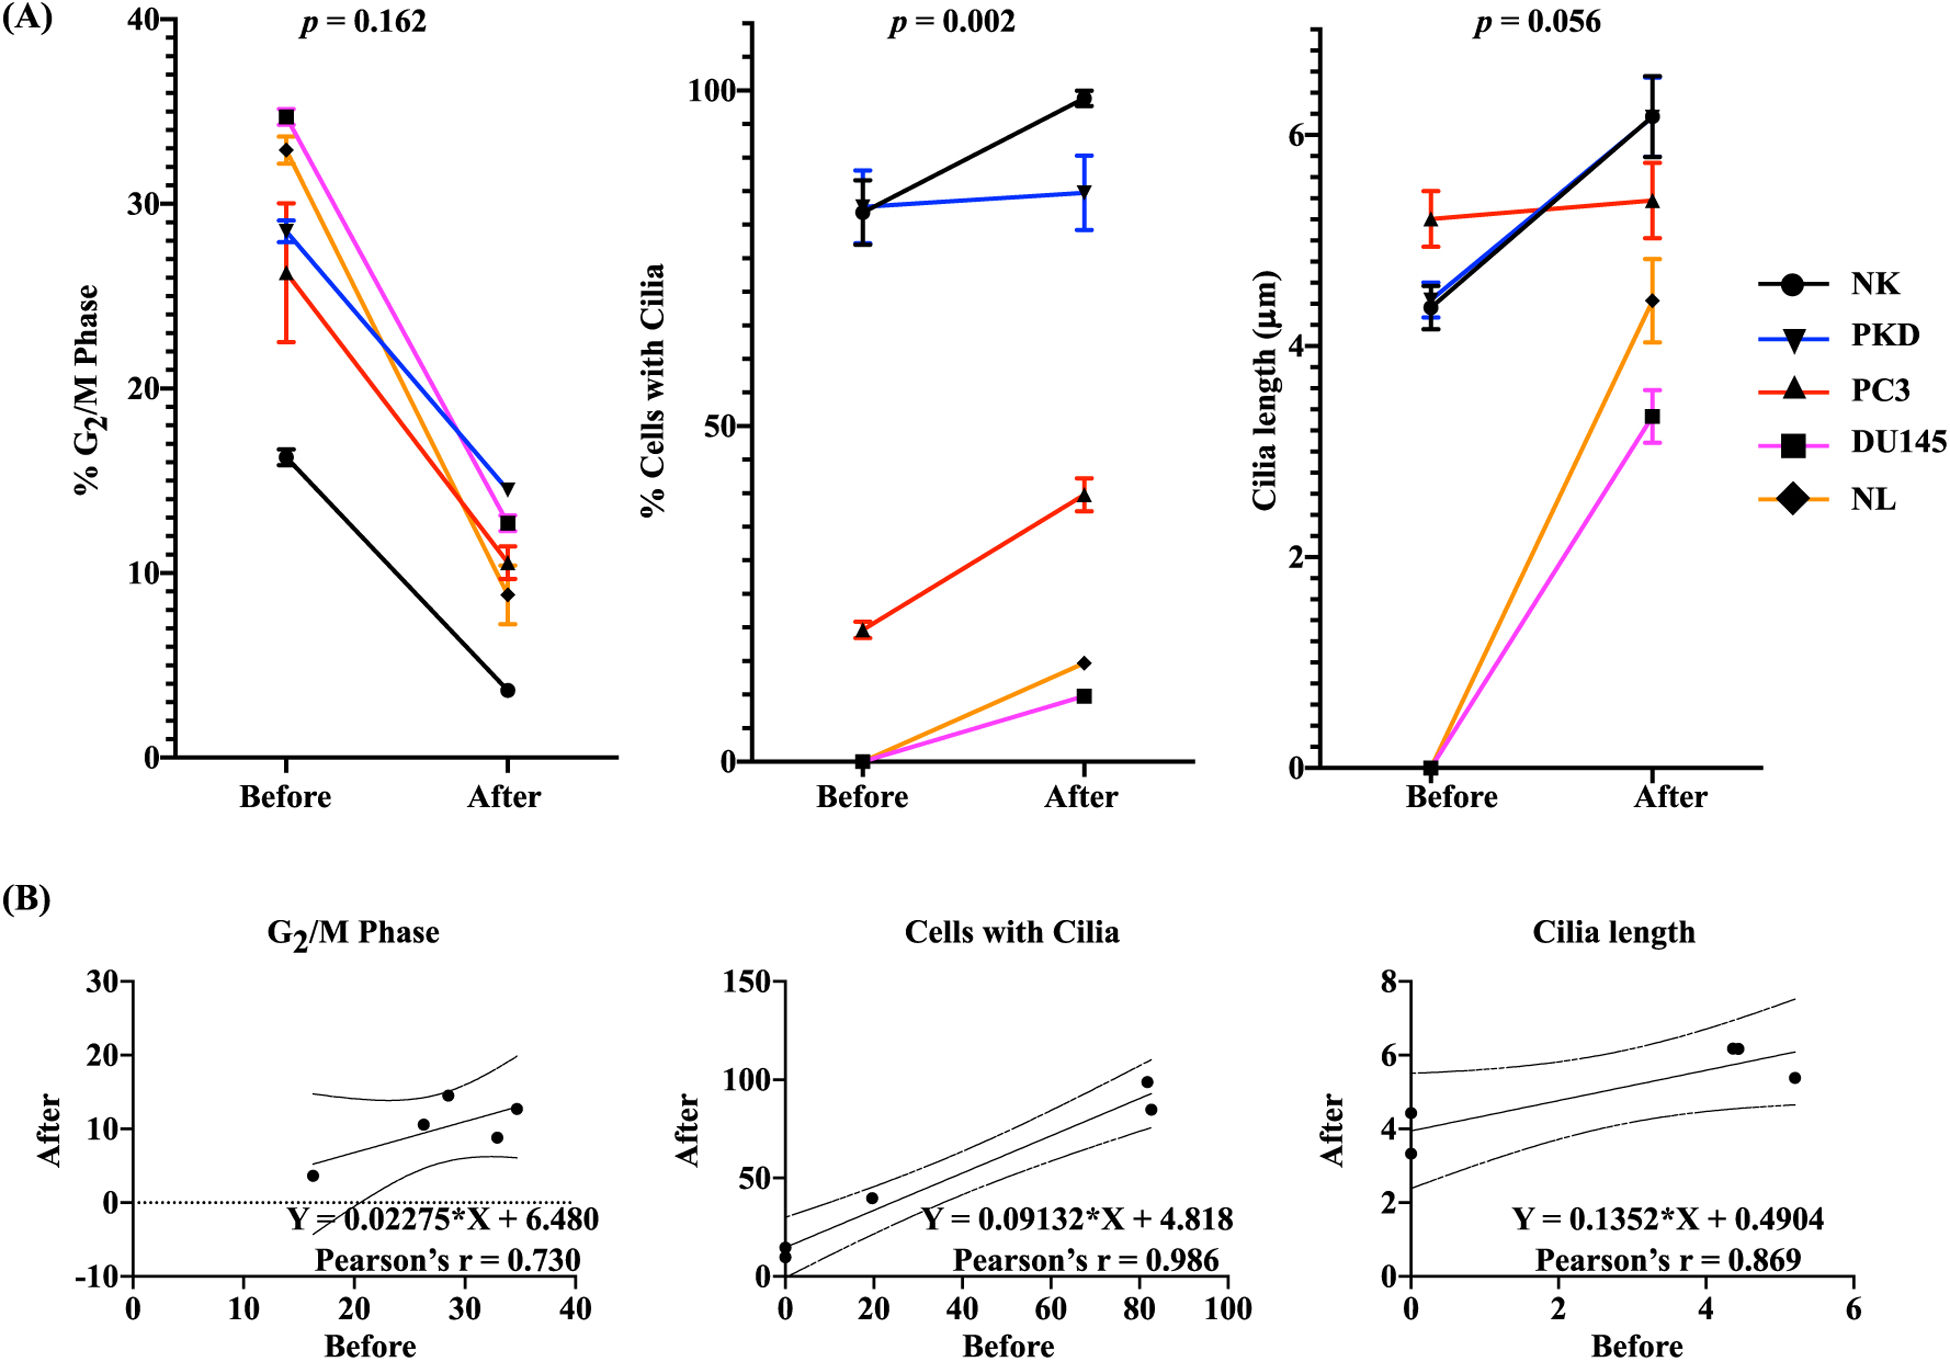
One-Dimensional Correlation Analysis. (A) Pearson correlation was used to evaluate the association before and after rapamycin treatment on the changes in the percentage of cells in G2/M phase, percentage of cells with cilia, and cilia length. The p-value (p) represents the significance of the correlation coefficient. (B) The results of Pearson linear regression analysis are shown in scattered plots. The scattered plots show changes in each variable before and after rapamycin treatment. Pearson correlation coefficient (r) shows the regression line and the upper and lower 95% confidence limits.
We subsequently analyzed the associations among cell proliferation, cilia expression and cilia length (Fig. 11). The summary graphs between each association (Fig. 11A) were analyzed and derived using Pearson’s correlation, in which linear regression graphs were used to show the strength of the correlation (Fig. 11B). The percent of cells with cilia was inversely correlated with the percent of cells in G2/M phase (r = 0.843, p = 0.028). Cilia length was also inversely correlated with the percent of cells in G2/M phase (r = 0.964, p = 0.003). As expected, cilia length was positively correlated with the percent of cells with cilia (r = 0.515, p = 0.172). These results indicated that rapamycin treatment was associated with increased cilia expression/length and decreased cell proliferation.
Fig. 11.
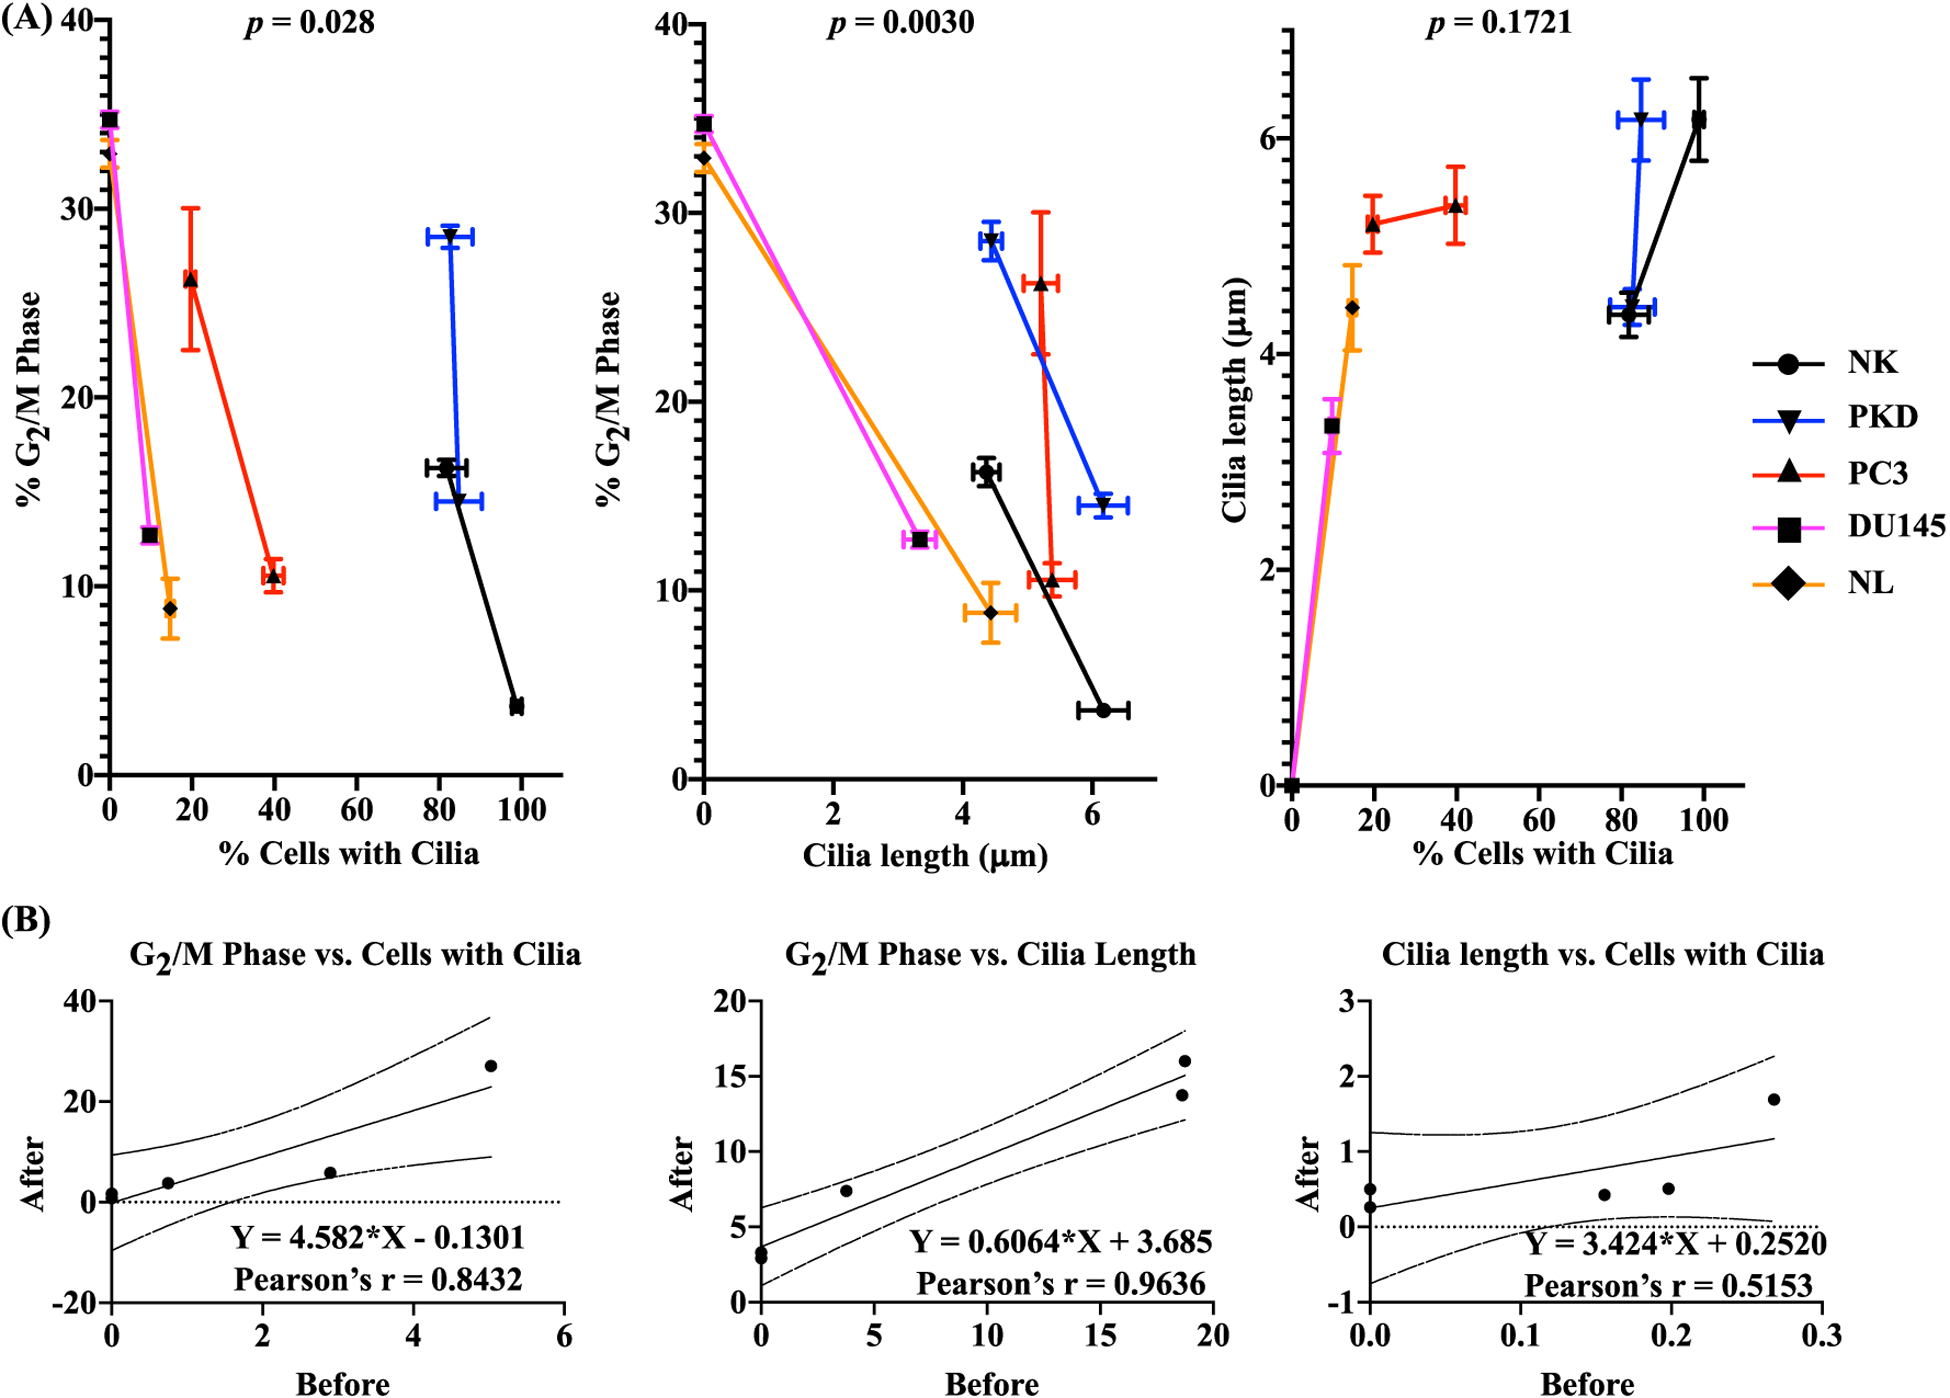
Two-Dimension Correlation analysis data. (A) Pearson correlation was used to evaluate the correlations of the changes in cilia expression vs. cell proliferation, cilia length vs. cell proliferation, and cilia expression vs. cilia length. The p-value (p) represents the significance of the correlation coefficient. (B) The results of Pearson linear regression analysis are shown in scattered plots. The scattered plots show changes in two variables before and after rapamycin treatment. Pearson correlation coefficient (r) shows the regression line and the upper and lower 95% confidence limits.
3.7. Rapamycin treatment in Wnt/β-catenin signaling pathway
The level of hedgehog as well as Wnt/β-catenin signaling molecules were compared among different cell types using Western blot analyses (data not shown). The expression levels of β-catenin, the hallmark indicator of the canonical Wnt signaling pathway, were higher in PKD, PC3, DU145, and NL compared to NK. However, there seemed to be no difference in the expression levels of Gli1 and smoothened (smo) among the different cell types.
We subsequently evaluated the effects of 10 μM of rapamycin treatment for 1, 3, and 8 days on β-catenin expression level (Fig. 12A). On day 1 and 3 of rapamycin treatment, the expression level of β-catenin significantly increased in NK, PKD, and DU145 compared to their untreated cells. The expression level of β-catenin significantly decreased in NK, PKD, and PC3 compared to their untreated cells on day 8. Because rapamycin is a potent inhibitor of mTOR (mammalian target of rapamycin), the effects of rapamycin on the phosphorylation of mTOR at Ser2448 and its downstream target p70 S6-Kinase (S6K) were measured using Western blot. The phosphorylation of mTOR at Ser2448 was significantly reduced on day 1, 3, and 8 after rapamycin treatment compared to the corresponding non-treated NK, PKD, PC3 and DU145. In NL, rapamycin did not change the phosphorylation of mTOR at Ser2448 on day 1 and 3; however, on day 8 rapamycin significantly increased mTOR phosphorylation. The phosphorylation of S6K was significantly reduced at the following days: 8 days after rapamycin treatment in NK; 1, 3, and 8 days after rapamycin treatment in PKD and PC3 cells; 1 and 3 days after rapamycin treatment in DU145 cells; and 3 days after rapamycin treatment in NL. On the other hand, the phosphorylation of S6K was significantly elevated on day 8 of rapamycin treatment compared to untreated NL. Because rapamycin did not inhibit the phosphorylation of mTOR at Ser2448 in NL, the effect of rapamycin on the phosphorylation of mTOR at another major site (Ser2481) was examined (Fig. 12B). The phosphorylation of mTOR Ser2481was significantly reduced on day 1, 3, and 8 after rapamycin treatment compared to the expression in the absence of rapamycin in NL.
Fig. 12.
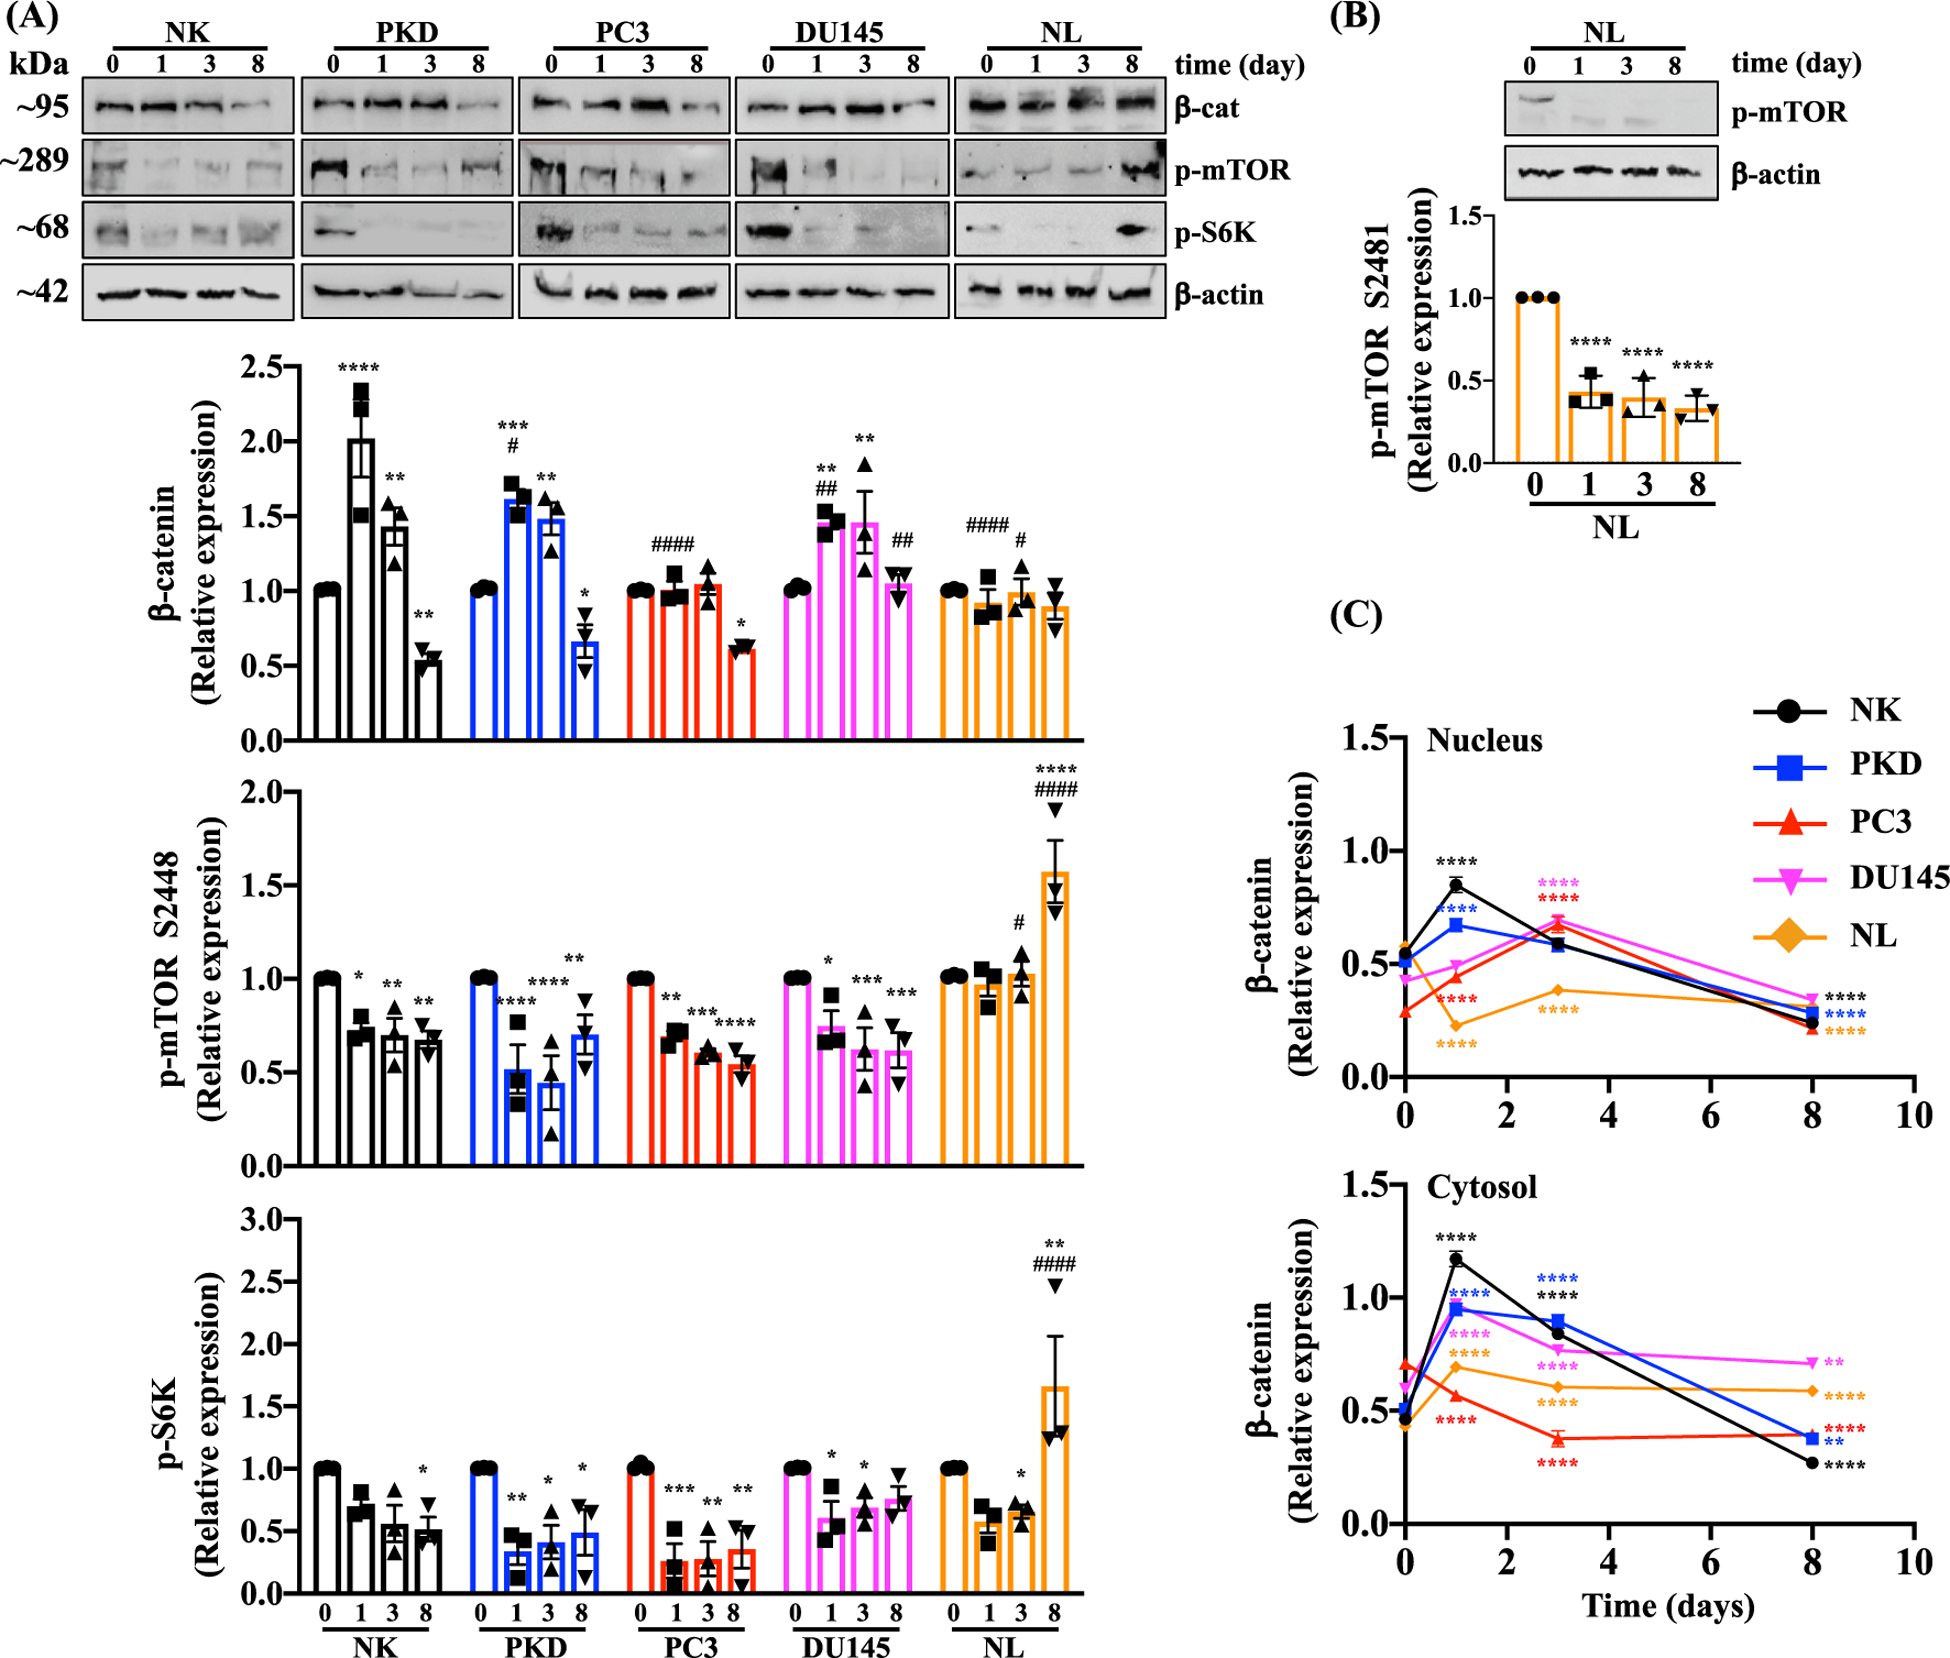
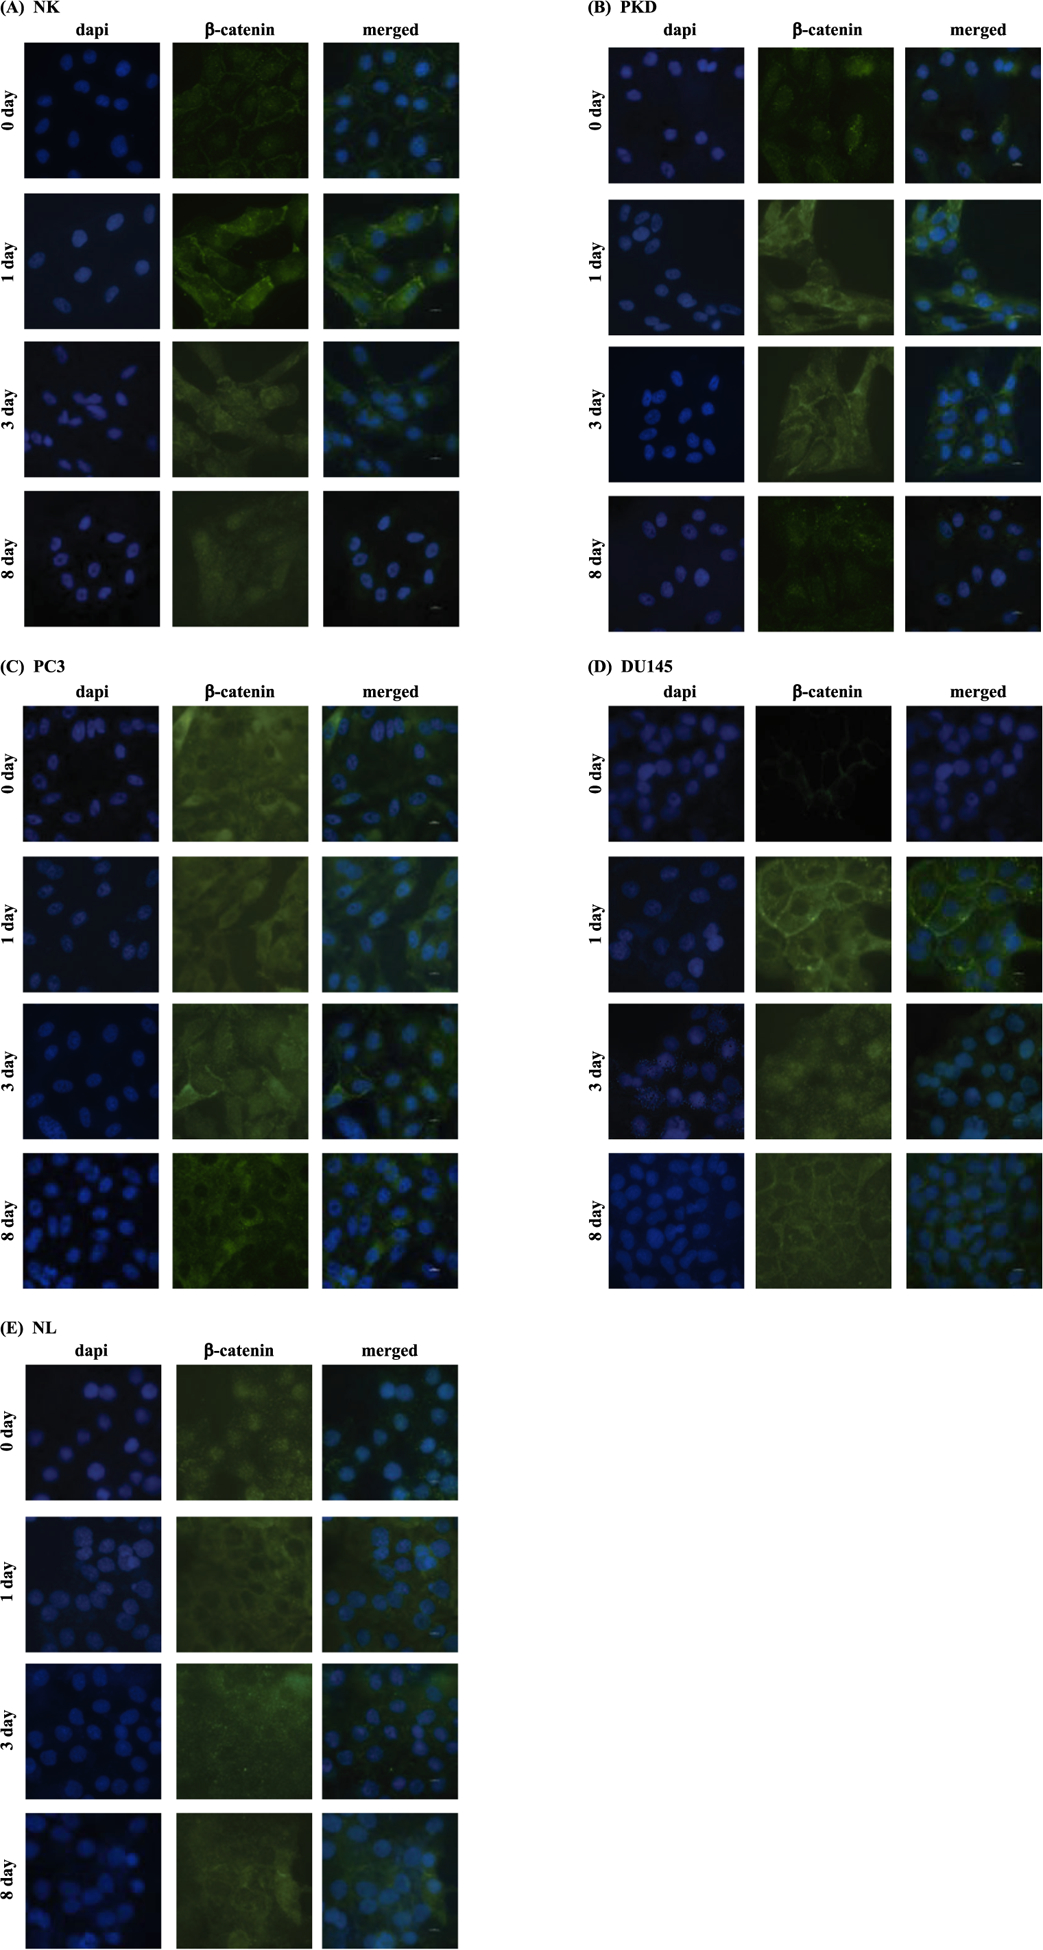
Effects of Rapamycin on Signaling Molecules. (A) The protein expressions of β-catenin, p-mTOR (Ser2448), p-S6k, and β -actin were analyzed before and after treatment with 10 μM of rapamycin for 1, 3, and 8 days in NK, PKD, PC3, DU145, and NL. (B) The protein expressions of p-mTOR (Ser2481) was separately analyzed in NL. Relative expression levels are expressed as the density ratio relative to β-actin. (C) Quantifications of nuclear and cytosolic accumulation of β-catenin were measured before and after treatment with 10 μM of rapamycin for 1, 3, and 8 days in NK, PKD, PC3, DU145, and NL. Values are represented as mean ± SEM. *, p < 0.05; **, p < 0.01; ***, p < 0.001; and ****, p < 0.0001compared to control baseline of corresponding group. #, p < 0.05; ##, p < 0.01; ###, p < 0.001; and ####, p < 0.0001compared to control NK. N = 3 independent experiments.
Immunofluorescence analysis was performed to determine the translocation of β-catenin into the nucleus (Fig. 12C). In NK and PKD, 10 μM rapamycin treatment for 1 day significantly increased the translocation of β-catenin into the nucleus while treatment for 8 days significantly decreased the β-catenin nuclear translocation compared to untreated control. In PC3 and DU145, treating the cells with rapamycin for 3 days significantly increased the β-catenin nuclear translocation and significantly decreased nuclear β-catenin after 8 days of treatment. The nuclear β-catenin was significantly reduced by rapamycin treatment in NL.
Original Western blot images prior to cropping are presented to show the effects of rapamycin on β-catenin, S6K, mTOR phosphorylation at S2448 (Fig. 13A) and S2481 (Fig. 13B). Representative images are also shown to determine cytosolic and nuclear β-catenin (Fig. 14).
Fig. 13.
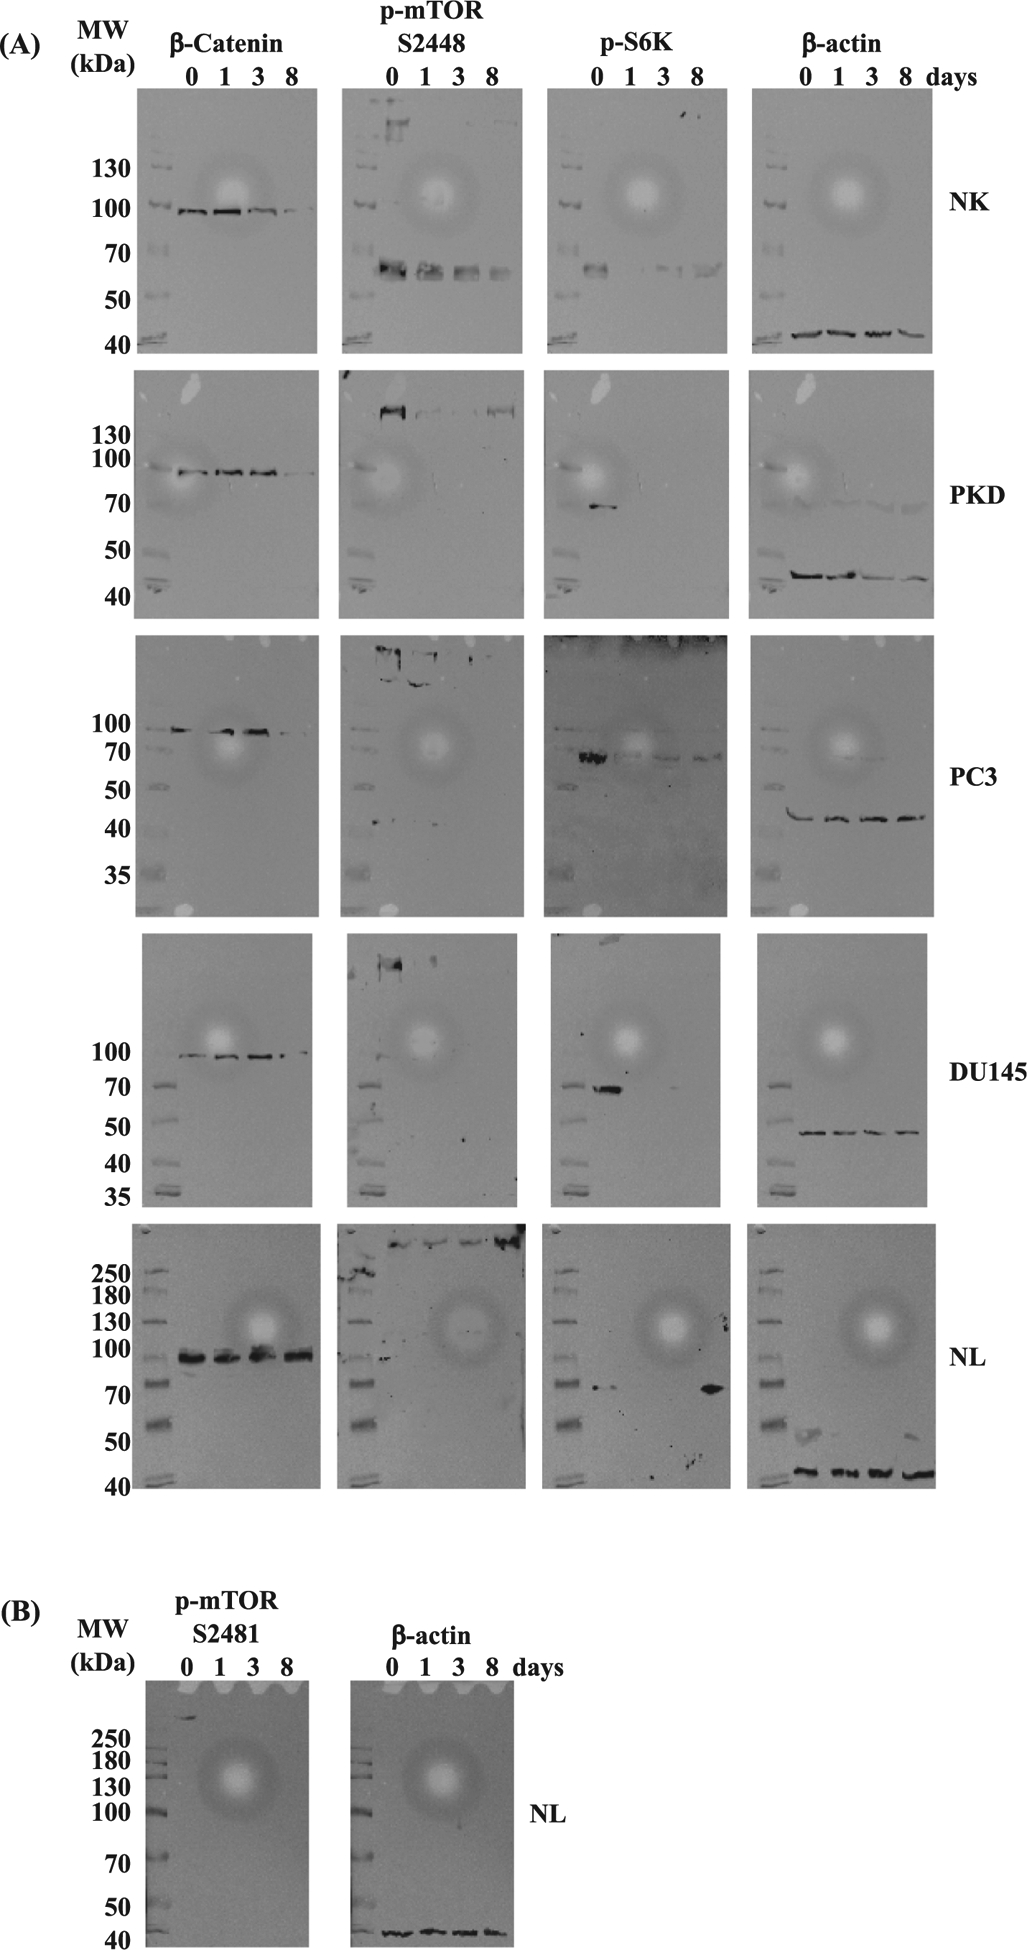
Representative Western blot images. (A) Original, uncropped immunoblots of β-catenin, p-mTOR (Ser2448), p-S6k, and β -actin are shown before and after treatment with 10 μM of rapamycin for 1, 3, and 8 days in NK, PKD, PC3, DU145, and NL. (B) Original blots of p-mTOR (Ser2481) and β -actin are shown before and after treatment with 10 μM of rapamycin for 1, 3, and 8 days in NL. The molecular weight (MWs) of the proteins are shown on the left of each corresponding blot.
Fig. 14.
Representative immunofluorescent images of β-catenin. β-catenin translocation was assessed before and after treatment with 10 μM of rapamycin for 1, 3, and 8 days in NK, PKD, PC3, DU145, and NL.
4. Discussion
Based on the emerging concept that cancer is associated with loss of primary cilia [7,9,23,24], we postulate that restoration of primary cilia formation may attenuate cancer proliferation. In order to restore ciliogenesis in cancer cells, we treated the cells with rapamycin because rapamycin has been previously shown to increase cilia formation and length [31,32]. We indeed found that rapamycin restored cilia formation and attenuated cell proliferation. Furthermore, our analyses suggest that ciliogenesis and antiproliferative effects by rapamycin treatment are highly correlated with one another.
Dysfunction of primary cilia has been associated with genomic instability [33,47–49]. Cancer cells are also known to have genomic instability [50,51]. Thus, we speculate that primary cilia may be involved in cancer pathogenesis. Abnormal ploidy formation was indeed observed in PKD and cancer cells. Moreover, we found that dysfunction or loss of primary cilia is associated with increased proliferation rate.
DU145 prostate cancer and NL bronchial tumorigenic cells did not express primary cilia while PC3 prostate cancer cells expressed low level of primary cilia. Our results are consistent with the previous studies that show the absence of primary cilia in PC3 and DU145 prostate cancer [52]. Our studies also agree with the previous report showing that prostate cancer tissues have a reduction in the percentage of ciliated cells [53]. After excluding cilia length of 1 μm or less, we did not find any significant difference in cilia length among PC3, PKD, and NK. In contrast, a previous study show that there are more primary cilia in lung adenocarcinoma as well as in other cancers, such as adenocarcinoma of the colon, follicular lymphoma, and pancreatic adenocarcinoma [54]. Another study shows that ciliogenesis has a role in promoting cancer drug resistance [25]. Even in the same cancer type, primary cilia can have an opposing role in tumorigenesis depending on the oncogenic initiating event [14,55], suggesting the complexity of the roles of cilia in cancer.
We found that PKD, PC3, DU145, and NL are more proliferative than NK. We observed that even after becoming confluent, a condition of growth arrest, PC3 and DU145 cells are still significantly more proliferative than NK cells. The main physiological difference between immortalized cells and cancer cells is the loss of cell-cell contact inhibition in cancer cells (Fig. 4B). Cancer cells continue to proliferate even after they have become confluent. E-cadherin adhesive junctions are thought to play an important role in mediating contact inhibition through homophilic interactions of E-cadherin molecules between the two neighboring cells [56–58]. Previous studies have shown that overexpression of cadherins can antagonize β-catenin signaling by binding and sequestering it from the nuclear signaling [59,60]. In cancer cells, loss of E-cadherin expression can contribute to upregulation of β-catenin signaling pathway [61]. It has been reported that overexpression of β-catenin in epithelial cells promotes cell proliferation [62]. Compared to immortalized non-tumorigenic cells, the genes involved in cell proliferation and cell cycle are significantly deregulated in tumorigenic cells [63]. Cyclin inhibitors and negative regulators of cell proliferation are progressively downregulated during tumorigenesis.
The mammalian target of rapamycin (mTOR) signaling pathway is an essential regulator of cell proliferation and metabolism processes, which are directly controlled by the mTORC1 pathway, such as protein, lipid and nucleotide synthesis, energy metabolism, and autophagy. Dysregulation of the mTOR pathway is involved in several diseases including cancer, diabetes, obesity, neurological diseases, and genetic disorders [64,65]. Activation of mTORC1 stimulates glycolysis and lipid biosynthesis [66] and positively regulates glutamine metabolism [67]. Recently it is found that mTORC1 is also has an important role in aging and age-related diseases [68]. Rapamycin is a selective inhibitor of mTORC1and a potent inhibitor of S6K1 activation (the downstream target of mTOR) [69]. It is found that rapamycin treatment improves insulin sensitivity by preventing a S6K-mediated feedback loop [70]. Moreover, rapamycin treatment prevents the differentiation of human adipocyte [71] and protects against high-fat-diet-induced obesity [72]. Rapamycin also has a role in extending the lifespan and preventing the onset of many age-related diseases [73,74]. This information signifies a broad spectrum of rapamycin in cellular signaling and cell processes. Within the context of our work on cilia and cell proliferation, our studies do not differentiate cause-and-effect between cilia and cell proliferation. We thus use rapamycin only as a pharmacological tool to examine the correlation between the changes in the cilia and cell proliferation.
Rapamycin is an mTOR inhibitor and one of the most potent inducers of cilia formation. Rapamycin shows a statistically significant increase (up to 6-fold) in the percentage of cells with cilia compared to vehicle-treated cells [32]. Moreover, it has been shown that rapamycin increases primary cilia length and function in renal epithelia and vascular endothelia [31]. Consistent with these previous studies, our work demonstrates that rapamycin treatment for 8 days partially restores primary cilium expression in DU145 and NL cancer cells and significantly increases cilia length in NK, PKD, DU145, and NL. We found that 10 μM of rapamycin increased the cilia length more than 1 μM of rapamycin treatment. Cell cycle before and after 1, 3, and 8 days of rapamycin treatment was evaluated to determine if restoration of primary cilia was associated with attenuation of cell proliferation. Our results show that rapamycin inhibited cell proliferation significantly after 1, 3, and 8 days of treatment compared to the untreated cells. Our analyses also indicated that there was a significant correlation between the percent of cells with cilia and cell proliferation. Consistent with our finding, Khan et al. have previously shown that rapamycin exerts its antiproliferative effect in cancer cells at least in part through its ability to restore primary cilium formation [32].
In unstimulated cells, β-catenin protein exists very little in cytoplasmic or nuclear fractions due to rapid degradation of β-catenin in the cytoplasm by the destruction complex that composed of the adenomatous polyposis coli protein, GSK-3β, and Axin/Conductin. However, in the presence of a Wnt signal, a Frizzled family receptor and the downstream component Dvl are activated. Dvl in turn leads to the inactivation of GSK-3β, resulting in the accumulation of cytoplasmic β-catenin. High levels of β-catenin in the cytosol result in its translocation into the nucleus and activation of expression of Wnt-responsive genes. The presence of primary cilium controls the levels of expression of Wnt target genes by regulating the degradation of Disheveled (Dvl) [30]. Wnt signaling activation was observed in many cancers and may contribute to the cancer progression [75–78].
We showed a higher level of β-catenin expression, which suggests the utilization of canonical Wnt signaling pathway in PKD, PC3, DU145, and NL. Similar to the previous studies [79–81], our data indicated that dysfunction or loss of primary cilia was associated with the activation of Wnt signaling pathways. However, other studies show a low activation of Wnt signaling pathway in prostate cancer [53,82]. Due to the concept that the presence of primary cilium controls the levels of expression of Wnt target genes [26,29], we evaluated the effect of primary cilia restoration on Wnt/β-catenin signaling pathway by measuring the total protein expression of β-catenin as well as β-catenin nuclear translocation. We found that on day 1 and 3 of rapamycin treatment, the expression level of β-catenin was significantly increased in NK, PKD, and DU145 compared to the untreated cells and the nuclear translocation of β-catenin increased significantly in NK, PKD, PC3 and DU145 compared to the untreated cells. This effect is consistent with the previous study that shows that mTORC1 activation suppressed Wnt/β-catenin signaling and that rapamycin could activate Wnt/β-catenin signaling pathway [83,84]. However, the expression level of β-catenin significantly decreased in NK, PKD, and PC3 compared to untreated cells after 8 days of rapamycin treatment. Likewise, the β-catenin nuclear translocation significantly decreased in NK, PKD, PC3, and DU145 compared to untreated cells after 8 days of rapamycin treatment. This reduction in β-catenin level is presumably due to the presence or increase length of primary cilia. Generally, there is a trend of an initial increase followed by a decrease of β-catenin level as well as the translocation of β-catenin into the nucleus with rapamycin treatment. Moreover, we confirm the effect of rapamycin on inhibiting the phosphorylation of mTOR and its downstream target p70 S6 Kinase (S6K). In NL, rapamycin neither changes the level of β-catenin expression nor reduces the phosphorylation of both mTOR at Ser2448 and S6K. However, rapamycin significantly inhibits the phosphorylation of mTOR at Ser2481in NL. The inhibition of mTOR phosphorylation at a different site (Ser2481) may trigger the compensatory increase in the phosphorylation of mTOR at Ser2448 and S6K on day 8 treatment. In addition to the different phosphorylation site of mTOR, the accumulation of β-catenin in the cytosol instead of nucleus in NL may be the reason that NL behaves differently from other cells.
In summary, we showed that rapamycin increased the expression and/or length of primary cilia. Both the presence and length of primary cilia were correlated significantly with cell proliferation. Our study supports the idea that the antiproliferative effects of rapamycin are correlated with ciliogenesis.
Acknowledgements
We thank Richard Beuttler for his valuable suggestions in data analysis and Maki Takahashi for her technical assistance in preparing the reagents. This work was supported by NIH HL131577, AHA 19IPLOI34730020 and Chapman University. The completion of this work by Maha H. Jamal partially fulfilled the requirements for the Doctorate Degree program in Biomedical and Pharmaceutical Sciences.
Footnotes
Declaration of Competing Interest
The authors declare that they have no known competing financial interests or personal relationships that could have appeared to influence the work reported in this paper.
References
- [1].Liu H, Kiseleva AA, Golemis EA, Ciliary signalling in cancer, Nat. Rev. Cancer 18(8) (2018) 511–524. [DOI] [PMC free article] [PubMed] [Google Scholar]
- [2].Inoko A, Matsuyama M, Goto H, Ohmuro-Matsuyama Y, Hayashi Y, Enomoto M,Ibi M, Urano T, Yonemura S, Kiyono T, Izawa I, Inagaki M, Trichoplein and Aurora A block aberrant primary cilia assembly in proliferating cells, J. Cell Biol 197 (3) (2012) 391–405. [DOI] [PMC free article] [PubMed] [Google Scholar]
- [3].Hassounah NB, Bunch TA, McDermott KM, Molecular pathways: the role of primary cilia in cancer progression and therapeutics with a focus on Hedgehog signaling, Clin. Cancer Res 18 (9) (2012) 2429–2435. [DOI] [PMC free article] [PubMed] [Google Scholar]
- [4].Schneider L, Cammer M, Lehman J, Nielsen SK, Guerra CF, Veland IR,Stock C, Hoffmann EK, Yoder BK, Schwab A, Satir P, Christensen ST, Directional cell migration and chemotaxis in wound healing response to PDGF-AA are coordinated by the primary cilium in fibroblasts, Cell Physiol. Biochem 25 (2–3) (2010) 279–292. [DOI] [PMC free article] [PubMed] [Google Scholar]
- [5].Fonte VG, Searls RL, Hilfer SR, The relationship of cilia with cell division and differentiation, J. Cell Biol 49 (1) (1971) 226–229. [DOI] [PMC free article] [PubMed] [Google Scholar]
- [6].Higgins M, Obaidi I, McMorrow T, Primary cilia and their role in cancer, Oncol. Lett 17 (3) (2019) 3041–3047. [DOI] [PMC free article] [PubMed] [Google Scholar]
- [7].Yuan K, Frolova N, Xie Y, Wang D, Cook L, Kwon YJ, Steg AD, Serra R, Frost AR, Primary cilia are decreased in breast cancer: analysis of a collection of human breast cancer cell lines and tissues, J. Histochem. Cytochem 58 (10) (2010) 857–870. [DOI] [PMC free article] [PubMed] [Google Scholar]
- [8].Lancaster MA, Gleeson JG, The primary cilium as a cellular signaling center: lessons from disease, Curr. Opin. Genet. Dev 19 (3) (2009) 220–229. [DOI] [PMC free article] [PubMed] [Google Scholar]
- [9].Seeley ES, Carriere C, Goetze T, Longnecker DS, Korc M, Pancreatic cancer and precursor pancreatic intraepithelial neoplasia lesions are devoid of primary cilia, Cancer Res. 69 (2) (2009) 422–430. [DOI] [PMC free article] [PubMed] [Google Scholar]
- [10].Yoder BK, Hou X, Guay-Woodford LM, The polycystic kidney disease proteins, polycystin-1, polycystin-2, polaris, and cystin, are co-localized in renal cilia, J. Am. Soc. Nephrol 13 (10) (2002) 2508–2516. [DOI] [PubMed] [Google Scholar]
- [11].Castresana JS, Cancer as a ciliopathy: the primary cilium as a new therapeutic target, J. Carcinogenesis Mutagenesis 6 (6) (2015) 1–3. [Google Scholar]
- [12].Fabbri L, Bost F, Mazure NM, Primary cilium in cancer hallmarks, Int. J. Mol. Sci 20 (6) (2019). [DOI] [PMC free article] [PubMed] [Google Scholar]
- [13].Nobutani K, Shimono Y, Yoshida M, Mizutani K, Minami A, Kono S,Mukohara T, Yamasaki T, Itoh T, Takao S, Minami H, Azuma T, Takai Y, Absence of primary cilia in cell cycle-arrested human breast cancer cells, Genes Cells 19 (2) (2014) 141–152. [DOI] [PubMed] [Google Scholar]
- [14].Wong SY, Seol AD, So PL, Ermilov AN, Bichakjian CK, Epstein EH Jr., Dlugosz AA, Reiter JF, Primary cilia can both mediate and suppress Hedgehog pathway-dependent tumorigenesis, Nat. Med 15 (9) (2009) 1055–1061. [DOI] [PMC free article] [PubMed] [Google Scholar]
- [15].Gerhardt C, Leu T, Lier JM, Ruther U, The cilia-regulated proteasome and its role in the development of ciliopathies and cancer, Cilia 5 (2016) 14. [DOI] [PMC free article] [PubMed] [Google Scholar]
- [16].Basten SG, Giles RH, Functional aspects of primary cilia in signaling, cell cycle and tumorigenesis, Cilia 2 (1) (2013) 6. [DOI] [PMC free article] [PubMed] [Google Scholar]
- [17].Goto H, Inaba H, Inagaki M, Mechanisms of ciliogenesis suppression in dividing cells, Cell. Mol. Life Sci 74 (5) (2017) 881–890. [DOI] [PMC free article] [PubMed] [Google Scholar]
- [18].Sorokin SP, Reconstructions of centriole formation and ciliogenesis in mammalian lungs, J. Cell Sci 3 (2) (1968) 207–230. [DOI] [PubMed] [Google Scholar]
- [19].Ishikawa H, Marshall WF, Ciliogenesis: building the cell’s antenna, Nat. Rev. Mol. Cell Biol 12 (4) (2011) 222–234. [DOI] [PubMed] [Google Scholar]
- [20].Tucker RW, Pardee AB, Fujiwara K, Centriole ciliation is related to quiescence and DNA synthesis in 3T3 cells, Cell 17 (3) (1979) 527–535. [DOI] [PubMed] [Google Scholar]
- [21].Nauli SM, Zhou J, Polycystins and mechanosensation in renal and nodal cilia, BioEssays 26 (8) (2004) 844–856. [DOI] [PubMed] [Google Scholar]
- [22].Eguether T, Hahne M, Mixed signals from the cell’s antennae: primary cilia in cancer, EMBO Rep. 19 (11) (2018). [DOI] [PMC free article] [PubMed] [Google Scholar]
- [23].Gradilone SA, Radtke BN, Bogert PS, Huang BQ, Gajdos GB, LaRusso NF, HDAC6 inhibition restores ciliary expression and decreases tumor growth, Cancer Res. 73 (7) (2013) 2259–2270. [DOI] [PMC free article] [PubMed] [Google Scholar]
- [24].Schraml P, Frew IJ, Thoma CR, Boysen G, Struckmann K, Krek W, Moch H, Sporadic clear cell renal cell carcinoma but not the papillary type is characterized by severely reduced frequency of primary cilia, Mod. Pathol 22 (1) (2009) 31–36. [DOI] [PubMed] [Google Scholar]
- [25].Jenks AD, Vyse S, Wong JP, Kostaras E, Keller D, Burgoyne T, Shoemark A,Tsalikis A, de la Roche M, Michaelis M, Cinatl J Jr., Huang PH, Tanos BE, Primary cilia mediate diverse kinase inhibitor resistance mechanisms in cancer, Cell Rep. 23 (10) (2018) 3042–3055. [DOI] [PMC free article] [PubMed] [Google Scholar]
- [26].Simons M, Gloy J, Ganner A, Bullerkotte A, Bashkurov M, Kronig C,Schermer B, Benzing T, Cabello OA, Jenny A, Mlodzik M, Polok B, Driever W,Obara T, Walz G, Inversin, the gene product mutated in nephronophthisis type II, functions as a molecular switch between Wnt signaling pathways, Nat. Genet 37 (5) (2005) 537–543. [DOI] [PMC free article] [PubMed] [Google Scholar]
- [27].Schneider L, Clement CA, Teilmann SC, Pazour GJ, Hoffmann EK, Satir P, Christensen ST, PDGFRalphaalpha signaling is regulated through the primary cilium in fibroblasts, Curr. Biol 15 (20) (2005) 1861–1866. [DOI] [PubMed] [Google Scholar]
- [28].Veland IR, Awan A, Pedersen LB, Yoder BK, Christensen ST, Primary cilia and signaling pathways in mammalian development, health and disease, Nephron Physiol 111 (3) (2009) 39–53. [DOI] [PMC free article] [PubMed] [Google Scholar]
- [29].Bergmann C, Fliegauf M, Bruchle NO, Frank V, Olbrich H, Kirschner J,Schermer B, Schmedding I, Kispert A, Kranzlin B, Nurnberg G, Becker C,Grimm T, Girschick G, Lynch SA, Kelehan P, Senderek J, Neuhaus TJ,Stallmach T, Zentgraf H, Nurnberg P, Gretz N, Lo C, Lienkamp S, Schafer T,Walz G, Benzing T, Zerres K, Omran H, Loss of nephrocystin-3 function can cause embryonic lethality, Meckel-Gruber-like syndrome, situs inversus, and renal-hepatic-pancreatic dysplasia, Am. J. Hum. Genet 82 (4) (2008) 959–970. [DOI] [PMC free article] [PubMed] [Google Scholar]
- [30].Lancaster MA, Schroth J, Gleeson JG, Subcellular spatial regulation of canonical Wnt signalling at the primary cilium, Nat. Cell Biol 13 (6) (2011) 700–707. [DOI] [PMC free article] [PubMed] [Google Scholar]
- [31].Sherpa RT, Atkinson KF, Ferreira VP, Nauli SM, Rapamycin increases length and mechanosensory function of primary cilia in renal epithelial and vascular endothelial cells, Int Educ Res J 2 (12) (2016) 91–97. [PMC free article] [PubMed] [Google Scholar]
- [32].Khan NA, Willemarck N, Talebi A, Marchand A, Binda MM, Dehairs J,Rueda-Rincon N, Daniels VW, Bagadi M, Thimiri Govinda Raj DB,Vanderhoydonc F, Munck S, Chaltin P, Swinnen JV, Identification of drugs that restore primary cilium expression in cancer cells, Oncotarget 7 (9) (2016) 9975–9992. [DOI] [PMC free article] [PubMed] [Google Scholar]
- [33].Aboualaiwi WA, Muntean BS, Ratnam S, Joe B, Liu L, Booth RL, Rodriguez I, Herbert BS, Bacallao RL, Fruttiger M, Mak TW, Zhou J, Nauli SM, Survivin-induced abnormal ploidy contributes to cystic kidney and aneurysm formation, Circulation 129 (6) (2014) 660–672. [DOI] [PMC free article] [PubMed] [Google Scholar]
- [34].Xu C, Shmukler BE, Nishimura K, Kaczmarek E, Rossetti S, Harris PC,Wandinger-Ness A, Bacallao RL, Alper SL, Attenuated, flow-induced ATP release contributes to absence of flow-sensitive, purinergic Cai2+ signaling in human ADPKD cyst epithelial cells, Am. J. Physiol. Renal. Physiol 296 (6) (2009) F1464–F1476. [DOI] [PMC free article] [PubMed] [Google Scholar]
- [35].Kaighn ME, Narayan KS, Ohnuki Y, Lechner JF, Jones LW, Establishment and characterization of a human prostatic carcinoma cell line (PC-3), Invest. Urol 17(1) (1979) 16–23. [PubMed] [Google Scholar]
- [36].Stone KR, Mickey DD, Wunderli H, Mickey GH, Paulson DF, Isolation of a human prostate carcinoma cell line (DU 145), Int. J. Cancer 21 (3) (1978) 274–281. [DOI] [PubMed] [Google Scholar]
- [37].Kimaro Mlacha SZ, Romero-Steiner S, Hotopp JC, Kumar N, Ishmael N,Riley DR, Farooq U, Creasy TH, Tallon LJ, Liu X, Goldsmith CS, Sampson J, Carlone GM, Hollingshead SK, Scott JA, Tettelin H, Phenotypic, genomic, and transcriptional characterization of Streptococcus pneumoniae interacting with human pharyngeal cells, BMC Genom. 14 (2013) 383. [DOI] [PMC free article] [PubMed] [Google Scholar]
- [38].Nauli SM, Jin X, AbouAlaiwi WA, El-Jouni W, Su X, Zhou J, Non-motile primary cilia as fluid shear stress mechanosensors, Meth. Enzymol 525 (2013) 1–20. [DOI] [PMC free article] [PubMed] [Google Scholar]
- [39].AbouAlaiwi WA, Rodriguez I, Nauli SM, Spectral karyotyping to study chromosome abnormalities in humans and mice with polycystic kidney disease, J. Vi. sExp 60 (2012). [DOI] [PMC free article] [PubMed] [Google Scholar]
- [40].Hua K, Ferland RJ, Fixation methods can differentially affect ciliary protein immunolabeling, Cilia 6 (2017) 5. [DOI] [PMC free article] [PubMed] [Google Scholar]
- [41].Kim MS, Froese CD, Xie H, Trimble WS, Immunofluorescent staining of septins in primary cilia, Methods Cell Biol. 136 (2016) 269–283. [DOI] [PubMed] [Google Scholar]
- [42].Ferruzzi P, Mennillo F, De Rosa A, Giordano C, Rossi M, Benedetti G, Magrini R,Pericot Mohr G, Miragliotta V, Magnoni L, Mori E, Thomas R, Tunici P,Bakker A, In vitro and in vivo characterization of a novel Hedgehog signaling antagonist in human glioblastoma cell lines, Int. J. Cancer 131 (2) (2012) E33–E44. [DOI] [PubMed] [Google Scholar]
- [43].Corbit KC, Aanstad P, Singla V, Norman AR, Stainier DY, Reiter JF, Vertebrate Smoothened functions at the primary cilium, Nature 437 (7061) (2005) 1018–1021. [DOI] [PubMed] [Google Scholar]
- [44].De Vries WN, Evsikov AV, Haac BE, Fancher KS, Holbrook AE, Kemler R,Solter D, Knowles BB, Maternal beta-catenin and E-cadherin in mouse development, Development 131 (18) (2004) 4435–4445. [DOI] [PubMed] [Google Scholar]
- [45].Sabatini DM, Erdjument-Bromage H, Lui M, Tempst P, Snyder SH, RAFT1: a mammalian protein that binds to FKBP12 in a rapamycin-dependent fashion and is homologous to yeast TORs, Cell 78 (1) (1994) 35–43. [DOI] [PubMed] [Google Scholar]
- [46].Pullen N, Thomas G, The modular phosphorylation and activation of p70s6k, FEBS Lett. 410 (1) (1997) 78–82. [DOI] [PubMed] [Google Scholar]
- [47].AbouAlaiwi WA, Ratnam S, Booth RL, Shah JV, Nauli SM, Endothelial cells from humans and mice with polycystic kidney disease are characterized by polyploidy and chromosome segregation defects through survivin down-regulation, Hum. Mol. Genet 20 (2) (2011) 354–367. [DOI] [PMC free article] [PubMed] [Google Scholar]
- [48].Burtey S, Riera M, Ribe E, Pennenkamp P, Rance R, Luciani J, Dworniczak B, Mattei MG, Fontes M, Centrosome overduplication and mitotic instability in PKD2 transgenic lines, Cell Biol. Int 32 (10) (2008) 1193–1198. [DOI] [PubMed] [Google Scholar]
- [49].Battini L, Macip S, Fedorova E, Dikman S, Somlo S, Montagna C, Gusella GL, Loss of polycystin-1 causes centrosome amplification and genomic instability, Hum. Mol. Genet 17 (18) (2008) 2819–2833. [DOI] [PMC free article] [PubMed] [Google Scholar]
- [50].Beheshti B, Park PC, Sweet JM, Trachtenberg J, Jewett MA, Squire JA, Evidence of chromosomal instability in prostate cancer determined by spectral karyotyping (SKY) and interphase fish analysis, Neoplasia 3 (1) (2001) 62–69. [DOI] [PMC free article] [PubMed] [Google Scholar]
- [51].Strefford JC, Lillington DM, Young BD, Oliver RT, The use of multicolor fluorescence technologies in the characterization of prostate carcinoma cell lines: a comparison of multiplex fluorescence in situ hybridization and spectral karyotyping data, Cancer Genet. Cytogenet 124 (2) (2001) 112–121. [DOI] [PubMed] [Google Scholar]
- [52].Zhang J, Lipinski RJ, Gipp JJ, Shaw AK, Bushman W, Hedgehog pathway responsiveness correlates with the presence of primary cilia on prostate stromal cells, BMC Dev. Biol 9 (2009) 50. [DOI] [PMC free article] [PubMed] [Google Scholar]
- [53].Hassounah NB, Nagle R, Saboda K, Roe DJ, Dalkin BL, McDermott KM, Primary cilia are lost in preinvasive and invasive prostate cancer, PLoS ONE 8 (7) (2013) e68521. [DOI] [PMC free article] [PubMed] [Google Scholar]
- [54].Yasar B, Linton K, Slater C, Byers R, Primary cilia are increased in number and demonstrate structural abnormalities in human cancer, J. Clin. Pathol 70 (7) (2017) 571–574. [DOI] [PubMed] [Google Scholar]
- [55].Han YG, Kim HJ, Dlugosz AA, Ellison DW, Gilbertson RJ, Alvarez-Buylla A, Dual and opposing roles of primary cilia in medulloblastoma development, Nat. Med 15 (9) (2009) 1062–1065. [DOI] [PMC free article] [PubMed] [Google Scholar]
- [56].Xie G, Ao X, Lin T, Zhou G, Wang M, Wang H, Chen Y, Li X, Xu B, He W,Han H, Ramot Y, Paus R, Yue Z, E-cadherin-mediated cell contact controls the epidermal damage response in radiation dermatitis, J, Invest. Dermatol 137 (8) (2017) 1731–1739. [DOI] [PubMed] [Google Scholar]
- [57].Lecuit T, Yap AS, E-cadherin junctions as active mechanical integrators in tissue dynamics, Nat. Cell Biol 17 (5) (2015) 533–539. [DOI] [PubMed] [Google Scholar]
- [58].Perez-Moreno M, Fuchs E, Catenins: keeping cells from getting their signals crossed, Dev. Cell 11 (5) (2006) 601–612. [DOI] [PMC free article] [PubMed] [Google Scholar]
- [59].Fagotto F, Funayama N, Gluck U, Gumbiner BM, Binding to cadherins antagonizes the signaling activity of beta-catenin during axis formation in Xenopus, J. Cell Biol 132 (6) (1996) 1105–1114. [DOI] [PMC free article] [PubMed] [Google Scholar]
- [60].Heasman J, Crawford A, Goldstone K, Garner-Hamrick P, Gumbiner B, McCrea P, Kintner C, Noro CY, Wylie C, Overexpression of cadherins and underexpression of beta-catenin inhibit dorsal mesoderm induction in early Xenopus embryos, Cell 79 (5) (1994) 791–803. [DOI] [PubMed] [Google Scholar]
- [61].Gottardi CJ, Wong E, Gumbiner BM, E-cadherin suppresses cellular transformation by inhibiting beta-catenin signaling in an adhesion-independent manner, J. Cell Biol 153 (5) (2001) 1049–1060. [DOI] [PMC free article] [PubMed] [Google Scholar]
- [62].Orford K, Orford CC, Byers SW, Exogenous expression of beta-catenin regulates contact inhibition, anchorage-independent growth, anoikis, and radiation-induced cell cycle arrest, J. Cell Biol 146 (4) (1999) 855–868. [DOI] [PMC free article] [PubMed] [Google Scholar]
- [63].Ostano P, Bione S, Belgiovine C, Chiodi I, Ghimenti C, Scovassi AI, Chiorino G,Mondello C, Cross-analysis of gene and miRNA genome-wide expression profiles in human fibroblasts at different stages of transformation, OMICS 16 (1–2) (2012) 24–36. [DOI] [PMC free article] [PubMed] [Google Scholar]
- [64].Li J, Kim SG, Blenis J, Rapamycin: one drug, many effects, Cell Metab. 19 (3) (2014) 373–379. [DOI] [PMC free article] [PubMed] [Google Scholar]
- [65].Laplante M, Sabatini DM, mTOR signaling in growth control and disease, Cell 149(2) (2012) 274–293. [DOI] [PMC free article] [PubMed] [Google Scholar]
- [66].Yecies JL, Manning BD, Transcriptional control of cellular metabolism by mTOR signaling, Cancer Res. 71 (8) (2011) 2815–2820. [DOI] [PMC free article] [PubMed] [Google Scholar]
- [67].Csibi A, Fendt SM, Li C, Poulogiannis G, Choo AY, Chapski DJ, Jeong SM, Dempsey JM, Parkhitko A, Morrison T, Henske EP, Haigis MC, Cantley LC,Stephanopoulos G, Yu J, Blenis J, The mTORC1 pathway stimulates glutamine metabolism and cell proliferation by repressing SIRT4, Cell 153 (4) (2013) 840–854. [DOI] [PMC free article] [PubMed] [Google Scholar]
- [68].Johnson SC, Rabinovitch PS, Kaeberlein M, mTOR is a key modulator of ageing and age-related disease, Nature 493 (7432) (2013) 338–345. [DOI] [PMC free article] [PubMed] [Google Scholar]
- [69].Chung J, Kuo CJ, Crabtree GR, Blenis J, Rapamycin-FKBP specifically blocks growth-dependent activation of and signaling by the 70 kd S6 protein kinases, Cell 69 (7) (1992) 1227–1236. [DOI] [PubMed] [Google Scholar]
- [70].Krebs M, Brunmair B, Brehm A, Artwohl M, Szendroedi J, Nowotny P, Roth E,Furnsinn C, Promintzer M, Anderwald C, Bischof M, Roden M, The Mammalian target of rapamycin pathway regulates nutrient-sensitive glucose uptake in man, Diabetes 56 (6) (2007) 1600–1607. [DOI] [PubMed] [Google Scholar]
- [71].Bell A, Grunder L, Sorisky A, Rapamycin inhibits human adipocyte differentiation in primary culture, Obes. Res 8 (3) (2000) 249–254. [DOI] [PubMed] [Google Scholar]
- [72].Chang GR, Chiu YS, Wu YY, Chen WY, Liao JW, Chao TH, Mao FC, Rapamycin protects against high fat diet-induced obesity in C57BL/6J mice, J. Pharmacol. Sci 109 (4) (2009) 496–503. [DOI] [PubMed] [Google Scholar]
- [73].Lamming DW, Ye L, Sabatini DM, Baur JA, Rapalogs and mTOR inhibitors as anti-aging therapeutics, J. Clin. Invest 123 (3) (2013) 980–989. [DOI] [PMC free article] [PubMed] [Google Scholar]
- [74].Harrison DE, Strong R, Sharp ZD, Nelson JF, Astle CM, Flurkey K, Nadon NL, Wilkinson JE, Frenkel K, Carter CS, Pahor M, Javors MA, Fernandez E,Miller RA, Rapamycin fed late in life extends lifespan in genetically heterogeneous mice, Nature 460 (7253) (2009) 392–395. [DOI] [PMC free article] [PubMed] [Google Scholar]
- [75].Chien AJ, Haydu LE, Biechele TL, Kulikauskas RM, Rizos H, Kefford RF, Scolyer RA, Moon RT, Long GV, Targeted BRAF inhibition impacts survival in melanoma patients with high levels of Wnt/beta-catenin signaling, PLoS ONE 9 (4) (2014) e94748. [DOI] [PMC free article] [PubMed] [Google Scholar]
- [76].Arensman MD, Kovochich AN, Kulikauskas RM, Lay AR, Yang PT, Li X,Donahue T, Major MB, Moon RT, Chien AJ, Dawson DW, WNT7B mediates autocrine Wnt/beta-catenin signaling and anchorage-independent growth in pancreatic adenocarcinoma, Oncogene 33 (7) (2014) 899–908. [DOI] [PMC free article] [PubMed] [Google Scholar]
- [77].Lu D, Zhao Y, Tawatao R, Cottam HB, Sen M, Leoni LM, Kipps TJ, Corr M, Carson DA, Activation of the Wnt signaling pathway in chronic lymphocytic leukemia, Proc. Natl. Acad. Sci. U.S.A 101 (9) (2004) 3118–3123. [DOI] [PMC free article] [PubMed] [Google Scholar]
- [78].Lin SY, Xia W, Wang JC, Kwong KY, Spohn B, Wen Y, Pestell RG, Hung MC, Beta-catenin, a novel prognostic marker for breast cancer: its roles in cyclin D1 expression and cancer progression, Proc. Natl. Acad. Sci. U.S.A 97 (8) (2000) 4262–4266. [DOI] [PMC free article] [PubMed] [Google Scholar]
- [79].Wuebken A, Schmidt-Ott KM, WNT/beta-catenin signaling in polycystic kidney disease, Kidney Int. 80 (2) (2011) 135–138. [DOI] [PubMed] [Google Scholar]
- [80].Chen G, Shukeir N, Potti A, Sircar K, Aprikian A, Goltzman D, Rabbani SA, Upregulation of Wnt-1 and beta-catenin production in patients with advanced metastatic prostate carcinoma: potential pathogenetic and prognostic implications, Cancer 101 (6) (2004) 1345–1356. [DOI] [PubMed] [Google Scholar]
- [81].He B, You L, Uematsu K, Xu Z, Lee AY, Matsangou M, McCormick F,Jablons DM, A monoclonal antibody against Wnt-1 induces apoptosis in human cancer cells, Neoplasia 6 (1) (2004) 7–14. [DOI] [PMC free article] [PubMed] [Google Scholar]
- [82].Horvath LG, Henshall SM, Lee CS, Kench JG, Golovsky D, Brenner PC,O’Neill GF, Kooner R, Stricker PD, Grygiel JJ, Sutherland RL, Lower levels of nuclear beta-catenin predict for a poorer prognosis in localized prostate cancer, Int.J. Cancer 113 (3) (2005) 415–422. [DOI] [PubMed] [Google Scholar]
- [83].Zeng H, Lu B, Zamponi R, Yang Z, Wetzel K, Loureiro J, Mohammadi S,Beibel M, Bergling S, Reece-Hoyes J, Russ C, Roma G, Tchorz JS, Capodieci P,Cong F, mTORC1 signaling suppresses Wnt/beta-catenin signaling through DVL-dependent regulation of Wnt receptor FZD level, Proc. Natl. Acad. Sci. U.S.A 115(44) (2018) E10362–E10369. [DOI] [PMC free article] [PubMed] [Google Scholar]
- [84].Gao K, Wang YS, Yuan YJ, Wan ZH, Yao TC, Li HH, Tang PF, Mei XF, Neuroprotective effect of rapamycin on spinal cord injury via activation of the Wnt/beta-catenin signaling pathway, Neural Regen Res 10 (6) (2015) 951–957. [DOI] [PMC free article] [PubMed] [Google Scholar]