

SUMMARY
Cells in renewing tissues exhibit dramatic transcriptional changes as they differentiate. The contribution of chromatin looping to tissue renewal is incompletely understood. Enhancer-promoter interactions could be relatively stable as cells transition from progenitor to differentiated states; alternatively, chromatin looping could be as dynamic as the gene expression from their loci. The intestinal epithelium is the most rapidly renewing mammalian tissue. Proliferative cells in crypts of Lieberkühn sustain a stream of differentiated cells that are continually shed into the lumen. We apply chromosome conformation capture combined with chromatin immunoprecipitation (HiChIP) and sequencing to measure enhancer-promoter interactions in progenitor and differentiated cells of the intestinal epithelium. Despite dynamic gene regulation across the differentiation axis, we find that enhancer-promoter interactions are relatively stable. Functionally, we find HNF4 transcription factors are required for chromatin looping at target genes. Depletion of HNF4 disrupts local chromatin looping, histone modifications, and target gene expression. This study provides insights into transcriptional regulatory mechanisms governing homeostasis in renewing tissues.
In Brief
Chen et al. provide a survey of enhancer-promoter 3D looping in the intestinal epithelium by HiChIP, in vivo. They find that enhancer-promoter interactions are highly dependent upon the key intestinal transcription factor HNF4. Their findings provide insights into transcriptional regulatory mechanisms governing homeostasis in renewing tissues.
Graphical Abstract
INTRODUCTION
Three-dimensional (3D) genome organization promotes and restricts the access of cis-regulatory elements to their target genes and is one of the more recently appreciated mechanisms controlling gene regulation. 3D interactions within the genome are largely restricted to intrachromosomal contacts, and within chromosomes, these interactions are largely partitioned into topologically associated domains (TADs) (Dekker and Mirny, 2016; Hnisz et al., 2016; Krijger and de Laat, 2016). Enhancers act across large genomic distances (Smallwood and Ren, 2013) within a TAD and are brought into close proximity of their target promoters through chromatin looping. Enhancers can thus function independently of their orientation, distance, and direction from their target genes, as these characteristics are not likely to be impacted within the 3D space occupied by TAD chromatin. While great strides have been made in characterizing how spatial genome configuration impacts gene expression, the roles of enhancer-promoter interactions are less explored. These interactions have been observed to be dynamic in some developmental conditions (Bonev et al., 2017; Du et al., 2017; Ke et al., 2017; Palstra et al., 2003; Wang et al., 2019) and more stable in others (Ray et al., 2019). Furthermore, tissue-specific utilization of enhancer-promoter interactions in dynamic adult tissues has been unclear. It is important to identify whether chromatin interactions are stable or dynamic during the rapid and essential physiological and homeostatic processes that occur in renewing tissues.
The adult mammalian intestinal epithelium turns over approximately every 3–5 days and must balance an active progenitor cell population to support this cellular turnover, while maintaining a functional, differentiated cell population to carry out the roles of nutrient transport and barrier integrity. HiChIP combines Hi-C (genome-wide chromosome conformation capture sequencing [3C-seq]) and Tn5 transposase-mediated library construction with ChIP to identify specific chromatin looping events (Mumbach et al., 2016). An exciting application of HiChIP is the ability to more easily target intra-TAD interactions due to the ChIP step. Here, we apply H3K4me3 HiChIP to identify enhancer and promoter interactions in the crypts and villi of the mouse adult intestinal epithelium. We find that dynamic interactions are observed within TADs in the intestinal epithelial genome and that these dynamic chromatin looping events correlate with changes in gene expression that occur across the crypt-villus boundary. Importantly, we note that in comparison with the gene expression changes, enhancer and promoter interactions are relatively stable across these cell boundaries, suggesting that alternative mechanisms may be in place to mediate dynamic gene expression changes as cells differentiate. Finally, we report that members of a key intestinal transcription factor family, HNF4, facilitate long-range chromatin interactions at their target genes. This study provides high-resolution views on chromatin looping and its role in transcriptional regulation in intestinal epithelial cells.
RESULTS
A survey of enhancer-promoter 3D looping in the intestinal epithelium
To first establish the set of genes that are dynamically regulated across the crypt-to-villus transition, we analyzed RNA-seq data from these isolated epithelial compartments. More than 2,000 genes were found to be significantly enriched in one compartment with respect to the other (Figure 1A, false discovery rate [FDR] < 0.05). Considering that a typical cell expresses ~12,000 genes in the murine genome (Hastie and Bishop, 1976), it is remarkable that such a large portion of the epithelial transcriptome shifts in the short window of time during which crypt cells transition onto the villi. Gene Ontology (GO) term analysis of these differentially expressed transcripts indicates functions associated with mature enterocytes on villi (such as transporters, lipid metabolism, and brush border), whereas transcripts associated with proliferating cells are enriched in crypts (Figure 1B; Table S1). Examples of dynamic transcripts include Vil1, which is enriched in villus epithelium, and Mki67, which is enriched in crypts (Figure 1C). The protein products of these transcripts are differentially localized in crypt or villus compartments, as expected, when labeled by immunofluorescence staining (Figure 1D). These analyses highlight a large-scale shift in the epithelial transcriptome as cells undergo maturation in the intestinal epithelium and prompted us to investigate whether dynamic enhancer-promoter interactions were responsible for these gene expression changes.
Figure 1. H3K4me3 HiChIP catalogs 3D chromatin looping events from promoters of the intestinal epithelium.

(A) Heatmap of villus-enriched and crypt-enriched genes identified by RNA-seq analysis reveals a dynamic transcriptome as cells transition from crypts and differentiate on villi (n = 5 crypts and 3 villi; Cuffdiff FDR < 0.05; GEO: GSE53545, GSE70766, and GSE102171).
(B) Functional annotation (DAVID) of villus-enriched and crypt-enriched genes. p values were calculated using DAVID (see full table in Table S1).
(C and D) Examples are shown by (C) RNA-seq tracks and (D) immunofluorescence staining that Villin and Ki67 are enriched in villus and crypt compartment, respectively.
(E–H) H3K4me3 HiChIP-seq reveals chromatin interactions of isolated duodenal crypt or villus epithelium (n = 2 biological replicates). Genomic regions harboring significant interactions (q ≤ 0.0001 and counts ≥ 4, 2 replicates each condition) were analyzed for their chromatin profiles across the crypt-villus axis. Loops with q ≤ 0.0001 and counts ≥ 8 (combined 2 replicates) were visualized with the Sushi package.
(E and F) Percentage (E) and examples (F) of promoter-promoter loops, promoter-enhancer loops, and enhancer-enhancer loops identified in villus and crypt cells.
(G) Number of significant chromatin interactions identified for each annotated promoter (UCSC transcription start site). The diameter of each circle corresponds to the number of promoters.
(H) Distribution in the distance of significant chromatin loops identified by H3K4me3 HiChIP-seq.
To mediate dramatic swings in the intestinal transcriptome that occur during differentiation, chromatin looping between enhancers and promoters could prove to be equally dynamic and thus dictate rates of transcriptional bursts. Alternatively, enhancer-promoter loops could remain relatively stable between crypt and villus cells, and the dynamic transcriptional changes that occur during intestinal differentiation may be mediated by downstream transcriptional processes. To resolve these possibilities, we used HiChIP to define enhancer-promoter interactions in the intestinal epithelium. This methodology, developed by Mumbach et al. (2016), enables efficient detection of 3D chromatin interactions by first crosslinking nuclei to capture chromatin looping events and then performing digestion and ligation to capture these interactions via de novo DNA sequences. Captured chromatin interactions can be enriched by immunoprecipitation for chromatin-associated proteins of interest. To capture enhancer-promoter communication events that could be governing transcriptional changes during intestinal differentiation, we conducted HiChIP using anti-H3K4me3 antibodies; H3K4me3 is a prominent histone modification localized specifically to promoter chromatin. Chromatin interactions were called with hichipper (q ≤ 0.0001, counts ≥ 4; Table S2). In both the crypt and villus compartments, the predominant class of interactions included annotated promoter regions, as expected due to ChIP enrichment using anti-H3K4me3 antibodies. We categorized three classes of interactions: promoter-promoter interactions and enhancer-promoter interactions were the predominant types of interactions observed, along with a small subset of enhancer-enhancer interactions (Figure 1E). Enhancer-enhancer interactions were presumably captured while in proximity to H3K4me3-marked promoters or due to low levels of H3K4me3 that have been reported at enhancer regions (Heintzman et al., 2007). Examples of each category of interaction can be observed in genes associated with crypt-enriched and villus-enriched expression (Figure 1F). In both crypts and villi, the majority of active promoters were involved in more than one interaction (Figure 1G), and while the majority of chromatin interactions occurred within 500 kb, some chromatin interactions were observed spanning megabases of genomic space (Figures 1H and S1).
Chromatin looping is dynamic but relatively stable across the crypt-villus axis compared with corresponding changes in gene expression levels
To understand how chromatin looping might impact changes in gene expression across the crypt-villus transition, we integrated RNA-seq data from isolated crypt or villus epithelium with HiChIP data collected from the same tissues. We first stratified chromatin regions based upon the changes in looping counts between crypts and villi. Promoters with decreased looping events (measured by HiChIP reads) collectively exhibited reduced transcript levels of their genes, while promoters involved in increased numbers of looping events exhibited an increase in RNA transcript levels (Figure 2A). Stark examples of these changes were observed in the villus-enriched Slc15a1 gene or in the crypt-enriched Smoc2 gene (Figure S2A). To more quantitatively analyze dynamic looping events across the crypt-to-villus transition, we applied DESeq2. At a p value cutoff of 0.05, 123 regions were considered significantly enriched in chromatin looping events in the villus, whereas 204 chromatin looping events were significantly enriched in crypts (Figure 2B). The number of genes with significant differences in chromatin looping was relatively low compared with the number of differentially expressed genes (Figures 1A and 2B), and the magnitude of the changes in looping strength, as measured by loop read counts, was substantially smaller than the differences in RNA-seq read counts across the crypt-villus junction (Figure 2C). The discrepancy between the magnitude of changes in chromatin looping and the magnitude of changes in RNA transcript levels suggests that differences in chromatin looping may be amplified at the level of RNA transcription (the changes don’t scale linearly) or that alternative regulatory processes downstream of chromatin looping contribute to the greater magnitude shift observed at target gene transcript levels. Nevertheless, the regions that were associated with dynamic chromatin looping were significantly correlated with dynamic gene expression, with increased numbers of HiChIP ligation events at promoters correlating with increased expression levels of the linked genes (Figure 2D, Kolmogorov-Smirnov test, p < 0.001; and Figure S2B). This correlation corroborates the loop calling analysis. Next, we examined whether features of active and accessible chromatin, measured in crypts or villi, corresponded with changes in chromatin looping events. In each case, assay for transposase-accessible chromatin (ATAC)-seq, H3K27ac, and H3K4me2 signals were stronger at regions of dynamic looping in the tissue compartment that exhibited increased HiChIP signals at the corresponding regions (Figure 2E). For example, a cluster of apolipoprotein genes exhibit elevated transcript expression in villi, feature elevated levels of active chromatin signal, and exhibit increased numbers of HiChIP loops in villi (Figure 2F, left panel). A reciprocal relationship is observed at a crypt-enriched gene in the crypt data (Figure 2F, right panel). Taken together, these data indicate that chromatin looping events are dynamic across the crypt-villus axis and that changes in chromatin contacts at promoters of genes expressed in the intestinal epithelium correspond to changes in active chromatin configurations and transcript levels. These findings indicate that 3D chromatin conformation presents a regulatory opportunity for intestinal gene regulation. Indeed, genes harboring dynamic promoter looping are involved in enterocyte functions such as brush-border formation and lipid metabolism on the villus versus membrane anchoring and peptidase activity in crypts (Figure 2G; Table S3).
Figure 2. Differential promoter looping across the crypt-villus axis.

(A) Promoter looping events are correlated with RNA transcript levels of their nearby genes (within 1 kb of transcriptional start sites [TSSs]).
(B) Schematic of differential looping events identified by H3K4me3 HiChIP-seq between villus and crypt samples.
(C) Boxplots show the magnitude of the changes in RNA transcript levels or looping strengths, as measured by RNA-seq FPKM counts of genes detected by Cuffdiff analysis, or H3K4me3 HiChIP-seq read counts (q ≤ 0.0001 and counts ≥ 4), respectively. Boxplot line represents the median; whiskers represent the 10th and 90th percentile (Mann-Whitney test, p < 0.001).
(D–F) Transcript levels of linked genes and levels of active chromatin marks are positively correlated with villus- and crypt-enriched looping events (differential loops, DESeq2 p < 0.05).
(D) Gene set enrichment analysis reveals that genes nearby villus-enriched loops are highly expressed in villus cells, whereas nearby genes of crypt-enriched loops are highly expressed in crypt cells (within 10 kb of TSSs; Kolmogorov-Smirnov test, p < 0.001).
(E) SitePro plots show the average signal profiles of active chromatin markers around villus and crypt-enriched looping regions.
(F) Integrated datasets are shown as examples for HiChIP (combined replicates with loop counts ≥ 8 and q ≤ 0.0001), ATAC-seq, ChIP-seq, and RNA-seq at the indicated villus- and crypt-enriched looping regions.
(G) Functional annotation (DAVID) of genes nearby (within 10 kb of TSSs) villus-enriched and crypt-enriched loops.
p values were calculated using DAVID (see full table in Table S3). RNA-seq (GEO: GSE53545, GSE70766, and GSE102171): n = 5 crypts and 3 villi; H3K4me3 HiChIP-seq: n = 2 biological replicates; ATAC-seq: n = 3 biological replicates; ChIP-seq: one replicate was used for each active chromatin mark, and two active chromatin marks were tested in total.
HNF4 transcription factors promote intestinal enhancer-promoter interactions
Chromatin looping enables transcription-factor-bound distal enhancers to contact their target promoters and regulate transcription. What factors could control promoter-enhancer interactions in the intestinal epithelium? We recently identified that HNF4 paralogs work at distal enhancers and play a critical role in villus differentiation (Chen et al., 2019b). However, it remains unclear whether HNF4 paralogs regulate transcription by instructing enhancer-promoter looping. Previously, we found HNF4 factors work redundantly to activate expression of the majority of villus-enriched genes, with 1,498 (fragments per kilobase of exon model per million reads mapped [FPKM] > 1, FDR < 0.05) of 2,135 villus-enriched genes significantly downregulated upon tamoxifen treatment of Hnf4af/f;Hnf4gcrispr/crispr;Villin-CreERT2 mice (hereafter referred to as Hnf4αγDKO). Notably, 58.6% of these genes are directly bound by HNF4A and HNF4G in ChIP-seq assays (within 30 kb of HNF4 binding sites), indicating that HNF4 is likely a direct regulator of villus gene expression. To determine whether HNF4 factors are required for promoter chromatin looping in the intestinal epithelium, we performed HiChIP in control versus Hnf4αγDKO crypt and villus epithelium (Figure 3A). In each case, a substantial change in chromatin looping events was observed upon loss of HNF4 factors, with far more changes in chromatin looping events observed in the villus compared with in the crypts (Figure 3A). We previously identified 123 villus-enriched loops (Figure 2B); 68 of these loops are significantly disrupted in villi upon HNF4 loss. Correspondingly, the transcript expression levels of genes nearby the villus-enriched looping regions are also significantly going down in Hnf4αγDKO (FigureS3A). Meanwhile, of 204 crypt-enriched loops identified (Figure 2B), only 11 are significantly disrupted in crypts upon HNF4 loss. These results are consistent with HNF4 functioning prominently in villus enterocyte differentiation and gene activation.
Figure 3. HNF4 transcription factors are required for chromatin looping.

(A) Schematic of differential loop calling by H3K4me3 HiChIP-seq between WT and Hnf4αγDKO samples.
(B) Examples of WT- and Hnf4αγDKO-enriched loops (differential loops, DESeq2 p < 0.05).
(C and D) Boxplots (post hoc Dunn’s test was applied following a Kruskal-Wallis test, p < 0.001; C) and GSEA (Kolmogorov-Smirnov test, p < 0.001; D) show that transcriptome level changes in Hnf4αγDKO versus WT (TSS distances in 10-kb windows) are correlated with WT-enriched (loops lost in Hnf4αγDKO) and Hnf4αγDKO-enriched (loops gained in Hnf4αγDKO) looping events from the gene’s promoter. Boxplot line represents the median; whiskers represent the 10th and 90th percentile.
(E and F) Heatmap (E) and SitePro (F) plots show that WT-enriched and Hnf4αγDKO-enriched looping events are correlated with changes in H3K27ac signal of Hnf4αγDKO versus WT and HNF4 binding events. H3K4me3 HiChIP-seq: n = 2 biological replicates; RNA-seq (WT versus Hnf4αγDKO; GSE112946): n = 3 biological replicates; H3K27ac ChIP-seq (WT versus Hnf4αγDKO; GSE112946): n = 2 biological replicates; HNF4 ChIP-seq (WT versus Hnf4αγDKO; GSE112946): n = 2 biological replicates for each HNF4 paralog.
Examples of altered chromatin looping are depicted in Figure 3B. Changes in chromatin looping events upon Hnf4αγDKO correlated with changes in gene expression upon HNF4 loss (Figures 3C and 3D); promoters exhibiting fewer HiChIP interactions in Hnf4αγDKO saw their linked genes exhibit lower transcript levels upon HNF4 knockout, while promoters with increased chromatin looping events had a corresponding increase in their gene transcript levels. We found 25% of the genes significantly altered at the transcript level by 2-fold or more between Hnf4αγDKO versus wild type (WT) (FPKM > 1, log2 fold change [FC] > 1 or < −1) are also changed at the level of chromatin looping. We have reported previously that HNF4 factors are redundantly required to maintain accessible, active enhancer chromatin (Chen et al., 2019a, 2019b). Consistent with these previous findings, chromatin loops affected by HNF4 loss exhibited a corresponding change in enhancer chromatin properties (Figure 3E). Notably, regions losing HiChIP-based chromatin loops were more likely to harbor HNF4 binding sites and exhibit a loss in active chromatin properties (as measured by H3K27ac micrococcal nuclease [MNase] ChIP-seq; Figures 3E, 3F, and S3B; Table S4). Regions exhibiting increased numbers of HiChIP interactions in Hnf4αγDKO cells were less likely to have direct HNF4 binding regions (Figures 3E, right panel, and 3F, bottom panel), suggesting that these regions increase looping efficiency and gain active chromatin structure as an indirect consequence of HNF4 loss. Finally, while disrupted chromatin looping was clearly observed upon HNF4 knockout at thousands of interacting loci, the majority of chromatin loops in the epithelium were unaffected upon HNF4 loss (summarized in Figure 3A, as measured by DESeq2, p < 0.05), indicating that HNF4 is required for local chromatin interactions, but not globally required for looping interactions, within the cell. Taken together, these data indicate that HNF4 factors promote chromatin-chromatin interactions and that these chromatin looping events correspond to active chromatin states and villus-specific gene expression.
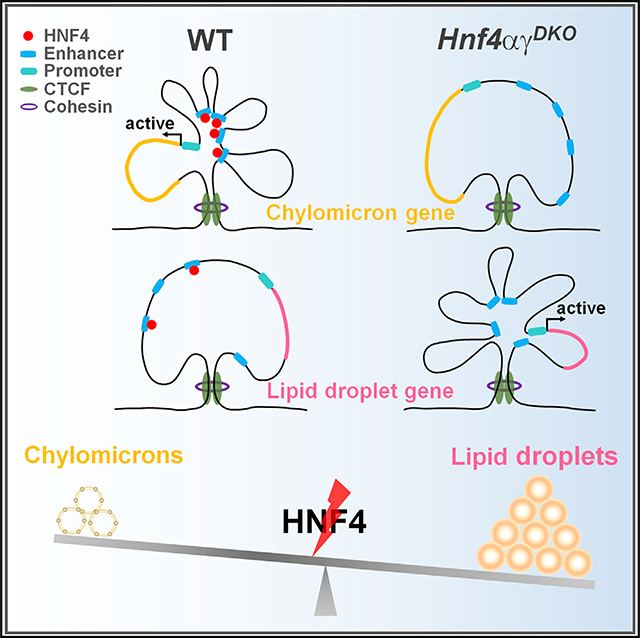
Genes with disrupted chromatin loops upon HNF4 depletion are associated with controlling metabolic processes involving lipids, oxoacids, and steroids. Conversely, chromatin loops gained upon HNF4 depletion are more associated with regulating biosynthetic processes and the response to stress/oxygen levels (Figure S3C; Table S4). Therefore, we sought to apply H3K4me3 HiChIP data to refine our understanding of HNF4-dependent regulation of lipid metabolism (Chen et al., 2019b, 2019c). In examples of genes critical to both chylomicron production (Figures 4A, 4B, and S4A) and cytoplasmic lipid droplet production (Figures 4C and S4B), we gain a better appreciation for the potential contribution of distal regulatory elements and promoter-promoter interactions that are likely contributing to transcription of these loci. In each example of chylomicron genes, HNF4 binds to these regulatory regions and is required for both high levels of active chromatin (H3K27ac) and to maintain levels of transcription (RNA-seq). In each case, the number of chromatin looping events is reduced upon loss of HNF4 factors. Conversely, for genes implicated in lipid droplet synthesis, HNF4 binding is less pronounced, and both chromatin looping events and transcript expression are increased at these loci. Since HNF4 factors are not binding robustly at lipogenesis gene loci in control mouse epithelium, we suspect that activation of lipid-droplet-associated chromatin increased 3D interactions and that transcript levels are all secondary events, indirectly due to HNF4 inactivation. These changes in gene regulation can be observed in epithelium from control versus HNF4 mutant mice (Figures 4C and S4B), where accumulation of cytoplasmic lipid droplets is observed in duodenal enterocytes lacking HNF4 transcription factors (via oil red O staining and transmission electron microscopy [TEM]; Figures 4D and 4E). Taken together, HNF4 may play an important role in intestinal lipid metabolism through regulation of chromatin looping between enhancers and promoters of genes involved in chylomicron production and lipid droplet production (Figure 4F).
Figure 4. HNF4 transcription factors regulate intestinal lipid metabolism and chromatin looping at lipid regulatory genes.

(A–C) HNF4 transcription factors regulate genes involved in (A and B) chylomicron production and (C) lipid droplet production through chromatin looping. Differential loops (DESeq2 p < 0.05) from duodenal villi are visualized by Sushi (loops shown with q ≤ 0.0001 and counts ≥ 8, 2 combined biological replicates per condition). Additional examples are shown in Figure S4. H3K4me3 HiChIP-seq: n = 2 biological replicates; H3K27ac ChIP-seq (WT versus Hnf4αγDKO; GSE112946): n = 2 biological replicates; HNF4 ChIP-seq (WT versus Hnf4αγDKO; GSE112946): n = 2 biological replicates for each HNF4 paralog; RNA-seq (WT versus Hnf4αγDKO; GSE112946): n = 3 biological replicates, Cuffdiff FDR < 0.001***.
(D) Control mice fed a regular chow (LabDiet 5053, 10% kcal fat diet) rarely exhibit oil red O staining in enterocytes, but increased lipid staining is observed in Hnf4αγDKO mice after 4 days of tamoxifen-induced knockout (representative of 3 biological replicates).
(E) Transmission electron microscopy images show numerous lipid granules in Hnf4αγDKO enterocytes after 4 days of tamoxifen-induced knockout (n = 4 biological replicates).
(F) Summary schematic of results: loss of HNF4 factors results in downregulation of chylomicron production genes (blue color) and upregulation of lipid droplet genes (red color).
DISCUSSION
The intestinal epithelium turns over within 3–5 days. In this very short time window, dramatic transcriptional changes occur in cells migrating from crypt to villus. How is chromatin folding regulated throughout this transition from proliferative to differentiated states? Are promoter chromatin loops as dynamic as the corresponding changes in the transcriptome? Our H3K4me3 HiChIP analysis demonstrates enhancer-promoter interactions of the intestinal epithelial genome. We observe a surprisingly stable set of interactions between promoters and enhancers in the intestinal epithelium across the crypt-villus axis. We find that enhancer and promoter interactions exhibit a range of interaction strengths but that interactions are typically detectable in both the crypt and villus compartment, and the changes in chromatin looping strength are modest compared with the corresponding changes in the transcriptome. We propose that as cells transition from the crypt to villus compartment, dynamic gene expression is mainly accomplished through existing chromatin loops, which are strengthened and/or stabilized by factors such as HNF4.
A major challenge for the future will be to study the 3D configuration of the genome in different cell lineages of the intestine. A low-input Hi-C method could help measure chromatin conformation with low amounts of starting material (Díaz et al., 2018). We cannot rule out possible limitations of the technology as well as the cellular heterogeneity of the crypt and villus cells. These considerations could be limiting our ability to detect certain chromatin interactions. Additionally, other transcriptional regulatory mechanisms are likely contributing to differences in crypt versus villus gene expression. For example, different co-activators or signaling molecules present in crypt and villus compartments likely contribute to dynamic gene expression as cells differentiate. Strong precedents have established that extracellular signaling pathways are dynamic across the crypt-villus junction (Gregorieff et al., 2005; Haramis et al., 2004; He et al., 2004; McCarthy et al., 2020), and these pathways funnel into nuclear co-activators that shape crypt-villus gene expression dynamics. Whether these signaling pathways impact enhancer-promoter interaction strengths is an important next question.
STAR★METHODS
RESOURCE AVAILABILITY
Lead contact
Further information and requests for resources and reagents should be directed to and will be fulfilled by the lead contact, Michael Verzi (verzi@biology.rutgers.edu).
Materials availability
This study did not generate any unique reagents and the mouse lines generated in this study are available upon execution of a suitable Materials Transfer Agreement.
Data and code availability
All ATAC-seq, ChIP-seq and HiChIP-seq data of this study have been deposited in Gene Expression Omnibus (GEO) under accession GSE148691. The Hnf4 mutants versus WT transcriptome, HNF4 ChIP-seq, and H3K27ac MNase-ChIPseq of mouse intestinal epithelial cells have been deposited in GEO under accession GSE112946 (Chen et al., 2019b). GSE53545, GSE70766 (San Roman et al., 2015), and GSE102171 (Perekatt et al., 2018) were used to perform RNA-seq analysis of villus-enriched genes and crypt-enriched genes. The following data, including GSE148691, GSE112946 (Chen et al., 2019b), GSE98724 (Saxena et al., 2017), GSE51458 (Kim et al., 2014), GSE90462 (Davison et al., 2017), GSE57919 (Camp et al., 2014), and GSE83394 (Jadhav et al., 2017) were used to define the active intestinal chromatin regions used as the search space for identifying chromatin loops. No new custom computer code or algorithm was developed for this study.
EXPERIMENTAL MODEL AND SUBJECT DETAILS
Mice
The Villin-CreERT2 transgene (el Marjou et al., 2004), Hnf4αf/f (Hayhurst et al., 2001), and Hnf4γCrispr/Crispr (Chen et al., 2019b) alleles were integrated to generate the conditional compound mutants and controls. Experimental mice (8–12 weeks old) were treated with tamoxifen (Sigma T5648) at 50mg/kg/day or vehicle by intraperitoneal injection. Histologic analysis was done after 4 consecutive days of tamoxifen or vehicle treatment. For H3K4me3 HiChIP-seq and H3K27ac MNase ChIP-seq, mice were analyzed after 3 consecutive days of tamoxifen or vehicle treatment. For RNA-seq, mice were analyzed after 2 or 3 consecutive days of tamoxifen or vehicle treatment. Mice of both sexes were used in experiments and littermates were used as controls. All mouse protocols and experiments were approved by the Rutgers Institutional Animal Care and Use Committee, and we complied with all relevant ethical regulations. All samples were collected between 12:00 and 14:00 to avoid circadian variability.
METHOD DETAILS
Intestinal villi and crypt isolation
Freshly harvested intestine was flushed with cold PBS, opened longitudinally, cut into 1 cm pieces, and then rotated in 3 mM EDTA in PBS at 4°C for 5 min, 10 min and 40 min (refresh EDTA/PBS every time). The EDTA incubation time was adjusted to release all the epithelial cells from underlying muscular tissue, so for WT and mutant tissues, the last incubation step is 40 min and 20 min, respectively. The tissue was then vigorously shaken to release the epithelium, and the supernatant was collected as the whole epithelium fraction; villi were collected from the top of a 70-μm cell strainer while crypts passed through. Cells were pelleted by centrifugation at 170 g at 4°C for 3 min and then washed by cold PBS. Cell pellets were used for ATAC-seq, ChIP-seq and HiChIP as described in later sections.
HiChIP-seq
Duodenal villus and crypt cells were isolated as describe above, and then cross-linked in 1.5% formaldehyde (Sigma F8775) for 10 min at 4°C and then for 50 min at room temperature. Cells were pelleted (300 g, 4°C for 5 min) and washed with ice-cold PBS twice. Cells were quick frozen in liquid nitrogen and stored at −80°C for later processing for HiChIP. The HiChIP protocol was performed as previously described (Mumbach et al., 2016), using an antibody to H3K4me3 (Millipore 05–745R, lot 3158071) with slight modifications. Briefly, ~30 million crosslinked cells were resuspended in 1 mL of ice-cold Hi-C Lysis Buffer (10 mM Tris-HCl pH8.0, 10 mM NaCl, 0.2% IGEPAL, and protease inhibitor) and rotated at 300 rpm at 4°C for 30 min. The lysate was split into two tubes and centrifuged at 2500 rcf. at 4°C for 5 min. The pelleted nuclei were washed once with 500 μL of ice-cold Hi-C Lysis Buffer, resuspended in 100 μL of 0.5% SDS, and incubated at 62°C for 10 min. 285 μL of H2O and 50 μL of 10% Triton X-100 were added and incubated at 37°C for 15 min. Chromatin was digested using 50 μL of 10X NEB Buffer 2 and 375 U of MboI restriction enzyme (NEB, R0147) for 2 hours at 37°C with 300 rpm rotation, followed by inactivation of MboI at 62°C for 20 min.
Restriction fragment ends were biotinylated using 52 μL of fill-in master mix (37.5 μL of 0.4 mM biotin-dATP (Thermo 19524016), 1.5 μL of 10mM dCTP, 1.5 μL of 10mM dGTP, 1.5 μL of 10mM dTTP, and 10 μL of 5U/μL DNA Polymerase I, Large (Klenow) Fragment (NEB, M0210)) and incubated at 37°C for 1 hour with 300 rpm rotation. Ligation was performed using 948 μL of ligation master mix (150 μL of 10X NEB T4 DNA ligase buffer (NEB, B0202) with 10 mM ATP, 125 μL of 10% Triton X-100, 3 μL of 50 mg/mL BSA, and 10 μL of 400 U/μL T4 DNA Ligase (NEB, M0202)) with incubation at 16°C overnight, 300 rpm rotation.
Nuclei pellets were resuspended with lysis buffer (1% SDS, 10 mM EDTA pH 8.0, 50 mM Tris pH 8.0, and protease inhibitor cocktails), and further incubated at room temperature for 10 min. Cell lysates were sonicated using a Diagenode Bioruptor to generate 300 bp to 700 bp fragments, as determined by agarose gel electrophoresis. The supernatant of lysates were diluted in binding buffer (20 mM Tris pH 8.0, 2 mM EDTA pH 8.0, 150 mM NaCl, 1% Triton X-100, and protease inhibitor cocktails) and incubated with H3K4me3 antibody (9 μL per ChIP) coupled to Dynabeads (30 μL Protein A and 30 μL Protein G per ChIP, Invitrogen) at 4°C overnight. The final concentration of SDS in immunoprecipitation for H3K4me3 HiChIP is 0.15%. Immunoprecipitates were washed 5 times and rotated at 4°C with RIPA buffer (50 mM HEPES pH 7.6, 1 mM EDTA pH 8.0, 0.7% Nadeoxycholate, 1% NP-40, and 0.5 M LiCl) and a quick wash of TE buffer (0.1 mM EDTA pH 8.0 and 10 mM Tris pH 8.0). To recover the DNA, the samples were incubated overnight in reverse cross-linking buffer (1% SDS and 0.1 M NaHCO3) at 65°C. The DNA was purified by MinElute PCR Purification Kit (QIAGEN) and quantified with Picogreen (Life Technologies). H3K4me3 ChIP enrichment was confirmed with qPCR using primers targeting active gene promoters prior to library preparation.
5 μL of Streptavidin C-1 beads were washed with 500 μL of Tween Wash Buffer (5 mM Tris-HCl pH 7.5, 0.5 mM EDTA, 1 M NaCl, and 0.05% Tween-20) and resuspended in 20 μL of 2X Biotin Binding Buffer (10 mM Tris-HCl pH7.5, 1 mM EDTA, and 2 M NaCl). The bead solution was added to the purified ChIP sample and incubated at room temperature for 15 min with 300 rpm rotation. The sample was placed on a magnet and the beads were washed twice with 500 μL of Tween Wash Buffer and incubated at 55°C for 2 min with 300 rpm rotation. The beads were washed in 100 μL of 1X (from 2X) TD Buffer (Illumina), and then resuspended in 25 μL of 2X TD Buffer. Tn5 enzyme was added according to the amount of post-ChIP DNA: 0.5 μL Tn5 per 10 ng of post-ChIP DNA (6.5 −12.5 ng post-ChIP DNA were used across replicates in this study). Nuclease-free water was added to adjust total volume to 50 μL and incubated at 55°C with interval shaking for 10 min. The sample was placed on a magnet, the supernatant was removed, and 100 μL of 50 mM EDTA was added with incubation at 50°C for 30 min. The supernatant was removed and the sample was washed twice on a magnet with 100 μL of 50 mM EDTA at 50°C for 3 min, twice in 100 μL of Tween Wash Buffer at 55°C for 2 min, and once in 100 μL of 10 mM Tris.
The beads were resuspended in 50 μL PCR master mix (25 μL of Phusion HF 2X, 1 μL of Nextera Ad1.1 (Universal) primer 12.5 μM, and 1 μL of Nextera Ad2.x (Barcoded) primer 12.5 μM). The sample was run for five PCR cycles (72°C 5 min; 98°C 1 min; 5 cycles of 98°C 15 s, 63°C 30 s, and 72°C 1 min), and then removed from beads. EvaGreen (Biotium 31000) was added and then run on a qPCR machine until the beginning of exponential amplification. We performed a 0.8X (beads:sample) cleanup using AMPure beads to remove DNA fragments less than ~120 bp. The mixture was incubated at room temperature for 5 min and placed on a magnet for 2 min. The supernatant was removed and the beads were washed twice with 1 mL of 80% ethanol. Final library was eluted in 11 μL of Buffer EB. All libraries were sequenced on the Illumina NextSeq 550 instrument.
Chromatin profiling
For ATAC-seq, duodenal villi and crypts were isolated as describe above, and treated with pre-warmed 0.25% Trypsin for 8 min at 37°C on a vortex station (speed set between 6–7), neutralized with 10% FBS, and passed through a 40-μm cell strainer to obtain single cells. 50,000 cells were used for ATAC-seq as described previously (Chen et al., 2019b). The PCR amplified libraries were purified, fragment size was selected using Pippin Prep, and sequenced on Illumina NextSeq 150 cycle mid output. For Micrococcal nuclease (MNase) ChIP-seq, mouse villi and crypts were isolated as described above, and resuspended in digestion buffer (50 mM Tris-HCl pH7.6, 1 mM CaCl2, 0.2% Triton X-100, 5 mM Na butyrate, and protease inhibitor cocktails) and treated with MNase for ChIP-seq, with histone H3K27Ac (Abcam ab4729) or H3K4Me2 (Millipore 07–030) antibodies, as described previously (Verzi et al., 2010).
Histology and staining
Freshly harvested intestinal tissues was flushed with cold PBS, opened longitudinally and pinned on a wax plate. After soaking in 4% paraformaldehyde for 10 min, tissues were fixed overnight with 4% paraformaldehyde at 4°C, and then washed with PBS. For paraffin embedding, tissues were then dehydrated through ascending alcohols and processed with xylene prior to embedding. For cryo-embedding, tissues were then processed with 15% sucrose and 30% sucrose until tissues sunk prior to freezing in OCT compound (Tissue-Tek 4583). 5 μm-thick paraffin sections were used for immunofluorescence staining using standard procedures. A Zeiss LSM 510 Meta confocal microscope was used for imaging the immunofluorescence staining of Villin (Santa Cruz sc-58897, 1:100), Ki67 (Abcam ab16667, 1:100) and DAPI (Biotium 40043, 1:5000). 10 μm-thick cryosections were used for Oil Red O (Lipid Stain, Abcam ab150678) of mouse duodenal epithelium. The slides were mounted and viewed on a Nikon Eclipse E800 microscope. Images were photographed with a Retiga 1300 CCD (QImaging) camera and QCapture imaging software.
Transmission electron microscopy
Intestinal tissues were freshly dissected, cut into 1 mm fragments, and immediately fixed overnight at 4°C in 0.1 M sodium cacodylate buffer (pH 7.4, Electron Microscopy Sciences 11653) containing 2.5% glutaraldehyde (Electron Microscopy Sciences 16216) and 2% paraformaldehyde (Electron Microscopy Sciences 15714-S). Tissue processing, embedding, sectioning and imaging were performed as described previously (Perekatt et al., 2014).
QUANTIFICATION AND STATISTICAL ANALYSIS
Data processing of HiChIP-seq
HiChIP data were processed using the HiC-Pro pipeline (Servant et al., 2015), version 2.11.1. Reads were aligned to the mm9 genome assembly using bowtie2 (version 2.3.4.3) (Langmead and Salzberg, 2012) with mapping quality filter 15. HiC-Pro first performs global alignment using bowtie2 (–very-sensitive -L 30–score-min L,−0.6,−0.2–end-to-end –reorder) followed by local alignment (–very-sensitive -L 20–score-min L,−0.6,−0.2–end-to-end –reorder). Singleton, multi-mapped, and duplicate reads were removed. Reads were assigned to MboI restriction fragments using min and max size parameters of 100 and 100,000, respectively. Hichipper (Lareau and Aryee, 2018) includes bias-corrected peak calling, library quality control and DNA loop calling. HiC-Pro valid pairs were used as input for hichipper (version 0.7.0) to identify chromatin loops at regions known to contain active intestinal chromatin features, including promoter regions (identified by UCSC transcription start site ± 2 kb). Active intestinal chromatin regions were defined from our data and public data sources that empirically defined intestinal active chromatin regions (indicated in the data availability section), including ATAC-seq, DNase-seq, H3k4me3, H3K27ac and H3K4me3 ChIP-seq from intestinal stem, crypt, villus or intestinal epithelial cells. Regions of Chr 0, Chr X, Chr Y and Chr random were removed from the active chromatin regions before loop calling. Hichipper loops were filtered for q-value ≤ 0.0001 and raw contact counts ≥ 4 (Petrovic et al., 2019). For identification of differential loops, we considered all loops with q ≤ 0.0001 in at least one replicate and raw counts ≥ 4 in both replicates, from at least one of the two conditions being compared. DESeq2 (v1.20) (Love et al., 2014) was applied to identify differential loops of H3K4me3 HiChIP-seq data using sequencing counts. When plotting the results of k-means clustering heatmaps and sitepro plots, differential looping regions were first intersected with ATAC-seq sites by BEDTools (v2.17.0) (Quinlan, 2014), to center the looping region at its presumed enhancer. Sushi package (v1.20.0) (Phanstiel et al., 2014) was used for visualizing HiChIP looping data. For simplicity, we combined biological replicates for visualizing loops in Sushi, as indicated in the figure legends.
Data processing of ChIP-seq and ATAC-seq
For ChIP-seq, raw sequencing reads (fastq) were quality checked using fastQC (v0.11.3) and were further aligned to mouse (mm9) genomes using bowtie2 (v2.2.6) (Langmead and Salzberg, 2012) to obtain bam files. Deeptools bamCoverage (Ramírez et al., 2016) (v2.4.2, duplicate reads ignored, RPKM normalized and extended reads) was used to generate bigwig files from bam files, and BigWigMerge (v2) was used to merge the bigwig files of different replicates. MACS (v1.4.1) (Zhang et al., 2008) was used for peak calling and to generate bed files from bam files. For ATAC-seq, paired-end ATAC-seq fastq file was quality checked using fastQC. ATAC-seq adaptor sequences were removed from each read file using CutAdapt (v1.9.1) (Martin, 2011). Each read file was then aligned to the mouse mm9 genome using bowtie2. Picard (v2.18.27) (Broad Institute, 2019) was used to determine the median alignment size of each alignment bam file. Peak region bed files were called from each alignment bam file using MACS2 (v2.1.0). MACS2 was run with a “shift” distance of −0.5 times the median alignment size and an “extsize” distance equal to the median alignment size for each alignment bed file.
Bioinformatics
BEDTools (v2.17.0) (Quinlan, 2014) was used to merge, intersect or subtract the intervals of bed files. Haystack (v0.4.0) (Pinello et al., 2018) quantile normalized bigwigs were used to create k-means clustering heatmaps using computeMatrix and plotHeatmap from deeptools (v2.4.2) (Ramírez et al., 2016). Genomic regions of desired k-means clusters were extracted from bed files generated by plotHeatmap for further analysis. SitePro was used to visualize the average signals of ChIP-seq or ATAC-seq in the desired genomic regions. Homer findMotifsGenome.pl (v4.8.3, homer de novo Results) (Heinz et al., 2010) was used to identify transcription factor motifs enriched at peaks. Enriched gene ontologies were identified from genomic regions (bed file) using GREAT analysis (v3.0.0) (McLean et al., 2010) or DAVID (v6.8) (Huang et al., 2009). Single nearest gene (GREAT) within 1 kb (promoter-anchored) or 10 kb (including enhancer-anchored) was used to call nearby genes of HiChIP loops, as indicated in the figure legends. The Integrative Genomics Viewer (IGV 2.4.13) (Robinson et al., 2011) was used to visualize bigwig tracks. RNA-seq analysis was performed as described previously (Chen et al., 2019b). Gene set enrichment analysis (GSEA v3.0) was performed as described (Subramanian et al., 2005). Heatmapper (Babicki et al., 2016) was used to display relative transcript levels of genes of interest by using normalized FPKM values from Cuffnorm.
Statistical analysis
The data are presented as mean ± SEM, and statistical comparisons were performed using two-sided Student’s t test at p < 0.001***, p < 0.01** or p < 0.05*. Mann-Whitney test and Kruskal-Wallis test (followed by Post hoc Dunn’s test) were used as part of the bioinformatics analysis. Other bioinformatics related statistical analysis was completed with the embedded statistics in each package, including hichipper (Lareau and Aryee, 2018), DESeq2 (Love et al., 2014), MACS (Zhang et al., 2008), HOMER (Heinz et al., 2010), Cuffdiff (Trapnell et al., 2012), GSEA (Subramanian et al., 2005; Tamayo et al., 2016), GREAT (McLean et al., 2010) and DAVID (Huang et al., 2009). p < 0.05 (95% confidence interval) was considered statistically significant.
Supplementary Material
KEY RESOURCES TABLE.
| REAGENT or RESOURCE | SOURCE | IDENTIFIER |
|---|---|---|
| Antibodies | ||
| Anti-H3K4me3 antibody | Millipore | Cat# 05-745R, RRID:AB_1587134 |
| Anti-H3K27ac antibody | Abcam | Cat# ab4729, RRID:AB_2118291 |
| Anti-H3K4Me2 antibody | Millipore | Cat# 07–030, RRID:AB_310342 |
| Anti-Villin antibody | Santa Cruz Biotechnology | Cat# sc-58897, RRID:AB_2304475 |
| Anti-Ki67 antibody | Abcam | Cat# ab16667, RRID:AB_302459 |
| Donkey anti-Rabbit IgG (H+L) Highly | Invitrogen | Cat# A-21206, RRID:AB_2535792 |
| Cross-Adsorbed Secondary Antibody, | ||
| Alexa Fluor 488 | ||
| Donkey anti-Mouse IgG (H+L) Highly | Invitrogen | Catalog # A10038 |
| Cross-Adsorbed Secondary Antibody, | ||
| Alexa Fluor 680 | ||
| Chemicals, peptides, and recombinant proteins | ||
| Tamoxifen | Sigma | T5648 |
| Formaldehyde | Sigma | F8775 |
| Paraformaldehyde | Electron Microscopy Sciences | 15714-S |
| Sodium cacodylate | Electron Microscopy Sciences | 11653 |
| Glutaraldehyde | Electron Microscopy Sciences | 16216 |
| Critical commercial assays | ||
| MinElute PCR Purification Kit | QIAGEN | 28004 |
| Quant-iT PicoGreen dsDNA Reagent | Invitrogen | P7581 |
| MboI | New England Biolabs | R0147 |
| biotin-dATP | Thermo Fisher Scientific | 19524016 |
| DNA Polymerase I, Large (Klenow) Fragment | New England Biolabs | M0210 |
| T4 DNA Ligase | New England Biolabs | M0202 |
| T4 DNA Ligase Reaction Buffer | New England Biolabs | B0202 |
| Dynabeads Protein A for Immunoprecipitation | Invitrogen | 10002D |
| Dynabeads Protein G for Immunoprecipitation | Invitrogen | 10004D |
| Dynabeads MyOne Streptavidin C1 | Invitrogen | 65001 |
| Tn5 enzyme | Illumina | 15027865 |
| 2X TD Buffer | Illumina | 15027866 |
| Phusion® High-Fidelity PCR Master Mix with HF Buffer | New England Biolabs | M0531 |
| EvaGreen | Biotium | 31000 |
| 0.25% Trypsin-EDTA | GIBCO | 25200–056 |
| FBS | GIBCO | 26140–095 |
| ThruPLEX® DNA-Seq Kit | Rubicon Genomics | R400427 |
| NEBNext® High-Fidelity 2X PCR Master Mix | New England Biolabs | M0541 |
| Micrococcal nuclease | Sigma | N3755 |
| QIAquick PCR Purification Kit | QIAGEN | 28106 |
| OCT compound | Tissue-Tek | 4583 |
| DAPI | Biotium | 40043 |
| Oil Red O Stain Kit (Lipid Stain) | Abcam | ab150678 |
| Deposited data | ||
| ATAC-seq, ChIP-seq and HiChIP-seq | This study | GEO: GSE148691 |
| Experimental models: organisms/strains | ||
| Mouse: Villin-CreERT2 | el Marjou et al., 2004 | MGI:3053826 |
| Mouse: Hnf4αf/f; Villin-CreERT2 | Hayhurst et al., 2001 | MGI:2183520 |
| Mouse: Hnf4αf/f; Hnf4βcrispr/crispr; Villin-CreERT2 | Chen et al., 2019b | N/A |
| Software and algorithms | ||
| HiC-Pro | Servant et al., 2015 | https://github.com/nservant/HiC-Pro |
| Hichipper | Lareau and Aryee, 2018 | https://aryee.mgh.harvard.edu/hichipper |
| DESeq2 | Love et al., 2014 | http://bioconductor.org/packages/release/bioc/html/DESeq2.html |
| BEDTools | Quinlan, 2014 | https://bedtools.readthedocs.io/en/latest/ |
| Sushi | Phanstiel et al., 2014 | https://github.com/dphansti/Sushi |
| Bowtie2 | Langmead and Salzberg, 2012 | http://bowtie-bio.sourceforge.net/bowtie2/index.shtml |
| Deeptools | Ramíez et al., 2016 | https://github.com/deeptools/deepTools |
| MACS | Zhang et al., 2008 | https://github.com/macs3-project/MACS |
| CutAdapt | Martin, 2011 | https://cutadapt.readthedocs.io/ |
| Picard | Broad Institute, 2019 | http://broadinstitute.github.io/picard |
| Haystack | Pinello et al., 2018 | https://github.com/pinellolab/haystack_bio |
| HOMER | Heinz et al., 2010 | http://homer.ucsd.edu/homer/motif |
| GREAT | McLean et al., 2010 | http://great.stanford.edu/public/html |
| DAVID | Huang et al., 2009 | https://david.ncifcrf.gov |
| IGV | Robinson et al., 2011 | http://software.broadinstitute.org/software/igv |
| GSEA | Subramanian et al., 2005 | https://www.gsea-msigdb.org/gsea/index.jsp |
| Heatmapper | Babicki et al., 2016 | http://www.heatmapper.ca |
| Cufflinks | Trapnell et al., 2012 | http://cufflinks.cbcb.umd.edu |
| Other | ||
| RNA-seq analysis of villus-enriched genes and crypt-enriched genes | San Roman et al., 2015; Perekatt et al., 2018 | GEO: GSE53545, GSE70766 and GSE102171 |
| ATAC-seq, DNase-seq, H3k4me3, H3K27ac and H3K4me3 ChIP-seq from intestinal stem, crypt, villus or intestinal epithelial cells (active intestinal chromatin regions for searching chromatin loops) | This study; Chen et al., 2019b; Saxena et al., 2017; Kim et al., 2014; Davison et al., 2017; Camp et al., 2014; Jadhav et al., 2017 | GEO: GSE148691, GSE112946, GSE98724, GSE51458, GSE90462, GSE57919 and GSE83394 |
| Hnf4 mutants versus WT transcriptome, HNF4 ChIP-seq, and H3K27ac MNase-ChIPseq of mouse intestinal epithelial cells | Chen et al., 2019b | GEO: GSE112946 |
Highlights.
Chromatin looping is relatively stable across the crypt-villus boundary
Dynamic looping events correlate with gene expression across the boundary
HNF4 facilitates long-range chromatin interactions at their target genes
HNF4 regulates intestinal lipid metabolism through regulation of chromatin looping
ACKNOWLEDGMENTS
This research was funded by grants from the National Institutes of Health (NIH) (R01CA190558 and R01DK121915 to M.P.V.; R01GM130698 to C.E.E.). M.P.V. is also supported by the Intestinal Stem Cell Consortium from the National Institute of Diabetes and Digestive and Kidney Diseases (NIDDK) and National Institute of Allergy and Infectious Diseases (NIAID) of the NIH under grant number U01 DK103141. Support was also received from the Sequencing Facility of the Rutgers Cancer Institute of New Jersey (P30CA072720) and imaging core facility of Human Genetics Institute of New Jersey. L.C. was supported by New Jersey Commission on Cancer Research grant DFHS18PPC051. The authors acknowledge the Office of Advanced Research Computing (OARC) at Rutgers University for providing access to the Amarel cluster and associated research computing resources that have contributed to the results reported here. The authors also thank Anbo Zhou for helpful coding advice. The content is solely the responsibility of the authors and does not necessarily represent the official views of the NIH.
Footnotes
DECLARATION OF INTERESTS
The authors declare that they have no competing interests.
SUPPLEMENTAL INFORMATION
Supplemental Information can be found online at https://doi.org/10.1016/j.celrep.2020.108679.
REFERENCES
- Babicki S, Arndt D, Marcu A, Liang Y, Grant JR, Maciejewski A, and Wishart DS (2016). Heatmapper: web-enabled heat mapping for all. Nucleic Acids Res 44 (W1), W147–W153. [DOI] [PMC free article] [PubMed] [Google Scholar]
- Bonev B, Mendelson Cohen N, Szabo Q, Fritsch L, Papadopoulos GL, Lubling Y, Xu X, Lv X, Hugnot JP, Tanay A, and Cavalli G (2017). Multiscale 3D Genome Rewiring during Mouse Neural Development. Cell 171, 557–572.e24. [DOI] [PMC free article] [PubMed] [Google Scholar]
- Broad Institute (2019). Picard Toolkit. Broad Institute, GitHub Repository; https://broadinstitute.github.io/picard/. [Google Scholar]
- Camp JG, Frank CL, Lickwar CR, Guturu H, Rube T, Wenger AM, Chen J, Bejerano G, Crawford GE, and Rawls JF (2014). Microbiota modulate transcription in the intestinal epithelium without remodeling the accessible chromatin landscape. Genome Res 24, 1504–1516. [DOI] [PMC free article] [PubMed] [Google Scholar]
- Chen L, Toke NH, Luo S, Vasoya RP, Aita R, Parthasarathy A, Tsai YH, Spence JR, and Verzi MP (2019a). HNF4 factors control chromatin accessibility and are redundantly required for maturation of the fetal intestine. Development 146, dev179432. [DOI] [PMC free article] [PubMed] [Google Scholar]
- Chen L, Toke NH, Luo S, Vasoya RP, Fullem RL, Parthasarathy A, Perekatt AO, and Verzi MP (2019b). A reinforcing HNF4-SMAD4 feed-forward module stabilizes enterocyte identity. Nat. Genet 51, 777–785. [DOI] [PMC free article] [PubMed] [Google Scholar]
- Chen L, Vasoya RP, Toke NH, Parthasarathy A, Luo S, Chiles E, Flores J, Gao N, Bonder EM, Su X, et al. (2019c). HNF4 Regulates Fatty Acid Oxidation and Is Required for Renewal of Intestinal Stem Cells in Mice. Gastroenterology 158, 985–999.e9. [DOI] [PMC free article] [PubMed] [Google Scholar]
- Davison JM, Lickwar CR, Song L, Breton G, Crawford GE, and Rawls JF (2017). Microbiota regulate intestinal epithelial gene expression by suppressing the transcription factor Hepatocyte nuclear factor 4 alpha. Genome Res 27, 1195–1206. [DOI] [PMC free article] [PubMed] [Google Scholar]
- Dekker J, and Mirny L (2016). The 3D Genome as Moderator of Chromosomal Communication. Cell 164, 1110–1121. [DOI] [PMC free article] [PubMed] [Google Scholar]
- Díaz N, Kruse K, Erdmann T, Staiger AM, Ott G, Lenz G, and Vaquerizas JM (2018). Chromatin conformation analysis of primary patient tissue using a low input Hi-C method. Nat. Commun 9, 4938. [DOI] [PMC free article] [PubMed] [Google Scholar]
- Du Z, Zheng H, Huang B, Ma R, Wu J, Zhang X, He J, Xiang Y, Wang Q, Li Y, et al. (2017). Allelic reprogramming of 3D chromatin architecture during early mammalian development. Nature 547, 232–235. [DOI] [PubMed] [Google Scholar]
- el Marjou F, Janssen KP, Chang BH, Li M, Hindie V, Chan L, Louvard D, Chambon P, Metzger D, and Robine S (2004). Tissue-specific and inducible Cre-mediated recombination in the gut epithelium. Genesis 39, 186–193. [DOI] [PubMed] [Google Scholar]
- Gregorieff A, Pinto D, Begthel H, Destrée O, Kielman M, and Clevers H (2005). Expression pattern of Wnt signaling components in the adult intestine. Gastroenterology 129, 626–638. [DOI] [PubMed] [Google Scholar]
- Haramis AP, Begthel H, van den Born M, van Es J, Jonkheer S, Offerhaus GJ, and Clevers H (2004). De novo crypt formation and juvenile polyposis on BMP inhibition in mouse intestine. Science 303, 1684–1686. [DOI] [PubMed] [Google Scholar]
- Hastie ND, and Bishop JO (1976). The expression of three abundance classes of messenger RNA in mouse tissues. Cell 9, 761–774. [DOI] [PubMed] [Google Scholar]
- Hayhurst GP, Lee YH, Lambert G, Ward JM, and Gonzalez FJ (2001). Hepatocyte nuclear factor 4alpha (nuclear receptor 2A1) is essential for maintenance of hepatic gene expression and lipid homeostasis. Mol. Cell. Biol 21, 1393–1403. [DOI] [PMC free article] [PubMed] [Google Scholar]
- He XC, Zhang J, Tong WG, Tawfik O, Ross J, Scoville DH, Tian Q, Zeng X, He X, Wiedemann LM, et al. (2004). BMP signaling inhibits intestinal stem cell self-renewal through suppression of Wnt-beta-catenin signaling. Nat. Genet 36, 1117–1121. [DOI] [PubMed] [Google Scholar]
- Heintzman ND, Stuart RK, Hon G, Fu Y, Ching CW, Hawkins RD, Barrera LO, Van Calcar S, Qu C, Ching KA, et al. (2007). Distinct and predictive chromatin signatures of transcriptional promoters and enhancers in the human genome. Nat. Genet 39, 311–318. [DOI] [PubMed] [Google Scholar]
- Heinz S, Benner C, Spann N, Bertolino E, Lin YC, Laslo P, Cheng JX, Murre C, Singh H, and Glass CK (2010). Simple combinations of lineage-determining transcription factors prime cis-regulatory elements required for macrophage and B cell identities. Mol. Cell 38, 576–589. [DOI] [PMC free article] [PubMed] [Google Scholar]
- Hnisz D, Day DS, and Young RA (2016). Insulated Neighborhoods: Structural and Functional Units of Mammalian Gene Control. Cell 167, 1188–1200. [DOI] [PMC free article] [PubMed] [Google Scholar]
- Huang W, Sherman BT, and Lempicki RA (2009). Systematic and integrative analysis of large gene lists using DAVID bioinformatics resources. Nat. Protoc 4, 44–57. [DOI] [PubMed] [Google Scholar]
- Jadhav U, Saxena M, O’Neill NK, Saadatpour A, Yuan GC, Herbert Z, Murata K, and Shivdasani RA (2017). Dynamic Reorganization of Chromatin Accessibility Signatures during Dedifferentiation of Secretory Precursors into Lgr5+ Intestinal Stem Cells. Cell Stem Cell 21, 65–77.e5. [DOI] [PMC free article] [PubMed] [Google Scholar]
- Ke Y, Xu Y, Chen X, Feng S, Liu Z, Sun Y, Yao X, Li F, Zhu W, Gao L, et al. (2017). 3D Chromatin Structures of Mature Gametes and Structural Reprogramming during Mammalian Embryogenesis. Cell 170, 367–381.e20. [DOI] [PubMed] [Google Scholar]
- Kim TH, Li F, Ferreiro-Neira I, Ho LL, Luyten A, Nalapareddy K, Long H, Verzi M, and Shivdasani RA (2014). Broadly permissive intestinal chromatin underlies lateral inhibition and cell plasticity. Nature 506, 511–515. [DOI] [PMC free article] [PubMed] [Google Scholar]
- Krijger PH, and de Laat W (2016). Regulation of disease-associated gene expression in the 3D genome. Nat. Rev. Mol. Cell Biol 17, 771–782. [DOI] [PubMed] [Google Scholar]
- Langmead B, and Salzberg SL (2012). Fast gapped-read alignment with Bowtie 2. Nat. Methods 9, 357–359. [DOI] [PMC free article] [PubMed] [Google Scholar]
- Lareau CA, and Aryee MJ (2018). hichipper: a preprocessing pipeline for calling DNA loops from HiChIP data. Nat. Methods 15, 155–156. [DOI] [PMC free article] [PubMed] [Google Scholar]
- Love MI, Huber W, and Anders S (2014). Moderated estimation of fold change and dispersion for RNA-seq data with DESeq2. Genome Biol 15, 550. [DOI] [PMC free article] [PubMed] [Google Scholar]
- Martin M (2011). Cutadapt removes adapter sequences from high-throughput sequencing reads. EMBnet. J 17, 10–12. [Google Scholar]
- McCarthy N, Manieri E, Storm EE, Saadatpour A, Luoma AM, Kapoor VN, Madha S, Gaynor LT, Cox C, Keerthivasan S, et al. (2020). Distinct Mesenchymal Cell Populations Generate the Essential Intestinal BMP Signaling Gradient. Cell Stem Cell 26, 391–402.e5. [DOI] [PMC free article] [PubMed] [Google Scholar]
- McLean CY, Bristor D, Hiller M, Clarke SL, Schaar BT, Lowe CB, Wenger AM, and Bejerano G (2010). GREAT improves functional interpretation of cis-regulatory regions. Nat. Biotechnol 28, 495–501. [DOI] [PMC free article] [PubMed] [Google Scholar]
- Mumbach MR, Rubin AJ, Flynn RA, Dai C, Khavari PA, Greenleaf WJ, and Chang HY (2016). HiChIP: efficient and sensitive analysis of protein-directed genome architecture. Nat. Methods 13, 919–922. [DOI] [PMC free article] [PubMed] [Google Scholar]
- Palstra RJ, Tolhuis B, Splinter E, Nijmeijer R, Grosveld F, and de Laat W (2003). The beta-globin nuclear compartment in development and erythroid differentiation. Nat. Genet 35, 190–194. [DOI] [PubMed] [Google Scholar]
- Perekatt AO, Valdez MJ, Davila M, Hoffman A, Bonder EM, Gao N, and Verzi MP (2014). YY1 is indispensable for Lgr5+ intestinal stem cell renewal. Proc. Natl. Acad. Sci. USA 111, 7695–7700. [DOI] [PMC free article] [PubMed] [Google Scholar]
- Perekatt AO, Shah PP, Cheung S, Jariwala N, Wu A, Gandhi V, Kumar N, Feng Q, Patel N, Chen L, et al. (2018). SMAD4 suppresses WNT-driven de-differentiation and oncogenesis in the differentiated gut epithelium. Cancer Res 78, 4878–4890. [DOI] [PMC free article] [PubMed] [Google Scholar]
- Petrovic J, Zhou Y, Fasolino M, Goldman N, Schwartz GW, Mumbach MR, Nguyen SC, Rome KS, Sela Y, Zapataro Z, et al. (2019). Oncogenic Notch Promotes Long-Range Regulatory Interactions within Hyperconnected 3D Cliques. Mol. Cell 73, 1174–1190.e12. [DOI] [PMC free article] [PubMed] [Google Scholar]
- Phanstiel DH, Boyle AP, Araya CL, and Snyder MP (2014). Sushi.R: flexible, quantitative and integrative genomic visualizations for publication-quality multi-panel figures. Bioinformatics 30, 2808–2810. [DOI] [PMC free article] [PubMed] [Google Scholar]
- Pinello L, Farouni R, and Yuan GC (2018). Haystack: systematic analysis of the variation of epigenetic states and cell-type specific regulatory elements. Bioinformatics 34, 1930–1933. [DOI] [PMC free article] [PubMed] [Google Scholar]
- Quinlan AR (2014). BEDTools: The Swiss-Army Tool for Genome Feature Analysis. Curr. Protoc. Bioinformatics 47, 11.12.1–34. [DOI] [PMC free article] [PubMed] [Google Scholar]
- Ramírez F, Ryan DP, Grüning B, Bhardwaj V, Kilpert F, Richter AS, Heyne S, Dündar F, and Manke T (2016). deepTools2: a next generation web server for deep-sequencing data analysis. Nucleic Acids Res 44 (W1), W160–W165. [DOI] [PMC free article] [PubMed] [Google Scholar]
- Ray J, Munn PR, Vihervaara A, Lewis JJ, Ozer A, Danko CG, and Lis JT (2019). Chromatin conformation remains stable upon extensive transcriptional changes driven by heat shock. Proc. Natl. Acad. Sci. USA 116, 19431–19439. [DOI] [PMC free article] [PubMed] [Google Scholar]
- Robinson JT, Thorvaldsdóttir H, Winckler W, Guttman M, Lander ES, Getz G, and Mesirov JP (2011). Integrative genomics viewer. Nat. Biotechnol 29, 24–26. [DOI] [PMC free article] [PubMed] [Google Scholar]
- San Roman AK, Tovaglieri A, Breault DT, and Shivdasani RA (2015). Distinct Processes and Transcriptional Targets Underlie CDX2 Requirements in Intestinal Stem Cells and Differentiated Villus Cells. Stem Cell Reports 5, 673–681. [DOI] [PMC free article] [PubMed] [Google Scholar]
- Saxena M, Roman AKS, O’Neill NK, Sulahian R, Jadhav U, and Shivdasani RA (2017). Transcription factor-dependent ‘anti-repressive’ mammalian enhancers exclude H3K27me3 from extended genomic domains. Genes Dev 31, 2391–2404. [DOI] [PMC free article] [PubMed] [Google Scholar]
- Servant N, Varoquaux N, Lajoie BR, Viara E, Chen CJ, Vert JP, Heard E, Dekker J, and Barillot E (2015). HiC-Pro: an optimized and flexible pipeline for Hi-C data processing. Genome Biol 16, 259. [DOI] [PMC free article] [PubMed] [Google Scholar]
- Smallwood A, and Ren B (2013). Genome organization and long-range regulation of gene expression by enhancers. Curr. Opin. Cell Biol 25, 387–394. [DOI] [PMC free article] [PubMed] [Google Scholar]
- Subramanian A, Tamayo P, Mootha VK, Mukherjee S, Ebert BL, Gillette MA, Paulovich A, Pomeroy SL, Golub TR, Lander ES, and Mesirov JP (2005). Gene set enrichment analysis: a knowledge-based approach for interpreting genome-wide expression profiles. Proc. Natl. Acad. Sci. USA 102, 15545–15550. [DOI] [PMC free article] [PubMed] [Google Scholar]
- Tamayo P, Steinhardt G, Liberzon A, and Mesirov JP (2016). The limitations of simple gene set enrichment analysis assuming gene independence. Stat. Methods Med. Res 25, 472–487. [DOI] [PMC free article] [PubMed] [Google Scholar]
- Trapnell C, Roberts A, Goff L, Pertea G, Kim D, Kelley DR, Pimentel H, Salzberg SL, Rinn JL, and Pachter L (2012). Differential gene and transcript expression analysis of RNA-seq experiments with TopHat and Cufflinks. Nat. Protoc 7, 562–578. [DOI] [PMC free article] [PubMed] [Google Scholar]
- Verzi MP, Shin H, He HH, Sulahian R, Meyer CA, Montgomery RK, Fleet JC, Brown M, Liu XS, and Shivdasani RA (2010). Differentiation-specific histone modifications reveal dynamic chromatin interactions and partners for the intestinal transcription factor CDX2. Dev. Cell 19, 713–726. [DOI] [PMC free article] [PubMed] [Google Scholar]
- Wang Y, Wang H, Zhang Y, Du Z, Si W, Fan S, Qin D, Wang M, Duan Y, Li L, et al. (2019). Reprogramming of Meiotic Chromatin Architecture during Spermatogenesis. Mol. Cell 73, 547–561.e6. [DOI] [PubMed] [Google Scholar]
- Zhang Y, Liu T, Meyer CA, Eeckhoute J, Johnson DS, Bernstein BE, Nusbaum C, Myers RM, Brown M, Li W, and Liu XS (2008). Model-based analysis of ChIP-Seq (MACS). Genome Biol 9, R137. [DOI] [PMC free article] [PubMed] [Google Scholar]
Associated Data
This section collects any data citations, data availability statements, or supplementary materials included in this article.
Supplementary Materials
Data Availability Statement
All ATAC-seq, ChIP-seq and HiChIP-seq data of this study have been deposited in Gene Expression Omnibus (GEO) under accession GSE148691. The Hnf4 mutants versus WT transcriptome, HNF4 ChIP-seq, and H3K27ac MNase-ChIPseq of mouse intestinal epithelial cells have been deposited in GEO under accession GSE112946 (Chen et al., 2019b). GSE53545, GSE70766 (San Roman et al., 2015), and GSE102171 (Perekatt et al., 2018) were used to perform RNA-seq analysis of villus-enriched genes and crypt-enriched genes. The following data, including GSE148691, GSE112946 (Chen et al., 2019b), GSE98724 (Saxena et al., 2017), GSE51458 (Kim et al., 2014), GSE90462 (Davison et al., 2017), GSE57919 (Camp et al., 2014), and GSE83394 (Jadhav et al., 2017) were used to define the active intestinal chromatin regions used as the search space for identifying chromatin loops. No new custom computer code or algorithm was developed for this study.