In the Beginning ...
Ernest Amory Codman was an early orthopaedic surgeon and pioneer who proposed the End Results Idea in 1910 [5]. Codman’s goal was to document, report, and study complications to predict and prevent these adverse outcomes. Unfortunately, being ahead of his time did not help Codman. He was ridiculed and ostracized by his colleagues, fell into poverty, and was buried in an unmarked grave outside Boston. Codman’s work was unappreciated in his time but forms the basis of modern clinical outcomes research. Predictive analytics, as a subset of this field, continues with great vigor today.
The Argument
It is difficult to find an orthopaedic journal issue without a study on the development or validation of a clinical prediction model. This rise in predictive analytics has been fed by an increase of information in electronic health records, national databases, clinical trial registries, wearable sensors, and “omics” repositories (such as patient data biobanks with information such as genomics and proteomics) [8, 33, 36, 43]. Although the volume of clinical prediction modeling has unequivocally increased, the quality and impact of this acceleration remains to be standardized [10, 27, 37]. Variable quality creates a need for readers to quickly determine the reliability and expected utility of the growing number of new and existing models. As such, the purpose of this article was to discuss core standards for assessing the performance of predictive models, discuss specific challenges for predictive modeling with machine learning, and propose an informal checklist for clinical readers. The checklist and standards discussed here may be helpful for readers to determine when to be skeptical of clinical prediction models.
Essential Elements
The views expressed in this article are based on a review of clinical prediction models published in general orthopaedic journals such as Clinical Orthopaedics and Related Research®, the Journal of Bone and Joint Surgery, American Volume, and the Bone and Joint Journal, among others, as well as subspecialty journals such as The Spine Journal and the Journal of Arthroplasty. We did not conduct a systematic review or study-by-study formal assessment of quality with tools such as the Transparent Reporting of a Multivariable Prediction Model for Individual Prognosis or Diagnosis guidelines, the Grading of Recommendations, Assessment, Development, and Evaluations criteria, or the Methodological Index for Nonrandomized Studies checklist. Readers should interpret the comments and recommendations presented here with an understanding of this limitation.
What We (Think) We Know
The goal of predictive analytics is to transform patterns in the information available today into a forecast for the future. The hope is to answer questions such as: What is the likelihood of 90-day survival for a 58-year-old man with metastatic lung cancer and pathologic femur fracture [41]?
The following organizing questions may help orient readers to make the best use of predictive analytics research.
Will the Predictions of this Model Reflect the Actual Outcomes of My Patients?
The output of a clinical prediction model is a predicted probability for the outcome that ranges from 0 to 1 (or a percentage ranging from 0 to 100). In oncology, a model may predict a 40% chance (or 0.4 probability) that a patient with metastatic cancer will die within 90 days. Intuitively, clinicians would expect that for every 100 patients predicted to have a 40% chance of mortality, 40 will have died at the 90-day interval and 60 will survive. This measure of model performance is calibration [1]. Unfortunately, only a few studies have reported model calibration [4, 9, 44].
Among studies that reported measures of calibration, the variety of calibration metrics poses an additional challenge for readers trying to judge the quality of a model. Fundamentally, readers should ask: Does the presented mode of calibration allow for a transparent examination of model performance across the full range of predicted probabilities [37]? That is, is the model as reliable when it predicts a 10% probability of mortality as when it predicts a 70% probability of mortality? One reliable way to answer this question is with a calibration plot (Fig. 1), which shows the observed proportion of patients who experienced the outcome (death) over the range of predicted probability of mortality. Calibration plots help clinicians determine whether models overestimate or underestimate the outcome. The plot also highlights when the model is more or less reliable. For example, the predicted probability of mortality may reflect the actual (observed) rates of mortality for patients with a predicted probability of mortality that is less than 25%. However, for patients with a predicted probability of mortality greater than 25%, the model may not be well-calibrated or reliable for the primary purpose of the study.
Fig. 1.
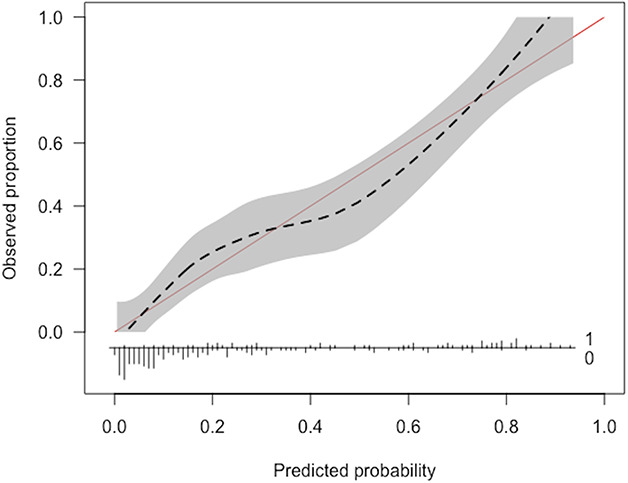
An example of a calibration plot is shown here.
Does Having a Model for This Outcome Add Any New Information for Clinical Decision-making, and if so, How Much?
Accuracy and area under the receiver operating characteristic curve are not enough. Most outcomes in medicine are asymmetric or imbalanced. For example, 30-day mortality in spinal metastatic disease occurs in a minority of patients: approximately 10% [20]. In the absence of any data, models would be correct in 90% of patients by predicting that every patient will survive beyond 30 days. As outcomes become more imbalanced (a minority event occurs in < 10%, < 5%, or < 1% of patients), the model’s accuracy becomes less and less meaningful. Here, accuracy refers to the percentage of correct predictions (true positives plus true negatives divided by the total number of patients).
Alternatively, the area under the receiver operating characteristic (AUC) curve is a summary measure of model performance that ranges from 0 to 1 [12, 13]. The AUC curve is a measure of model discrimination that represents the likelihood the model will distinguish patients who survived from those who died. It does not provide the probability of an outcome, nor does it provide the accuracy of probabilities professed by the model. The threshold for no information in this score is often set at 0.50—a likelihood equal to a coin toss or pure chance that the model distinguishes between patients who survived and died. Interpretation of the AUC has been simplified as: 0.51 to 0.69 is poor, 0.70 to 0.79 is fair, 0.80 to 0.89 is good, and 0.90 to 0.99 is excellent [7, 12, 13]. However, these thresholds are oversimplified and potentially misleading. The AUC curve is sensitive to imbalanced data [12, 39]. The AUC curve may appear in the fair, good, or excellent range without correctly identifying a model that provides meaningful or new information for the outcome of interest. Furthermore, when comparing two models, an observer should resist the temptation to select the model with the higher AUC value without assessing other critical attributes such as calibration. For example, consider an illustrative example of a model that has an AUC of 0.91 but poor calibration (Fig. 2). Possible tools to mitigate the imbalanced data limitations of the AUC and shed another light on the discrimination of these models may be area under the precision-recall curve and the F1-score.
Fig. 2.
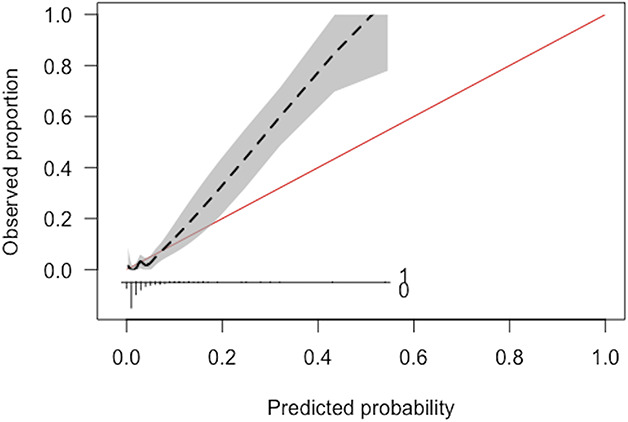
This figure demonstrates an example of a model with poor calibration despite excellent discrimination (c-statistic of 0.91).
Another alternative for clinicians is to estimate that every patient has a 10% probability of mortality based on the prevalence of mortality in this population. This type of prediction is referred to as the “null model” and represents the threshold of no new information [37]. To formalize the performance of this prediction, we can calculate the error between this prediction and the observed outcome for each patient. The formal metric for expressing this error is the Brier score (the mean squared error between the model predictions and the observed outcomes) [6]. Ideally, there would be zero error between the predictions and outcomes, resulting in a perfect Brier score of 0. At the opposite extreme, the Brier score for the “null model” expresses the error for models adding no new information. That is, clinical prediction models should achieve a Brier score at least lower than the null-model Brier score.
Do Decisions Made Based on the Algorithm’s Predictions Do More Harm Than Good?
The result of using any model is a decision: the binary determination (yes or no) of whether to change any part of the default planned management strategy for that patient [48]. The management change may be nonoperative care instead of surgery. The change may be a preoperative psychiatric intervention instead of or in addition to usual preoperative care. Clinical prediction models identify patients who are most likely to benefit from management changes.
In the absence of clinical prediction models, two default strategies for decisions are either changing management for no patients or changing management for all patients. True positives (benefit) are achieved when decisions made on the basis of the model’s predictions result in the expected outcome; for example, not operating on a patient with 80% chance of 90-day mortality and that patient dying 3 weeks after evaluation. False positives (harm) represent the opposite outcome; for example, not operating on a patient with 80% chance of 90-day mortality but that patient living for another 9 months. Changing management for no patients results in zero benefit and zero harm. Changing management for all patients results in a benefit for some patients (true positives) and harm for others (false positives). The amount of benefit and harm generated by changing management for all patients depends on the value of true positives relative to false positives. Cost or harm in decision curve analysis refers to the adverse outcome generated by making a decision for a patient with a false positive prediction and may be patient harm or economic costs. If the cost of false positives is very low (that is, false positives are worth much less than true positives), changing management for all patients may be the best strategy. An example of this is the management change of universal methicillin-resistant Staphylococcus aureus decolonization before surgery. The risk of treating patients who are not actually carrying methicillin-resistant S. aureus is relatively low and changing management for all patients (decolonizing all patients) may be the best strategy. However, if the intended management change has a high cost for false positives (for example, withholding life-saving intervention) changing management for no patients may be the best strategy. These two alternatives represent the default states in decision curve analysis.
To express this tradeoff in a single metric, the net benefit provides a common language for determining the impact of decisions. The net benefit is a weighted sum of true positives and false positives. As seen above, the relative value of true positives to false positives depends on the proposed management change. The relative value also depends on the individual clinician and patient. When developing predictive models, it is impossible to know individual preferences or to incorporate all possible management changes. As such, a decision curve analysis calculates the expected net benefit of the model over the full-range of predicted probabilities [15, 38, 48]. At a minimum, clinicians should determine whether the clinical prediction models they plan to use for management changes offer greater net benefit than the two default options outlined above (treating all patients or treating no patients). Clinicians can determine this by examining the decision curve analysis plots for a proposed clinical prediction model (Fig. 3). For example, they might consider a management change such as sending visiting nurses to patient homes after surgery to prevent readmission. Hospital resources are limited and the true positive of correctly identifying and preventing readmission is likely worth more than the false positive of incorrectly identifying a patient who would not have been readmitted and thus incorrectly using nursing resources for that patient. One might determine that the value of sending nursing resources and preventing readmission is four times as valuable as incorrectly sending nursing resources to a patient who would not have had a readmission regardless of the nursing resources. This represents a cost-to-benefit ratio (relative weight) of 1:4 (correctly preventing readmission is worth four times as much as incorrectly sending nursing resources). The equation that relates threshold probabilities to relative weights is:
Fig. 3.
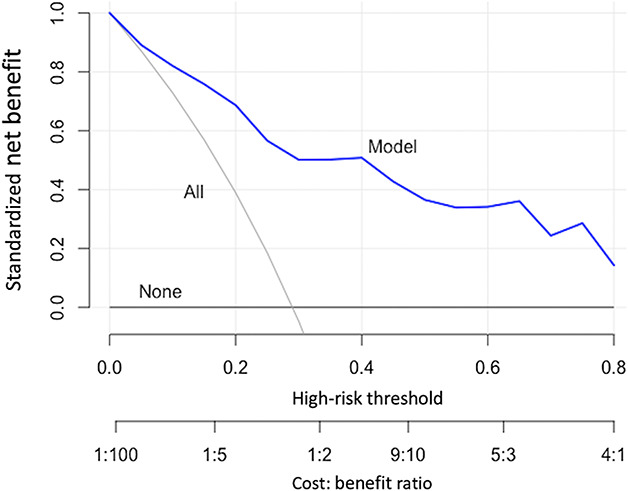
An example of decision curve analysis is shown here.
Therefore, a cost-to-benefit ratio of 1:4 represents a threshold probability of 0.20. In other words, 0.20 divided by (1 minus 0.20) results in relative weight of 1:4. The threshold probability refers to the level above which one would change treatment. One should use decision curves with a specific threshold range in mind. In this case, clinicians can determine whether the model they are using offers any utility by selecting 0.20 on the x-axis of the decision curve and examining which strategy results in the greatest net benefit. If the clinical prediction model results in less net benefit than the default strategies (changing management for all patients or none) at that threshold, clinicians are better off without the model.
If the Study Uses Machine Learning or Artificial Intelligence, What Additional Factors Should I Demand?
Model explanations should be required for machine learning algorithms. Unlike regression modeling, machine learning algorithms do not provide relative risk or odds ratios for individual variables that constitute the overall prediction model. Machine learning algorithms often appear to clinicians as a “black box” [32]. Some even have suggested that these algorithms are reported to be too complex for simplification into transparent and interpretable models [25]. In fact, an inspection of the process by which machine learning algorithms make predictions can increase accountability for these algorithms [3]. At the overall study population level, global variable importance plots can show which variables are used by machine learning algorithms for predicting outcomes and they can show the relative importance of each variable (Fig. 4) [18, 23, 24, 34, 40]. At the individual-patient level, local explanations can show which specific variables increased or decreased the estimated likelihood of the outcome and how much each factor contributed to the overall prediction (Fig. 5) [24, 31, 32]. Furthermore, to explain the impact of individual variables, explanation plots can be created that show how the model predictions change over the full range of the input variables (Fig. 6) [16, 17]. Inspecting explanation plots allows clinicians to determine the reliability of machine learning predictions and to intervene in factors that may be modifiable. Furthermore, inspecting explanations of the model predictions allows clinicians to determine whether these algorithms are overfitting and memorizing the data available as opposed to learning generalizable patterns. If the algorithms ignore well-established predictors of the primary outcome but index heavily on other factors that may be idiosyncratic to the population used for developing the model, clinicians should be wary of the potential for generalizability of these models on external validation.
Fig. 4.
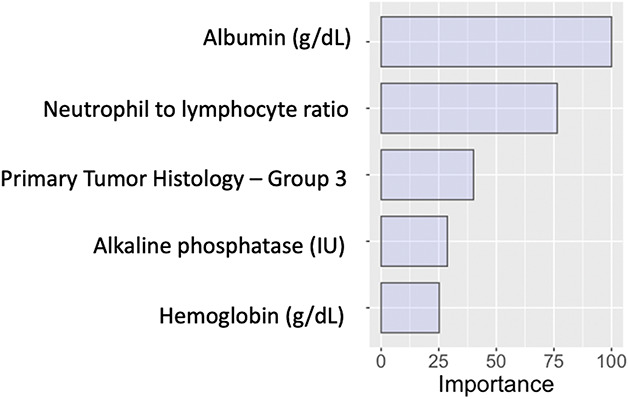
This figure provides an example of global relative variable importance plot.
Fig. 5.
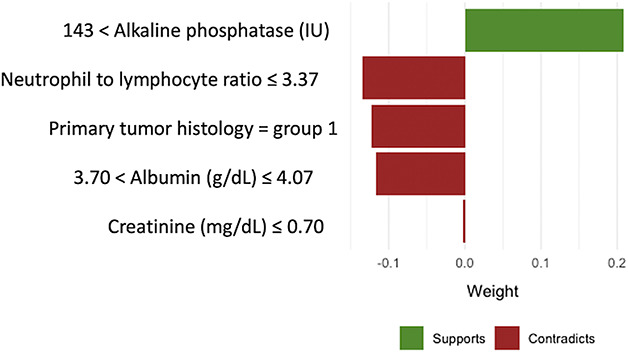
An example of local variable importance plot for individual patient-level explanation is offered here.
Fig. 6.

This figure shows an example of a partial dependence plot.
Is There a Usable Tool Included in the Manuscript?
Clinical prediction models (including machine learning algorithms) should be accessible to clinicians. Regression models are reported as odds ratios, risk scores, or nomograms. These can be used by clinicians directly from published studies. However, machine learning algorithms cannot be reported in this way, and as such, have no clinical utility from a published study alone. These models must be deployed as freely accessible digital applications for clinicians to be able to use the algorithms in practice [20, 42]. By including access to the digital application as part of a published study, the developers of machine learning algorithms are required to meet at least the minimum standards for usability achieved by the developers of regression models. In addition, model predictions are the most helpful when provided with model explanations. Creating freely accessible tools that provide both predictions and local explanations for complex modeling strategies should be minimal standards for publishing machine learning-based clinical predictions models.
Knowledge Gaps and Unsupported Practices
The model performance assessments described above may not be sufficient for detecting uninformative or harmful algorithms [33]. Recent work has shown that models derived from measures of retrospective resource use may discriminate against minorities [29]. There are very few randomized prospective trials that compare the real-world impact of decisions made based on algorithms with the default state of no algorithms [28, 30, 33].
If model performance is only demonstrated on populations similar to the developmental cohort, the generalizability of the clinical prediction models for other populations remains to be proven [11, 14, 35]. Models that show excellent performance on internal validation may be overfit to the available data and experience significant performance degradation when externally validated [35]. Furthermore, even with internal validation, if model performance is only shown on the same population used to train the model without evaluation in an independent testing set, there is insufficient evidence to support the model generalizability, and there is potential for overfitting. Studies that develop clinical prediction models (traditional or machine learning) may neglect to report how much missing data were present in the population and how the missing data were handled. A complete case analysis often introduces bias and multiple imputation is preferred [2, 19].
Clinicians should critically examine the baseline characteristics of the study population. Studies using populations with data that were not collected for studying the specific outcome of interest may lack variables previously established as risk factors for that outcome. Clinicians should be wary of clinical prediction models that have not considered variables that have a clearly established association with the primary outcome. Attention has previously been drawn to the problems of sparse data and readers should be skeptical of sparse data in clinical prediction models as well.[21]
For simplification, in this article, we focused on binary outcomes when discussing clinical prediction models. However, these principles directly translate to models seeking to predict multicategory variables and continuous variables. The specific measures used in these contexts are extensions of the measures discussed here and include multiclass metrics for discrimination and calibration, among others [22, 45-47].
Barriers and How to Overcome Them
Several authors have called for increased oversight and standardized of predictive models [10, 26, 33]. The Transparent Reporting of a Multivariable Prediction Model for Individual Prognosis or Diagnosis-Machine Learning (TRIPOD-ML) guidelines were recently proposed [10] and will further help guide the future of this field. In the interim, to give clinicians an informal checklist for determining the reliability of clinical prediction models, we suggest the following questions:
Will the Predictions of this Model Reflect the Actual Outcomes of my Patients?
Does the study correctly report the type of validation (internal or external) used? Was the model performance demonstrated in an independent population not used to derive the model? Do baseline variables collected for the population reflect those in existing studies? Were missing data reported and appropriately managed? Was a calibration plot provided? Is my patient population similar to the those on which the model was built? Is there evidence of sparse-data bias?
Does Having a Model for This Outcome Add Any New Information for Clinical Decision-making, and if so, How Much?
Are measures of model performance other than accuracy and the AUC reported? What is the null-model Brier score for this outcome and was it reported? Was the final model Brier score less than the null-model Brier score? Was a decision curve analysis provided?
If the Study Uses Machine Learning or Artificial Intelligence, What Additional Factors Should I Demand?
If machine learning was used, were global (that is, overall study patient population-level) explanations provided? If machine learning was used, were local (such as, individual patient-level) explanations provided? In the absence of understanding the critical determinants of an ML-generated model, it would not be advisable for a clinician to depend on its recommendations.
Is There a Usable Tool Included in the Manuscript?
If conventional predictive modeling, was a risk score or nomogram provided? If machine learning was used, was a usable tool such as an accessible digital application provided? Does the usable tool offer both individual patient-level predictions and explanations?
5-year Forecast
We speculate that the rising popularity of predictive modeling will require clinicians to become more sophisticated users of these technologies. Ongoing efforts to create new standards will lead to improvements in the reporting and clinical utility of artificial intelligence models. Digital transformation of patient-physician interactions will lead to the incorporation of predictive algorithms as automated decision aids in the clinical workflow. Ongoing skepticism in the development of new algorithms and vigilance in assessing existing algorithms will be required to realize the full potential of Codman’s End Results idea.
Footnotes
Each author certifies that neither he, nor any members of his immediate family, have any commercial associations (such as consultancies, stock ownership, equity interest, patent/licensing arrangements, etc) that might pose a conflict of interest in connection with the submitted article.
All ICMJE Conflict of Interest Forms for authors and Clinical Orthopaedics and Related Research® editors and board members are on file with the publication and can be viewed on request.
The opinions expressed are those of the writers, and do not reflect the opinion or policy of CORR® or The Association of Bone and Joint Surgeons®.
This work was performed at the Department of Orthopedic Surgery, Massachusetts General Hospital, Harvard Medical School, Boston, MA, USA.
References
- 1.Alba AC, Agoritsas T, Walsh M, Hanna S, Iorio A, Devereaux P, McGinn T, Guyatt G. Discrimination and calibration of clinical prediction models: users’ guides to the medical literature. JAMA. 2017;318:1377-1384. [DOI] [PubMed] [Google Scholar]
- 2.Ambler G, Omar RZ, Royston P. A comparison of imputation techniques for handling missing predictor values in a risk model with a binary outcome. Stat Methods Med Res. 2007;16:277-298. [DOI] [PubMed] [Google Scholar]
- 3.Bellazzi R, Zupan B. Predictive data mining in clinical medicine: current issues and guidelines. Int J Med Inform. 2008;77:81-97. [DOI] [PubMed] [Google Scholar]
- 4.Bouwmeester W, Zuithoff NP, Mallett S, Geerlings MI, Vergouwe Y, Steyerberg EW, Altman DG, Moons KG. Reporting and methods in clinical prediction research: a systematic review. PLoS Med. 2012;9. [DOI] [PMC free article] [PubMed] [Google Scholar]
- 5.Brand RA. Ernest amory codman, MD, 1869–1940. Clin Orthop Relat Res. 2009;467:2763. [DOI] [PMC free article] [PubMed] [Google Scholar]
- 6.Brier GW. Verification of forecasts expressed in terms of probability. Mon Weather Rev. 1950;78:1-3. [Google Scholar]
- 7.Carter JV, Pan J, Rai SN, Galandiuk S. ROC-ing along: Evaluation and interpretation of receiver operating characteristic curves. Surgery. 2016;159:1638-1645. [DOI] [PubMed] [Google Scholar]
- 8.Cohen IG, Amarasingham R, Shah A, Xie B, Lo B. The legal and ethical concerns that arise from using complex predictive analytics in health care. Health Aff. 2014;33:1139-1147. [DOI] [PubMed] [Google Scholar]
- 9.Collins GS, de Groot JA, Dutton S, Omar O, Shanyinde M, Tajar A, Voysey M, Wharton R, Yu L-M, Moons KG. External validation of multivariable prediction models: a systematic review of methodological conduct and reporting. BMC Med Res Methodol. 2014;14:40. [DOI] [PMC free article] [PubMed] [Google Scholar]
- 10.Collins GS, Moons KG. Reporting of artificial intelligence prediction models. Lancet. 2019;393:1577-1579. [DOI] [PubMed] [Google Scholar]
- 11.Collins GS, Ogundimu EO, Altman DG. Sample size considerations for the external validation of a multivariable prognostic model: a resampling study. Stat Med. 2016;35:214-226. [DOI] [PMC free article] [PubMed] [Google Scholar]
- 12.Cook NR. Use and misuse of the receiver operating characteristic curve in risk prediction. Circulation. 2007;115:928-935. [DOI] [PubMed] [Google Scholar]
- 13.Cook NR. Statistical evaluation of prognostic versus diagnostic models: beyond the ROC curve. Clin Chem. 2008;54:17-23. [DOI] [PubMed] [Google Scholar]
- 14.Debray TP, Vergouwe Y, Koffijberg H, Nieboer D, Steyerberg EW, Moons KG. A new framework to enhance the interpretation of external validation studies of clinical prediction models. J Clin Epidemiol. 2015;68:279-289. [DOI] [PubMed] [Google Scholar]
- 15.Fitzgerald M, Saville BR, Lewis RJ. Decision curve analysis. JAMA. 2015;313:409-410. [DOI] [PubMed] [Google Scholar]
- 16.Friedman JH. Greedy function approximation: a gradient boosting machine. Ann Stat. 2001:1189-1232. [Google Scholar]
- 17.Greenwell BM. pdp: An R package for constructing partial dependence plots. R J. 2017;9:421-436. [Google Scholar]
- 18.Greenwell BM, Boehmke BC, McCarthy AJ. A simple and effective model-based variable importance measure. 2018. Available at: https://arxiv.org/pdf/1805.04755.pdf. Accessed 05/26.
- 19.Janssen KJ, Vergouwe Y, Donders ART, Harrell FE, Jr, Chen Q, Grobbee DE, Moons KG. Dealing with missing predictor values when applying clinical prediction models. Clin Chem. 2009;55:994-1001. [DOI] [PubMed] [Google Scholar]
- 20.Karhade AV, Thio QC, Ogink PT, Shah AA, Bono CM, Oh KS, Saylor PJ, Schoenfeld AJ, Shin JH, Harris MB. Development of machine learning algorithms for prediction of 30-day mortality after surgery for spinal metastasis. Neurosurgery. 2019;85:E83-E91. [DOI] [PubMed] [Google Scholar]
- 21.Leopold SS, Porcher R. Sparse-data Bias—What the Savvy Reader Needs to Know. Clin Orthop Relat Res. 2018;476:657. [DOI] [PMC free article] [PubMed] [Google Scholar]
- 22.Li J, Gao M, D'Agostino R. Evaluating classification accuracy for modern learning approaches. Stat Med. 2019;38:2477-2503. [DOI] [PubMed] [Google Scholar]
- 23.Lundberg SM, Erion G, Chen H, DeGrave A, Prutkin JM, Nair B, Katz R, Himmelfarb J, Bansal N, Lee S-I. Explainable ai for trees: From local explanations to global understanding. 2019. arxiv.org. Available at: https://arxiv.org/pdf/1905.04610.pdf. Accessed 05/26. [DOI] [PMC free article] [PubMed] [Google Scholar]
- 24.Lundberg SM, Lee S-I. A unified approach to interpreting model predictions. In: Advances in neural information processing systems . 2017:4765-4774. [Google Scholar]
- 25.Lundberg SM, Nair B, Vavilala MS, Horibe M, Eisses MJ, Adams T, Liston DE, Low DK-W, Newman S-F, Kim J. Explainable machine-learning predictions for the prevention of hypoxaemia during surgery. Nat Biomed Eng. 2018;2:749-760. [DOI] [PMC free article] [PubMed] [Google Scholar]
- 26.Luo W, Phung D, Tran T, Gupta S, Rana S, Karmakar C, Shilton A, Yearwood J, Dimitrova N, Ho TB. Guidelines for developing and reporting machine learning predictive models in biomedical research: a multidisciplinary view. J Med Internet Res. 2016;18:e323. [DOI] [PMC free article] [PubMed] [Google Scholar]
- 27.Moons KG, Altman DG, Reitsma JB, Ioannidis JP, Macaskill P, Steyerberg EW, Vickers AJ, Ransohoff DF, Collins GS. Transparent Reporting of a multivariable prediction model for Individual Prognosis or Diagnosis (TRIPOD): explanation and elaboration. Ann Intern Med. 2015;162:W1-W73. [DOI] [PubMed] [Google Scholar]
- 28.Moons KG, Kengne AP, Grobbee DE, Royston P, Vergouwe Y, Altman DG, Woodward M. Risk prediction models: II. External validation, model updating, and impact assessment. Heart. 2012;98:691-698. [DOI] [PubMed] [Google Scholar]
- 29.Obermeyer Z, Powers B, Vogeli C, Mullainathan S. Dissecting racial bias in an algorithm used to manage the health of populations. Science. 2019;366:447-453. [DOI] [PubMed] [Google Scholar]
- 30.Poldervaart JM, Reitsma JB, Backus BE, Koffijberg H, Veldkamp RF, Monique E, Appelman Y, Mannaerts HF, van Dantzig J-M, Van Den Heuvel M. Effect of using the HEART score in patients with chest pain in the emergency department: a stepped-wedge, cluster randomized trial. Ann Intern Med. 2017;166:689-697. [DOI] [PubMed] [Google Scholar]
- 31.Ribeiro MT, Singh S, Guestrin C. Model-agnostic interpretability of machine learning. 2016. arxiv.org. Available at: https://arxiv.org/pdf/1606.05386.pdf. Accessed 05/26. [Google Scholar]
- 32.Ribeiro MT, Singh S, Guestrin C. " Why should i trust you?" Explaining the predictions of any classifier. In: Proceedings of the 22nd ACM SIGKDD international conference on knowledge discovery and data mining . 2016:1135-1144. [Google Scholar]
- 33.Shah ND, Steyerberg EW, Kent DM. Big data and predictive analytics: recalibrating expectations. JAMA. 2018;320:27-28. [DOI] [PubMed] [Google Scholar]
- 34.Shapley LS. A value for n-person games. Contributions to the Theory of Games. 1953;2:307-317. [Google Scholar]
- 35.Siontis GC, Tzoulaki I, Castaldi PJ, Ioannidis JP. External validation of new risk prediction models is infrequent and reveals worse prognostic discrimination. J Clin Epidemiol. 2015;68:25-34. [DOI] [PubMed] [Google Scholar]
- 36.Steyerberg EW. Clinical prediction models . Cham, Switzerland: Springer; 2019. [Google Scholar]
- 37.Steyerberg EW, Vergouwe Y. Towards better clinical prediction models: seven steps for development and an ABCD for validation. Eur Heart J. 2014;35:1925-1931. [DOI] [PMC free article] [PubMed] [Google Scholar]
- 38.Steyerberg EW, Vickers AJ. Decision curve analysis: a discussion. Medical Decision Making. 2008;28:146-149. [DOI] [PMC free article] [PubMed] [Google Scholar]
- 39.Steyerberg EW, Vickers AJ, Cook NR, Gerds T, Gonen M, Obuchowski N, Pencina MJ, Kattan MW. Assessing the performance of prediction models: a framework for some traditional and novel measures. Epidemiology. 2010;21:128. [DOI] [PMC free article] [PubMed] [Google Scholar]
- 40.Štrumbelj E, Kononenko I. Explaining prediction models and individual predictions with feature contributions. Knowl Inf Syst. 2014;41:647-665. [Google Scholar]
- 41.Thio Q, Karhade AV, BJJ Bindels, Ogink PT, Bramer JAM, Ferrone ML, Calderón SL, Raskin KA, Schwab JH. Development and Internal Validation of Machine Learning Algorithms for Preoperative Survival Prediction of Extremity Metastatic Disease. Clin Orthop Relat Res. 2020;478:322-333. [DOI] [PMC free article] [PubMed] [Google Scholar]
- 42.Thio QC, Karhade AV, Ogink PT, Raskin KA, Bernstein KDA, Calderon SAL, Schwab JH. Can machine-learning techniques be used for 5-year survival prediction of patients with chondrosarcoma? Clin Orthop Relat Res. 2018;476:2040. [DOI] [PMC free article] [PubMed] [Google Scholar]
- 43.Topol EJ. High-performance medicine: the convergence of human and artificial intelligence. Nat Med. 2019;25:44-56. [DOI] [PubMed] [Google Scholar]
- 44.Van Calster B, McLernon DJ, van Smeden M, Wynants L, Steyerberg EW. Calibration: the Achilles heel of predictive analytics. BMC Med. 2019;17:1-7. [DOI] [PMC free article] [PubMed] [Google Scholar]
- 45.Van Calster B, Van Belle V, Vergouwe Y, Timmerman D, Van Huffel S, Steyerberg EW. Extending the c‐statistic to nominal polytomous outcomes: the Polytomous Discrimination Index. Stat Med. 2012;31:2610-2626. [DOI] [PubMed] [Google Scholar]
- 46.Van Calster B, Vergouwe Y, Looman CW, Van Belle V, Timmerman D, Steyerberg EW. Assessing the discriminative ability of risk models for more than two outcome categories. Eur J Epidemiol. 2012;27:761-770. [DOI] [PubMed] [Google Scholar]
- 47.Van Hoorde K, Van Huffel S, Timmerman D, Bourne T, Van Calster B. A spline-based tool to assess and visualize the calibration of multiclass risk predictions. J Biomed Inform. 2015;54:283-293. [DOI] [PubMed] [Google Scholar]
- 48.Vickers AJ, Elkin EB. Decision curve analysis: a novel method for evaluating prediction models. Medical Decision Making. 2006;26:565-574. [DOI] [PMC free article] [PubMed] [Google Scholar]


